


Languages
Pages
Legal


Colmar Brunton 2012 1
July 2013

Colmar Brunton 2012 2Colmar Brunton 2012 2
Background and objectives
The Ministry of Civil Defence and Emergency Management needs to shift people’s level of preparedness for disasters.
The Get Ready Get Thru social marketing campaign began in June 2006 and has now been running for seven years.
This survey builds upon a previous 2006 pre-campaign benchmark survey, and six annual tracking surveys conducted from 2007 to 2012. All surveys are carried out in April and May each year, with the exception of the 2011 survey which was delayed by four weeks due to the February 2011 Christchurch earthquake.
To measure New Zealand residents’ disaster preparedness, and to assess the effectiveness of the campaign over time.

Colmar Brunton 2012 3© Colmar Brunton 2011 3
How the survey was carried out
Random telephone interviewing of New Zealand residents aged 15 years and over. In total 1,263 interviews were carried out from 16 April to 23 May 2013.
The methodology is very similar to that used in the benchmark and the previous annual measures, with the exception that additional interviews were carried out from 2011 onwards to allow more robust regional analyses.
The maximum margin of error is +/- 3.0 percentage points at the 95% confidence level (for a stratified random sample).
The overall results have been weighted to 2006 Census figures to adjust for the fact that some regions were ‘oversampled’, and to align the data with Census counts for age and gender.
All differences cited in this report are statistically significant at the 95% confidence level.

© Colmar Brunton 2011 4
Executive summary
Are fully prepared: 17%
Seventeen percent of all New Zealand residents are fully prepared for an emergency. Being fully
prepared means having an emergency survival plan that includes what to do when away from
home, having emergency survival items and water, and regularly updating these items. This level of
preparedness is in line with results from the past two years.
As we’ve seen before, the level of preparedness differs by region – those living in Wellington or Canterbury are more
likely than average to be fully prepared, whilst those living in Auckland are less likely.
The main barriers to preparedness continue to be low motivation (30%), perceived likelihood of a disaster being low
(27%), complacency (20%), and cost (16%).
Are prepared at home: 32%
Nearly a third of all New Zealand
residents are prepared at home for an
emergency, which is the same result
as in both waves post the Canterbury
quake.
Being prepared at home means having an
emergency survival plan, having emergency
survival items and water, and regularly
updating these items.
Have emergency survival items: 85%
Significantly more New Zealand
residents compared to last year (81%)
have necessary emergency items
needed to survive a disaster, e.g.,
tinned food etc.
Younger people, especially those aged under
30 years, are less likely to have emergency
survival items (74% compared to 88% for those
aged 30 and over).
Have survival plan for at home: 58%
Nearly six in ten New Zealand residents
have an emergency survival plan for
their household, which is slightly lower
than in the past two years (2011: 63%,
2012: 60%).
Younger people aged under 30 years (41%),
those recently moved to NZ in the past five years
(39%), people that identify themselves as either
Asian (40%) or Pacific Island (30%), are all less
likely to have an emergency plan than the
general population.

© Colmar Brunton 2011 5
Executive summary
Awareness of the advertising: 68%
Prompted awareness of the Get
Ready Get Thru TV advertising has
been maintained at 68% (2012: 69%)
Advertising diagnostics:
The advertising continues to be well
received, with very low ad wear out (only
6% of those aware of the advertising
strongly agree they are getting fed up
with seeing them).
The vast majority of those who have seen
the ads say they understood the message,
the points made were believable and
relevant, the information provided was
helpful, and they enjoyed watching them.
Aware of ShakeOut: 65%
Public awareness of ShakeOut is
high, with nearly two thirds having
heard of the event which took place
in September last year.
Furthermore, nearly three in ten
(29%) New Zealand residents took
part in the event, and of those
aware over six in ten (62%) say it
helped them feel more prepared for
an earthquake.
Taken action or thought about taking action as a result of seeing the ads: 82%Although slightly down on last year, the advertising campaign continues to be highly effective, with most people who have seen the ads having done something or thought about doing something as a result (82% this year compared with 2012: 88%, 2011: 81%).
Actually taking action because of the ad has also fallen slightly since 2012, with around seven in ten people (71% compared to 75% last year) who have seen the ads actually going beyond thinking to preparing. They’ve taken at least one of the following actions as a result:
talked to family/friends (53%, down from 58% last year)
made a survival kit (44%, down from 50%)
made a survival plan (34%, down from 41%),
visited the Get Ready Get Thru website (17%, up from 14%)
or visited other disaster preparation websites (9%).
Awareness of the Get Ready Get Thru
tag line: 57%
Prompted awareness of the tag line is
in line with last year (2012: 59%), with
repetitive use building familiarity.
These decreases suggest to us that the sense of public urgency following the Canterbury earthquakes is dissipating.

Colmar Brunton 2012 6

Colmar Brunton 2012 7© Colmar Brunton 2011 7
Before interpreting research results it is useful to consider the context, or events that occurred, prior to fieldwork (16 April to 23 May 2013).
Putting the survey into context…
Factors that may have influenced the results include:
Flooding in South Africa (January)
Flooding in Mozambique (January)
Wildfires in Australia (New South Wales, Victoria, Tasmania) (January and February)
Heavy snowfalls and snowstorms in America (February and March)
Flooding in Queensland and New South Wales, Australia (February)
Landslide in Tibet traps gold miners (March)
Fires in Burma (Myanmar) and Thailand (March)
Flooding in the US Midwest (April)
Landslide in Tanzania (April)
Flooding in Argentina (April)
Flooding in Kenya (April)
Earthquake in Iran / Pakistan (April)
Earthquake in Western Sichuan, China (April)
Flooding in Nelson (April)
Flooding in Saudi Arabia (May)
Heavy rain causing landslides in Myanmar (May)
Tornado and severe thunderstorms in Oklahoma and other Midwest states (May)
Storms and flooding in Southern China (May)
Tropical Cyclone Mahasen over Bangladesh, Myanmar, and India (May)

Colmar Brunton 2012 8
Nearly all residents are aware that earthquakes can occur in New Zealand.
Q1 First I’d like to ask about the types of major disasters that could happen in New Zealand. What types of disasters can you think of that could happen in New Zealand in your lifetime? Base: All Respondents: Benchmark (n= 1001), 2007 (n= 1000), 2008 (n= 1016), 2009 (n=1000), 2010 (n=1000), 2011 (n=1164), 2012 (n=1255), 2013 (n=1263). Note: Only the top six disasters for 2012 are shown.
Possible disasters in New Zealand in your lifetime
Residents of different regions more likely than average to mention:
•Auckland: Volcanic eruption (65%)•Canterbury: Tsunami (81%)•Waikato: Drought (10%)•Hawkes Bay: Tsunami (90%)•Nelson/Marlborough: Flood (72%), Fire (39%)•Taranaki: Volcanic eruption (72%)
Significantly different from the 2011 result

Colmar Brunton 2012 9
There appears to be a gradual year on year decline since 2011 in the number of people who’ve taken steps to prepare for disaster in the last 12 months.
Q11a: In the last 12 months, have you taken any steps to prepare yourself or your household for a disaster? Base: All Respondents, 2009 (n = 1000), 2010 (n=1000), 2011 (n=1164), 2012 (n=1255), 2013 (n=1263)
Just over half (52%) of those living in New Zealand have taken steps to prepare in the last 12 months. Although this result remains higher than pre-2011 before the Christchurch earthquakes struck, it is significantly lower than last year and follows a downward trend.
Those more likely to have taken steps to prepare for disaster in the last 12 months are:•Aged 40 – 49 years (59%)•Are self employed (59%)Those less likely to have taken steps to prepare for disaster in the last 12 months are:•Identify as Asian (34%) or Pacific Island (31%)•Are studying full time (28%).
Taken steps to prepare for disaster in the last 12 months
Significantly different from the 2012 result

Colmar Brunton 2012 10
Taken steps to prepare in the last 12 months: Regional differences
Higher than average
Average
Below Average
Wellington
68%Wellington
68%
Average
51%Average
51%
Note: Percentages are presented that are statistically higher or lower than the national average at the 95% confidence level.
Canterbury
69%Canterbury
69%
Similar to last year, a higher than average proportion of Wellington, Canterbury, and West Coast residents have
taken steps to prepare in the last 12 months. This year a
higher proportion of Nelson and Marlborough residents
have also taken steps to prepare, perhaps due to
recent flooding in the region. A lower than
average proportion of Auckland residents have taken steps to prepare.
West Coast
63%West Coast
63%
Auckland
40%Auckland
40%
Nelson/Marlboroug h
63%
Nelson/Marlboroug h
63%

Colmar Brunton 2012 11
The Christchurch earthquakes remain the main prompt to prepare for a disaster, with over half of people mentioning them.
Disasters that occurred in
New Zealand
Disasters that occurred overseas
Advertising I saw / heard
/ read
News / article in
the media
Friends or family
Something I have always
done
My work/job/ training makes
me aware
Just want to be prepared
Common sense/ sensible thing to
do
Checking / restocking
Q11b: What prompted you to do this? Base: Those who have taken steps towards preparing for a disaster in the last 12 months, 2009 (n = 422), 2010 (n = 465), 2011 (n = 726), 2012 (n=731), 2013 (n=662). Note: The top twelve responses for 2013 are shown.
What prompted you to prepare?
Significantly different from the 2012 result
Info child(ren) bought home
from school
Info got at school
53% of those who had taken steps towards
preparing for a disaster specifically said it was
because of the Christchurch earthquakes
(76% of Christchurch residents said this).

Colmar Brunton 2012 12

Colmar Brunton 2012 13
How prepared is New Zealand?
FULLY PREPARED = 17%•16% – 2012 measure•18% – 2011 measure•11% – 2010 measure•10% – 2009 measure•10% – 2008 measure•8% – 2007 measure•7% – Benchmark
Have an emergency
survival plan that includes what to do when not at
home
Have emergency items and water
Regularly update emergency
survival items

Colmar Brunton 2012 14
Fully prepared: Regional differences
Higher than average
Average
Below Average
Auckland
11%Auckland
11%
Wellington
32% Wellington
32%
Average
17%Average
17%
Note: Percentages are presented that are statistically higher or lower than the national average at the 95% confidence level.
Canterbury
26%Canterbury
26%
A higher than average proportion of Wellington and Canterbury residents are fully
prepared. A lower than average proportion of
Auckland residents are fully prepared.

Colmar Brunton 2012 15
How prepared is New Zealand (when at home)?
PREPARED AT HOME = 32% •32% – 2012 measure •32% – 2011 measure•24% – 2010 measure•23% – 2009 measure•26% – 2008 measure•24% – 2007 measure•21% – Benchmark
Have an emergency survival plan
Have emergency items and water
Regularly update emergency
survival items

Colmar Brunton 2012 16
Prepared at home: Regional differences
Higher than average
Average
Below Average
Auckland
23%Auckland
23%
Canterbury
40%Canterbury
40%
Average
32%Average
32%
Note: Percentages are presented that are statistically higher or lower than the national average at the 95% confidence level.
Wellington and Canterbury residents are more likely than
average to be prepared at home. Auckland residents are less likely than average to be prepared at
home.
Wellington region
47%
Wellington region
47%

Colmar Brunton 2012 17
You have good understanding of types of disasters that could
occur in NZ & the chances of them occurring
You have the necessary emergency items needed
to survive a disaster, e.g. tinned food etc
You have a good understanding of effects if
disaster struck your area
You are familiar with the Civil Defence info in the
Yellow Pages
You regularly update your emergency survival
items
You have an emergency survival
plan for your household
You have stored 3L water pp for 3 days for
household
You attend meetings with community groups about
disaster planning
None of these
In general, levels have increased this year to be similar to 2011. Over eight in
ten New Zealanders agree they’ve got a good understanding of effects if disaster struck locally, they have the necessary
disaster supplies, and they’re aware of
the type and likelihood of different
disasters in NZ.
Q10 Which of the following statements apply to you? Base: All Respondents: Benchmark (n= 1001), 2007 (n= 1000), 2008 (n= 1016), 2009 (n=1000), 2010 (n=1000), 2011 (n=1164), 2012 (n=1255), 2013 (n=1263).
Significantly different from the 2012 result

Colmar Brunton 2012 18
Eighty-five percent of New Zealanders have emergency survival items.
Q10. You have necessary emergency items needed to survive a disaster, e.g. tinned food etcBase: All Respondents: Benchmark (n= 1001), 2007 (n= 1000), 2008 (n= 1016), 2009 (n=1000), 2010 (n=1000), 2011 (n=1164), 2012 (n=1255), 2013 (n=1263).
The national result (85%) has increased this year to be similar to the 2011 result.
Younger people, especially those aged 15 to 29 years are less likely to have emergency survival items (74%, compared to 88% for those aged 30 and over).
Significantly different from the 2012 result

Colmar Brunton 2012 19
Higher than average
Average
Below AverageAuckland
79%Auckland
79%
West Coast
96%West Coast
96%
Average
85%Average
85%
Note: Percentages are presented that are statistically higher or lower than the national average at the 95% confidence level.
Emergency survival items: Regional differences
A higher than average proportion of Northland, West
Coast, and Canterbury residents have emergency survival items. A lower than
average proportion of Auckland residents have emergency survival items.
Northland
94%Northland
94%
Canterbury
91%Canterbury
91%

Colmar Brunton 2012 20
Over one quarter of New Zealand residents (27%) have a plan that includes what to do when away from home.
Q11 Does your survival plan include what to do when you are not at home? Base: All Respondents: Benchmark (n= 1001), 2007 (n= 1000), 2008 (n= 1016), 2009 (n=1000), 2010 (n=1000), 2011 (n=1164), 2012 (n=1255), 2013 (n=1263).
*Percentages do not add to 100% due to rounding
This figure (27%) remains significantly higher than in 2010, before the Christchurch earthquakes struck. Those who have been in New Zealand for five years or less are less likely to have a plan that includes what to do when away from home (12%, compared with 28% for those who’ve resided in New Zealand longer).
Younger people aged under 30 years (41%), those recently moved to NZ in the past five years (39%), and people that identify themselves as either Asian (40%) or Pacific Island (30%), are all less than average (58%) to have an emergency plan for home.

Colmar Brunton 2012 21
Having a survival plan for when at home: Regional differences
Higher than average
Average
Below Average
Average
58%Average
58%
Note: Percentages are presented that are statistically higher or lower than the national average at the 95% confidence level.
A higher than average proportion of Wellington
and Canterbury residents have a plan in place when
at home. A lower than average proportion of
Auckland residents have a plan in place.
Canterbury
69%Canterbury
69%
Wellington
76%Wellington
76%
Auckland
46%Auckland
46%

Colmar Brunton 2012 22
Southland
12%Southland
12%
Having a survival plan for when away from home: Regional differences
Higher than average
Average
Below Average
Auckland
20%Auckland
20%
Average
27%Average
27%
Wellington
49%Wellington
49%
Note: Percentages are presented that are statistically higher or lower than the national average at the 95% confidence level.
Canterbury
39%Canterbury
39%
A higher than average proportion of Wellington and Canterbury residents have a
plan in place for when they are not at home. A lower than
average proportion of Auckland and Southland
residents have a plan in place for when they are not at home.

© Colmar Brunton 2011 23
Preparedness continuum.
Bench- mark
17 %
83 %
77 %
39 %
7%
2007
18 %
82 %
81 %
41 %
8%
2008
18 %
82 %
79 %
43 %
10 %
2009
19 %
81 %
80 %
41 %
10 %
2010
21 %
79 %
80 %
43 %
11 %
2011
18 %
82 %
84 %
49 %
18 %
2012
22 %
78 %
81 %
48 %
16 %
AwarenessHave an understanding of the types of
disasters that could occur
UnderstandingHave a good understanding of the
effects if disaster struck
CommitmentHave water and survival items
Unaware
Fully prepared
17%
52%
83%
81%
19%
2013
Significantly different from the 2012 result

Colmar Brunton 2012 24

Colmar Brunton 2012 25
There is a slight increase in the proportion saying they don’t expect a disaster to happen or are generally unconcerned, but overall the main reasons are in line with last year.
Q6. You said that being prepared for a disaster is important, but you are not well prepared for one. What stops you from being prepared? Base: Those who stated that being very well/ quite well prepared for a disaster was important but said that they were not well prepared for one: Benchmark (n=341), 2007 (n=387), 2008 (n=398), 2009 (n=431), 2010 (n=417), 2011 (n=383), 2012 (n=427), 2013 (n=432). Note: The top ten reasons are shown. *Less than .5%

Colmar Brunton 2012 26
Most at risk when disaster strikes…Young people, aged 15 to 29 years:Less likely to be committed (35%), and to have understanding (71%) or awareness (66%).More likely to be unaware (34%).
Auckland residents: Less likely to be fully prepared (11%), or committed (41%) and to have awareness (74%).More likely to be unaware (26%).
Those who have lived in New Zealand for ten years or less:Less likely to be committed (41%).
Younger people, aged 30 to 39 years:Less likely to be committed (41%).
Those who identify as Asian:Less likely to be committed (28%), and to have understanding (72%), or awareness (61%).More likely to be unaware (39%).

Colmar Brunton 2012 27

Colmar Brunton 2012 28
Recall is lower amongst: •Those aged 60 plus (54%) •Identify as Asian (39%) •Have lived in New Zealand for ten years or less (44%)
Recall is lower amongst:•Those aged 60 plus (54%)•Identify as Asian (39%) •Have lived in New Zealand for ten years or less (44%)
Prompted recognition: nearly seven in ten New Zealand residents specifically recall the Get Ready Get Thru television advertising.
Annua
l rateca
rdvalue ($ m
illion)*
Q18. Have you seen any television advertisements for Civil Defence presented by Peter Elliot? The ads featured emergency services, public transport, and hospitals. The ads show what services may not be there to help you in an emergency and what you need to do to help you survive a disaster. Peter also directs us to the Yellow Pages for further information as well as telling us to go to the “Get Ready, Get Thru” website. Base: All Respondents: 2007 (n= 1000), 2008 (n= 1016), 2009 (n=1000), 2010 (n=1000), 2011 (n=1164), 2012 (n=1255), 2013 (n=1263).
*Ratecard value for TV ads
Prom
pted
TV
adv
ertis
ing
reca
ll
Significantly different from the 2012 result
Norm(52%)

Colmar Brunton 2012 29
Scores are in line this year compared to
last, apart from agreement
that ‘information was helpful’,
which has decreased
You understood the ad’s message
The points made were believable
The points made were relevant
The information was helpful
Q19 Thinking about these adverts for the Ministry of Civil Defence and Emergency Management, please tell me whether you strongly agree, slightly agree, slightly disagree or strongly disagree with each of these statements? Base: Those respondents who stated that they had seen the Civil Defence TV advertising, 2007 (n=631), 2008 (n=418), 2009 (n=608), 2010 (n=654), 2011 (n=710), 2012 (n=830), 2013 (n=845)
Strongly agreeSlightly agreeSlightly disagreeStrongly disagreeDon’t know
98
97
98
99
98
99
98
97
96
96
96
96
98
98
91
92
94
92
89
95
95
92
92
95
92
94
96
93
% agree
Significantly different from the 2012 result

Colmar Brunton 2012 30
More people said they
enjoyed the ads this wave,
and there is less ad wear
out.
You are getting fed up seeing them
You enjoyed watching the ads
The ads contained new information
Q19 Thinking about these adverts for the Ministry of Civil Defence and Emergency Management, please tell me whether you strongly agree, slightly agree, slightly disagree or strongly disagree with each of these statements? Base: Those respondents who stated that they had seen the Civil Defence TV advertising, 2007 (n=631), 2008 (n=418), 2009 (n=608), 2010 (n=654), 2011 (n=710), 2012 (n=830), 2013 (n=845)
Strongly agreeSlightly agreeSlightly disagreeStrongly disagreeDon’t know
81
80
85
79
77
81
84
64
53
70
57
58
65
66
20
16
22
18
20
22
18
% agree
Significantly different from the 2012 result

Colmar Brunton 2012 31
Q20 What if anything have you done as a result of seeing the ads? Have you…Base: Those respondents who stated that they had seen the Civil Defence TV advertising, 2007 (n=631), 2008 (n=518), 2009 (n=608), 2010 (n=654), 2011 (n=710), 2012 (n=830), 2013 (n=845).
The majority of people (82%) have thought
about preparing or taken action
as a result of seeing the ads. However, this is slightly
lower than last year (which was 88% in 2012).
Over seven in ten New Zealanders who have seen the ads (71% versus 75% last
year) have gone beyond thinking about preparing, and have taken at least one of the following actions as a result: talked to family/friends, made a survival kit, made a
survival plan, visited the Get Ready Get Thru website, or visited other disaster
preparation websites.
Action taken as a result of seeing the ads
Significantly different from the 2012 result

Colmar Brunton 2012 32
Familiarity with the tagline continues to be high.
Prom
pted
reca
ll of G
et R
ead
y G
et T
hru
tagl
ine
Q21. Before I mentioned it earlier, had you previously heard of the tag line “Get Ready, Get Thru”? Base: All Respondents: 2007 (n= 1000), 2008 (n= 1016), 2009 (n=1000), 2010 (n=1000), 2011 (n=1164), 2012 (n=1255), 2013 (n=1263).
More than half of New Zealanders (57%) are aware of
the ‘Get Ready, Get Thru’ tagline.
More than half of New Zealanders (57%) are aware of
the ‘Get Ready, Get Thru’ tagline.
The tagline continues to be particularly familiar to:young people aged 15 to 29 (72%, compared with 52% of those aged 30 years or over)

Colmar Brunton 2012 33
And there also continues to be high awareness of the getthru.govt.nz website.
Q22 And had you also previously heard of the website ‘getthru.govt.nz’?Base: All Respondents: 2007 (n= 1000), 2008 (n= 1016), 2009 (n=1000), 2010 (n=1000), 2011 (n=1164), 2012 (n=1255), 2013 (n=1263).
Prom
pted
reca
ll of g
etth
ru.g
ovt.n
z
Awareness of the website is lower among those aged 50 years or over (34% compared to 57% of those under 50).

Colmar Brunton 2012 34
Q17. What do you think the ads were trying to tell you? Base: Those respondents who stated that they have seen or heard advertising about preparing for a disaster, 2009 (n=549), 2010 (n=659), 2011 (n=713), 2012 (n=797), 2013 (n=718). Note: The top ten messages are shown.
The main message take
out continues to be ‘be
prepared’, followed by how
to prepare.
Advertising message take-out
Significantly different from the 2012 result

Colmar Brunton 2012 35
Unprompted awareness: There has been a significant decrease in unprompted awareness of any disaster preparedness advertising.
Percentage of NZers who have seen, heard, or read any advertising about preparing for a disaster and the ratecard
value of the TV advertising.
Annua
l rateca
rdvalue ($ m
illion)**Ratecard value for TV ads
Adv
ertis
ing
reca
ll
Q15 Have you seen, heard or read recently any advertising about preparing for a disaster? Base: All Respondents: 2007 (n= 1000), 2008 (n= 1016), 2009 (n=1000), 2010 (n=1000), 2011 (n=1164), 2012 (n=1255), 2013 (n=1263).
Significantly different from the 2012 result
Note that this question measures awareness of non-MCDEM advertising
(eg, regional council campaigns) as well as MCDEM advertising.
This decrease may reflect a decrease in
preparedness messaging by councils and
community groups.
Note that this question measures awareness of non-MCDEM advertising
(eg, regional council campaigns) as well as MCDEM advertising.
This decrease may reflect a decrease in
preparedness messaging by councils and
community groups.

Colmar Brunton 2012 36
Most people recall preparedness advertising on TV, however this has decreased slightly since 2012.
Q16 Where did you see, hear or read the ads? Base: Those respondents who stated that they have seen, heard or read advertising about preparing for a disaster, 2007 (n=651), 2008 (n=543), 2009 (n=549), 2010 (n=659), 2011 (n=713), 2012 (n=797), 2013 (n=718). Note: Responses 2% and below not shown.
Sources of awareness of preparedness advertising
Significantly different from the 2012 result

Colmar Brunton 2012 37
Q22a Other than in any advertising, where else have you seen or heard other messages or information about disasters? Base: All Respondents, 2009 (n = 1000), 2010 (n=1000), 2011 (n=1164), 2012 (n=1255), 2013 (n=1263). Note: The top ten sources are shown.
Sources of non-advertising preparedness messages
Awareness of non- advertising disaster
preparedness messages is more or less in line with last year, apart
from the increase for ‘at work’ which may be in part due
to the ShakeOut campaign in
September 2012.
Significantly different from the 2012 result

Colmar Brunton 2012 38
Colmar Brunton 2012 39Colmar Brunton 2012 39
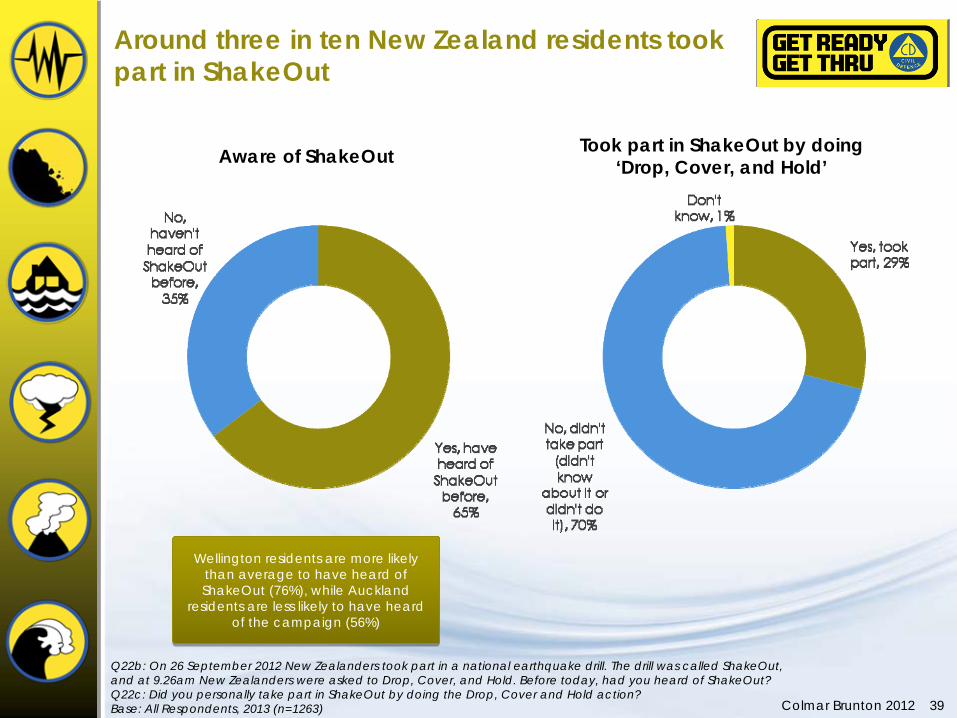
Around three in ten New Zealand residents took part in ShakeOut
Q22b: On 26 September 2012 New Zealanders took part in a national earthquake drill. The drill was called ShakeOut, and at 9.26am New Zealanders were asked to Drop, Cover, and Hold. Before today, had you heard of ShakeOut? Q22c: Did you personally take part in ShakeOut by doing the Drop, Cover and Hold action? Base: All Respondents, 2013 (n=1263)
Aware of ShakeOut Took part in ShakeOut by doing ‘Drop, Cover, and Hold’
Wellington residents are more likely than average to have heard of ShakeOut (76%), while Auckland
residents are less likely to have heard of the campaign (56%)
Wellington residents are more likely than average to have heard of ShakeOut (76%), while Auckland
residents are less likely to have heard of the campaign (56%)

Colmar Brunton 2012 40Colmar Brunton 2012 40
Over six in ten of those aware of ShakeOut say they feel more prepared or know more about what to do in an earthquake because of the campaign.
Q22d: And as a result of taking part in ShakeOut, do you feel more prepared for an earthquake? Q22e: Even though you did not take part in ShakeOut, as a result of being aware of ShakeOut do you know more about what to do in an earthquake? Base: All Respondents aware of ShakeOut, 2013 (n=838)
Feel more prepared or know more about what to do because of ShakeOut
As a result of taking part in ShakeOut, do you feel more prepared for an earthquake? •Yes = 60%•No = 36%•Don’t know = 4%(Base: All who took part, n=352)
Even though you didn’t take part in ShakeOut, as a result of being aware of it do you know more about what to do in an earthquake? •Yes = 63%•No = 34%•Don’t know = 3%(Base: All aware but didn’t take part, n=486)
As a result of taking part in ShakeOut, do you feel more prepared for an earthquake?•Yes = 60%•No = 36%•Don’t know = 4%(Base: All who took part, n=352)
Even though you didn’t take part in ShakeOut, as a result of being aware of it do you know more about what to do in an earthquake? •Yes = 63%•No = 34%•Don’t know = 3%(Base: All aware but didn’t take part, n=486)

Colmar Brunton 2012 41© Colmar Brunton 2011 41
Better preparedness among those involved in ShakeOut*
Source: Q10, Q22b-Q22d *Cells shaded yellow are significant higher than the average results (shaded blue)*’Feel more prepared’ includes those aware of ShakeOut who did not personally take part

Colmar Brunton 2012 42

Colmar Brunton 2012 43
Awareness remains high that a wide range of
services can help following a
disaster.
Q7. Now I’d like you to imagine that there has been a disaster in the town, city or rural area where you live. What groups or individuals do you think would be able to help you following a disaster? Base: All Respondents: 2007 (n= 1000), 2008 (n=1016), 2009 (n=1000), 2010 (n=1000), 2011 (n=1164), 2012 (n=1255), 2013 (n=1263).
Who would be able to help following a disaster?
Significantly different from the 2012 result

Colmar Brunton 2012 44
The majority of residents are aware
that a number of services may be
disrupted following a disaster.
Q8 Still imagining there had been a disaster, some of the normal services may not be available. Which of the following household utilities or infrastructure services do you think could be disrupted? Base: All Respondents: 2007 (n= 1000), 2008 (n=1016), 2009 (n=1000), 2010 (n=1000), 2011 (n=1164), 2012 (n=1255), 2013 (n=1263).
Which services could be disrupted?
Significantly different from the 2012 result

Colmar Brunton 2012 45
The most common places people
look to for preparedness
information continue to be the
Yellow Pages or online.
Q12 Before a disaster, where can you get information about how to prepare for a disaster?Base: All Respondents: Benchmark (n= 1001), 2007 (n= 1000), 2008 (n= 1016), 2009 (n=1000), 2010 (n=1000), 2011 (n=1164), 2012 (n=1255), 2013 (n=1263). Note: The top eight results for 2013 are shown.
Finding information before a disaster on how to prepare.
Significantly different from the 2012 result

Colmar Brunton 2012 46© Colmar Brunton 2011 46
More than 9 in 10 have a Yellow Pages directory in their home.
Do you currently have a Yellow Pages directory in your home?
Those more likely to have a Yellow Pages directory in their home include: Southland residents (100%)Those over the age of 40 years (95%), and particularly those over 60 years of age (97%). Those with an annual household income under $40k (97%) Those who are fully prepared for a disaster (97%) and those who have water and survival items (95%).
Those less likely than average (92%) to have a Yellow Pages directory in their home include: Auckland residents (88%)Those under the age of 40 years (90%)Those who do not identify as NZ-European or Maori (85%) Those who have been in New Zealand for 3 years or less (76%), 5 years or less (78%), or 10 years or less (83%) Those who say they are not that well or not at all pre-prepared for a disaster (90%).
Those more likely to have a Yellow Pages directory in their home include:Southland residents (100%)Those over the age of 40 years (95%), and particularly those over 60 years of age (97%).Those with an annual household income under $40k (97%)Those who are fully prepared for a disaster (97%) and those who have water and survival items (95%).
Those less likely than average (92%) to have a Yellow Pages directory in their home include:Auckland residents (88%)Those under the age of 40 years (90%)Those who do not identify as NZ-European or Maori (85%)Those who have been in New Zealand for 3 years or less (76%), 5 years or less (78%), or 10 years or less (83%)Those who say they are not that well or not at all pre-prepared for a disaster (90%).
Q22f. Do you currently have a Yellow Pages directory in your home? Base: All Respondents (n=1,263)

Colmar Brunton 2012 47
How to prepare for a disaster (unprompted)
Significantly different from the 2012 result
Q6a What things do you think households should do to prepare for a disaster? Base: All Respondents: Benchmark 2009 (n=1000), 2010 (n=1000), 2011 (n=1164), 2012 (n=1255), 2013 (n=1263).
Similar to previous waves, most New Zealand residents
mention that to prepare for
disaster they need a supply of survival
items, and food and water. Under half mention that
they need a survival plan.

Colmar Brunton 2012 48

Colmar Brunton 2012 49
Attitudes toward disasters
In a disaster there will be someone there to help
you
In a disaster, emergency services would be there
to help you
It’s my responsibility to look after myself & family
in a disaster
There will always be adequate warning before disaster hits
Strongly agreeSlightly agreeSlightly disagreeStrongly disagreeDon’t know
6167717664747377
% agree
6570757765757577
2531303836283636
9497989899989897
Benchmark2007200820092010201120122013
Q2 On a scale of strongly agree, slightly agree, slightly disagree and strongly disagree, how much do you agree or disagree with the following statements? Base: All Respondents: Benchmark (n=1001), 2007 (n= 1000), 2008 (n=1016), 2009 (n=1000), 2010 (n=1000), 2011 (n=1164), 2012 (n=1255), 2013 (n=1263).
Benchmark2007200820092010201120122013
Benchmark2007200820092010201120122013
Benchmark2007200820092010201120122013
There is an increase in agreement that ‘there will be someone there to help’ and ‘emergency services would be there to help’ compared to last year.
Over a third (36%) of New Zealand residents believe there will always be adequate warning before a disaster hits.Those more likely to agree with this statement are:•Waikato residents (55% agree)•Aged 15 – 29 (50%)•Identify as Maori (47%) or Asian (52%) •Have lived in New Zealand for five years or less (64%)

Colmar Brunton 2012 50
Very important/ prepared
Quite important/ prepared
Not that important/ prepared
Not at all important/ prepared
Q3 How important is it that you are prepared for a disaster? Is it… Q5. How well prepared for a disaster do you feel you are? Do you feel you are… Base: All Respondents: Benchmark (n=1001), 2007 (n= 1000), 2008 (n= 1016), 2009 (n=1000), 2010 (n=1000), 2011 (n=1164), 2012 (n=1255), 2013 (n=1263).
The importance of preparing for a disaster, and self-rated preparedness, remain consistent with last year.
2011 – 62%2010 – 54%2009 – 52%2008 – 56%2007 – 54%2006 – 54%
% of those who say it’s important who also say they are very or quite
prepared
2012 – 60%
Older New Zealanders are more likely to be
very well prepared (13% of those aged 40 years
plus claim to be, compared to 7% of those aged 39 years
and under).
Older New Zealanders are more likely to be
very well prepared (13% of those aged 40 years
plus claim to be, compared to 7% of those aged 39 years
and under).
% important/ prepared
94
52
93
52
95
54
95
50
95
52
96
60
96
59
97
57
2013 – 59%

Colmar Brunton 2012 51

Colmar Brunton 2012 52
Q9b Now imagine that there is a strong earthquake in your area, what actions should people take during and immediately following a strong earthquake? Base: All Respondents: Benchmark (n= 1001), 2007 (n= 1000), 2008 (n= 1016), 2009 (n=1000), 2010 (n=1000), 2011 (n=1164), 2012 (n=1255), 2013 (n=1263). Note: The top nine results for 2013 shown.
Messaging appears to be working, with an increase in the proportion of people saying ‘stay where you are’, together with a decrease in people saying ‘go outside/into the open’.
Messaging appears to be working, with an increase in the proportion of people saying ‘stay where you are’, together with a decrease in people saying ‘go outside/into the open’.
Actions to take during and after an Earthquake
Significantly more New Zealand
residents say they would ‘drop,
cover, and hold’ compared to last
year.
Significantly different from the 2012 result

Colmar Brunton 2012 53
Nearly nine out of ten New Zealand residents know to move to higher ground in the
event of a tsunami warning, and a
gradually increasing amount
would check on family and friends.
Q9a Now imagine that a tsunami warning has been issued, what actions should people take when a tsunami warning has been issued? Base: All Respondents: Benchmark (n= 1001), 2007 (n= 1000), 2008 (n= 1016), 2009 (n=1000), 2010 (n=1000), 2011 (n=1164), 2012 (n=1255), 2013 (n=1263). Note: The top eight results for 2013 are shown.
Actions to take in the event of a Tsunami warning
Significantly different from the 2013 result

Colmar Brunton 2012 54

Colmar Brunton 2012 55© Colmar Brunton 2011 55
Conclusions
As we saw last year, the Christchurch earthquakes gave New Zealand residents a sense of urgency, which in turn prompted people to take action to get better prepared. It also enabled a better understanding of what can happen in an emergency. As a result, New Zealand’s preparedness increased substantially in 2010.
Whilst preparedness this year is still higher than it was pre-2011, an element of lethargy is creeping into the public’s preparedness levels. Some groups continue to be less well prepared than others.
In particular it is necessary to increase awareness, knowledge, and relevance for the following groups: Auckland residents, younger New Zealanders, people new to the country, and those that identify as Asian.
Seventeen percent of all New Zealand residents are fully prepared for an
emergency.
Seventeen percent of all New Zealand residents are fully prepared for an
emergency.
Half (52%) have both water and survival
items.
Half (52%) have both water and survival
items.
The majority are aware of the types
of disasters that could occur (81%)
and have understanding of the effects if one struck
(83%).
The majority are aware of the types
of disasters that could occur (81%)
and have understanding of the effects if one struck
(83%).

Colmar Brunton 2012 56
Conclusions (continued)
Prompted awareness of the Civil Defence TV advertising has been maintained.
The ads are still effectively prompting action (although not to the same extent as last year). Most people who have seen the ads (82%) having done something or thought about doing something as a result (down from 88% last year).
The tag line ‘Get Ready, Get Thru’ is still high in peoples’ consciousness – nearly six in ten New Zealand residents are aware of it when prompted (57%).
There was high involvement in the ShakeOut event, with 29% of New Zealanders taking part by doing ‘Drop, Cover, and Hold’ in September 2012.
ShakeOut and the new advertising campaign messaging have probably together contributed to significantly more people than last year knowing to ‘Drop, Cover, and Hold’ (19% compared to 9% in 2012) and also to stay put, and fewer saying to go outside in the open, during an earthquake.

Colmar Brunton 2012 57© Colmar Brunton 2011 57
Key challenges
Although the impact of the Christchurch earthquakes on New Zealand residents may have reduced slightly since immediately post-quake in 2011, the levels of preparedness are still consistently higher than before the earthquakes. However, it’s still necessary to remind and encourage people with relevant information to maintain and increase their preparedness.
The mass marketing campaign has proved effective at building and maintaining preparedness among people living in New Zealand.
Further effective engagement with targeted communities and local organisations (e.g., schools, churches, student unions) will help to increase awareness among those groups most at risk (young people, ethnic minorities, and people new to the country).
Messaging could be more targeted to different groups.
National campaign targeted at those not yet fully prepared = Take action now! Write down/check your plan. Update your items.
Higher risk groups = many still need to know why it’s important to be prepared, and what could happen if they don’t prepare.

Colmar Brunton 2012 58

Colmar Brunton 2012 59
The pages that follow list the statistically significant differences between the overall (average) results for NZ and responses provided by people living in the various regions of the country.
The graph below provides the sample size for each region. The results have been weighted to 2006 Census figures to represent the proportion of New Zealanders aged 15+ within each region.
Number of interviews carried out in each region
Regional Analyses
Source: Survey call data (total number of interviews = 1,263)
Please note: Caution must be used in interpreting figures prior to 2011, due to small base sizes within some regions.

Colmar Brunton 2012 60
10%
22%
46%
75%
2012
Preparedness
Aucklanders are less likely than the national average to be fully prepared for a disaster (only 11% are fully prepared, c.f. national average of 17%). They are also less likely than average to be prepared at home (23% c.f. 32% national average).
In Auckland, preparedness levels are significantly lower than average in six of the preparedness diagnostics, which are:
You have a good understanding of the types of disasters that could occur in New Zealand, and the chances of them occurring (74% c.f. 81% national average)
You are familiar with the Civil Defence information in the Yellow Pages (57% c.f. 65% national average)
You have an emergency survival plan for your household (46% c.f. 58% national average)
You have stored at least 3 litres of water per person for 3 days for each member of your household (44% c.f. 56% national average)
You have the necessary emergency items needed to survive a disaster (79% c.f. 85% national average)
You attend meetings with community groups about disaster planning (6% c.f. 10% national average).
Fully prepared
Prepared at home
Benchmark 2007 2008 2009
Has a plan
Has survival items 83%
4%
15%
38%
83%
4%
15%
39%
67%
3%
14%
35%
74%
7%
20%
40%
9%
18%
40%
75%
201011%
21%
53%
79%
2011
Sample size = 264
11%
23%
46%
79%
2013

Colmar Brunton 2012 61Sample size = 264
Preparedness (continued)• Aucklanders are less likely than average to say that they feel either ‘very well prepared’ or ‘quite well
prepared’ for a disaster (only 44% c.f. 58% national average).
• They are also less likely than average to have an emergency plan that includes while they are at home and away from home (only 20% c.f. 27% national average).
• In the last 12 months, significantly fewer Aucklanders (when compared to average) have taken steps to prepare themselves or their household for a disaster (only 40% c.f. 51% national average).
Advertising and information
There are no significant differences between Aucklanders and the general population in terms of awareness and where they’ve seen advertising (53% recall seeing, hearing, or reading any advertising about preparing for a disaster c.f. 56% national average).
ShakeOut• Aucklanders are less likely than average to have heard of the ShakeOut event in September 2012 (56%
c.f. 64% national average). As such they’re also slightly less likely to have taken part in the event by doing the ‘Drop, Cover, and Hold’ action (25% took part c.f. 29% national average).

Colmar Brunton 2012 62
Source: Survey call data (total number of interviews = 1,000)
Sample size = 264
Disaster awareness
Auckland residents are more likely than average to think that a volcanic eruption can happen in NZ in their lifetime (65% c.f. 50% national average), and they are less likely than average to think a fire can happen (20% c.f. 27% national average).
Aucklanders are less likely than average to say that they can get information about how to prepare for a disaster from their local or regional council (17% c.f. 31% national average) and from the Fire Department (2% c.f. 5% national average).
They are more likely to think Hospitals would be able to help them out following a disaster (81% c.f. 74% national average).
Aucklanders are also less likely than average to say that in the event of a tsunami or earthquake, people should alert or check on family, friends and neighbours (23% c.f. 33% national average for a tsunami, and 41% c.f. 50% national average for a earthquake). They are also less likely than average to say that in the event of an earthquake people should check their pets (0% c.f. 2% national average).

Colmar Brunton 2012 63
Preparedness
The proportion of Canterbury residents who are fully prepared for a disaster is significantly higher than average (26% c.f. 17% national average). On the Preparedness Continuum Canterbury residents are also more likely to be have “commitment” by having prepared water and survival items for a disaster (64% c.f. 52% national average).
Similarly, the proportion that are prepared at home is significantly higher than average (40% c.f. 32% national average).
In Canterbury, preparedness levels are significantly higher than average for the following four preparedness diagnostics:
You have an emergency survival plan for your household (69% c.f. 58% national average)
You have the necessary emergency items needed to survive a disaster, such as, tinned food, toilet paper, torch, spare batteries and so on (91% c.f. 85% national average)
You have stored at least 3 litres of water per person for 3 days for each member in your household (68% c.f. 56% national average).
Sample size = 131
32%
50%
79%
88%
2012Fully prepared
Prepared at home
Benchmark 2007 2008 2009
Has a plan
Has survival items 79%
5%
19%
52%
87%
10%
24%
52%
89%
8%
40%
62%
83%
11%
25%
54%
13%
27%
51%
80%
2010NA
NA
NA
NA
2011*Note: Up until 2010 the results for the Canterbury region were combined with the results for the West Coast region.
26%
40%
69%
91%
2013

Colmar Brunton 2012 64
Preparedness (continued)
The proportion of Canterbury residents who have a plan for when they are at home and away from home is significantly higher than average (39% c.f. 27% national average).
The proportion of Canterbury residents who have taken steps in the last 12 months to prepare themselves or their household for a disaster is significantly higher than average (69% c.f. 51% national average).
Canterbury residents are more likely than average to say that they feel either ‘very well prepared’ or ‘quite well prepared’ for a disaster (73% c.f. 58% national average).
Unsurprisingly, Canterbury residents are more likely to have been prompted to prepare for a disaster by the Christchurch earthquakes (75% c.f. 53% national average). They are less likely to have done so because of overseas disasters (4% c.f. 15% national average).
Advertising and information
Once prompted with the ad description Canterbury residents are more likely to recall seeing the Civil Defence Get Ready Get Thru television advertising than average (78% c.f. 68% national average. Those who have seen a Civil Defence TV advertisement are significantly less likely than average to say that the advertisement prompted them to think about preparing for disasters(54% c.f. 65% national average).
Canterbury residents are less likely than average to have previously heard of the website ‘getthru.govt.nz’ (39% c.f. 49% national average).
ShakeOut
Over two thirds of Cantabarians have heard of ShakeOut (69% c.f. 64% national average). They are more likely than average to have not taken part in the ShakeOut event (43% did not take part c.f. 34% national average).
They are also more likely to not feel more prepared for an earthquake following the ShakeOut event (47% feel more prepared c.f. 62% national average).
Sample size = 131

Colmar Brunton 2012 65
Disaster awareness
Canterbury residents are more likely than average to think that a tsunami can happen in NZ in their lifetime (81% c.f. 72% national average), and they are more likely than average to think a snow storm or snow disaster can happen (8% c.f. 2% national average).
Residents in the Canterbury region are more likely than average to disagree that there will always be adequate warning before a disaster hits (75% c.f. 63% national average).
Residents from the Canterbury region are more likely than average to think that the following household utilities or infrastructure services could be disrupted following a disaster:
Sewerage (93% c.f. 86% national average)
Mobile phone services (86% c.f. 72% national average).
Residents from the Canterbury region are more likely than average to think that people should take the following actions in the event of an earthquake:
Drop, cover and hold (27% c.f. 19% national average)
Alert or check on family/friends and neighbours (62% c.f. 50% national average)
Check pets (5% c.f. 2% national average)
Stay put (19% c.f. 12% national average).
Sample size = 131

Colmar Brunton 2012 66
25%
40%
71%
83%
2012
Preparedness
Overall, a third (32%) of Wellington residents are fully prepared for a disaster. This is higher than the national average of 17%. On the Preparedness Continuum residents are also more likely to have “commitment” by having water and survival items (69% c.f. 52% national average) and be prepared at home (47% c.f. 32% national average).
Wellington residents are more likely than average to say that they feel either ‘very well prepared’ or ‘quite well prepared’ for a disaster (69% c.f. 58% national average).
The proportion of Wellington residents who have taken steps in the past 12 months to prepare for a disaster is higher than average (68% c.f. 51% national average).
Similarly, the proportion of Wellington residents who have a survival plan for when they are at home and away from home is significantly higher than average (49% c.f. 27% national average).
In Wellington, preparedness levels are significantly higher than average in two of the preparedness diagnostics, including:
You have an emergency survival plan for your household (76% c.f. 58% national average)
You have stored at least 3 litres of water per person for 3 days for each member in your household (75% c.f. 56% national average).
Fully prepared
Prepared at home
Benchmark 2007 2008 2009
Has a plan
Has survival items 76%
18%
35%
59%
77%
16%
37%
67%
82%
24%
41%
63%
71%
14%
26%
49%
18%
2010
34%
57%
86%
33%
2011
51%
79%
88%
Sample size = 111
32%
47%
76%
86%
2013

Colmar Brunton 2012 67Sample size = 111
Advertising and information
There are no significant differences between Wellington residents and the general population in terms of awareness and where they’ve seen advertising (52% recall seeing, hearing, or reading any advertising about preparing for a disaster c.f. 56% national average).
ShakeOut
Wellington residents are more likely than average to have heard of the ShakeOut event (76% c.f. 64% national average).
Disaster awareness
Residents from the Wellington region are more likely than average to think that the following household utilities or infrastructure services could be disrupted following a disaster:
Gas (93% c.f. 82% national average)
Sewerage (94% c.f. 86% national average).
Wellington residents are more likely than average to say that they can get information about how to prepare for a disaster from online sources other than the ministry of civil defence website (41% c.f. 31% national average) and from other sources(19% c.f. 11% national average).
They are more likely to think the Police would be able to help them out following a disaster (92% c.f. 83% national average).
Wellington residents are less likely than average to say that in the event of a strong earthquake, people should go outside and stay clear of buildings (4% c.f. 11% national average).

Colmar Brunton 2012 68
8%
29%
52%
77%
2012
Preparedness
Preparedness levels among Waikato residents are statistically similar to the national average:
Just over one in ten are fully prepared (12%)
Six in ten are prepared at home (29%).
Similarly, preparedness levels are similar to the national average across all the preparedness diagnostics:
82% have a good understanding of what the effects would be if a disaster struck in their area
78% said they have a good understanding of the types of disasters that could occur in New Zealand, and the chances of them occurring
86% have the necessary emergency items needed to survive a disaster
70% are familiar with the Civil Defence information in the Yellow Pages
55% have an emergency survival plan for their household
47% regularly update their emergency survival items
51% have stored at least 3 litres of water per person for 3 days, for each member in their household
12% attend meetings with community groups about disaster planning.
Sample size = 84
Fully prepared
Prepared at home
Benchmark 2007 2008 2009
Has a plan
Has survival items 68%
9%
21%
44%
91%
6%
22%
46%
81%
7%
19%
45%
75%
11%
18%
50%
12%
21%
47%
80%
201012%
34%
57%
86%
201112%
29%
55%
86%
2013

Colmar Brunton 2012 69Sample size = 84
Advertising and information
The proportion of Waikato residents that have seen, heard, or read advertising about preparing for a disaster is generally consistent with the national average (54% c.f. 56% national average).
ShakeOut
There are no significant differences between Waikato residents and the general population in terms of awareness (59% c.f. 64% national average) and participation (32% c.f. 29% national average) of the ShakeOut event.
Disaster awareness
Waikato residents are more likely than average to think that a drought could occur in NZ during their lifetime (10% c.f. 4% national average) and are less likely than average to think that a tsunami could occur (59% c.f. 72% national average).
Residents in Waikato are more likely than average to agree that there will always be adequate warning before a disaster hits (55% c.f. 36% national average).
Residents from Waikato are less likely than average to think that access to medical and health services (78% c.f. 87% national average) could be disrupted following a disaster.

Colmar Brunton 2012 70Sample size = 84
Disaster awareness (continued)
Among Waikato residents, awareness of where to find information about preparing for a disaster is generally consistent with the national average:
48% mentioned the Yellow Pages
21% mentioned the internet in general
36% mentioned their local or regional council
37% mentioned the Civil Defence website
4% mentioned Civil Defence (non-specific).

Colmar Brunton 2012 71
17%
37%
63%
81%
2012
Preparedness
Preparedness levels among the Bay of Plenty residents statistically similar to the national average:
17% are fully prepared; 32% are prepared at home
Just under two thirds (60%) have an emergency plan and 92% have survival items.
Preparedness levels among Bay of Plenty residents are significantly higher than average for the preparedness diagnostic ‘you attend meetings with community groups about disaster planning’ (20% c.f. 10% national average).
Sample size = 68
Fully prepared
Prepared at home
Benchmark 2007 2008 2009
Has a plan
Has survival items 67%
8%
16%
43%
82%
2%
16%
42%
90%
13%
34%
57%
78%
15%
28%
54%
12%
22%
47%
81%
201012%
34%
66%
87%
2011
17%
32%
60%
92%
2013

Colmar Brunton 2012 72Sample size = 68
Advertising and information
The proportion of residents from the Bay of Plenty that have seen, heard, or read advertising about preparing for a disaster is generally consistent with the national average (59% c.f. 56% national average).
Bay of Plenty residents are significantly more likely to have seen these advertisements in the newspaper (41% c.f. 20% national average).
Residents who have seen the Get Ready Get Thru television advertising are significantly more likely than average to say that the advertisement prompted them to visit other disaster preparation websites (25% c.f. 9% national average).
ShakeOut
There are no significant differences between Bay of Plenty residents and the general population in terms of awareness (73% c.f. 64% national average) and participation (33% c.f. 29% national average) of the ShakeOut event.
Disaster awareness
Residents from Bay of Plenty are less likely than average to think that mobile phone services (54% c.f. 72% national average) could be disrupted following a disaster.
Bay of Plenty residents are more likely than average to say that in the event of a strong earthquake, people should be prepared to evacuate and take important personal items (18% c.f. 9% national average), and get help as soon as possible (6% c.f. 2% national average).

Colmar Brunton 2012 73
12%
37%
62%
79%
2012
Sample size = 68
Fully prepared
Prepared at home
Benchmark 2007 2008 2009
Has a plan
Has survival items 87%
1%
13%
37%
91%
7%
33%
51%
93%
10%
24%
42%
80%
6%
25%
56%
6%
34%
55%
74%
2010
Preparedness
Just under one in three Northland residents are prepared at home (29%).
In Northland, preparedness levels are significantly higher than average in the following preparedness diagnostic:
You have the necessary emergency items needed to survive a disaster, such as, tinned food, toilet paper, torch, spare batteries and so on (94% c.f. 85% national average).
Advertising and information
The proportion of Northland residents who have seen, heard, or read any general advertising about preparing for a disaster is relatively consistent with the national average at 56%.
Similarly, the proportions of Northland residents who have seen a Civil Defence TV advertisement (67%), who have previously heard of ‘Get Ready, Get Thru’ (59%), and who have previously heard of the website ‘getthru.govt.nz’ (53%) are similar to national results.
12%
25%
45%
84%
2011
13%
29%
57%
94%
2013
Significantly different from the 2012 result

Colmar Brunton 2012 74Sample size = 68
ShakeOut
There are no significant differences between Northland residents and the general population in terms of awareness (58% c.f. 64% national average) and participation (26% c.f. 29% national average) in the ShakeOut event.
Disaster awareness
Northland residents are less likely than average to think that a fire can happen in NZ in their lifetime (15% c.f. 27% national average).
Northland residents are significantly less likely to think that there will be someone to help them in the event of a disaster (66% c.f. 77% national average), and are more likely to disagree that emergency services will be there to help in the event of a disaster (33% c.f. 21% national average).
They are less likely than average to think the following household utilities or infrastructure services could be disrupted if a disaster took place:
Water (68% c.f. 89% national average)
Sewerage (71% c.f. 86% national average).
Northland residents are more likely than average to think they can get information about how to prepare for a disaster from the local or regional council (46% c.f. 31% national average).
Northland residents are less likely than average to think that in the event of a disaster in their area, the army (55% c.f. 69% national average), hospitals (63% c.f. 74% national average) and the Civil Defence (66% c.f. 82% national average) will be there to help them.

Colmar Brunton 2012 75
11%
25%
56%
84%
2012
Sample size = 67
Fully prepared
Prepared at home
Benchmark 2007 2008 2009
Has a plan
Has survival items 81%
47%
84%
39%
90%
57%
81%
43%
Sample size too
small
Sample size too
small
Sample size too
small
Sample size too
small
36%
68%
2010
Sample size too
small
Preparedness
Preparedness levels among Taranaki residents are statistically similar to the national average:
Over one in ten are fully prepared (14%)
Nearly a quarter are prepared at home (24%)
Almost two thirds have an emergency plan (62%)
Just over three quarters have emergency survival items (77%).
Advertising and information
The proportion of Taranaki residents who have seen, heard, or read any general advertising about preparing for a disaster is the same as the national average (both 56%).
Similarly, the proportions of Taranaki residents who have seen the Civil Defence ‘Get Ready, Get Thru’ TV advertisement (74%), who have previously heard of ‘Get Ready, Get Thru’ slogan (63%), and who have previously heard of the website ‘getthru.govt.nz’ (60%) are on par with national results.
62%
76%
2011
14%
22%
14%
24%
62%
77%
2013

Colmar Brunton 2012 76Sample size = 67
ShakeOut
There are no significant differences between Taranaki residents and the general population in terms of awareness (59% c.f. 64% national average) and participation (31% c.f. 29% national average) of the ShakeOut event.
However, Taranaki residents are significantly more likely than the general population to feel more prepared for an earthquake following the ShakeOut event (86% c.f. 62% national average).
Disaster awareness
Taranaki residents are more likely than average to say that a volcanic eruption could occur in NZ in their lifetime (72% c.f. 50% national average).
They are significantly less likely than average to disagree that there will be adequate warning before a disaster hits (47% c.f. 63% national average).
They are more likely than average to think that the water system (97% c.f. 89% national average) could be disrupted if a disaster took place.
Taranaki residents are less likely than average to think that in the event of a disaster in their area, the army (51% c.f. 69% national average), the fire service (76% c.f. 87% national average), hospitals (57% c.f. 74% national average) and the Civil Defence (93% c.f. 82% national average) will be there to help them.

Colmar Brunton 2012 77
15%
42%
67%
81%
2012
Sample size = 62
Fully prepared
Prepared at home
Benchmark 2007 2008 2009
Has a plan
Has survival items 85%
6%
28%
52%
97%
16%
34%
63%
76%
16%
30%
55%
94%
15%
33%
65%
7%
22%
50%
82%
2010
Preparedness
There are no statistical differences between Manawatu residents and the national average across all the preparedness continuum measures and across all the preparedness diagnostics.
20%
36%
67%
80%
2011
17%
31%
47%
82%
2013
ShakeOut
There are no significant differences between Manawatu residents and the general population in terms of awareness (71% c.f. 64% national average) and participation (38% c.f. 29% national average) of the ShakeOut event.
Disaster awareness
Manawatu residents are less likely than average to say that they can get information about how to prepare for a disaster from the radio (0% c.f. 8% national average).
Advertising and information
The proportion of residents from the Manawatu that have seen, heard, or read advertising about preparing for a disaster is consistent with the national average at 52% (c.f. 56% national average).
Similar to the national average, nearly two thirds (64%) of Manawatu residents recall having seen the Civil Defence TV advertisement, 50% have previously heard of the tag line ‘Get Ready, Get Thru’, and 54% have previously heard of the website ‘getthru.govt.nz’.
Significantly different from the 2012 result

Colmar Brunton 2012 78
25%
38%
64%
83%
2012
Sample size = 64
Fully prepared
Prepared at home
Benchmark 2007 2008 2009
Has a plan
Has survival items 100%
62%
87%
42%
87%
68%
92%
40%
Sample size too
small
Sample size too
small
Sample size too
small
Sample size too
small
72%
80%
2010
Sample size too
small
59%
82%
201116%
35%
Preparedness
On par with the national average, 43% of Gisborne residents have taken steps in the last 12 months to prepare themselves or their household for a disaster (c.f. 51% national average).
In Gisborne, preparedness levels are significantly higher than average in the following preparedness diagnostic:
19% attend meetings with community groups about disaster planning (c.f. 10% national average).
Advertising and information
The proportion of residents from Gisborne that have seen, heard, or read advertising about preparing for a disaster is in line with the national average (61% c.f. 56% national average).
Similar to the national average, Gisborne residents recall having heard of the tag line ‘Get Ready, Get Thru’ (54% c.f. 57% national average), and have previously heard of the website ‘getthru.govt.nz’ (53% c.f. 48% national average).
11%
27%
56%
90%
2013
Significantly different from the 2012 result

Colmar Brunton 2012 79Sample size = 64
ShakeOut
There are no significant differences between Gisborne residents and the general population in terms of awareness (68% c.f. 64% national average) and participation (25% c.f. 29% national average) in the ShakeOut event.
Disaster awareness
Gisborne residents are less likely than average to think that the water system (72% c.f. 89% national average) could be disrupted if a disaster took place.
Gisborne residents are more likely than average to say that information about how to prepare for a disaster can be obtained from health authorities, hospitals, doctors and ambulance services (9% c.f. 3% national average).
Gisborne residents are less likely than average to think that in the event of a disaster in their area, the army (52% c.f. 69% national average), the fire service (75% c.f. 87% national average), and ambulances (65% c.f. 77% national average) will be there to help them.
Gisborne residents are more likely than average to say that in the event of a tsunami, people should prepare to be evacuated and take important personal items (33% c.f. 20% national average).
They are also more likely than average to think that people should take the following actions in the event of an earthquake:
Prepare to be evacuated and take important personal items (17% c.f. 9% national average)
Turn off electricity, power and gas (29% c.f. 11% national average).

Colmar Brunton 2012 80Sample size = 67
Fully prepared
Prepared at home
Benchmark 2007 2008 2009
Has a plan
Has survival items 88%
13%
26%
59%
80%
7%
26%
54%
73%
16%
29%
64%
87%
12%
29%
59%
7%
20%
63%
79%
2010
Preparedness
Preparedness levels among Hawkes Bay residents are statistically similar to the national average:
Nearly one fifth of residents are fully prepared (17%)
Just over one third are prepared at home (36%)
Just over eight in ten have emergency survival items (82%).
Hawkes Bay residents are more likely than average to say that they feel either ‘very well prepared’ or ‘quite well prepared’ for a disaster (72% c.f. 58% national average).
Advertising and information
Hawkes Bay residents are significantly less likely than average to have seen, heard, or read advertising about preparing for a disaster on television (65% c.f. 83% national average), and more likely to have seen it in the newspaper (37% c.f. 20% national average).
Almost three quarters of Hawkes Bay residents (73%) have seen a Civil Defence TV advertisement, 66% have previously heard of the tag line ‘Get Ready, Get Thru’, and 57% have previously heard of the website ‘getthru.govt.nz’, all of which are consistent with the national average.
16%
28%
71%
84%
2011
21%
43%
73%
87%
2012
17%
36%
69%
82%
2013
Significantly different from the 2012 result

Colmar Brunton 2012 81Sample size = 67
ShakeOut
There are no significant differences between Hawkes Bay residents and the general population in terms of awareness (73% c.f. 64% national average) and participation (38% c.f. 29% national average) in the ShakeOut event.
Disaster awareness
Hawkes Bay residents are more likely than average to say that a tsunami could occur in NZ in their lifetime (90% c.f. 72% national average), and less likely than average to say that a volcanic eruption could occur (34% c.f. 50% national average).
They are less likely than average to say that they can get information about how to prepare for a disaster from TV, TV advertisements and news (3% c.f.11% national average).
They are also less likely than average to think that people should take the following actions in the event of an earthquake:
Check emergency survival items (2% c.f. 11% national average)
Stay indoors (0% c.f. 7% national average).

Colmar Brunton 2012 82
17%
36%
66%
94%
2012
Sample size = 75
Fully prepared
Prepared at home
Benchmark 2007 2008 2009
Has a plan
Has survival items 88%
66%
91%
48%
87%
71%
91%
53%
Sample size too
small
Sample size too
small
Sample size too
small
Sample size too
small
2010
43%
85%
Sample size too
small
Preparedness
On the Preparedness Continuum, Nelson/Marlborough residents are more likely to be have “Commitment” for a disaster, i.e., have water and survival items, than the national population (69% cf. 52% national average).
Residents of Nelson/Marlborough’s preparedness levels are significantly higher than average for the following preparedness diagnostics:
‘You are familiar with the Civil Defence information in the Yellow Pages’ (78% cf. 65% national average)
‘You have stored at least 3 litres of water per person for 3 days for each member in your household’ (69% cf. 56% national average).
Just over six in ten Nelson/Marlborough residents, which is significantly higher than average (63% cf. 51% national average), have taken steps in the last 12 months to prepare themselves or their household for a disaster.
2011
80%
91%
37%
51%
19%
36%
63%
88%
2013

Colmar Brunton 2012 83Sample size = 75
Advertising and information
Just above the national average, over six in ten Nelson/Marlborough residents (64%) recall seeing, hearing, or reading an advertisement about preparing for a disaster. These residents are most likely to have recalled seeing them on TV (80%), in newspapers (20%), or on the radio (15%).
ShakeOut
Around three quarters (74%) of Nelson/Marlborough residents have heard of ShakeOut, and 36% took part by doing the ‘Drop, Cover, and Hold’, which although not significant is slightly higher than the national average.
Disaster awareness
Residents from Nelson/Marlborough are more likely than average to say that a flood (72% cf. 56% national average) or fire (39% cf. 27% national average) could occur in NZ in their lifetime.
Nelson/Marlborough residents are less likely than average to agree that:
‘emergency services will be there to help you in a disaster’ (62% cf. 77% national average)
‘there will always be adequate warning before a disaster hits’ (24% cf. 36% national average).
People from Nelson/Marlborough are more likely to think that roading infrastructure could be disrupted by a disaster (99% cf. 90% national average), but less likely to think that gas services could be disrupted (65% cf. 82% national average).
Nelson/Marlborough residents are more likely than the general population to say that in the event of an earthquake people should ‘Duck, Cover, and Hold’ (30% cf. 19% national average).
Residents from Nelson/Marlborough are more likely than average to say that before a disaster they could get information on how to prepare from The Ministry of Civil Defence website (56% cf. 42% national average) or their local or regional council (45% cf. 31% national average).

Colmar Brunton 2012 84
19%
45%
67%
93%
2012
Sample size = 69
Fully prepared
Prepared at home
Has a plan
Has survival items
79%
93%
2011
24%
53%
Preparedness
Residents from the West Coast are more likely than average to have “Commitment” on the Preparedness Continuum for a disaster, i.e., have water and survival items, than the national population (69% c.f. 52% national average).
Preparedness levels in the West Coast are significantly higher than average in the following three preparedness diagnostics:
You have stored at least 3 litres of water per person for 3 days for each member in your household (69% c.f. 56% national average)
You have the necessary emergency items needed to survive a disaster (96% c.f. 85% national average)
You regularly update your emergency survival items (67% c.f. 50% national average).
West Coast residents are more likely than average to say that they feel either ‘very well prepared’ or ‘quite well prepared’ for a disaster (77% c.f. 58% national average).
West Coast residents are more likely than average to say that they’ve taken steps in the last 12 months to prepare themselves or their household for a disaster (63% c.f. 51% national average).
*Note: Up until 2011 the West Coast was analysed together with with Canterbury.
23%
42%
64%
96%
2013

Colmar Brunton 2012 85Sample size = 69
Advertising and information
The proportion of West Coast residents that have seen, heard, or read advertising about preparing for a disaster is generally consistent with the national average (67% c.f. 56% national average).
West Coast residents are more likely than average to have read advertising on mail flyers, leaflets or pamphlets (9% c.f. 2% national average).
Similar to the national average, 73% of West Coast residents recall having seen a Civil Defence ‘Get Ready Get Thru’ TV advertisement. Those who have seen a Civil Defence TV advertisement are significantly less likely than average to say that the advertisement prompted them to think about preparing for disasters (50% c.f. 65% national average).
ShakeOut
There are no significant differences between West Coast residents and the general population in terms of awareness (74% c.f. 64% national average) and participation (28% c.f. 29% national average) of the ShakeOut event.
Disaster Awareness
Residents from the West Coast are more likely than average to say that a nuclear disaster could occur in NZ in their lifetime (7% c.f. 2% national average), and less likely than average to say that a hurricane, cyclone or storm could occur (27% c.f. 39% national average).
In terms of services that could be disrupted following a disaster, West Coast residents are less likely than average to say that water (69% c.f. 89% national average), sewerage (68% c.f. 86% national average), and gas (52% c.f. 82% national average) could be disrupted.

Colmar Brunton 2012 86Sample size = 69
Disaster Awareness (continued)West Coast residents are significantly less likely than average to think that the following groups or individuals will be able to help them in the event of a disaster:
Fire services (77% c.f. 87% national average)
Police (61% c.f. 83% national average)
Ambulance (59% c.f. 77% national average)
Hospitals (54% c.f. 74% national average)
Army (51% c.f. 69% national average).

Colmar Brunton 2012 87
8%
17%
64%
84%
2012
Fully prepared
Prepared at home
Benchmark 2007 2008 2009
Has a plan
Has survival items 94%
5%
15%
53%
86%
17%
32%
44%
82%
4%
18%
43%
89%
3%
14%
60%*
8%
29%
59%
88%
2010
Preparedness
Compared to last year Otago residents are more likely to be prepared for a disaster at home (35% in 2013 c.f. 17% in 2012).
On the Preparedness Continuum, residents from Otago are less likely than average to have a good understanding of the effects if disaster struck (72% c.f. 83% national average).
Preparedness levels in Otago are significantly lower than average in the following preparedness diagnostic:
You have a good understanding of what the effects would be if a disaster struck in your household (72% c.f. 83% national average)
Advertising and information
The proportion of Otago residents that have seen, heard, or read advertising about preparing for a disaster is generally consistent with the national average (58% c.f. 56% national average).
In line with the national average, 73% of Otago residents recall having seen a Civil Defence Get Ready, Get Thru TV advertisement. Fifty-six percent of residents have previously heard of the tag line ‘Get Ready, Get Thru’ and 48% have previously heard of the website ‘getthru.govt.nz’(both in line with the national average).
Sample size = 65
23%
37%
71%
85%
2011
Significantly different from the 2012 result
17%
35%
56%
80%
2013

Colmar Brunton 2012 88
ShakeOut
There are no significant differences between Otago residents and the general population in terms of awareness (57% c.f. 64% national average) and participation (25% c.f. 29% national average) in the ShakeOut event.
Disaster awareness
Residents from Otago are less likely than average to say that a hurricane, cyclone or storm could occur in NZ in their lifetime (24% c.f. 39% national average), and less likely than average to say that a volcanic eruption could occur (34% c.f. 50% national average).
In terms of services that could be disrupted following a disaster, Otago residents are less likely than average to say that landline telephones (85% c.f. 94% national average), roading (81% c.f. 90% national average), and gas (58% c.f. 82% national average) could be disrupted.
Otago residents are significantly less likely than average to think that the Fire Service will be able to help them in the event of a disaster (77% c.f. 87% national average).
In the event of an earthquake, a significantly higher than average proportion of Otago residents said that people should check damage and ensure everything is stabilised, safe and secure(15% c.f. 6% national average).
Sample size = 65

Colmar Brunton 2012 89
9%
25%
46%
87%
2012
Sample size = 68
Fully prepared
Prepared at home
Benchmark 2007 2008 2009
Has a plan
Has survival items 77%
55%
87%
52%
86%
72%
90%
50%
Sample size too
small
Sample size too
small
Sample size too
small
Sample size too
small
62%
77%
2010
Sample size too
small
71%
91%
2011
20%
38%
Preparedness
On the Preparedness Continuum, residents from Southland are more likely than average to have an understanding and awareness of the types of disaster that can occur (91% c.f. 81% national average).
Preparedness levels in Southland are significantly higher than average in the following preparedness diagnostics:
You have a good understanding of the types of disasters that could occur in New Zealand, and the chances of them occurring (91% c.f. 81% national average)
You attend meetings with community groups about disaster planning (19% c.f. 10% national average).
They are more likely to have an emergency survival plan for home only than New Zealander residents in general (51% c.f. 30% national average), but are less likely than average to have an emergency plan that includes while they are away from home (only 12% c.f. 27% national average).
Advertising and information
The proportion of Southland residents that have seen, heard, or read advertising about preparing for a disaster is in line with the national average (59% c.f. 56% national average).
Similar to the national average, 70% of Southland residents recall having seen a Civil Defence TV advertisement (compared with 68% national average). Fifty-one percent have previously heard of 'Get Ready, Get Thru‘, and 41% have heard of getthru.govt.nz (both in line with national average).
Significantly different from the 2012 result
9%
29%
63%
93%
2013

Colmar Brunton 2012 90Sample size = 68
ShakeOutSimilar to the national average, 70% of Southland residents are aware of the ShakeOut event (64% for all New Zealand residents). However, they less likely to have taken part in the event (47% did not take part c.f. 34% national average).
Disaster awarenessSouthland residents are less likely than average to think that a volcanic eruption could occur in NZ in their lifetime (31% c.f. 50% national average).
They are also less likely to agree that it is their responsibility to look after themselves and family in a disaster (92% c.f. 98% national average).
When it comes to the type of household utilities or infrastructure services that could be disrupted by a disaster, significantly fewer than average think that gas (63% c.f. 82% national average), and water (78% c.f. 89% national average) could be disrupted. But significantly more residents think that access to medical and health services (96% c.f. 87% national average) could be disrupted.
Southland residents are also significantly more likely than average to get information on how to prepare for a disaster from the Civil Defence (15% c.f. 5% national average).
In the event of a tsunami, a higher proportion of Southland residents said that people should move inland (29% c.f. 17% national average) and check pets (11% c.f. 4% national average).
Similarly, in the event of an earthquake, the proportion that said people should check for damage and ensure everything is stabilised, safe and secure, is higher than average (13% c.f. 6% national average).
Top Related