


Languages
Pages
Legal

10/15/2014
1
experience momentum //
CPAs & ADVISORS
Tennessee Primary Care Association: 2014 Annual Leadership Conference
October 23, 2014
SETTING YOUR ORGANIZATION UP FOR SUCCESS: UNDERSTANDING THE COMPLEXITIES OF THE FQHC REVENUE CYCLE
The following information was used as visual aid during a presentation/training session led by a BKD, LLP advisor. This content was not designed to be utilized without the verbal portion of the presentation. Accordingly, information included on these slides, in some cases, are only
partial lists of requirements, recommendations, etc. and should not be considered comprehensive. These materials are being issued with the
understanding they must not be considered legal advice.
2 //
10/15/2014
2
CONTAINING COSTS
3 //
THE REVENUE CYCLE
4 //
10/15/2014
3
5 //
6 //
10/15/2014
4
BILLING & COLLECTIONS
Health Center programs must:
• Maintain adequate cash flow to support operations
• Maximize revenue from non-Federal sources
• Have systems in place to maximize collections & reimbursement for its costs in providing health services, including written billing, credit & collection policies & procedures. (Section 330(k)(3)(F) & (G) of the PHS Act)
7 //
BILLING & COLLECTIONS, CONT.
Revenue maximization requires • An adequate & competitive fee schedule
• A corresponding schedule of discounts
• Prompt & accurate billing of third-party payers
• Billing of patients in accordance with the schedule of discounts
• Timely follow-up on all uncollected amounts
8 //

10/15/2014
5
BILLING & COLLECTIONS, CONT.
Process necessary to ensure that federal grant resources address true financial access barriers to the maximum degree possible
Health Centers are expected to utilize information to monitor performance compared to internal & external benchmarks, as well as for tracking trends
9 //
THE REVENUE CYCLE
Charge structure
Patient scheduling
Patient registration
Pre-appointment activities
Patient flow
Charge capture & entry
Third-party billing
Denial management
Patient collections
10/15/2014
6
DO ALL OF THE PIECES FIT?
11 //
KEY AREAS FOR FRONT DESK SUCCESS
1. Recruitment & retention
2. Training
3. Customer service
4. Telephone
5. Patient scheduling

10/15/2014
7
KEY AREAS FOR FRONT DESK SUCCESS, CONT.
6. Patient registration
7. Time of Service (TOS) collections
8. Patient checkout
9. Management
10. Communication
13 //
PATIENT COLLECTIONS IN A COMMUNITY HEALTH CENTER
14 //
10/15/2014
8
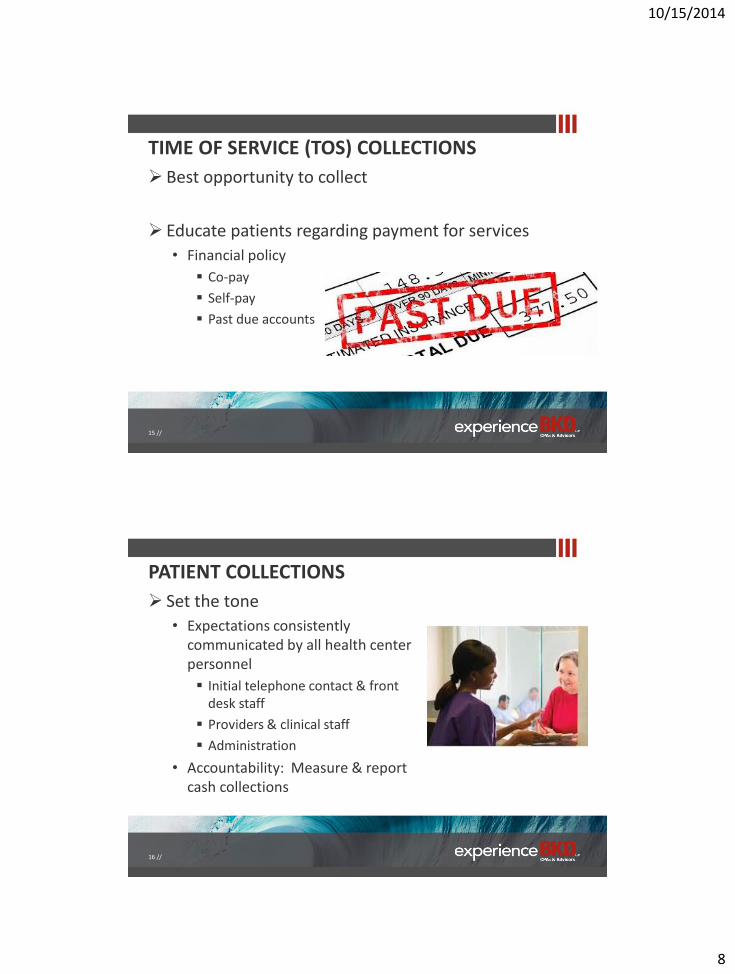
TIME OF SERVICE (TOS) COLLECTIONS
Best opportunity to collect
Educate patients regarding payment for services
• Financial policy
Co-pay
Self-pay
Past due accounts
15 //
PATIENT COLLECTIONS
Set the tone
• Expectations consistently communicated by all health center personnel
Initial telephone contact & front desk staff
Providers & clinical staff
Administration
• Accountability: Measure & report cash collections
16 //
10/15/2014
9
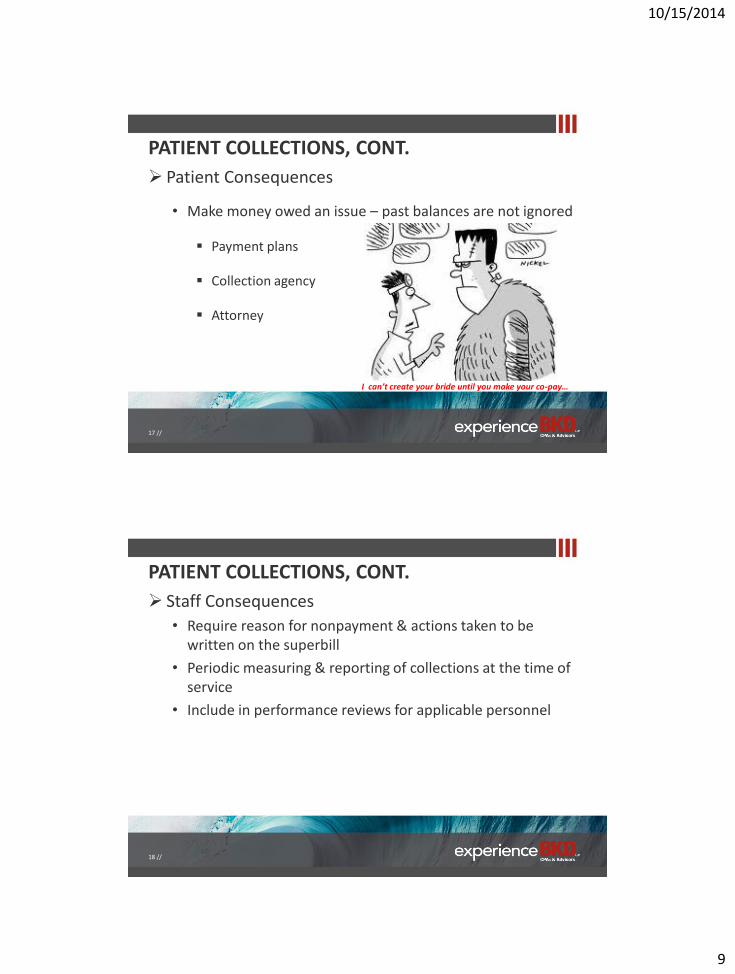
PATIENT COLLECTIONS, CONT.
Patient Consequences
• Make money owed an issue – past balances are not ignored
Payment plans
Collection agency
Attorney
I can’t create your bride until you make your co-pay…
17 //
PATIENT COLLECTIONS, CONT.
Staff Consequences
• Require reason for nonpayment & actions taken to be written on the superbill
• Periodic measuring & reporting of collections at the time of service
• Include in performance reviews for applicable personnel
18 //
10/15/2014
10
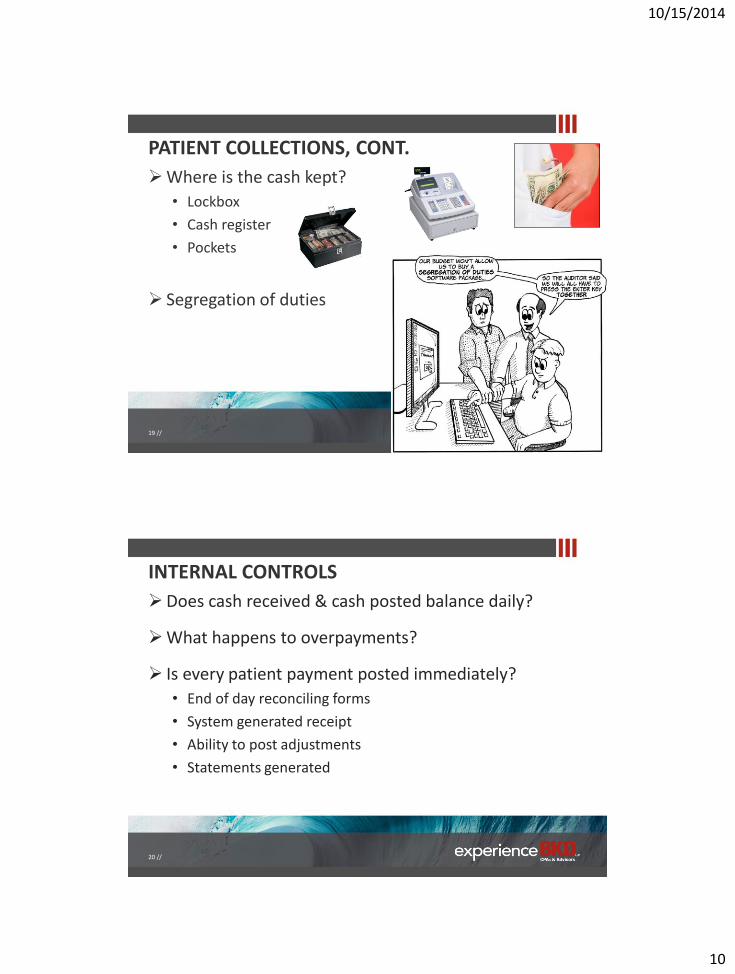
PATIENT COLLECTIONS, CONT.
Where is the cash kept?
• Lockbox
• Cash register
• Pockets
Segregation of duties
19 //
INTERNAL CONTROLS
Does cash received & cash posted balance daily?
What happens to overpayments?
Is every patient payment posted immediately?
• End of day reconciling forms
• System generated receipt
• Ability to post adjustments
• Statements generated
20 //
10/15/2014
11
PATIENT COLLECTIONS, CONT.
After the visit
• Accuracy
• Understandable statements
• Speed
• Follow-up
21 //
PATIENT COLLECTIONS, CONT.
In-house collection efforts
• Daily productivity target per FTE
• 45 to 70 accounts worked
• Can use 70 contacts per FTE per day as a reasonable expectation
• On average it takes 2.5 contacts to achieve account resolution
22 //
10/15/2014
12
IMPACT OF CLINICAL PROCESSES
23 //
IMPACT OF CLINICAL PROCESSES ON REVENUE
Scheduling • Highly restricted patient types & times • Acute patient/same day scheduling process • Volume
Charge tickets/Electronic Health Record (EHR)
• Accuracy & completeness • Timeliness of completion • Legibility (if by paper)
24 //
10/15/2014
13
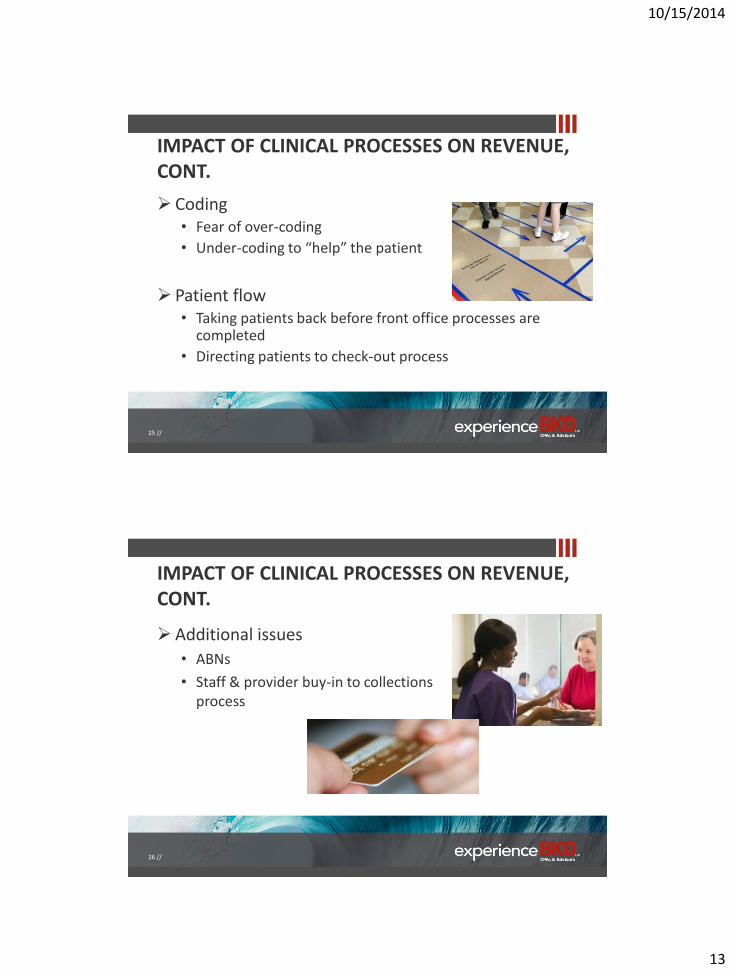
IMPACT OF CLINICAL PROCESSES ON REVENUE, CONT.
Coding • Fear of over-coding
• Under-coding to “help” the patient
Patient flow • Taking patients back before front office processes are
completed
• Directing patients to check-out process
25 //
IMPACT OF CLINICAL PROCESSES ON REVENUE, CONT.
Additional issues
• ABNs
• Staff & provider buy-in to collections process
26 //
10/15/2014
14
BENCHMARKING FOR IMPROVED PERFORMANCE
27 //
KEY ATTRIBUTES OF SUCCESSFUL BILLING DEPARTMENTS
Understand each piece of the revenue cycle
Defined responsibilities
Effective communication
Leverage technology
Written policies & procedures
Comprehensive training
28 //
10/15/2014
15
KEY ATTRIBUTES OF SUCCESSFUL BILLING DEPARTMENTS
Individual accountability
Appropriate staffing
Competent management
Monitoring tools
Feedback & recognition
Adaptability
29 //
KEY PERFORMANCE INDICATORS (KPIs)
What is the revenue cycle?
• Begins with appointment scheduling & ends with payment resulting in zero balance due
How do I know if we are doing a good job?
30 //
10/15/2014
16
PRACTICE MANAGEMENT SYSTEMS
“Most practices only use 50% of their system’s capabilities?”
Utilizing staff hours instead of automation
31 //
STAFFING
Staffing levels • Better performing practices actually have
higher billing staffing than others
Total business operations support staff FTE per
physician
o Better performers: 1.21*
o Others: 0.97*
Total support staff cost per FTE physician
o Better performers: $278,121*
o Others: $203,334*
* Source: MGMA Performance & Practices of Successful Medical Groups, 2013 Report based on 2012 data (Multispecialty, All Practices)
32 //
10/15/2014
17
STAFFING, CONT.
Feedback & recognition • Staff, department &
organization receive feedback regularly
• Improvements are celebrated
Adaptability • Continuous research & education
• Open to changing processes
33 //
TRAINING PROGRAM
Comprehensive training
• Practice management system is just a component
• On-the-Job (OTJ) training should be a part, not the entirety
• Effective trainer
• Written training materials
• Dedicated time
• Competency assessments
34 //
10/15/2014
18
TRAINING PROGRAM, CONT.
Written, compliance driven policies & procedures • Undocumented = leaves room for interpretation
• Detailed guidance in procedure format Billing third-party payers
Credit balances
Insurance follow-up
Small balance adjustments
Budget plans
Bad address
Patient correspondence
35 //
BILLING PRACTICES Receiving Medicare payments from Part A & B?
Recently reviewed services based on coverage or payment changes? • Initial Preventive Physical Exam (IPPE)
• Diabetes Self-Management Training (DSMT)
• Telehealth
• Medicare Advantage
36 //
10/15/2014
19
BILLING PRACTICES, CONT.
Billing Requirements for FQHC Services • Revenue codes
Define FQHC Services • Encounter understanding
Non Billable Services
• Nurse visits
Non FQHC Services
• Laboratory services
• Technical component
37 //
MISSING REVENUE
Missing Charge Rate: < 1%
• < 1% of charges missed on audit (quarterly) of encounter form to charges entered
• Processes in place to ensure all encounter forms are entered into the practice management system
• Processes in place to ensure no missed offsite visits
38 //
10/15/2014
20
ACCOUNTS RECEIVABLE MANAGEMENT
Who is managing your accounts receivable?
What information do they provide?
What changes have they implemented within the last 60 days?
39 //
ACCOUNTS RECEIVABLE MANAGEMENT, CONT.
Monitoring tools
• Key performance indicators (KPIs)
Monitored & reported to executive management monthly
Feedback provided to staff
Visualization is often beneficial
40 //
10/15/2014
21
ACCOUNTS RECEIVABLE MANAGEMENT, CONT.
Performance indicators
• Average days in accounts receivable (A/R)
Annual revenue divided by 365 days = average daily
revenue
Current accounts receivables divided by average daily
revenue = average days in A/R
Better performers: 27.49*
Others: 44.15*
* Source: MGMA Performance & Practices of Successful Medical Groups, 2013 Report based on 2012 data (Multispecialty, All Practices)
41 //
ACCOUNTS RECEIVABLE MANAGEMENT, CONT.
• Percent of total A/R over 90 days old Better performers: 14.17%*
Others: 32.04%*
• Adjusted fee-for-service (FFS) collections Better performers: 99.16%*
Others: 96.02%*
• Gross FFS collections Better performers: 57.42%*
Others: 46.77%*
* Source: MGMA Performance & Practices of Successful Medical Groups, 2013 Report based on 2012 data (Multispecialty, All Practices)
42 //
10/15/2014
22
ACCOUNTS RECEIVABLE MANAGEMENT, CONT. • Percent of claims billed electronically
Best practice & average: 95%*
• Days to charge entry
Best practice & average: Same day or 24 hours
• Days to claim submission
Best practice & average: 2 days
• Bad debt due to FFS activity per FTE physician
Better performers: $9,685*
Others: $24,998*
* Source: MGMA Performance & Practices of Successful Medical Groups, 2013 Report based on 2012 data (Multispecialty, All Practices)
43 //
ACCOUNTS RECEIVABLE MANAGEMENT, CONT.
Measure performance to determine success
Set goals for financial performance related to the revenue cycle
Various performance indicators
44 //
10/15/2014
23
ACCOUNTS RECEIVABLE FOLLOW-UP
Is your denial rate close to benchmark?
What happens when a claim is not paid?
How many outstanding claims do you have?
What guidance is provided to staff on prioritization of claims?
45 //
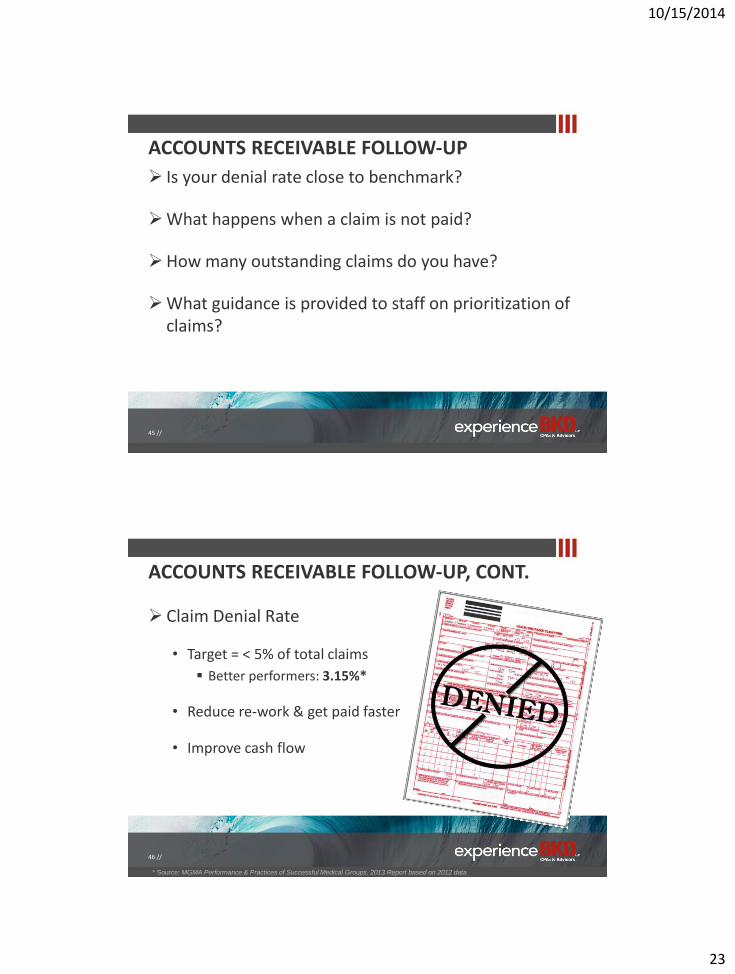
ACCOUNTS RECEIVABLE FOLLOW-UP, CONT.
Claim Denial Rate
• Target = < 5% of total claims
Better performers: 3.15%*
• Reduce re-work & get paid faster
• Improve cash flow
* Source: MGMA Performance & Practices of Successful Medical Groups, 2013 Report based on 2012 data
46 //
10/15/2014
24
ACCOUNTS RECEIVABLE FOLLOW-UP, CONT.
Prevention is key
• Monitoring denials is an ongoing basis
• Provide feedback to staff, providers & management
• Implement changes as appropriate
• Re-educate staff & providers collectively & individually
47 //
ACCOUNTS RECEIVABLE FOLLOW-UP, CONT.
Sample follow-up policies – do you have something similar?
1. Claim submitted to commercial insurance
2. After 45 days, check claim status online or call. Resubmit, if necessary.
3. After 65 days, telephone call to payer with notes documented on account, move to patient due, if applicable.
48 //
10/15/2014
25
ACCOUNTS RECEIVABLE FOLLOW-UP, CONT.
“Unresolved claim” policy
• In theory, either a third-party or the patient should pay every claim
• Practically, it is not cost efficient to resolve every unpaid claim
49 //
ACCOUNTS RECEIVABLE FOLLOW-UP, CONT.
Staff productivity indicators
• Outstanding claim follow-up
Approximately 800 – 1,000 claims per month
50 //
10/15/2014
26
ACCOUNTS RECEIVABLE FOLLOW-UP, CONT.
In-house collection efforts
• Daily productivity target per FTE
• 45 to 70 accounts worked
• Can use 70 contacts per FTE per day as a reasonable expectation
• On average it takes 2.5 contacts to achieve account resolution
51 //
ACCOUNTS RECEIVABLE FOLLOW-UP, CONT.
In-house collection efforts, cont.
• Low dollar high volume accounts
• Two methods of sizing the collection effort
Dollar amounts to be collected (e.g., over $75, $100, $200, etc.)
Available staff
52 //
10/15/2014
27
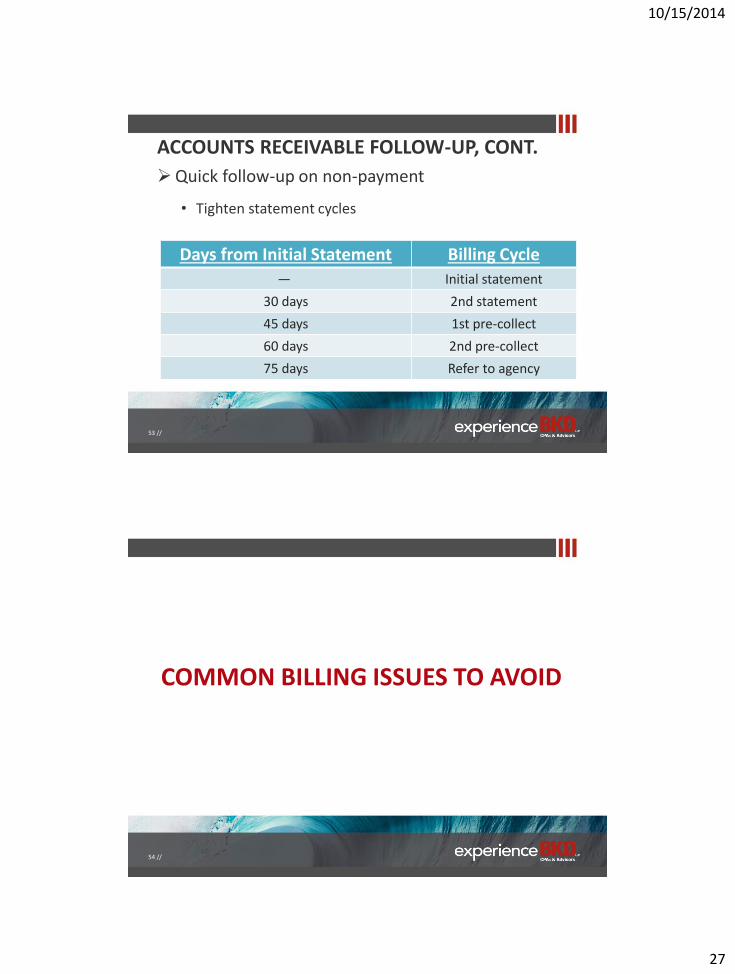
ACCOUNTS RECEIVABLE FOLLOW-UP, CONT.
Quick follow-up on non-payment
• Tighten statement cycles
Days from Initial Statement Billing Cycle
― Initial statement
30 days 2nd statement
45 days 1st pre-collect
60 days 2nd pre-collect
75 days Refer to agency
53 //
COMMON BILLING ISSUES TO AVOID
54 //
10/15/2014
28
COMMON BILLING ISSUES Failure to verify insurance
Incorrect patient information
Upcoding (downcoding)
Unbundling (bundling)
Documentation not supporting code(s) • Lack of documentation
• Lack of medical necessity
• Incorrect modifier usage
• Wrong diagnosis or procedure code
Duplicate claims
55 //
BILLING & CODING COMMON SENSE
If it wasn’t documented, it wasn’t done.
If it wasn’t done, it can’t be billed.
If the service isn’t necessary, it won’t be provided.
If you weren’t there, your name won’t appear in the medical record or on the claim.
If your physician is offered money or gifts to prescribe drugs, refer patients, or order procedures/tests, decline.
56 //
10/15/2014
29
MEDICARE REGULATIONS: LIVING IN THE PRESENT &
PLANNING FOR THE FUTURE
57 //
EXAMPLE COMPLIANCE AGENCIES Comprehensive Error Rate Testing Program (CERT)
Medicaid Integrity Contractors (MICs) • Education MICs
• Review MICs
• Audit MICs
Recovery Audit Contractor (RAC) • Includes State Medicaid RAC audits & Medicaid Fraud Control Units
Zoned Program Integrity Contractors (ZPICs) • Formerly known as Program Safeguard Contractors (PSCs)
Health Care Fraud Prevention & Enforcement Action Team (HEAT)
Office of Inspector General (OIG)
58 //
10/15/2014
30
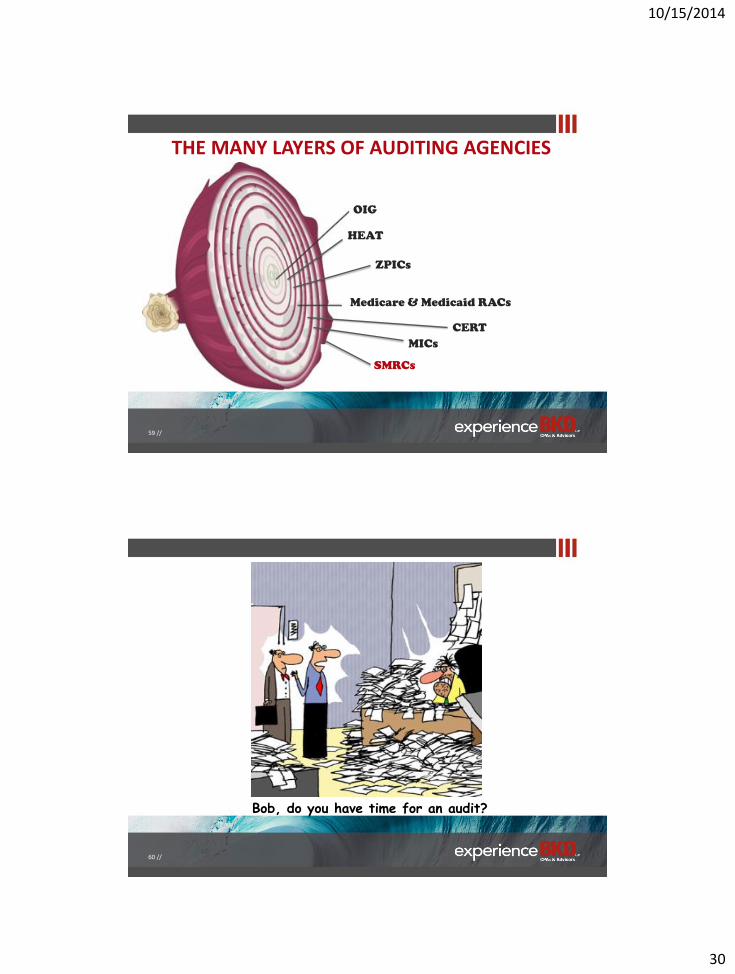
THE MANY LAYERS OF AUDITING AGENCIES
OIG
Medicare & Medicaid RACs
SMRCs
HEAT
ZPICs
CERT
MICs
59 //
Bob, do you have time for an audit?
60 //
10/15/2014
31
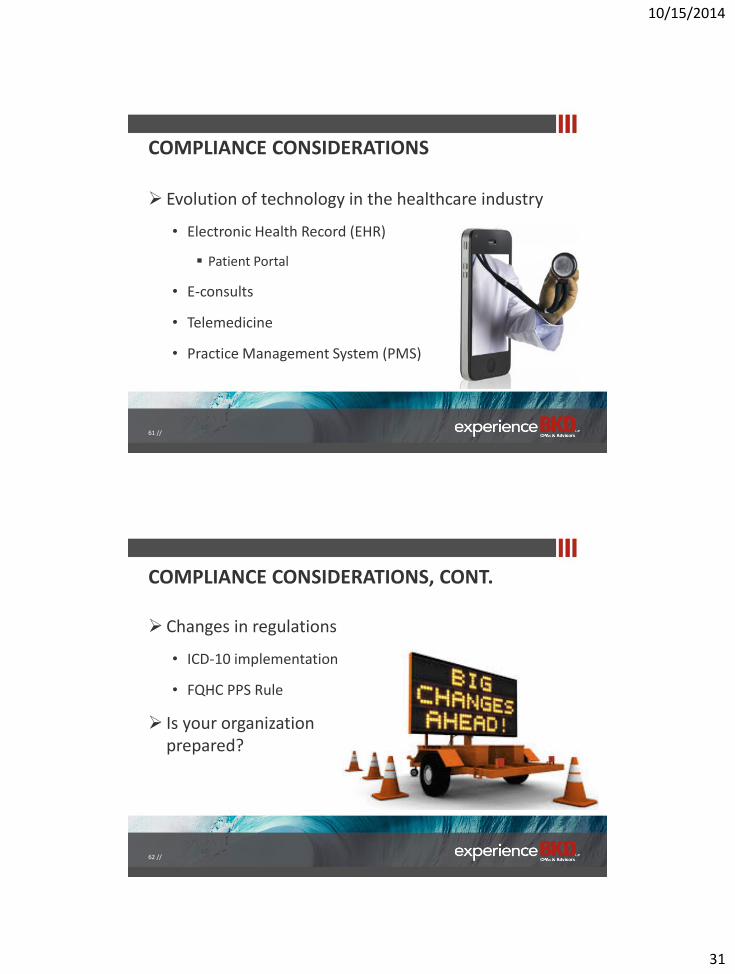
COMPLIANCE CONSIDERATIONS
Evolution of technology in the healthcare industry
• Electronic Health Record (EHR)
Patient Portal
• E-consults
• Telemedicine
• Practice Management System (PMS)
61 //
COMPLIANCE CONSIDERATIONS, CONT.
Changes in regulations
• ICD-10 implementation
• FQHC PPS Rule
Is your organization prepared?
62 //
10/15/2014
32
QUESTIONS
63 //
THANK YOU
64 // experience momentum
910 E. St. Louis St.
Springfield, MO 65801-1190
Monique D. Funkenbusch, CPC
Managing Consultant
Office: 417.865.8701
Fax: 417.865.0682
www.bkd.com
10/15/2014
33
DISCLOSURE
Information contained in this presentation is informational only & is not intended to instruct hospitals & physicians on how to use, or bill for health care procedures. Providers should consult with their respective insurers, including Medicare fiscal intermediaries & carriers, for specific information on proper coding & billing for health care procedures. Additional information may be available from physician specialty societies & hospital associations. Information contained in this presentation is not intended to cover all situations or all payers' rules & policies. Reimbursement laws, regulations, rules & policies are subject to change.
65 //
Top Related