


Languages
Pages
Legal


Power Integrations, Inc.Nasdaq: POWI
May 2013

© Copyright 2013 Power Integrations 2
Forward-Looking Statements/Non-GAAP Metrics
These slides accompany an oral presentation by Power Integrations, Inc., which
contains forward-looking statements. Each statement relating to events that will or
may occur in the future is a forward-looking statement. The Company’s actual
results may differ materially from those suggested in the presentation. Information
concerning factors that could cause such a difference is contained in the
Company’s most recent reports on Form 10-K and 10-Q.
This presentation may also contain certain non-GAAP financial information.
Reconciliations of non-GAAP financial metrics to GAAP results are available at
the end of this presentation and/or on the investor page of the Power Integrations
website, http://investors.powerint.com (see “Historical Financials” data file).
© Copyright 2013 Power Integrations 3
Secular Growth Story in Analog Semis
� Leader in bringing integration to high-voltage power conversion
� Energy efficiency driving faster market penetration
� Strong position in LED lighting
� Expanding addressable market with higher-power products and strategic transactions

© Copyright 2013 Power Integrations 4
Highly Integrated Power Supplies Replacing Legacy Technologies
Discrete DVD power supply: 70 components
Equivalent power supply with POWI:36 components, smaller board
Linear transformer: weighs 12 oz.
Adapter with POWI: weighs 2 oz.

© Copyright 2013 Power Integrations 5
� Ultra-simple power supplies• Fewer components
• Shorter design cycles
• Easier to manufacture
• Higher reliability
� BOM cost similar to discrete designs
� Highly energy-efficient
Dimensions of Innovation
© Copyright 2013 Power Integrations 6
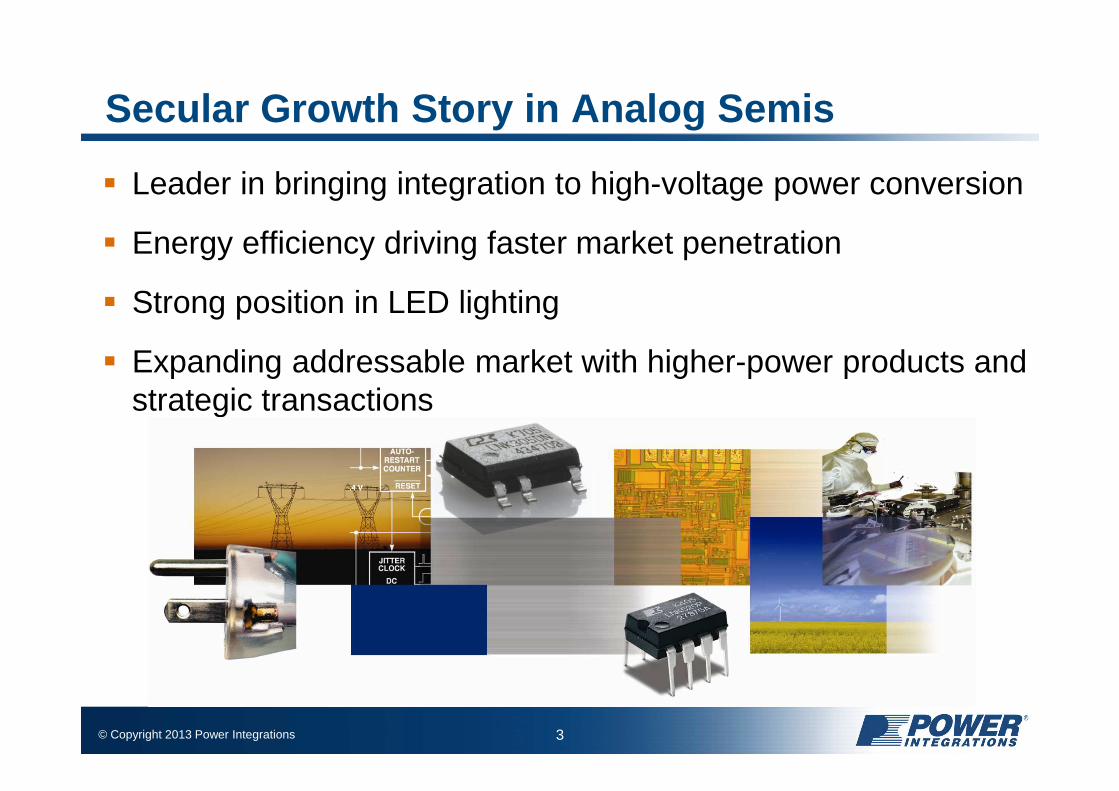
Relentless Innovation
534 U.S. Patents390 Non-U.S. Patents
at 12/31/2012
0
100
200
300
400
500
600
U.S
. Pat
ents
Gra
nted

© Copyright 2013 Power Integrations 7
Broad Addressable Market –Power Conversion Is Needed Everywhere

© Copyright 2013 Power Integrations 8
Long -Term Secular Growth Drivers
1. Ongoing transition to IC-based power supplies• Integration saves labor and materials, improves reliability

© Copyright 2013 Power Integrations 9
Leading Transition to IC -Based Power Supplies
Linear Transformers
1970 1994
Discretes
1994 Today1970
Integrated•Fairchild•Sanken•ST Micro•ON Semi• Infineon POWI
• iWatt•BCD•Active•Leadtrend•OnBright
•Fairchild• Infineon•ON Semi•ST Micro•NXP 80%
20%
Pow
er S
uppl
y U
nit V
olum
e

© Copyright 2013 Power Integrations 10
Long -Term Secular Growth Drivers
1. Ongoing transition to IC-based power supplies• Integration saves labor and materials, improves reliability
2. Energy-efficiency• Driven by standards and consumer awareness

© Copyright 2013 Power Integrations 11
Recognized Leader in Energy Efficiency
� Member of clean-tech stock indices• The Cleantech Index (CTIUS)
• Nasdaq Clean Edge Green Energy (CELS)
• Ardour Global Index (AGIGL)
� Twice named a top 20 sustainable stock by SustainableBusiness.com
� ENERGY STAR® award recipient
� Star of Energy Efficiency award recipient

© Copyright 2013 Power Integrations 12
Energy Specs Continue to Tighten
� New ENERGY STAR® label rewards top performers in designated product categories
� New CEC battery-charger standards in 2013; U.S. to tighten federal standards for external power supplies
� European standby power limitation tightens to 0.5 W as of 2013

© Copyright 2013 Power Integrations 13
“ Zero” Series Zeroes Out Standby Waste
� CAPZero™ eliminates waste from X-cap bleed resistors
� SENZero™ disconnects sense resistors in main power supply
� LinkZero™ cuts waste to 0.00 W in chargers and auxiliary power supplies

© Copyright 2013 Power Integrations 14
Long -Term Secular Growth Drivers
1. Ongoing transition to IC-based power supplies• Integration saves labor and materials, improves reliability
2. Energy-efficiency• Driven by standards and consumer awareness
3. LED lighting• Requires low-cost, efficient, reliable power supplies

© Copyright 2013 Power Integrations 15
Well Positioned in LED Lighting
� Traditional incandescent lights phasing out
� LEDs need efficient, reliable drivers
� Integration, single-stage architecture bring reliability, efficiency, low cost
0
5
10
15
20
25
2007 2008 2009 2010 2011 2012
LED Lighting Revenues ($M)

© Copyright 2013 Power Integrations 16
Long -Term Secular Growth Drivers
1. Ongoing transition to IC-based power supplies• Integration saves labor and materials, improves reliability
2. Energy-efficiency• Driven by standards and consumer awareness
3. LED lighting• Requires low-cost, efficient, reliable power supplies
4. Expanding addressable market to higher power levels• Mid-power (50-500 W) products plus Concept acquisition expand
addressable market by ~$1 billion

© Copyright 2013 Power Integrations 17
Expanding Market with Mid -Power Products
0W 500W5W 50W2W 20W 200W
CAPZero ™/SENZero™/Qspeed ™
Hiper ™ Family
TOPSwitch ™
TinySwitch ™
LinkSwitch ™ / LinkZero ™
LinkSwitch-PL/PH / LYTSwitch ™
LED Products
LOW-POWER MID-POWER

© Copyright 2013 Power Integrations 18
Radically Simplifying Mid -Power Converters
HiperPFS™ and HiperTFS™ replace up to 100 components
HiperTFS + HiperPFS

© Copyright 2013 Power Integrations 19
More Silicon Content at Higher Power Levels
EMI Filter PFC Stage Main and Standby Stage
Main &
Standby
Controller
Boost Inductor
PFC
Controller
EMI Filter
Standby
Output
AC
Gate
Drive
SR
Main
Output
TNY
Before: Single IC for standby power supply
© Copyright 2013 Power Integrations 20
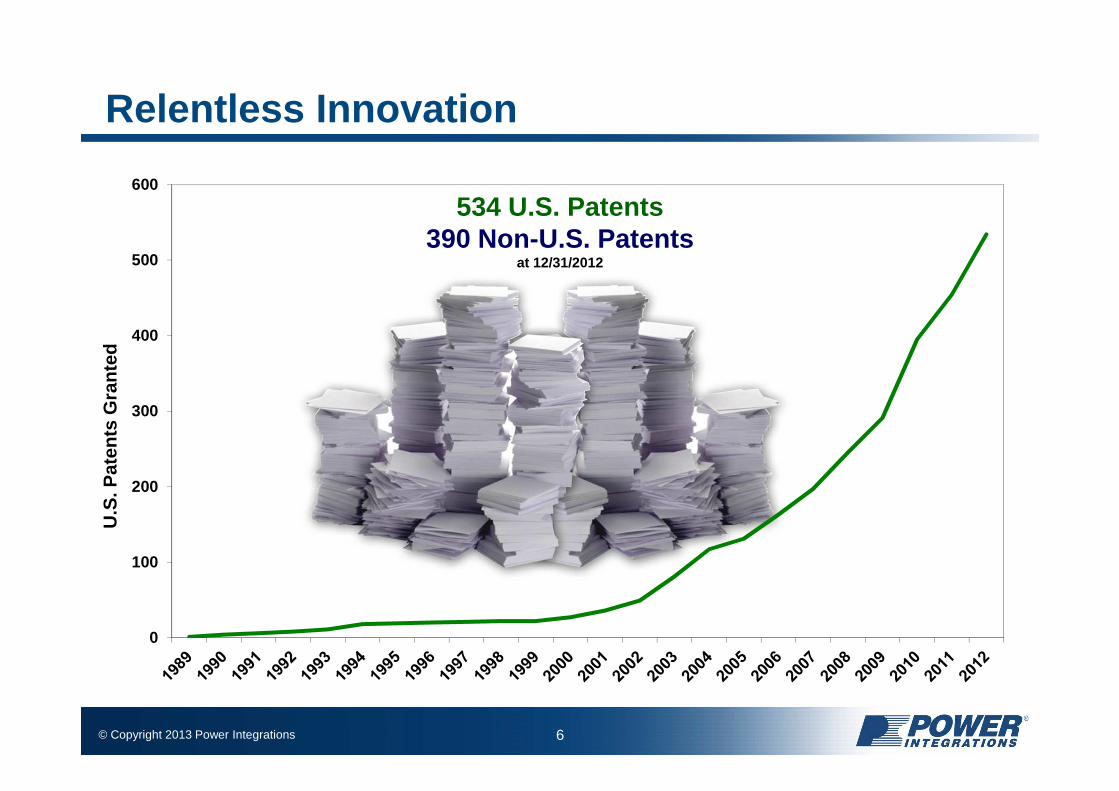
More Silicon Content at Higher Power Levels EMI Filter PFC Stage Main and Standby Stage
Main &
Standby
Controller
Boost Inductor
PFC
Controller
EMI Filter
Standby
Output
AC
HiperPFS
HiperTFS
CpZ
Gate
Drive
SnZ
QSpeed
SR
Main
Output
HiperTFS ™ main + standbyCapZero ™ HiperPFS ™ SenZero ™ Qspeed ™
Now: Up to five components, 5x-10x the dollar content

© Copyright 2013 Power Integrations 21
CONCEPT: Highly Integrated IGBT Drivers
Highly integrated drivers enhance cost, efficiency, size, reliability
� Acquired in May 2012
� Applications: industrial motors, solar/wind power, electric trains and cars
� Addressable market approaching $500M
� Adds ~10% to POWI revenue
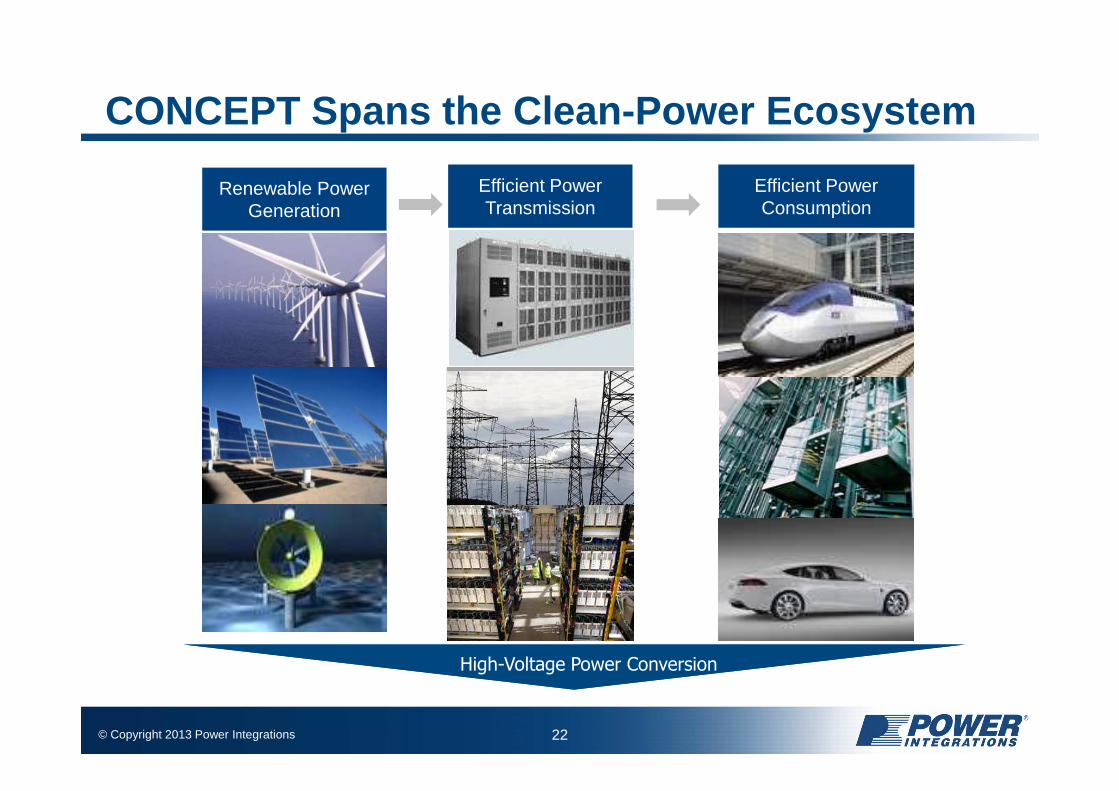
© Copyright 2013 Power Integrations 22
CONCEPT Spans the Clean -Power Ecosystem
High-Voltage Power Conversion
Renewable Power Generation
Efficient Power Transmission
Efficient Power Consumption

© Copyright 2013 Power Integrations 23
Higher-Power Products Expand SAM to $2.5B
● Mobile phone chargers● Cordless phone adapters● Broadband modems● VoIP phones● Wireless routers● Desktop/server standby
● Desktop main● Notebook adapters● LCD monitors● Printers
● White goods● Air conditioners● TV standby / TV main● Small appliances● Set-top boxes● DVD players● Game consoles
● LED general lighting● LED street lights● Smart meters ● Industrial control● UPS● Industrial motor drives● Wind/solar inverters● Electric trains/cars● DC transmission
Consumer
Comms
Computer
Industrial
Mid-power applications in orange
High-power applications in green

© Copyright 2013 Power Integrations 24
Consistent Track Record of Growth
0
40
80
120
160
200
240
280
320
2001 2002 2003 2004 2005 2006 2007 2008 2009 2010 2011 2012
Revenue ($M)

© Copyright 2013 Power Integrations 25
Outperforming the Peer Group
-10%
0%
10%
20%
30%
40%
2007 2008 2009 2010 2011 2012 6-yearCAGR
Annual Revenue Growth POWI
Analog Semis (SIA)

© Copyright 2013 Power Integrations 26
Well Diversified Revenue Mix
25%Consumer
23%Computer
43%Comms
20022012
24%Comms
36%Consumer
28% Industrial
11%Computer
Higher-margin industrial & consumer markets now ~2/3 of revenues; cellphone chargers down from ~40% to less than 15%

© Copyright 2013 Power Integrations 27
Consistent Cash Flow Generation
0
10
20
30
40
50
60
70
80
90
100
2008 2009 2010 2011 2012
Cash Flow from Operations ($M )
Effect of one-time tax payment
© Copyright 2013 Power Integrations 28
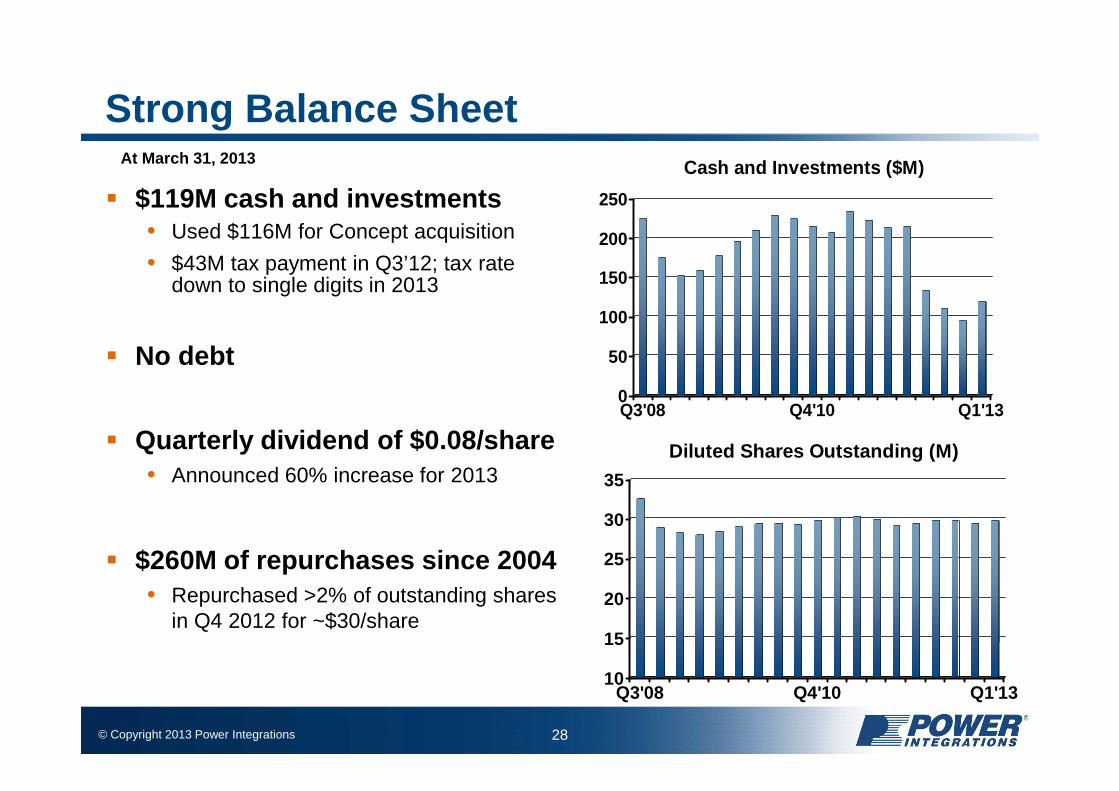
Strong Balance Sheet
� $119M cash and investments• Used $116M for Concept acquisition
• $43M tax payment in Q3’12; tax rate down to single digits in 2013
� No debt
� Quarterly dividend of $0.08/share• Announced 60% increase for 2013
� $260M of repurchases since 2004• Repurchased >2% of outstanding shares
in Q4 2012 for ~$30/share
0
50
100
150
200
250
Q3'08 Q4'10 Q1'13
Cash and Investments ($M)
10
15
20
25
30
35
Q3'08 Q4'10 Q1'13
Diluted Shares Outstanding (M)
At March 31, 2013

© Copyright 2013 Power Integrations 29
Prudently Returning Cash to Stockholders
15
20
25
30
35
2004 2013
Shares Outstanding (M)
� $260M of share repurchases since 2004
� Avg. price of repurchased shares: ~ $23
� 6% net reduction in outstanding shares (February 2004 to February 2013)
� 13th “most profitable” buyback since 2000 (The Buyback Monitor, July 2011*)
*Survey period January 2000 through March 2011; included 252 companies

Power Integrations, Inc.Nasdaq: POWI
Top Related