


Languages
Pages
Legal

Working paper
Potato Traders in West Bengal
A Survey of Contractual Relations and Market Structure
Dilip Mookherjee Sujata Visaria Pushkar Maitra Alberto Motta Sandip Mitra June 2012

March 2013 Project Report for RA-2012-06-012 "Potato Traders in West Bengal: A Survey of Contractual Relations and Market Structure
Dilip Mookherjee Boston University. [email protected] (Lead Investigator) Sujata Visaria, Hong Kong University of Science and Technology. [email protected] Pushkar Maitra, Monash University. [email protected] Alberto Motta, University of New South Wales. [email protected] Sandip Mitra, Indian Statistical Institute Kolkata. [email protected]
Introduction
Our study consists of a pilot survey of a random sub-set of phorias (middlemen) and larger
traders who operate in 72 villages of West Medinipur and Hugli districts and their
corresponding potato markets. Our goal is to understand the nature of contractual relations
between farmers and phorias on the one hand, and between phorias and wholesale traders
that they sell to on the other hand. The surveys will enable us to obtain systematic
information on market structure, trader costs and profits, entry barriers, contractual relations
across successive layers of the supply chain, and the nature of competition at each layer.
Eventually the hope is that we will obtain a richer understanding of the organization of these
bottom-most layers of the supply chain, that will both explain magnitudes of observed
margins and pass-through of external price shocks to farmer earnings, as well as enable us to
predict the effect of various policies intended to enhance efficiency of the supply network and
pass-through to farmers.!
Context: Potato Markets in West Bengal!
The state of West Bengal accounts for about a third of the total volume of potatoes produced
in India. It is the leading crop in the two districts in our study: Hugli and West Medinipur.
The large majority of farmers sell their potatoes to local traders (known as phorias) who re-
sell them in neighbouring wholesale markets (mandis) to larger traders. These large traders in
turn sell them in the large retail markets in the capital, Kolkata or in neighbouring states such
as Orissa and Andhra Pradesh.
Potatoes are a winter crop; they are planted between October and December, and harvested
between January and March. They are storable, so not all potatoes harvested need to be sold
upon harvest. Farmers have the option of placing potatoes in home stores (from where they
would have to be sold within two or three months) or in cold stores, where they can survive
until October, when the new planting season begins. In data collected (by a subset of the

current authors) for a related study in 2011, 64 percent of the amount produced was sold
immediately upon harvest, about 12 percent was put into home stores, and about 18 percent
was put into cold stores.
The predominant method to sell potatoes is to sell to local intermediaries. The bulk of potato
sales by farmers are to phorias, who are small self-employed traders or commission agents of
wholesalers operating within the village, or in neighboring villages and local markets. A
small fraction (less than 10 percent) is sold to money lenders or in a retail market.
Motivation: Previous findings on the non-effect of price information provision!
The results emerging from previous research (by Mitra, Mookherjee, Torrero and Visaria
(2012) partly funded by the IGC) conducted in 72 villages in two districts of West Bengal,
India indicate that (a) middleman margins in 2008 were substantial, amounting to between
55% to 100% of the farmgate prices, and (ii) despite the existence of substantial asymmetric
information between middlemen and farmers regarding prices prevailing in wholesale and
external retail markets, providing farmers with information about these prices had no
significant average treatment effects on the prices that farmers received. Fafchamps and
Minten (2012) report similar findings from Western India. Our previous research also shows
that the margins earned by the phorias cannot be explained as insurance premiums.
Our previous research explained the inability of informational treatments to enable farmers
earn a higher price from phorias by a model of ex post bargaining with limited competition
across different phorias. When a phoria makes a price offer, the only outside option of the
farmer is to take the crop to a local market outside the village and sell to a different phoria
there. It leaves open the question why there is not greater competition between different
phorias operating within the village. Or why farmers cannot sell directly to a wholesale buyer.
Numerous field visits and interviews indicate that farmers cannot sell directly to wholesale
buyers at the potato mandi (wholesale market), and expect to receive the prevailing mandi
price that phorias get. A phoria can buy potatoes from a farmer and immediately resell to a
wholesaler at a substantially higher price, raising the question why wholesalers do not buy
from farmers directly.
Anecdotes and farmer interviews suggest problems of reputation and trust prevent
wholesalers from trading directly with farmers. The role of the phoria seems partly to
overcome these. Wholesaler traders do not have the time and detailed social capital required
to select individual farmers, negotiate with them and inspect the potatoes supplied. They

delegate this task to the middleman phoria. The margins earned by the latter are then a rent
earned with respect to their knowledge and experience in identifying reliable suppliers, and
effort they spend in inspecting supplies.
Possible Hypotheses to be Explored
Nevertheless there still ought to be scope for different phoria to compete with one another in
making price offers to farmers. With unrestricted Bertrand price competition, all middlemen
rents ought to vanish, whence wholesale price changes would pass through to farmers. Why
does this not happen? This is the principal motivation for the current project. We would like
to examine the relative plausibility of a number of possible explanations:
a) Market concentration, collusion and trader profits: The market structure on the phoria
side could be highly concentrated, owing to high entry barriers or economies of scale in
services provided by phorias such as transport, inspection or handling. Even if there are a
number of different phorias in the village that could potentially compete with one another,
they may engage in tacit or explicit price collusion. Or perhaps traders incur high costs of
providing services, so their gross margins do not translate into significant profit margins
(analogous to Aleem’s (1990) study of informal credit for cotton farmers in Pakistan).
b) Asymmetric information about farmer reliability and contractual lock-in: Farmers could
vary with respect to their reliability of supplies. Established phorias may have acquired
information privately about farmer reliability from past dealings. They may be able to
earn positive profits from high quality suppliers by locking them into long term
relationships and/or providing them selective price or service benefits (as in Ghosh and
Ray (1996), or in our study of microfinance in these villages (Maitra, Mitra, Motta,
Mookherjee and Visaria, 2012).
c) Search frictions: Phorias and farmers might incur significant search costs to find each
other, whence phoria profit margins would arise owing to temporary lock-in resulting
from these frictions (as in Antras and Costinot (2011) or Chau, Goto and Kanbur (2011)).
d) Reputation rents: If wholesalers are concerned about reliability of potatoes supplied to
them, they may decide to buy only from phoria that they trust, i.e., those with a reliable
market reputation. Phoria profits could then be reputational rents, necessary to induce
them to screen farmers, inspect their potatoes and provide reliable supplies to wholesalers,
as in Bardhan, Mookherjee and Tsumagari (2010). In the latter theory, phoria are price-
takers. Entry into the phoria business requires sufficient capital and/or managerial
capacity to achieve a certain minimum turn over, hence the supply of entrants is restricted.
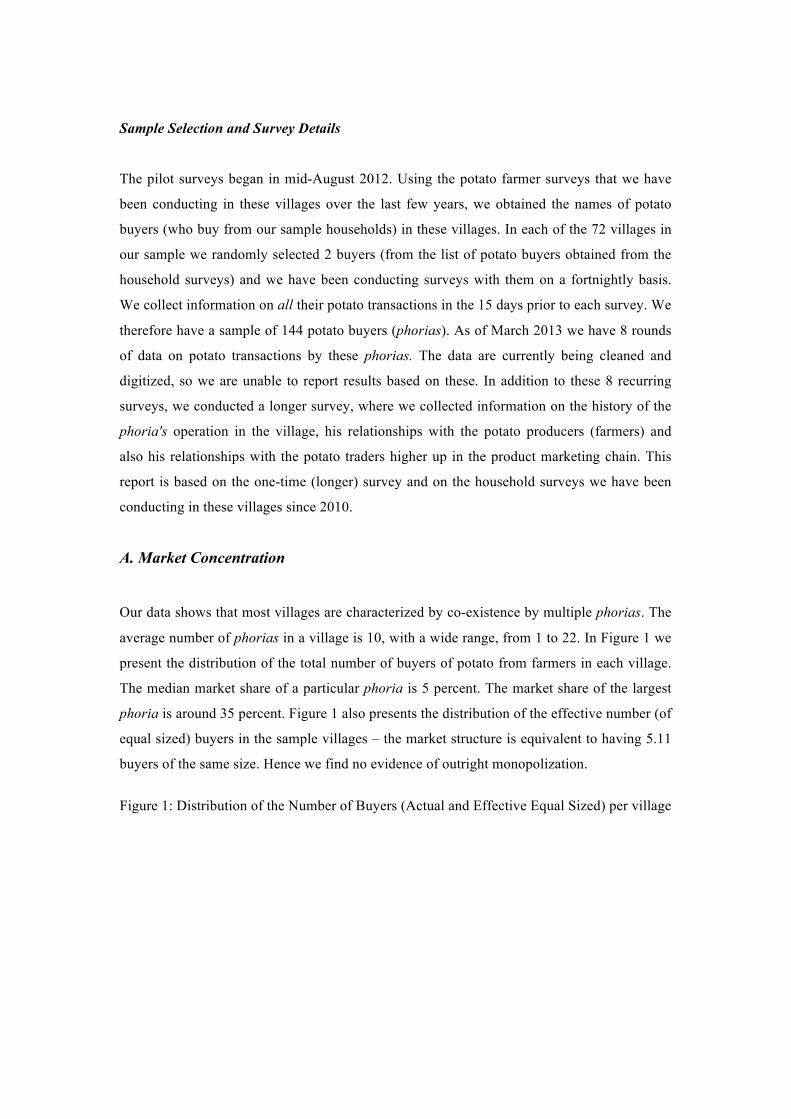
Sample Selection and Survey Details
The pilot surveys began in mid-August 2012. Using the potato farmer surveys that we have
been conducting in these villages over the last few years, we obtained the names of potato
buyers (who buy from our sample households) in these villages. In each of the 72 villages in
our sample we randomly selected 2 buyers (from the list of potato buyers obtained from the
household surveys) and we have been conducting surveys with them on a fortnightly basis.
We collect information on all their potato transactions in the 15 days prior to each survey. We
therefore have a sample of 144 potato buyers (phorias). As of March 2013 we have 8 rounds
of data on potato transactions by these phorias. The data are currently being cleaned and
digitized, so we are unable to report results based on these. In addition to these 8 recurring
surveys, we conducted a longer survey, where we collected information on the history of the
phoria's operation in the village, his relationships with the potato producers (farmers) and
also his relationships with the potato traders higher up in the product marketing chain. This
report is based on the one-time (longer) survey and on the household surveys we have been
conducting in these villages since 2010.
A. Market Concentration
Our data shows that most villages are characterized by co-existence by multiple phorias. The
average number of phorias in a village is 10, with a wide range, from 1 to 22. In Figure 1 we
present the distribution of the total number of buyers of potato from farmers in each village.
The median market share of a particular phoria is 5 percent. The market share of the largest
phoria is around 35 percent. Figure 1 also presents the distribution of the effective number (of
equal sized) buyers in the sample villages – the market structure is equivalent to having 5.11
buyers of the same size. Hence we find no evidence of outright monopolization.
Figure 1: Distribution of the Number of Buyers (Actual and Effective Equal Sized) per village

The available data also allow us to compute aggregate measures of competitiveness in the
potato market in each village: the Herfindahl Index (H), computed as !!!!!!! , where !! is the
market share of trader i defined over the volume purchased and N is the number of buyers in
the village. Panel A in Figure 2 presents the distribution of the H index in the set of sample
villages. The peak of the distribution is attained at around 0.2. We find that the market
structure is equivalent to having 5.11 buyers of the same size. Panel B in Figure 2 presents the
distribution of normalized H index, computed as !∗ = !! ! !!! ! !
, which tells a similar story.
Figure 2: Distribution of H and Normalized H Index Panel A: H Index Panel B: Normalized H Index
Phorias typically operate in multiple villages – the number of villages each phoria operates in
varies from 1 – 11, with an average of 4.6 villages on average. Figure 3 presents the
distribution of the number of villages each phoria operates in. The peak of the distribution is
attained at 6 villages. More than 25 percent of phorias operate in 6 or more villages.
Figure 3: Distribution of the Number of Villages each Phoria Operates in
0.0
5.1
.15
.2Ke
rnel
Den
sity
Est
imat
es
0 5 10 15 20 25Number
Actual Number of Buyers Effective Number of Buyers
01
23
4D
ensi
ty
0 .2 .4 .6 .8 1H index Share of Volume Purchased
kernel = epanechnikov, bandwidth = 0.0435
Quantity
02
46
Den
sity
0 .1 .2 .3 .4 .5Normalized H index Share of Volume Purchased
kernel = epanechnikov, bandwidth = 0.0259
Quantity

Each village has on average 9.5 phorias operating during harvest season and 5 phorias
operating in the post-harvest season. However the distribution of the number of phorias
operating during harvest and in the post-harvest period are similar (see Figure 4). There is
also a great deal of variation in the volume of purchases (measured by the number of packets
or 50 kg bags) made by each phoria in a particular village – i.e., in the scale of operation in
each village. This ranges from 22 – 20000 during the harvest period (with an average of 2600
packets) to 15 – 10000 during the post-harvest period (with and average of a little more than
1100 packets).
Figure 4: Histogram of the Number of Phorias Operating in Each Village
Each phoria buys from a large number of farmers, ranging from 6 to more than 300. Panel A
in Figure 5 presents the histogram of the number of farmers each phoria buys from. The
distribution is bimodal – while almost 50 percent of phorias buy from 100 farmers or less, 20
percent of phorias buy from more than 250 farmers. Conversely each farmer also sells to a
0.0
5.1
.15
.2.2
5De
nsity
0 5 10 15Number of Villages Operating In
kernel = epanechnikov, bandwidth = 0.5996
Kernel density estimate
020
4060
Perc
ent
1 2 3Number of phorias
Categories: 1 = 1-10; 2 = 11-20; 3 = 20+
Harvest
020
4060
Perc
ent
1 2 3Number of phorias
Categories: 1 = 1-10; 2 = 11-20; 3 = 20+
Post Harvest

large number of traders, varying from 1 to 90 traders. Panel B in Figure 5 shows that the
majority of phorias sell to at most 10 traders, and on average they sell to 4 traders. Hence,
these markets do not show any overt signs of monopsonization, with farmers locked into
selling to a particular phoria and phorias locked into selling to a particular trader/wholesaler.
It is better characterized as a network of buyers and sellers, with each agent having multiple
trading partners on the other side of the market. Given the large number of phorias operating
in each village, it is not surprising that the market share of each phoria in a particular village
is relatively small – both in the harvest and the post-harvest season the majority of the phorias
have a market share of 10 percent or less.
Figure 5: Histogram of the Number of Farmers each Phoria buys from and Number of Traders each Phoria sells to
Figure 6: Histogram of the number of Phorias each trader buys from during and post harvest
period
020
4060
80Pe
rcen
t
1 2 3 4 5 6Number Buying from
Categories: 1 = 1-50; 2 = 51-100; 3 = 101-150; 4 = 151-200; 5 = 201-250; 6 = 250+
Number Buying From
020
4060
80Pe
rcen
t
1 2 3Number Selling to
Categories: 1 = 1-10; 2 = 11-50; 3 = 50+
Number Selling to
020
4060
80Pe
rcen
t
1 2 3Number Traders Buying From
Categories: 1 = 1-10; 2 = 11-20; 3 = 20+
Harvest
020
4060
80Pe
rcen
t
1 2 3Number Traders Buying From
Categories: 1 = 1-10; 2 = 11-20; 3 = 20+
Post Harvest

A similar network structure appears also in the relation of phorias to wholesalers. While on
average each phoria sells to 4 traders, each trader/wholesaler on average buys from 8 phorias
during the harvest season and from 7 phorias in the post-harvest season (see Figure 6). The
market share of most phorias in the wholesale market is therefore quite small – of the
percentage of potatoes purchased by each wholesaler, an overwhelming majority of phorias
contribute less than 10 percent.
The preceding discussion implies that the middleman market for potatoes does not appear
highly concentrated. At the next step we need to calculate trader costs and thereby their profit
Margins
The data required for this is yet to be cleaned, so this will be provided in future versions of
this report. Nevertheless, we should point out that Mitra, Mookherjee, Torero and Visaria
(2012) calculated a lower bound to phoria profits in the year 2008 by using selling costs
(transport, handling and storage) incurred by those farmers that sold directly in local markets
as an upper bound to these costs that might be incurred by phorias. They estimated the phoria
margins net of selling costs amounted to 25-30 percent of the wholesale price, while farmgate
prices were approximately 55 to 60 percent. The margins were higher during the harvest
period if the phoria resold the potatoes immediately as storage costs were not incurred: for
such transactions their net margin was approximately equal to the farmgate price! These
calculations however do not include overhead costs incurred by the phorias. We hope to
calculate costs incurred by the phorias during 2011-2013 using cost information directly
provided by them.
Entry Requirements
We now present evidence concerning entry requirements for a phoria. This throws light on
how easy hit-and-run entry is feasible in these markets.
The majority of phorias we surveyed operate a small business. Only 30 percent of the phoria
surveyed operate more than 1 business and almost 60 percent of the phoria do not employ
anyone in their business. 45 percent of the phoria report that capital availability is the most
important requirement to starting a new phoria business, following by having friends and
family members who cultivate potato. The capital requirements can be substantial. As shown
in Figure 7, almost 40 percent of the phoria we surveyed report that an initial capital of Rs
20000 – 50000 is necessary to start a phoria business, though there is a great deal of variation

here. 15 percent of the phoria surveyed report that the capital requirement is less than Rs
20000, while nearly 20 percent report the requirement to be more than Rs 100000 (Rs 1 lakh).
Capital requirement and contact with farmers through other means are the two most important
requirements for starting a phoria business – see Figure 8. Hence hit-and-run entry does not
appear to be feasible. While the market is characterized by multiple buyers and sellers, not
anyone on the outside can respond to significant middleman margins by entering for a short
period of time and undercutting prices quoted by incumbent phorias. The principal barriers
involve having sufficient capital (as we shall see below liquidity constraints are important:
phorias have to be able to accept delayed payments from wholesalers for potatoes supplied to
them), and enough connections with farmers who would be willing to supply to them (as we
shall see below, farmers need to trust the phoria). Regulatory barriers do not seem important:
approximately 60 percent of the phoria surveyed report that they do not require permission to
start operating a phoria business. Very few mentioned political connections as a prerequisite.
Figure 7: Capital required to start a new phoria business
Figure 8: Most Important Requirement to Start a New Phoria Business
010
2030
40Pe
rcen
t
Up to 20000 20000 - 50000 50000-100000 100000+Capital Requirement to start Business

B. Specialized Information and Contractual Lock-in
We now examine whether existing phorias manage to earn profits owing to specialized
information regarding the reliability of different farmers, or by designing contracts which
lock-in their favored suppliers from being competed away by other phorias. These might
enable phorias to segment the market in ways that make it difficult for new entrants to
undercut their profit margins. Typical forms of such segmentation involve long-term contracts
providing special benefits to suppliers who have developed a track record of providing them
reliable supplies over a period of time.
Length of Relationships
Long-term relationships are common. Figure 9 reports the length of relationship between the
farmer and the buyer of his produce. Almost 30 percent of potato producers report
relationships longer than 5 years; another 30 percent report relationships between 2 and 5
years. But there also appears to be a functioning short-term market, with 15 percent reporting
relationships of one year or less.
Figure 9: Length of relationship of farmer with buyer
0.1
.2.3
.4.5
Capital Reliable Business PartnerExperience Phoria Experience Potato FarmingContact With Farmers through Other Business Contact With TradersFamily/Friends Potato Cultivators Family/Friends Potato BusinessPolitical Connection Knowledge RulesOther

This was from the farmer’s side. From the phoria’s side, we enquired about the relationship
of each phoria with his oldest continuous supplier and with his newest supplier (supplier here
refers to the farmer who sold the potato to the phoria). In almost 80 percent of the cases, the
years purchased from the oldest continuous supplier exceeds 5 years. Panel A in Figure 10
presents the distribution of the years purchased from the oldest continuous supplier and the
newest supplier. For the latter, the peak of the distribution is attained at 2 years.
Panel B in Figure 10 presents the distribution of the number of years the phoria has been
selling to his oldest buyer (buyer here refers to the trader/wholesaler who the phoria sells to).
The average is more than 5 years again indicative of extended (long term) relationships.
Figure 10: Distribution of years purchased from (oldest continuous and newest Supplier) and sold to (oldest buyer)
Panel A: Years Purchasing From Panel B: Years Sold to
010
2030
40Pe
rcen
t
1 2 3 4 5How Long the Farmer has Sold to the Buyer
Categories: 1 = First time; 2 = Under a year; 3 = 1-2 years; 4 = 2 - 5 years; 5 = Over 5 years
0.1
.2.3
.4K
erne
l Den
sity
Est
imat
es
0 10 20 30 40Years Purchasing From
Oldest Continuous Newest
0.0
2.0
4.0
6.0
8De
nsity
0 5 10 15 20 25Years Sold To Oldest Buyer
kernel = epanechnikov, bandwidth = 1.7600
Kernel density estimate

What are the benefits to farmers from long-term relationships? We asked the phorias how the
price per packet (50 kg bag of potato) they offer to the oldest supplier and the newest supplier
would compare to the prices the relevant farmer would receive (1) at the mandi where the
phoria re-sold the potato; (2) at the local market (haat) where the farmer could transport and
sell the same potatoes; and (3) from a different phoria for the same potatoes.
Only in the case of post-harvest sales, is there a statistically significant difference between
relative likelihood of offering longer-term suppliers a better price than would be offered by
other phorias. Even in this case the extent of difference is not quantitatively large: the
reported likelihood is 65% for the oldest continuous supplier compared with 58% for the
newest supplier.
Table 1: How does the price offered to the farmer for the largest transaction compare to the price the farmer could receive elsewhere
Newest Supplier
Oldest Continuous
Supplier
Difference
Harvest: Higher than Mandi Price 0.26 0.28 -0.02 Harvest: Higher than Haat Price 0.56 0.62 -0.05 Harvest: Higher than price offered by other phoria 0.59 0.58 0.01 Post-Harvest: Higher than Mandi Price 0.06 0.09 -0.03 Post-Harvest: Higher than Haat Price 0.28 0.25 0.03 Post-Harvest: Higher than price offered by other phoria
0.58 0.65 -0.08**
What are the advantages to long term relationships if there is no price advantage? Does the
phoria provide any additional services to longer-term suppliers? We next turn to the issue of
interlinked contracts.
Bundling of Other Services to Favored Suppliers: Interlinked Contracts
Approximately 30 percent of the households report that at the time of the sale they had
outstanding loans from the trader who buys their crop. Of these households, more than 37
percent report that they have been borrowing from this person for 2-5 years and an equally
high 36 percent report that they have been borrowing for more than 5 years.
Table 2: At the time of sale, did you have an outstanding loan from this buyer? Outstanding Loan Percentage Yes 24.44 No 75.56
Table 3: Since when have you been borrowing from this buyer (if loan outstanding at time of

sale)? Length of Borrowing Percentage First time 7.53 Under a Year 2.11 1 – 2 Years 14.40 2 – 5 Years 43.86 More than 5 Years 32.10
Note also that cross-market links are not restricted to the credit market. In particular, more
than 40 percent of households report that they purchased inputs from the buyer whom they
sold the output to. In approximately 20 percent of cases the purchase of inputs was on credit,
so there was overlap between borrowing and input purchase relations.
Table 4: Did you purchase any inputs from this buyer to plant this crop? Purchase Inputs Percentage Yes 40.23 No 59.77
Hence while there is some incidence of trade credit or other transactions occurring between a
farmer and the phoria that he tends to sell to, the majority of farmers are not engaging any in
other transaction.
On the other hand, the phoria is significantly more likely to provide credit to the regular
supplier to buy inputs relative to the newest suppliers (see Table 5). The phoria is also
significantly more likely to provide inputs for the regular supplier (again the difference is
statistically significant). The phorias are more likely to enter into agreements with the more
regular supplier about transactions, though the difference is not statistically significant. There
is however no concession to more regular suppliers in the form of lower inspection of quality
– the phoria is as likely to inspect the quality of potatoes he purchases from a more regular
supplies as he is of the quality he purchases from the newest supplier.
Table 5: Non-price advantages of Longer Relationships Newest
Supplier Oldest
Continuous Supplier
Difference
Provide Credit to farmer to buy inputs 0.30 0.47 -0.17*** Provide Inputs for the farmer to use 0.31 0.46 -0.15*** Make Agreement with farmer to buy his potatoes 0.23 0.28 -0.05
Trust and Reputation: Reliability Checks

The survey provides clear evidence of the importance of trust and reputation in the supply
chain. Farmers and phorias trading with one another check each others reliability, and so do
phorias and wholesalers trading with one another. Panel A of Table 6 shows that more that 55
percent of phorias checked the reliability of the farmer, most often with regard to the quality
of their potatoes, and also with stability of their supply. Panel B shows that between 42 to 60
percent farmers checked the reliability of the phoria, most often the latter’s trade reputation,
followed by the sales network. Payments made by phorias to farmers are frequently
characterized by delayed payments of part of the value of the transaction, owing to delays the
phorias themselves get paid by wholesalers they sell to. Hence farmers check a phoria’s
reputation for timely repayment. Similarly phorias check a wholesaler’s reputation for timely
repayment before selling to them.
Table 6: Reliability Checks Panel A: Did phoria check the reliability of farmer Percent
Checking What Aspect if
Checking
Quality of potatoes
Stability of supply
Creditworthiness
Oldest Continuous Supplier
56.64 80.25 62.96 54.32
Newest 58.47 84.52 32.14 45.24 Panel B: Did farmer check the reliability of phoria Percent
Checking What Aspect if Checking
Sales Network
Stability of
Demand
Creditworthiness Reputation
Oldest Continuous Supplier
59.57 70.24 46.43 51.19 96.43
Newest 42.55 73.33 30.00 51.67 93.33 Panel C: Wholesaler-Phoria Checking Percent
Checking What Aspect if Checking
Sales Network
Stability of
Demand
Creditworthiness Reputation
Did wholesaler check reliability of phoria
61.87 80.23 72.09 37.21 72.09
Did phoria check reliability of wholesaler
88.03 72.08 60.80 69.60 88.00
Exclusive Dealing; Market Restrictions on Farmers
While almost all farmers in our sample cultivate potato, and the majority of the produce (67
percent) is sold directly from the field, immediately following harvest, a large number of

farmers report that they expect to sell in outside markets (mandi, haat, cold-store, retail
markets) during the next four months as they expected market prices to appreciate. This
suggests that there are no restrictions imposed on farmers on who they choose to sell to, even
though the majority of them end up selling to a phoria within a village who many of them
have been selling to in the past. This is consistent with informal farmer interviews: farmers
say they are not bound by any prior understanding to sell to any specific phoria. And as we
have seen earlier, most farmers have sold to many different phorias in the recent past. Hence
we do not see much evidence of any exclusive dealing clauses.
Phoria-Trader Relationship
We have noted above the network character of trade relationships between phorias and
wholesalers, i.e., the absence of exclusive dealing at that layer. There is also not much
evidence of any prior contractual agreement on price or quantity of sales. In more than 56
percent of the cases, there is no prior agreement (before the harvest) between the wholesaler
and the phoria. Even if there was an agreement, there was no explicit agreement on the price
or quantity before the harvest; instead there was an implicit agreement that the wholesaler
would buy what the phoria had to offer. That said, the wholesaler was free to buy from any
seller he wished to and the phoria was also was under no-obligation to sell to the wholesaler
despite the agreement.
Almost 80 percent of the phorias report that they do not receive any trade credit even from
their most frequent buyer. Unlike the relationship between the phoria and the farmer, there
are no interactions between the trader and the phoria across different markets. While the
wholesaler insists on inspecting the potato delivered by the phoria (almost 96 percent of
wholesalers inspect the potato supplied); 60 percent of wholesaler inspect the potato after
delivery, while others do so before agreeing to purchase.
Sales to the wholesaler by a phoria is frequently characterized by delayed payments. Hence
wholesalers end up borrowing from the phorias they buy from, despite having a much larger
business. Approximately 85 percent of trades between a wholesale and a phoria are not
settled at the time of delivery and on average 75 percent of the payment amount was to be
settled later. Figure 11 shows a systematic positive relationship between the length of the
relationship between the fraction of the payment amount that was to be repaid at a later date.
Figure 11: Lowess plot of years sold to oldest buyer and fraction of payment that was to be repaid at a later date

Summary and Conclusion
We summarize our main findings:
1. Markets between phoria and farmers are not particularly concentrated. While trades often
take place repeatedly between partners over many years, agents on each side trade with
multiple partners.
2. Long-term trading relationships are more likely to involve trade credit and purchase of
farm inputs by a farmer from the same phoria. But it seems to not involve any price
premia received compared with recently acquired suppliers of the same phoria.
3. Farmer-phoria and phoria-wholesaler relationships are characterized by two-sided trust
concerns. Buyers check quality of potatoes supplied and stability of supplies, while
sellers check the buyers reputation for timely payment and stability of demands.
4. Entry into the phoria business is restricted by capital requirements and the need to
establish connections with buyers and suppliers (which may reflect the same concerns for
trust and reliability).
These results are consistent with models where large phoria margins arise as rents to their
reputation, combined with some entry barriers arising from capital and networking
requirements. There seem to be not much evidence of contractual lock-in, or restrictions on
who a farmer can sell to. Hence large phoria margins do not seem to result from any kind of
explicit monopsonization. What is less obvious is whether phoria engage in any kind of price
collusion with one another. Or whether search frictions are significant sources of their
margins.
6070
8090
100
Prop
ortio
n to
be
Rep
aid
at a
Lat
er D
ate
0 5 10 15 20 25Years Sold to

Going forward, we will need to use the detailed data from the recurring surveys to: (a)
calculate phoria costs and profits more precisely, and in the event that these turn out to be
large, (b) discriminate between competing explanations (collusion, search, reputation rents) of
high phoria profits econometrically to the extent possible. For this we will need to develop
testable predictions of theoretical models of these phenomena.
At this intermediate stage of the research, it would be premature to draw any policy
conclusions. These will have to await a better understanding of the trading mechanism
between farmers and phorias.
References:
[1] Aleem, I. (1993). Imperfect Information, Screening, and the Costs of Informal Lending: A Study of a Rural Credit Market in Pakistan. The Economics of Rural Organizations: Theory, Practice, and Policy. K. Hoff, A. Braverman and J. E. Stiglitz (ed).
[2] Antras, P. and A. Costinot (2011): "Intermediated Trade", Quarterly Journal of
Economics, 126, 1319 - 1374. [3] Bardhan, P., D. Mookherjee, and Tsumagari, H (2010). “Middlemen Margins and
Globalization”, Mimeo, Boston University. [4] Chau, N. H., H. Goto and R. Kanbur (2011): "Middlemen, Fair Traders, and Poverty",
Mimeo, Cornell University. [5] Fafchamps, M. and B. Minten (2012): "Impact of SMS-Based Agricultural Information
on Indian Farmers", World Bank Economic Review, 26(3), 383 - 414. [6] Ghosh, P. and D. Ray (1996): "Cooperation in Community Interaction without
Information Flows", Review of Economic Studies, 63(3), 491 - 519. [7] Maitra, P., S. Mitra, D. Mookherjee, A. Motta and S. Visaria (2013). “Agent
Intermediated Loans: A New Approach to Microfinance”, Mimeo, Monash University. [8] Mitra, S., D. Mookherjee, M. Torrero and S. Visaria (2012): "Asymmetric Information
and Middleman Margins in West Bengal Potato Marketing", Mimeo, Boston University

Designed by soapbox.co.uk
The International Growth Centre (IGC) aims to promote sustainable growth in developing countries by providing demand-led policy advice based on frontier research.
Find out more about our work on our website www.theigc.org
For media or communications enquiries, please contact [email protected]
Subscribe to our newsletter and topic updates www.theigc.org/newsletter
Follow us on Twitter @the_igc
Contact us International Growth Centre, London School of Economic and Political Science, Houghton Street, London WC2A 2AE
Top Related