


Languages
Pages
Legal


Ports and SEZ Ltd
Intermodal Asia 2019

Adani Group Thinking Big for India
Adani’s coal operations* will account for ~20% of India’s projected coal requirements by 2021
Adani’s port infrastructure will handle ~20% of the total cargo handled at Indian Ports by 2021
Adani’s power generation capacity will be more than ~4% of India’s projected capacity by 2021-22
Adani will be developing real estate properties over 80 million sq ft by 2021
Adani will cater to 25% of India’s edible oil demand by 2021
Our Strategic Response to Nation’s Challenges
Largest Coal Importer in India Largest port operator in India growing faster than the industry average
Largest private power producer in India
Developing one of India’s largest integrated townships in Ahmedabad, fast growing across Mumbai and NCR
India’s largest edible oil brand-Fortune; largest player in Oleo, Castor, Speciality Fats and Wheat Storage (silos)

581
555
825
327304
530
144
112
350C
AG
R:
6.2
5%
Major Ports(Under the purview of Central GoI)
Non Major Ports(excluding Adani Ports)
Adani Ports- India
Ports in India: Overview
3
CA
GR
: 1
2.4
0%
CA
GR
: 2
0.1
4%
Cargo Handling
Note: Major and Non Major Ports Estimates are based on industry analysis MMT: Million Metric Tons; CAGR: Compounded Annual Growth Rate:
7x growth compared to other non-major ports
All figures in MMT
2014 2015 2016 2017 2018 …. 2021E 2014 2015 2016 2017 2018 …. 2021E 2014 2015 2016 2017 …. 2021E
151
606
330
647
332 168
679
314180

Adani Ports Presence
4
Mormugao
Vizag
Dahej
Hazira
Mundra
Tuna
All Units in MMTPA
20 20
20 25
7 7
388 596230 315
35 85
6 6
Current Capacity
Proposed Capacity
Ennore
12 20
Dhamra
40 100
Vizhinjam(Project Pipeline)
Kattupalli
18 18
Largest Port Operator in India
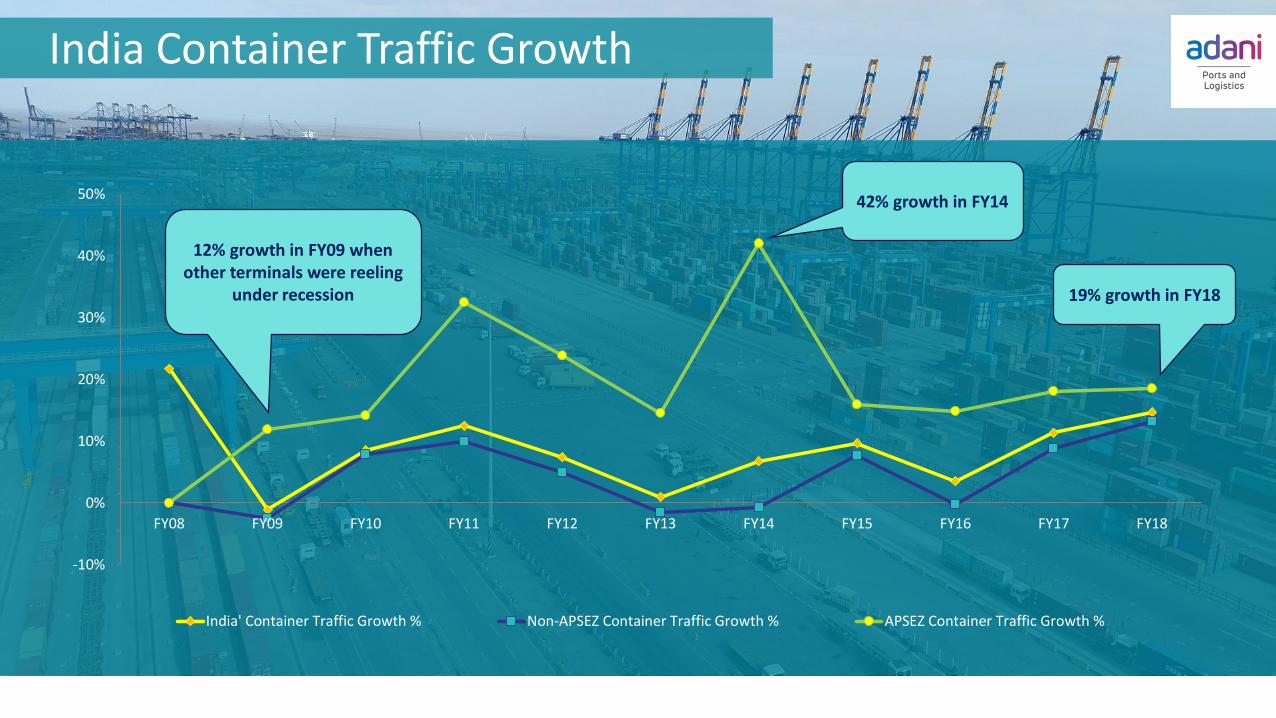
India Container Traffic Growth
-10%
0%
10%
20%
30%
40%
50%
FY08 FY09 FY10 FY11 FY12 FY13 FY14 FY15 FY16 FY17 FY18
India' Container Traffic Growth % Non-APSEZ Container Traffic Growth % APSEZ Container Traffic Growth %
12% growth in FY09 when other terminals were reeling
under recession
42% growth in FY14
19% growth in FY18
Source : Alphaliner

Mundra – Natural Gateway Port for Key Industrial Clusters
Distance To
Region Industrial Cluster Mundra Pipavav JNPT
Punjab Rice , Auto Parts, Machinary 1339 1555 1765
Delhi NCR,Haryana
Auto Units , White Goods , Auto Ancillary Units
1167 1300 1510
Rajasthan Stone , Handicrafts 789 935 1128
• Natural gateway port for North West Hinterland Regions of North Central Gujarat, Delhi NCR, Haryana, Punjab, Rajasthan and Uttarakhand.
• Only Port in India equipped to handle 40 rakes in a day.
• Dedicated OS for Containers Rake Operation ensures minimal delay in Container Train Operations with cargo visibility to concerned stakeholders
• Smart Epic Implementation and addition of E- forms at Mundra Port Ensures zero congestion at Terminal gates for Road Movements.

ICD Ludhiana
Jodhpur
Khodiyar | SanandICD Viramgam
Mundra
NCR• Dadri | Tughlakabad• Rewari | Ghari | Patli• Loni | ACTL Faridabad | Sonepat• Panipat | Moradabad• Rudrapur | Kashipur
Mundra is Connected to 32
ICD’s in North West India
ICD’s32
Capable of Handling
Single and Double Stack
Rakes.
Rail Heads8
Rake Handling time of
Double Stack Trains at
Mundra. (Unloading +
Loading)
Hrs8
Only Port on West Coast to
Handle 40 Rakes in a Day
Rakes40
Provides connectivity to
the India railways network
through a privately
developed and maintained
76 KM rail line
Kms76
Mundra Rail Infrastructure
Capacity to Handle Rail
Volumes at Mundra
TEUs2Mn

Mundra Rail Performance
180,364 256,580
355,360
534,907
632,892
745,902 768,277
911,856
1,050,489
1,192,578
FY10 FY11 FY12 FY13 FY14 FY15 FY16 FY17 FY18 FY19
Rail Volumes (In TEU’s)
Commencement of Double Stack Rail Movements
15% Y-O-Y
Growth
Only Port in
India to register
high ICD
Volumes
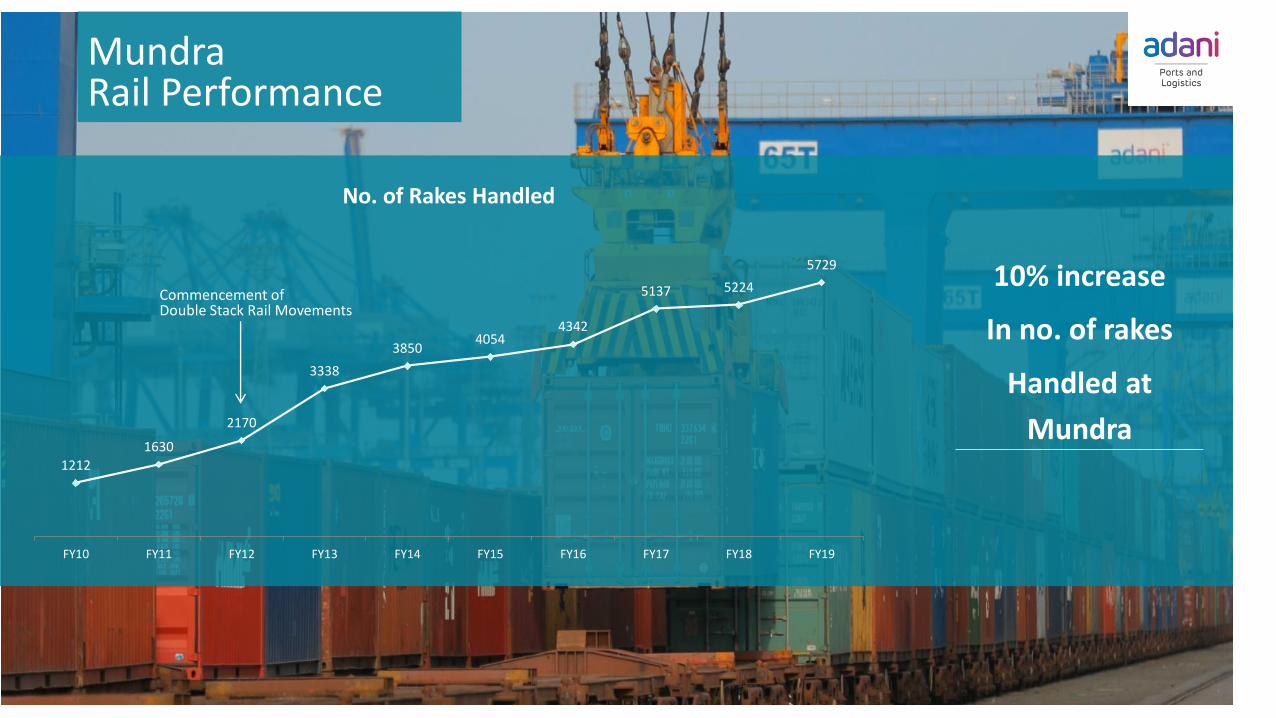
Mundra Rail Performance
10% increase
In no. of rakes
Handled at
Mundra1212
1630
2170
3338
38504054
4342
5137 5224
5729
FY10 FY11 FY12 FY13 FY14 FY15 FY16 FY17 FY18 FY19
No. of Rakes Handled
Commencement of Double Stack Rail Movements

MundraThe Only Port in India to handle
maximum no. of Double Stack
Trains.

Top Related