


Languages
Pages
Legal

POLITYresearch & CONSULTING
________________________________________________________________________
Australian Reconciliation Barometer 2014
Darryl NelsonManaging DirectorPolity Pty. [email protected]
May 2015
POLITYRESEARCH & Consulting
_______________________________
Contents
1. Introduction & background
2. Methodology
► ARB approach 2008-2012
► ARB approach 2014
► Online survey details
3. Australian Reconciliation Barometer 2014
► Key findings and trends analysis
► Full results:
Race Relations
Unity
Material Equality and Cultural Security
Historical Acceptance
4. Appendix
► Online survey sample profiles
2
POLITYRESEARCH & Consulting
_______________________________
Introduction & background
Reconciliation Australia (RA) first launched the Reconciliation Barometer
research project in February 2007. The objective of the research was to
develop a tool to measure the progress of reconciliation between Aboriginal
and Torres Strait Islander people and non-Indigenous Australians. The first
study was completed in 2008, with subsequent biennial tracking waves in
2010 and 2012.
While improvements in Indigenous health, employment, housing and
education are essential for the reconciliation process, equally important, and
at the core of reconciliation, is the relationship between the first Australians
and those who have come since.
If we are to improve the relationship and create an environment which
provides equal life chances for all Australians we must also measure, track
and understand the underlying values and perceptions that shape this
relationship and influence our social interactions and structures.
This is the only study of this nature undertaken in Australia. The inspiration
for the Barometer came from South Africa, where the Institute of Justice and
Reconciliation developed the „South African Reconciliation Barometer‟.
Initially it was conducted bi-annually in 2003 and 2004 and since then
annually.
The Australian Reconciliation Barometer delves into the heart of our nation to
identify the attitudes Indigenous and non-Indigenous Australians hold about
each other, and about reconciliation in this country. It also attempts to shed
some light on opportunities for moving the relationship forward towards a
greater reconciled, shared unity.
For this latest 2014 Barometer, RA has aligned the survey more closely with
its Reconciliation Outcomes Framework, to focus on 4 of the 5 key
dimensions:
Race Relations, Unity, Material Equality and Historical Acceptance
3
POLITYRESEARCH & Consulting
_______________________________
Methodology 2008-12 Barometers
Original ARB development
To create the first Australian Reconciliation Barometer, the first part of the research task was to identify different factors that contributed to advancing
reconciliation. Several phases of both quantitative and qualitative research were used in the process of identifying and defining these factors. In May
2007 RA commissioned a quantitative survey among 1,024 people to determine the underlying values of Australians towards Indigenous issues and
reconciliation. This survey was further enhanced by a series of in-depth interviews with 14 key Indigenous and non-Indigenous stakeholders. From
this, 29 hypotheses of reconciliation were identified, forming the basis of a discussion guide for further study.
In November-December 2007, a series of 12 forums were conducted with Indigenous and non-Indigenous Australians in Shepparton, Rockhampton
and Sydney. The forums explored the 29 hypotheses of reconciliation and this resulted in the development of 31 “outcomes” for reconciliation, that is
actions or conditions that will advance reconciliation.
These outcomes were used to inform the development of the original Barometer questionnaire. The same questionnaire was used in surveys of
Indigenous Australians as well as the general community, to allow a direct comparison between the attitudes of the two groups. This first Barometer
survey was conducted in May 2008, May 2010 and July 2012.
General Community Sample
For the 2008-2012 studies, the general community sample of Australians was selected and weighted to be representative in terms of age, gender
and location (state and urban/regional splits), as per Australian Bureau of Statistics 2006 Census data. Participants were recruited from a
professional market and social research panel and they received a small incentive for their participation.
1007 Australian residents aged 18+ completed the survey in May 2008, 1220 completed the survey in April 2010, and 1012 completed the survey in
July 2012. These sample sizes are associated with margins of error of +/- 3.1%, +/- 2.8% and +/-3.1% at the 95% confidence interval respectively.
Indigenous Sample
The 2008-2012 surveys among Indigenous respondents involved recruitment through Indigenous networks across Australia, with an open invitation
distributed by email and hosted on the RA website. This targeted approach was taken due to the relatively small proportion of Indigenous Australians
within established research panels, and the Australian population overall. A sample of 617 Indigenous Australians completed the survey between
25th-30th June 2008, while 704 Indigenous Australians completed it in 12th-29th April, 2010, and 516 completed it in July 2012. These sample sizes
are associated with margins of error of +/- 4%, +/- 3.7% and +/- 4.3% respectively.
Gaining a truly representative sample of Aboriginal and Torres Strait Islander Australians is difficult because of a number of geographical and
socioeconomic factors. Accounting for these factors was beyond the scope of the research, and it was acknowledged that the sample of Indigenous
people (recruited via Indigenous networks) may not have been truly representative of the overall Indigenous population. The data was weighted
according to Indigenous demographic data (age/gender and location) from the Australian Bureau of Statistics 2006 Census, to try and ensure it was
as representative as possible.
4
POLITYRESEARCH & Consulting
_______________________________
Methodology 2014 Barometer
ARB reviewed and refined
In early 2014, following a tender process, Polity Research & Consulting was selected to conduct the ARB survey, and to assist RA and its
stakeholders with a comprehensive review of the Barometer survey. In May 2014, RA convened a Roundtable workshop at the National Centre for
Indigenous Excellence in Redfern. Participants were invited based on their knowledge and experience in Indigenous affairs, reconciliation and social
research, and to achieve an appropriate mix of not-for-profit, academic and commercial sectors and gender.
The Roundtable identified 4 key areas for improvement of the ARB:
i. To better inform a broader narrative on reconciliation, by more closely aligning with RA‟s Reconciliation Outcomes Framework
ii. To remove questionnaire asymmetry, with too many existing questions „speaking‟ to non-Indigenous respondents rather than both groups
iii. To address Indigenous sample bias, as much as logistically possible, with respondents drawn from a narrow group of Indigenous networks
iv. To measure the „lived experience‟ of respondents more, rather than their perceptions of the broader social reality
Accordingly, this latest Barometer has been revised extensively and contains many new measures, as well as some revisions to past questions. For
this reason and also due to the improved „random‟ sampling approach for the Indigenous community (see below), the 2014 ARB represents
something of a resetting of the reconciliation baseline in Australia, and makes direct tracking comparisons with 2008-2012 results difficult.
Nevertheless, the results of these past surveys have, where applicable, been included in the Barometer reported in full in this report. This allows for
possible trend analysis by readers of this report, however Polity advises caution regarding any dramatic changes in results from 2012.
General Community and Aboriginal and Torres Strait Islander Samples
The general community sample of Australian residents continues to be selected and weighted to be representative in terms of age, gender and
location (state and urban/regional splits), as per Australian Bureau of Statistics 2011 Census data. Participants were recruited from a professional
market and social research panel and they received a small incentive for their participation. The sample of 1100 completed the survey in Sept-Oct
2014, and is associated with a margin of error of +/-3.1% at the 95% confidence interval.
For the first time, the Indigenous sample was also drawn from a professional market and social research panel. Participants were „self-identified‟ as
Aboriginal and/or Torres Strait Islander. The sample of 502 completed the survey in Sept-Oct 2014 (simultaneously with the general community
sample), and is associated with a margin of error of +/-4.4% at the 95% confidence interval.
Further details of the composition of both samples are provided in the Appendix.
5
POLITYRESEARCH & Consulting
_______________________________
Methodology 2014 Barometer
Acknowledged limitations
Gaining a truly representative sample of Aboriginal and Torres Strait Islander Australians remains difficult because of a number of geographical and
socioeconomic factors. Accounting for these factors comprehensively is beyond the current budget scope of the research, and as such the sample of
Indigenous people may not be truly representative of the overall Indigenous population (particularly encompassing remote community views).
For demographic profiling, the survey asked questions regarding cultural backgrounds, including personal cultural background for non-Indigenous
participants. It is acknowledged that in the course of survey objectives and brevity, this covered only macro-level major cultural groups (i.e. European
or Asian), but did not cover „National‟ identities (e.g. Australian, Indonesian, etc).
It is further acknowledged that, in the interests of graphical and reporting brevity, the abbreviation Indigenous has been used in this report, to refer to
Aboriginal and Torres Strait Islander peoples. Similarly, the term “Australians” has been used in both the survey questions and report, to refer to all
people who are resident in Australia, including both citizens and non-citizens.
Online approach
Participants from both groups completed the survey online. Previous studies have shown that online research produces research which is at least as
accurate (and sometimes more accurate) than telephone research. Another benefit of this approach is the removal of any interviewer bias that may
come into play when discussing sensitive issues. Online surveys also have the advantage of allowing people to respond at their own pace, giving
them enough time to properly consider important and complex issues.
However, it is possible that this methodology over-samples the computer literate population which on average may be more highly educated than the
general population.
6
Australian Reconciliation Barometer 2014 Insights
7
Key findings and trends analysis
POLITYRESEARCH & Consulting
_______________________________
The social context of changing attitudes
8
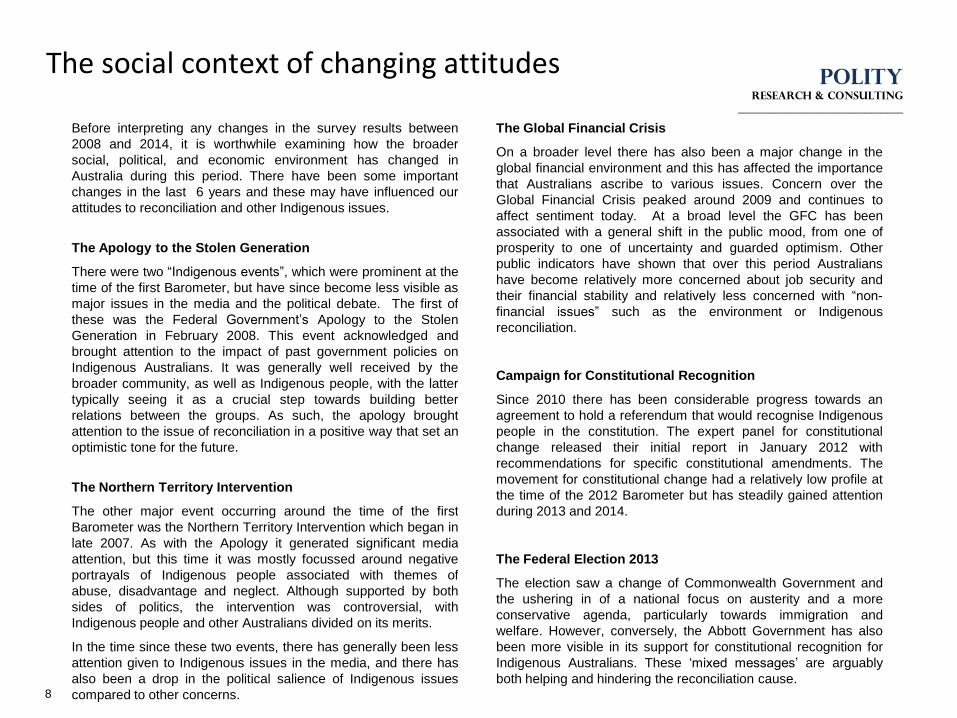
Before interpreting any changes in the survey results between
2008 and 2014, it is worthwhile examining how the broader
social, political, and economic environment has changed in
Australia during this period. There have been some important
changes in the last 6 years and these may have influenced our
attitudes to reconciliation and other Indigenous issues.
The Apology to the Stolen Generation
There were two “Indigenous events”, which were prominent at the
time of the first Barometer, but have since become less visible as
major issues in the media and the political debate. The first of
these was the Federal Government‟s Apology to the Stolen
Generation in February 2008. This event acknowledged and
brought attention to the impact of past government policies on
Indigenous Australians. It was generally well received by the
broader community, as well as Indigenous people, with the latter
typically seeing it as a crucial step towards building better
relations between the groups. As such, the apology brought
attention to the issue of reconciliation in a positive way that set an
optimistic tone for the future.
The Northern Territory Intervention
The other major event occurring around the time of the first
Barometer was the Northern Territory Intervention which began in
late 2007. As with the Apology it generated significant media
attention, but this time it was mostly focussed around negative
portrayals of Indigenous people associated with themes of
abuse, disadvantage and neglect. Although supported by both
sides of politics, the intervention was controversial, with
Indigenous people and other Australians divided on its merits.
In the time since these two events, there has generally been less
attention given to Indigenous issues in the media, and there has
also been a drop in the political salience of Indigenous issues
compared to other concerns.
The Global Financial Crisis
On a broader level there has also been a major change in the
global financial environment and this has affected the importance
that Australians ascribe to various issues. Concern over the
Global Financial Crisis peaked around 2009 and continues to
affect sentiment today. At a broad level the GFC has been
associated with a general shift in the public mood, from one of
prosperity to one of uncertainty and guarded optimism. Other
public indicators have shown that over this period Australians
have become relatively more concerned about job security and
their financial stability and relatively less concerned with “non-
financial issues” such as the environment or Indigenous
reconciliation.
Campaign for Constitutional Recognition
Since 2010 there has been considerable progress towards an
agreement to hold a referendum that would recognise Indigenous
people in the constitution. The expert panel for constitutional
change released their initial report in January 2012 with
recommendations for specific constitutional amendments. The
movement for constitutional change had a relatively low profile at
the time of the 2012 Barometer but has steadily gained attention
during 2013 and 2014.
The Federal Election 2013
The election saw a change of Commonwealth Government and
the ushering in of a national focus on austerity and a more
conservative agenda, particularly towards immigration and
welfare. However, conversely, the Abbott Government has also
been more visible in its support for constitutional recognition for
Indigenous Australians. These „mixed messages‟ are arguably
both helping and hindering the reconciliation cause.
POLITYRESEARCH & consulting
_____________________________
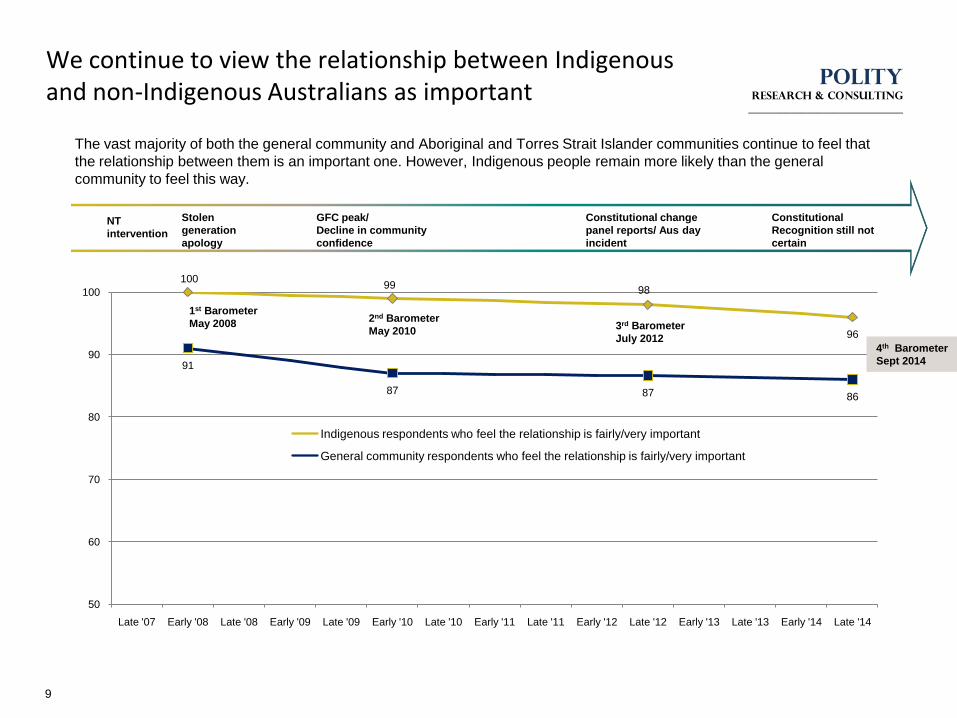
We continue to view the relationship between Indigenous and non-Indigenous Australians as important
9
The vast majority of both the general community and Aboriginal and Torres Strait Islander communities continue to feel that
the relationship between them is an important one. However, Indigenous people remain more likely than the general
community to feel this way.
10099
98
96
91
87 87 86
50
60
70
80
90
100
Late '07 Early '08 Late '08 Early '09 Late '09 Early '10 Late '10 Early '11 Late '11 Early '12 Late '12 Early '13 Late '13 Early '14 Late '14
Indigenous respondents who feel the relationship is fairly/very important
General community respondents who feel the relationship is fairly/very important
2nd Barometer
May 20103rd Barometer
July 2012
NT
intervention
Stolen
generation
apology
GFC peak/
Decline in community
confidence
Constitutional change
panel reports/ Aus day
incident
1st Barometer
May 2008
4th Barometer
Sept 2014
Constitutional
Recognition still not
certain
POLITYRESEARCH & consulting
_____________________________
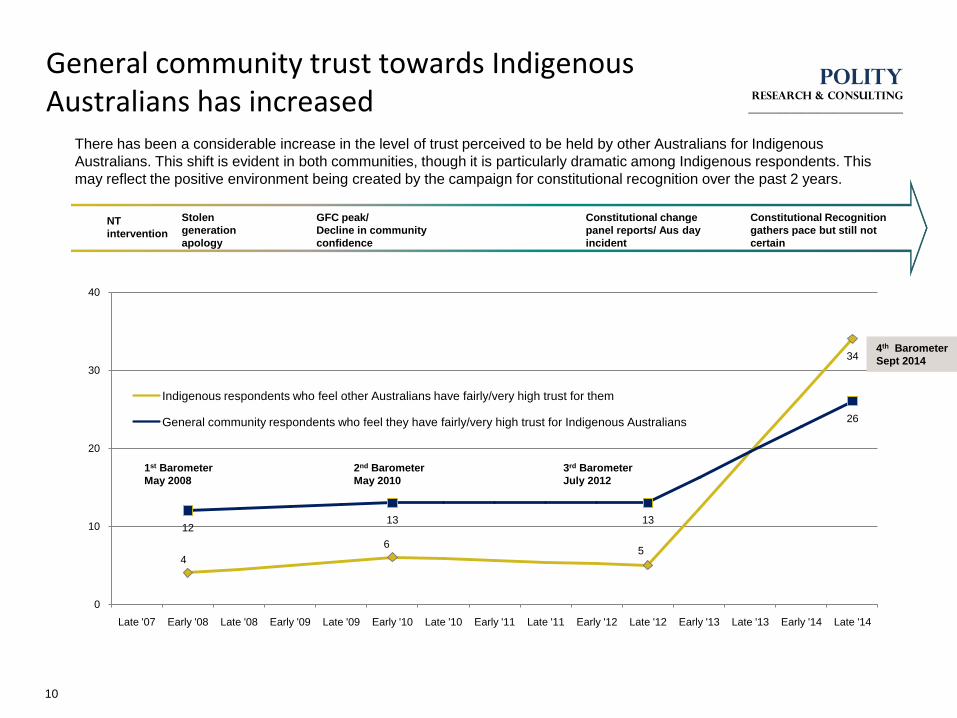
General community trust towards Indigenous Australians has increased
10
There has been a considerable increase in the level of trust perceived to be held by other Australians for Indigenous
Australians. This shift is evident in both communities, though it is particularly dramatic among Indigenous respondents. This
may reflect the positive environment being created by the campaign for constitutional recognition over the past 2 years.
4
65
34
1213 13
26
0
10
20
30
40
Late '07 Early '08 Late '08 Early '09 Late '09 Early '10 Late '10 Early '11 Late '11 Early '12 Late '12 Early '13 Late '13 Early '14 Late '14
Indigenous respondents who feel other Australians have fairly/very high trust for them
General community respondents who feel they have fairly/very high trust for Indigenous Australians
2nd Barometer
May 2010
3rd Barometer
July 2012
NT
intervention
Stolen
generation
apology
GFC peak/
Decline in community
confidence
Constitutional change
panel reports/ Aus day
incident
1st Barometer
May 2008
4th Barometer
Sept 2014
Constitutional Recognition
gathers pace but still not
certain
POLITYRESEARCH & consulting
_____________________________
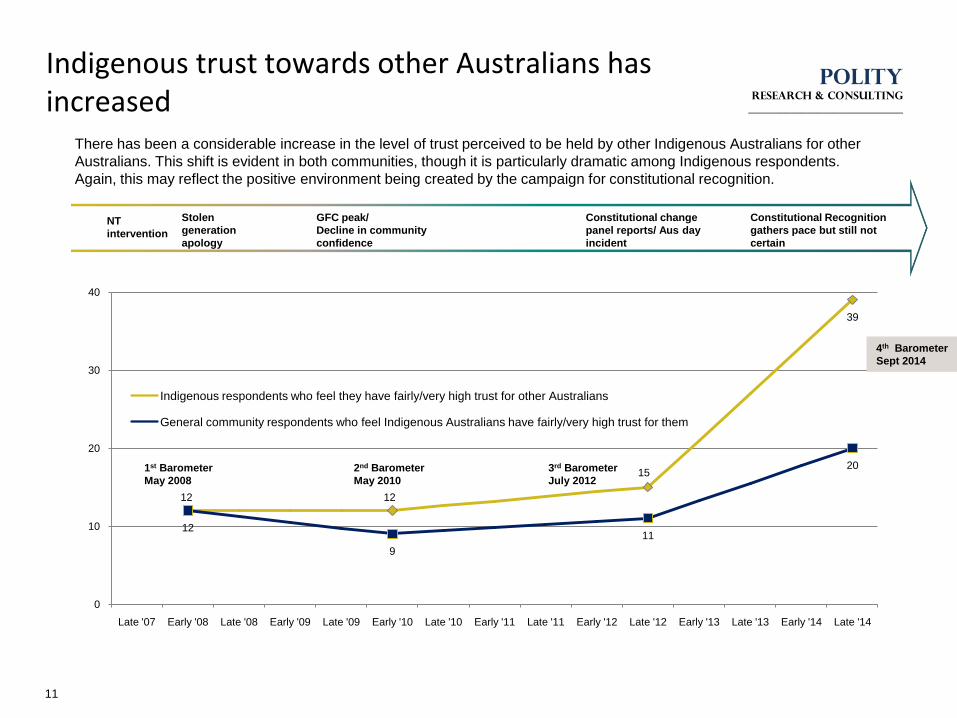
Indigenous trust towards other Australians has increased
11
There has been a considerable increase in the level of trust perceived to be held by other Indigenous Australians for other
Australians. This shift is evident in both communities, though it is particularly dramatic among Indigenous respondents.
Again, this may reflect the positive environment being created by the campaign for constitutional recognition.
12 12
15
39
12
9
11
20
0
10
20
30
40
Late '07 Early '08 Late '08 Early '09 Late '09 Early '10 Late '10 Early '11 Late '11 Early '12 Late '12 Early '13 Late '13 Early '14 Late '14
Indigenous respondents who feel they have fairly/very high trust for other Australians
General community respondents who feel Indigenous Australians have fairly/very high trust for them
2nd Barometer
May 2010
3rd Barometer
July 2012
NT
intervention
Stolen
generation
apology
GFC peak/
Decline in community
confidence
Constitutional change
panel reports/ Aus day
incident
1st Barometer
May 2008
4th Barometer
Sept 2014
Constitutional Recognition
gathers pace but still not
certain
POLITYRESEARCH & consulting
_____________________________
Both groups believe they trust more than the other group
12
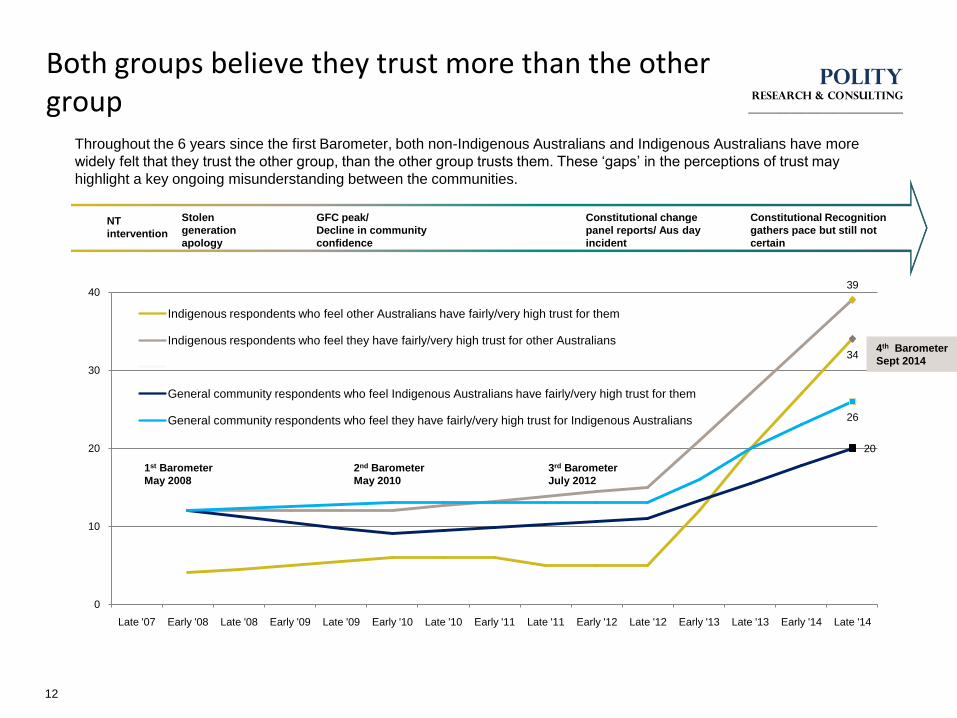
Throughout the 6 years since the first Barometer, both non-Indigenous Australians and Indigenous Australians have more
widely felt that they trust the other group, than the other group trusts them. These „gaps‟ in the perceptions of trust may
highlight a key ongoing misunderstanding between the communities.
34
39
20
26
0
10
20
30
40
Late '07 Early '08 Late '08 Early '09 Late '09 Early '10 Late '10 Early '11 Late '11 Early '12 Late '12 Early '13 Late '13 Early '14 Late '14
Indigenous respondents who feel other Australians have fairly/very high trust for them
Indigenous respondents who feel they have fairly/very high trust for other Australians
General community respondents who feel Indigenous Australians have fairly/very high trust for them
General community respondents who feel they have fairly/very high trust for Indigenous Australians
2nd Barometer
May 2010
3rd Barometer
July 2012
NT
intervention
Stolen
generation
apology
GFC peak/
Decline in community
confidence
Constitutional change
panel reports/ Aus day
incident
1st Barometer
May 2008
4th Barometer
Sept 2014
Constitutional Recognition
gathers pace but still not
certain
POLITYRESEARCH & consulting
_____________________________
Education and personal experience help drive views that the relationship is very important
13
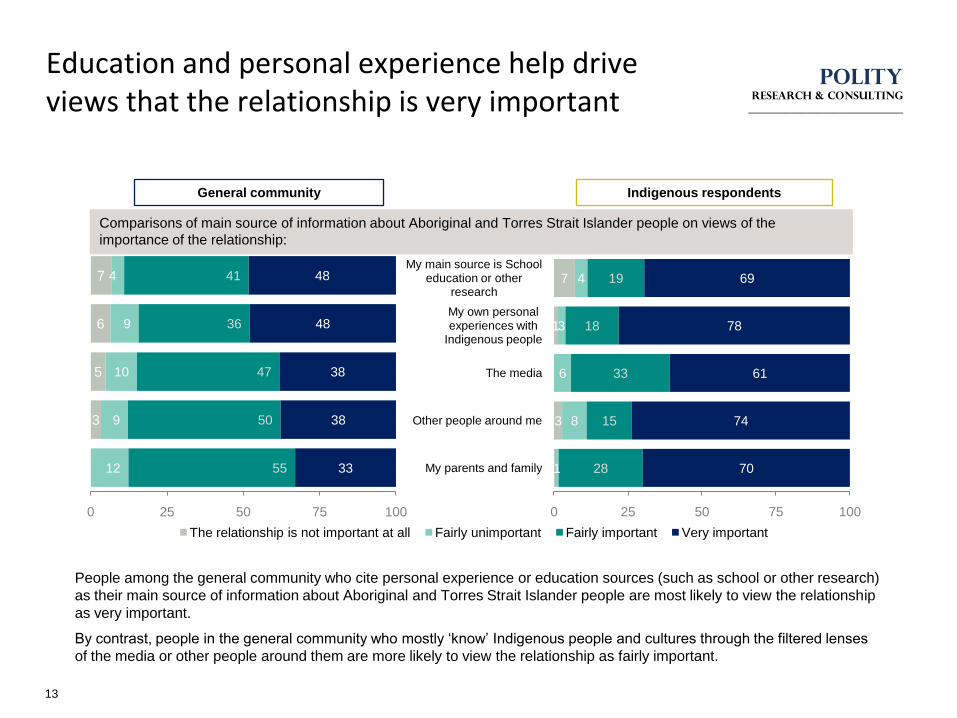
People among the general community who cite personal experience or education sources (such as school or other research)
as their main source of information about Aboriginal and Torres Strait Islander people are most likely to view the relationship
as very important.
By contrast, people in the general community who mostly „know‟ Indigenous people and cultures through the filtered lenses
of the media or other people around them are more likely to view the relationship as fairly important.
3
5
6
7
12
9
10
9
4
55
50
47
36
41
33
38
38
48
48
0 25 50 75 100
The relationship is not important at all Fairly unimportant Fairly important Very important
3
1
7
1
8
6
3
4
28
15
33
18
19
70
74
61
78
69
0 25 50 75 100
My parents and family
Other people around me
The media
My own personal experiences with
Indigenous people
My main source is School education or other
research
Comparisons of main source of information about Aboriginal and Torres Strait Islander people on views of the
importance of the relationship:
General community Indigenous respondents
POLITYRESEARCH & consulting
_____________________________
Most Australians hardly ever socialise with Aboriginal or Torres Strait Islander Australians
14
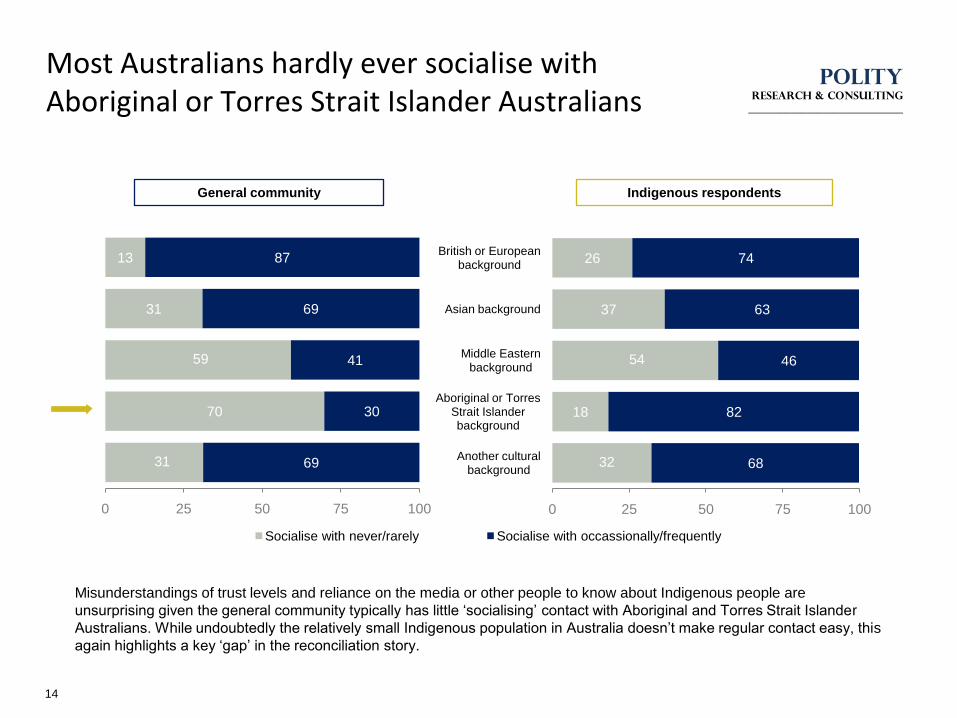
Misunderstandings of trust levels and reliance on the media or other people to know about Indigenous people are
unsurprising given the general community typically has little „socialising‟ contact with Aboriginal and Torres Strait Islander
Australians. While undoubtedly the relatively small Indigenous population in Australia doesn‟t make regular contact easy, this
again highlights a key „gap‟ in the reconciliation story.
31
70
59
31
13
69
30
41
69
87
0 25 50 75 100
Socialise with never/rarely Socialise with occassionally/frequently
General community
32
18
54
37
26
68
82
46
63
74
0 25 50 75 100
Another cultural background
Aboriginal or Torres Strait Islander background
Middle Eastern background
Asian background
British or European background
Indigenous respondents
POLITYRESEARCH & consulting
_____________________________
Aboriginal or Torres Strait Islander Australians are more likely to experience racial prejudice
15
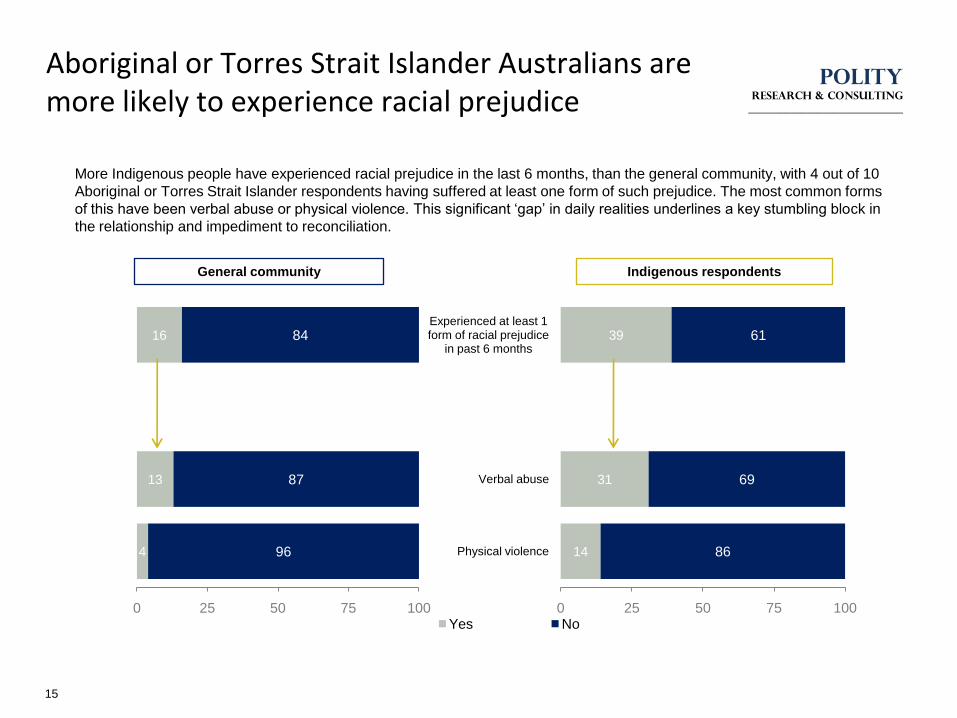
More Indigenous people have experienced racial prejudice in the last 6 months, than the general community, with 4 out of 10
Aboriginal or Torres Strait Islander respondents having suffered at least one form of such prejudice. The most common forms
of this have been verbal abuse or physical violence. This significant „gap‟ in daily realities underlines a key stumbling block in
the relationship and impediment to reconciliation.
4
13
16
96
87
84
0 25 50 75 100Yes No
14 86
31
39
69
61
0 25 50 75 100
Physical violence
Verbal abuse
Experienced at least 1 form of racial prejudice
in past 6 months
General community Indigenous respondents
POLITYRESEARCH & consulting
_____________________________
18-29 year olds
70+ yrs
40-49 yrs
50-59 yrs
60-69 yrs
30-39 yrs
All ages
10
15
20
25
30
35
40
45
50
20 30 40 50 60 70 80 90 100
Fa
irly
/ve
ry h
igh
tru
st
Ind
ige
no
us
pe
op
le h
old
Importance of relationship
High importance
Believe Indigenous trust
for non-Indigenous
people is low
Low importance
Believe Indigenous trust for
non-Indigenous people is high
Low importance
Believe Indigenous trust
for non-Indigenous
people is low
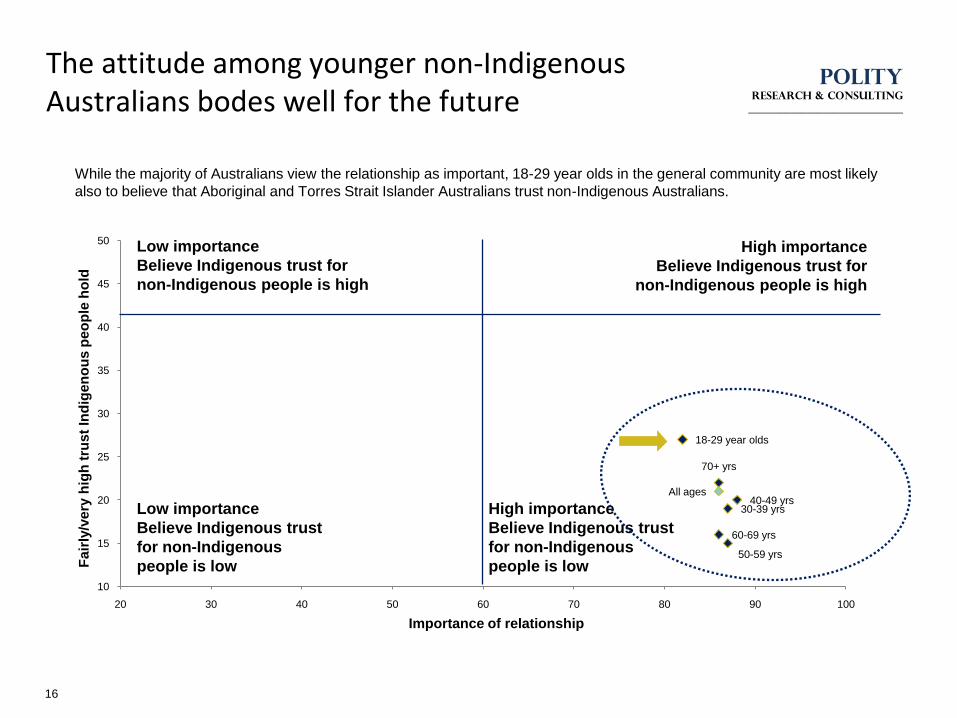
The attitude among younger non-Indigenous Australians bodes well for the future
16
While the majority of Australians view the relationship as important, 18-29 year olds in the general community are most likely
also to believe that Aboriginal and Torres Strait Islander Australians trust non-Indigenous Australians.
High importance
Believe Indigenous trust for
non-Indigenous people is high
POLITYRESEARCH & consulting
_____________________________
18-29 year olds
70+ yrs
40-49 yrs
50-59 yrs
60-69 yrs 30-39 yrs
All ages
10
15
20
25
30
35
40
45
50
40 50 60 70 80 90 100
Fair
ly/v
ery
hig
h t
rust
no
n-I
nd
igen
ou
s p
eo
ple
ho
ld
Importance of relationship
High importance
Believe non-Indigenous
trust for Indigenous
people is low
Low importance
Believe non-Indigenous trust
for Indigenous people is high
Low importance
Believe non-Indigenous
trust for Indigenous
people is low
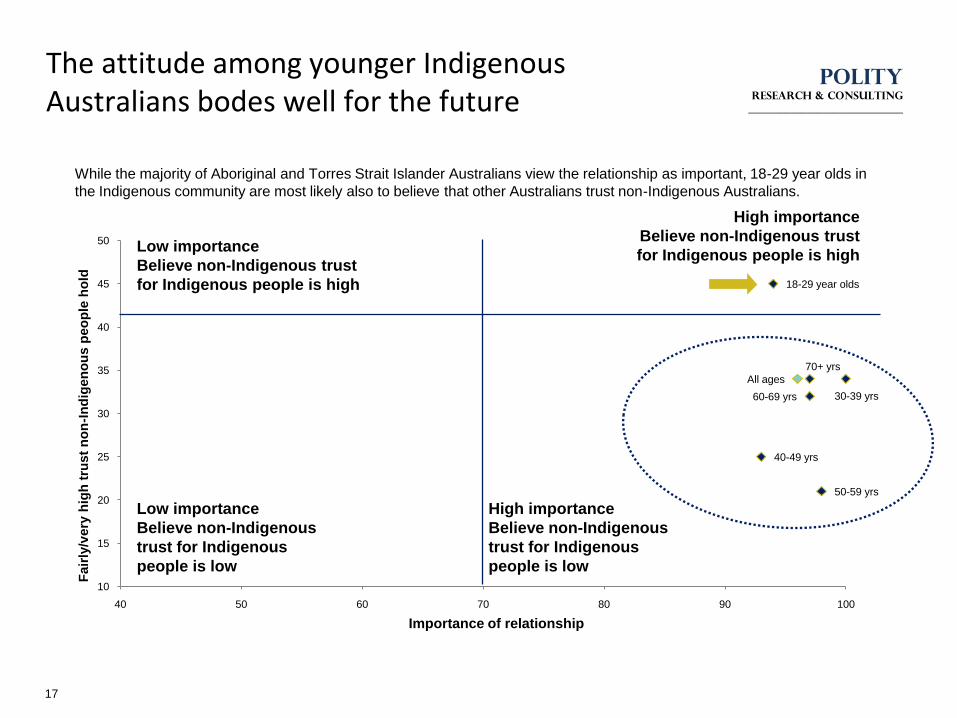
The attitude among younger Indigenous Australians bodes well for the future
17
While the majority of Aboriginal and Torres Strait Islander Australians view the relationship as important, 18-29 year olds in
the Indigenous community are most likely also to believe that other Australians trust non-Indigenous Australians.
High importance
Believe non-Indigenous trust
for Indigenous people is high
Australian Reconciliation Barometer 2014
18
Full results comparing Indigenous-only perspectives with the
general public
Race Relations
19
How do we see cultural diversity and how well do we treat
each other?
POLITYRESEARCH & consulting
_____________________________
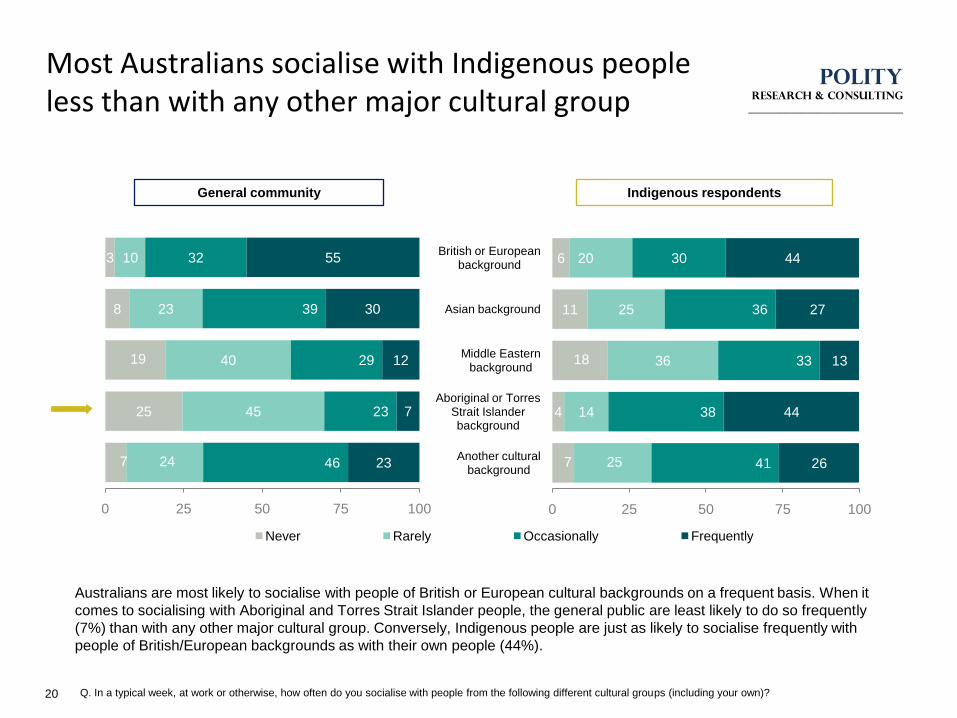
Most Australians socialise with Indigenous people less than with any other major cultural group
20
Australians are most likely to socialise with people of British or European cultural backgrounds on a frequent basis. When it
comes to socialising with Aboriginal and Torres Strait Islander people, the general public are least likely to do so frequently
(7%) than with any other major cultural group. Conversely, Indigenous people are just as likely to socialise frequently with
people of British/European backgrounds as with their own people (44%).
7
25
19
8
3
24
45
40
23
10
46
23
29
39
32
23
7
12
30
55
0 25 50 75 100
Never Rarely Occasionally Frequently
Q. In a typical week, at work or otherwise, how often do you socialise with people from the following different cultural groups (including your own)?
General community
7
4
18
11
6
25
14
36
25
20
41
38
33
36
30
26
44
13
27
44
0 25 50 75 100
Another cultural background
Aboriginal or Torres Strait Islander background
Middle Eastern background
Asian background
British or European background
Indigenous respondents
POLITYRESEARCH & consulting
_____________________________
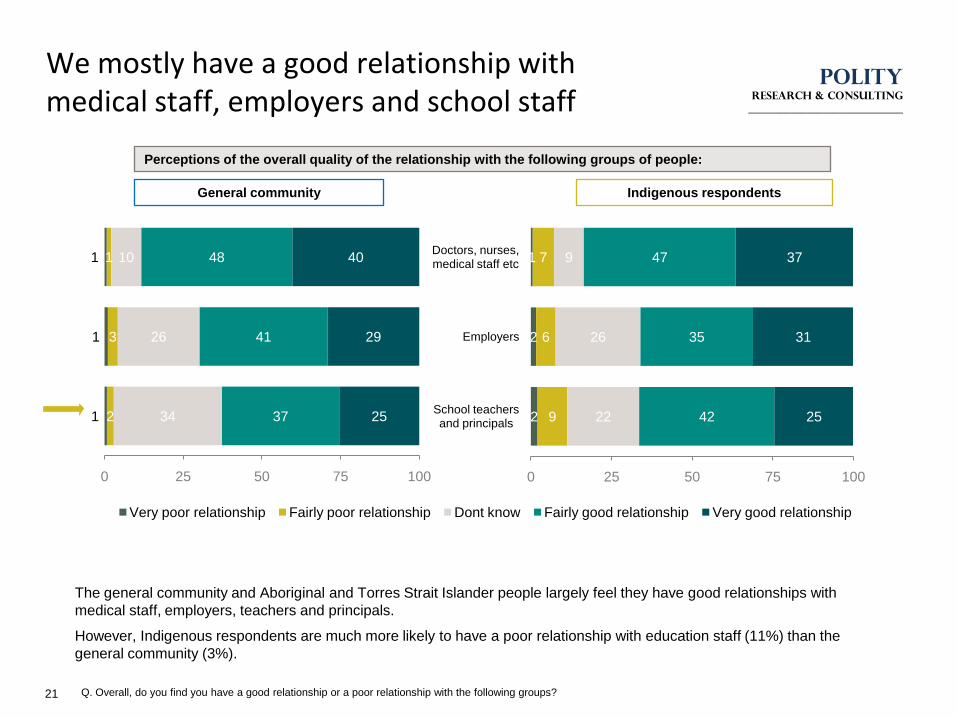
We mostly have a good relationship with medical staff, employers and school staff
21
The general community and Aboriginal and Torres Strait Islander people largely feel they have good relationships with
medical staff, employers, teachers and principals.
However, Indigenous respondents are much more likely to have a poor relationship with education staff (11%) than the
general community (3%).
Q. Overall, do you find you have a good relationship or a poor relationship with the following groups?
1
1
1
2
3
1
34
26
10
37
41
48
25
29
40
0 25 50 75 100
Very poor relationship Fairly poor relationship Dont know Fairly good relationship Very good relationship
General community Indigenous respondents
2
2
1
9
6
7
22
26
9
42
35
47
25
31
37
0 25 50 75 100
School teachers and principals
Employers
Doctors, nurses, medical staff etc
Perceptions of the overall quality of the relationship with the following groups of people:
POLITYRESEARCH & consulting
_____________________________
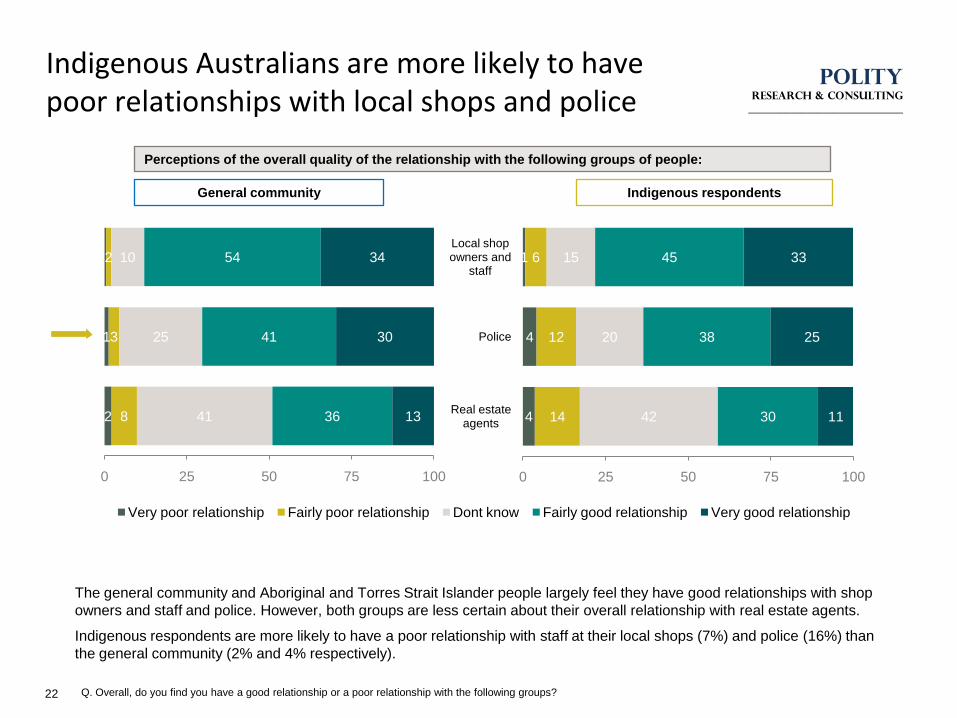
Indigenous Australians are more likely to have poor relationships with local shops and police
22
The general community and Aboriginal and Torres Strait Islander people largely feel they have good relationships with shop
owners and staff and police. However, both groups are less certain about their overall relationship with real estate agents.
Indigenous respondents are more likely to have a poor relationship with staff at their local shops (7%) and police (16%) than
the general community (2% and 4% respectively).
Q. Overall, do you find you have a good relationship or a poor relationship with the following groups?
2
1
8
3
2
41
25
10
36
41
54
13
30
34
0 25 50 75 100
Very poor relationship Fairly poor relationship Dont know Fairly good relationship Very good relationship
General community
4
4
1
14
12
6
42
20
15
30
38
45
11
25
33
0 25 50 75 100
Real estate agents
Police
Local shop owners and
staff
Perceptions of the overall quality of the relationship with the following groups of people:
Indigenous respondents
POLITYRESEARCH & consulting
_____________________________
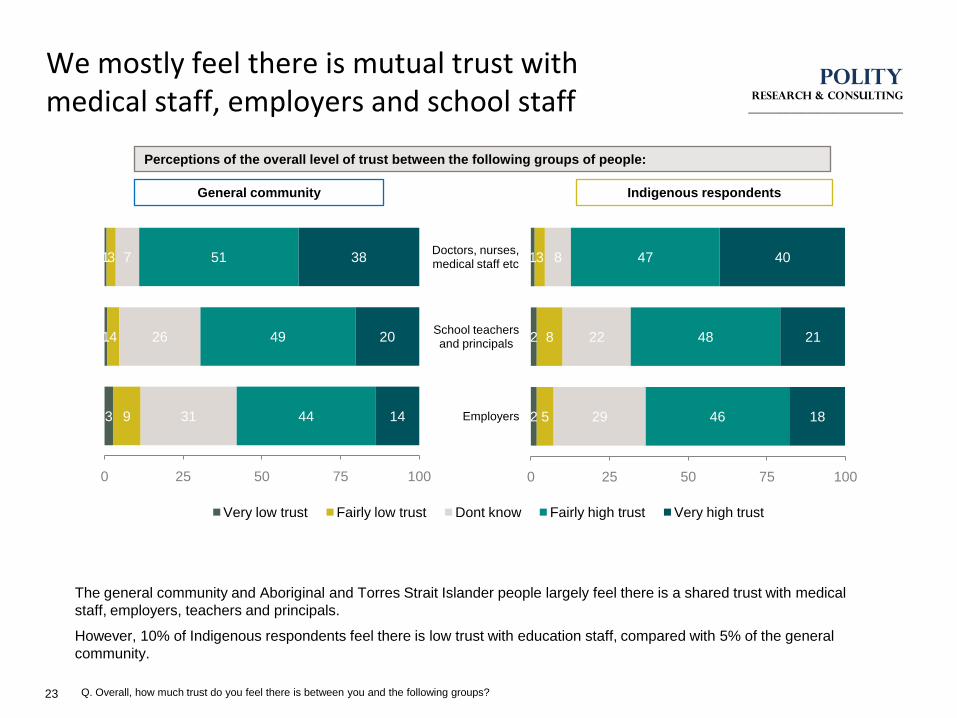
We mostly feel there is mutual trust with medical staff, employers and school staff
23
The general community and Aboriginal and Torres Strait Islander people largely feel there is a shared trust with medical
staff, employers, teachers and principals.
However, 10% of Indigenous respondents feel there is low trust with education staff, compared with 5% of the general
community.
Q. Overall, how much trust do you feel there is between you and the following groups?
3
1
1
9
4
3
31
26
7
44
49
51
14
20
38
0 25 50 75 100
Very low trust Fairly low trust Dont know Fairly high trust Very high trust
General community
2
2
1
5
8
3
29
22
8
46
48
47
18
21
40
0 25 50 75 100
Employers
School teachers and principals
Doctors, nurses, medical staff etc
Perceptions of the overall level of trust between the following groups of people:
Indigenous respondents
POLITYRESEARCH & consulting
_____________________________
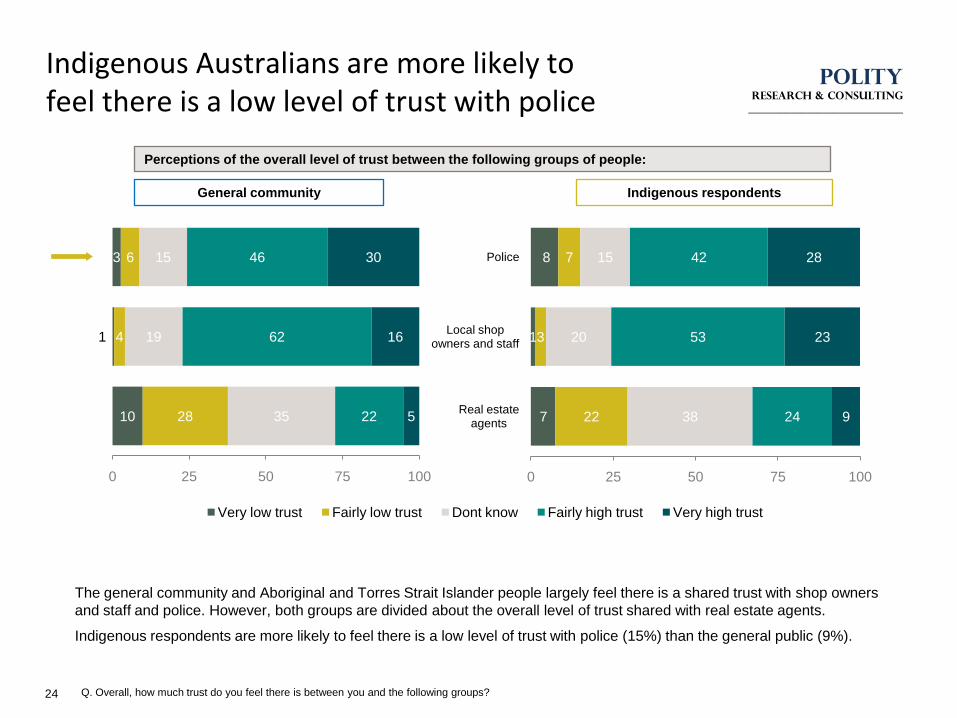
Indigenous Australians are more likely to feel there is a low level of trust with police
24
The general community and Aboriginal and Torres Strait Islander people largely feel there is a shared trust with shop owners
and staff and police. However, both groups are divided about the overall level of trust shared with real estate agents.
Indigenous respondents are more likely to feel there is a low level of trust with police (15%) than the general public (9%).
Q. Overall, how much trust do you feel there is between you and the following groups?
10
1
3
28
4
6
35
19
15
22
62
46
5
16
30
0 25 50 75 100
Very low trust Fairly low trust Dont know Fairly high trust Very high trust
General community
7
1
8
22
3
7
38
20
15
24
53
42
9
23
28
0 25 50 75 100
Real estate agents
Local shop owners and staff
Police
Perceptions of the overall level of trust between the following groups of people:
Indigenous respondents
POLITYRESEARCH & consulting
_____________________________
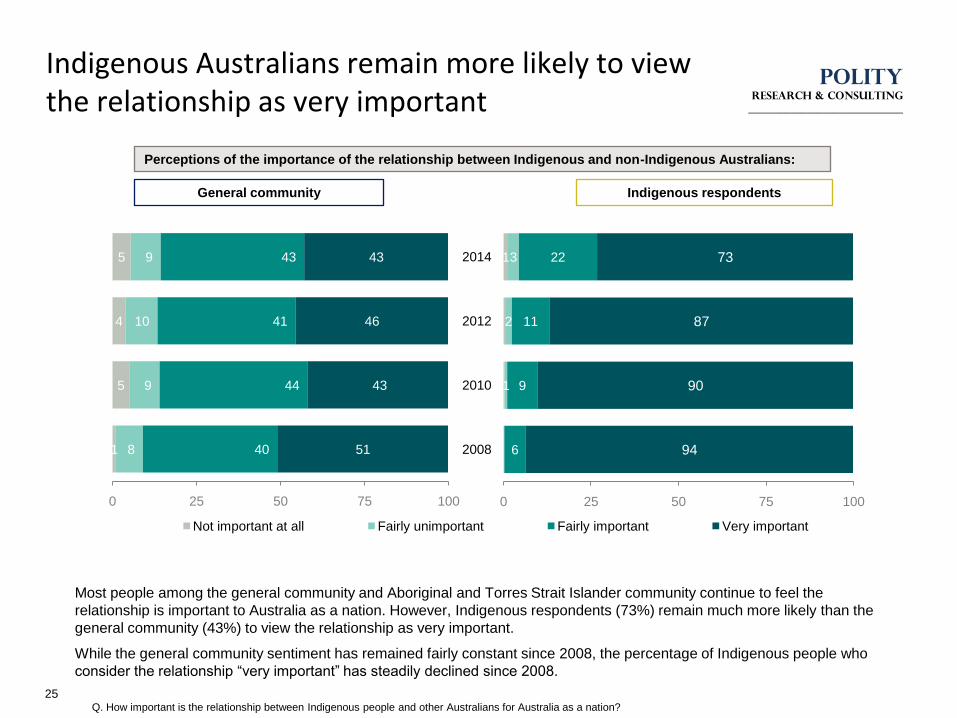
Indigenous Australians remain more likely to view the relationship as very important
25
Most people among the general community and Aboriginal and Torres Strait Islander community continue to feel the
relationship is important to Australia as a nation. However, Indigenous respondents (73%) remain much more likely than the
general community (43%) to view the relationship as very important.
While the general community sentiment has remained fairly constant since 2008, the percentage of Indigenous people who
consider the relationship “very important” has steadily declined since 2008.
1
5
4
5
8
9
10
9
40
44
41
43
51
43
46
43
0 25 50 75 100
Not important at all Fairly unimportant Fairly important Very important
0
0
0
1
1
2
3
6
9
11
22
94
90
87
73
0 25 50 75 100
2008
2010
2012
2014
Q. How important is the relationship between Indigenous people and other Australians for Australia as a nation?
Indigenous respondentsGeneral community
Perceptions of the importance of the relationship between Indigenous and non-Indigenous Australians:
POLITYRESEARCH & consulting
_____________________________
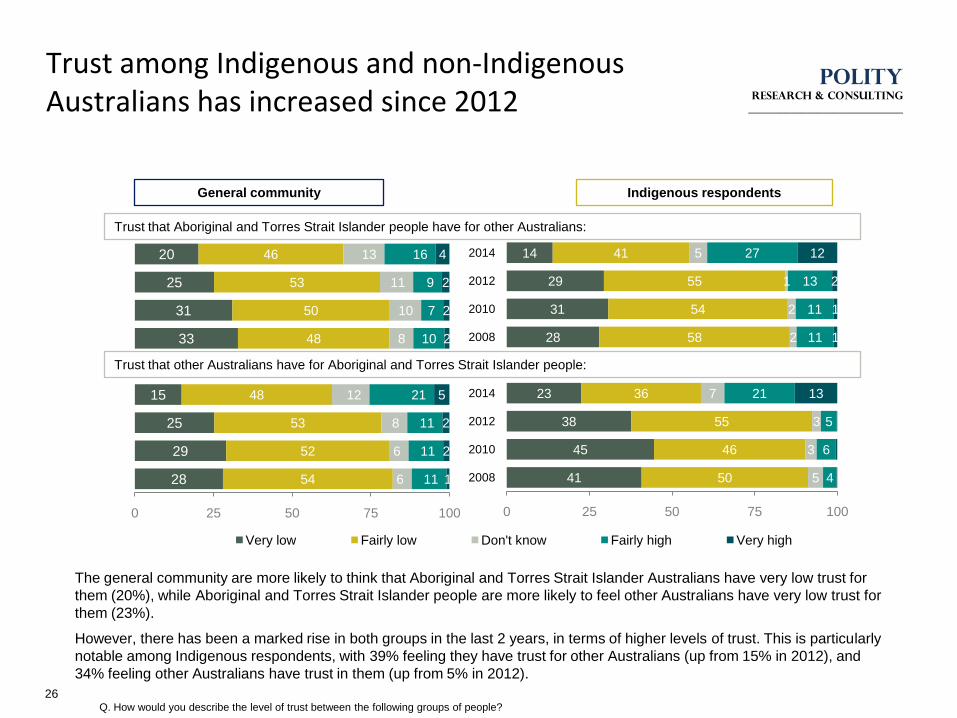
Trust among Indigenous and non-Indigenous Australians has increased since 2012
26
The general community are more likely to think that Aboriginal and Torres Strait Islander Australians have very low trust for
them (20%), while Aboriginal and Torres Strait Islander people are more likely to feel other Australians have very low trust for
them (23%).
However, there has been a marked rise in both groups in the last 2 years, in terms of higher levels of trust. This is particularly
notable among Indigenous respondents, with 39% feeling they have trust for other Australians (up from 15% in 2012), and
34% feeling other Australians have trust in them (up from 5% in 2012).
28
29
25
15
33
31
25
20
54
52
53
48
48
50
53
46
6
6
8
12
8
10
11
13
11
11
11
21
10
7
9
16
1
2
2
5
2
2
2
4
0 25 50 75 100
Very low Fairly low Don't know Fairly high Very high
41
45
38
23
28
31
29
14
50
46
55
36
58
54
55
41
5
3
3
7
2
2
1
5
4
6
5
21
11
11
13
27
13
1
1
2
12
0 25 50 75 100
2008
2010
2012
2014
2008
2010
2012
2014
Q. How would you describe the level of trust between the following groups of people?
General community Indigenous respondents
Trust that Aboriginal and Torres Strait Islander people have for other Australians:
Trust that other Australians have for Aboriginal and Torres Strait Islander people:
POLITYRESEARCH & consulting
_____________________________
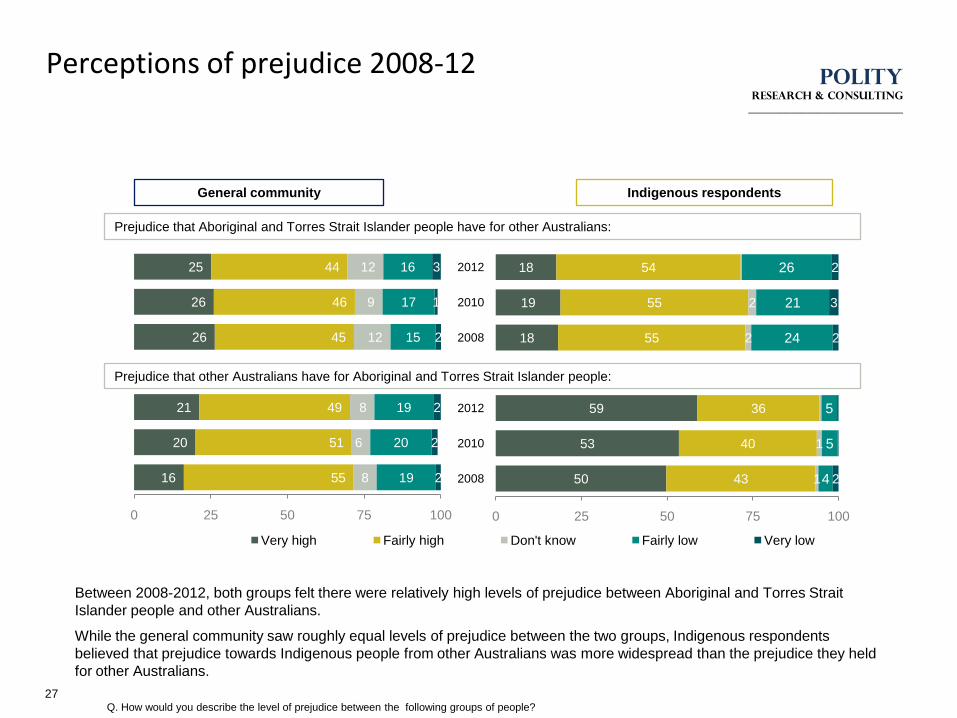
Perceptions of prejudice 2008-12
27
Between 2008-2012, both groups felt there were relatively high levels of prejudice between Aboriginal and Torres Strait
Islander people and other Australians.
While the general community saw roughly equal levels of prejudice between the two groups, Indigenous respondents
believed that prejudice towards Indigenous people from other Australians was more widespread than the prejudice they held
for other Australians.
16
20
21
26
26
25
55
51
49
45
46
44
8
6
8
12
9
12
19
20
19
15
17
16
2
2
2
2
1
3
0 25 50 75 100
Very high Fairly high Don't know Fairly low Very low
50
53
59
18
19
18
43
40
36
55
55
54
1
1
2
2
4
5
5
24
21
26
2
2
3
2
0 25 50 75 100
2008
2010
2012
2008
2010
2012
Q. How would you describe the level of prejudice between the following groups of people?
General community Indigenous respondents
Prejudice that Aboriginal and Torres Strait Islander people have for other Australians:
Prejudice that other Australians have for Aboriginal and Torres Strait Islander people:
POLITYRESEARCH & consulting
_____________________________
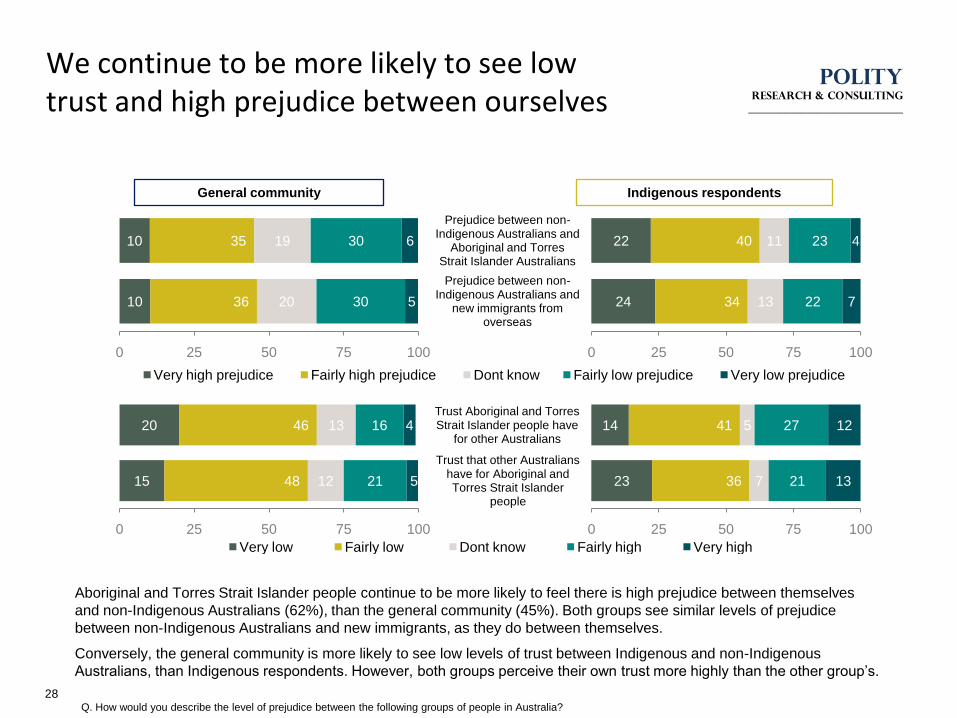
We continue to be more likely to see low trust and high prejudice between ourselves
28
Aboriginal and Torres Strait Islander people continue to be more likely to feel there is high prejudice between themselves
and non-Indigenous Australians (62%), than the general community (45%). Both groups see similar levels of prejudice
between non-Indigenous Australians and new immigrants, as they do between themselves.
Conversely, the general community is more likely to see low levels of trust between Indigenous and non-Indigenous
Australians, than Indigenous respondents. However, both groups perceive their own trust more highly than the other group‟s.
Q. How would you describe the level of prejudice between the following groups of people in Australia?
10
10
36
35
20
19
30
30
5
6
0 25 50 75 100
Very high prejudice Fairly high prejudice Dont know Fairly low prejudice Very low prejudice
General community Indigenous respondents
15
20
48
46
12
13
21
16
5
4
0 25 50 75 100
Very low Fairly low Dont know Fairly high Very high
24
22
34
40
13
11
22
23
7
4
0 25 50 75 100
Prejudice between non-Indigenous Australians and
new immigrants from overseas
Prejudice between non-Indigenous Australians and
Aboriginal and Torres Strait Islander Australians
23
14
36
41
7
5
21
27
13
12
0 25 50 75 100
Trust that other Australians have for Aboriginal and Torres Strait Islander
people
Trust Aboriginal and Torres Strait Islander people have
for other Australians
POLITYRESEARCH & consulting
_____________________________
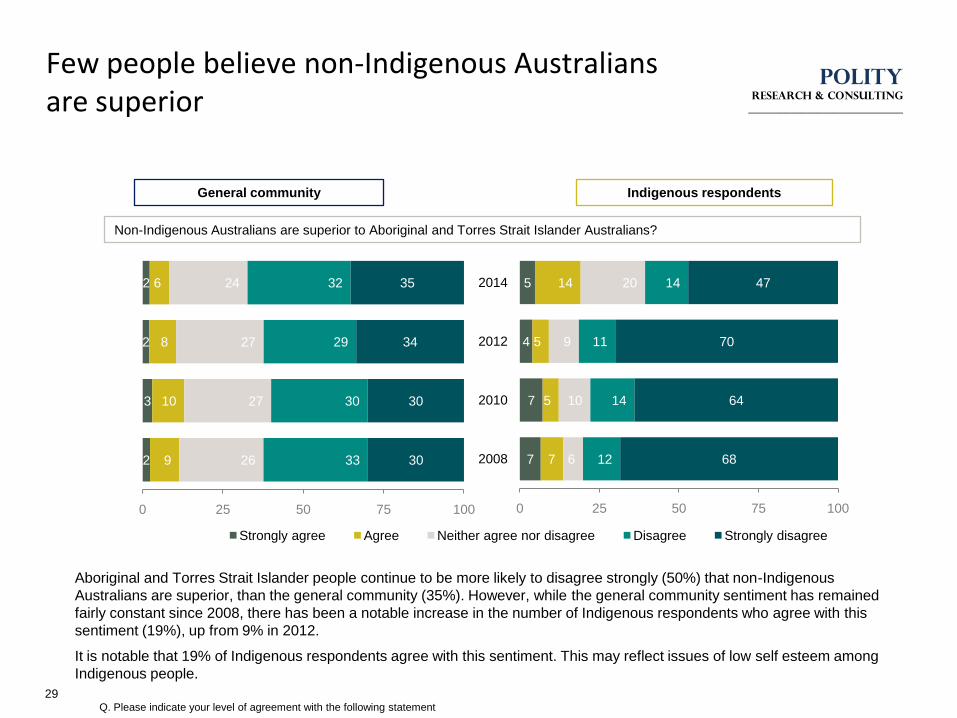
Few people believe non-Indigenous Australians are superior
29
Aboriginal and Torres Strait Islander people continue to be more likely to disagree strongly (50%) that non-Indigenous
Australians are superior, than the general community (35%). However, while the general community sentiment has remained
fairly constant since 2008, there has been a notable increase in the number of Indigenous respondents who agree with this
sentiment (19%), up from 9% in 2012.
It is notable that 19% of Indigenous respondents agree with this sentiment. This may reflect issues of low self esteem among
Indigenous people.
2
3
2
2
9
10
8
6
26
27
27
24
33
30
29
32
30
30
34
35
0 25 50 75 100
Strongly agree Agree Neither agree nor disagree Disagree Strongly disagree
7
7
4
5
7
5
5
14
6
10
9
20
12
14
11
14
68
64
70
47
0 25 50 75 100
2008
2010
2012
2014
Q. Please indicate your level of agreement with the following statement
General community Indigenous respondents
Non-Indigenous Australians are superior to Aboriginal and Torres Strait Islander Australians?
POLITYRESEARCH & consulting
_____________________________
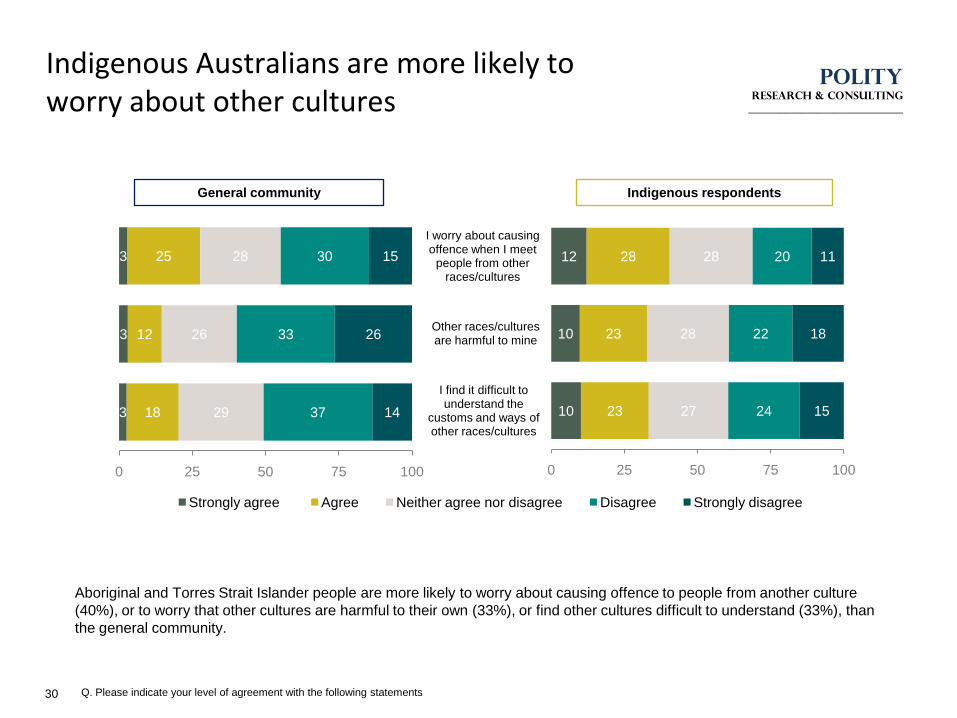
Indigenous Australians are more likely to worry about other cultures
30
Aboriginal and Torres Strait Islander people are more likely to worry about causing offence to people from another culture
(40%), or to worry that other cultures are harmful to their own (33%), or find other cultures difficult to understand (33%), than
the general community.
Q. Please indicate your level of agreement with the following statements
3
3
3
18
12
25
29
26
28
37
33
30
14
26
15
0 25 50 75 100
Strongly agree Agree Neither agree nor disagree Disagree Strongly disagree
General community
10
10
12
23
23
28
27
28
28
24
22
20
15
18
11
0 25 50 75 100
I find it difficult to understand the
customs and ways of other races/cultures
Other races/cultures are harmful to mine
I worry about causing offence when I meet
people from other races/cultures
Indigenous respondents
POLITYRESEARCH & consulting
_____________________________
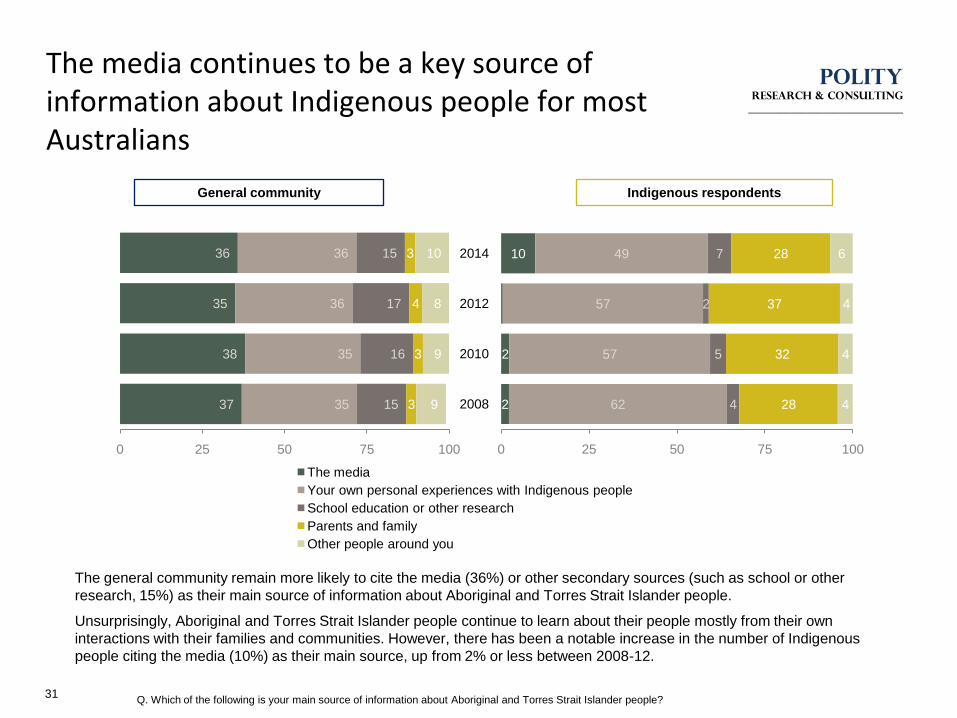
The media continues to be a key source of information about Indigenous people for most Australians
31
The general community remain more likely to cite the media (36%) or other secondary sources (such as school or other
research, 15%) as their main source of information about Aboriginal and Torres Strait Islander people.
Unsurprisingly, Aboriginal and Torres Strait Islander people continue to learn about their people mostly from their own
interactions with their families and communities. However, there has been a notable increase in the number of Indigenous
people citing the media (10%) as their main source, up from 2% or less between 2008-12.
37
38
35
36
35
35
36
36
15
16
17
15
3
3
4
3
9
9
8
10
0 25 50 75 100
The media
Your own personal experiences with Indigenous people
School education or other research
Parents and family
Other people around you
2
2
10
62
57
57
49
4
5
2
7
28
32
37
28
4
4
4
6
0 25 50 75 100
2008
2010
2012
2014
Q. Which of the following is your main source of information about Aboriginal and Torres Strait Islander people?
General community Indigenous respondents
POLITYRESEARCH & consulting
_____________________________
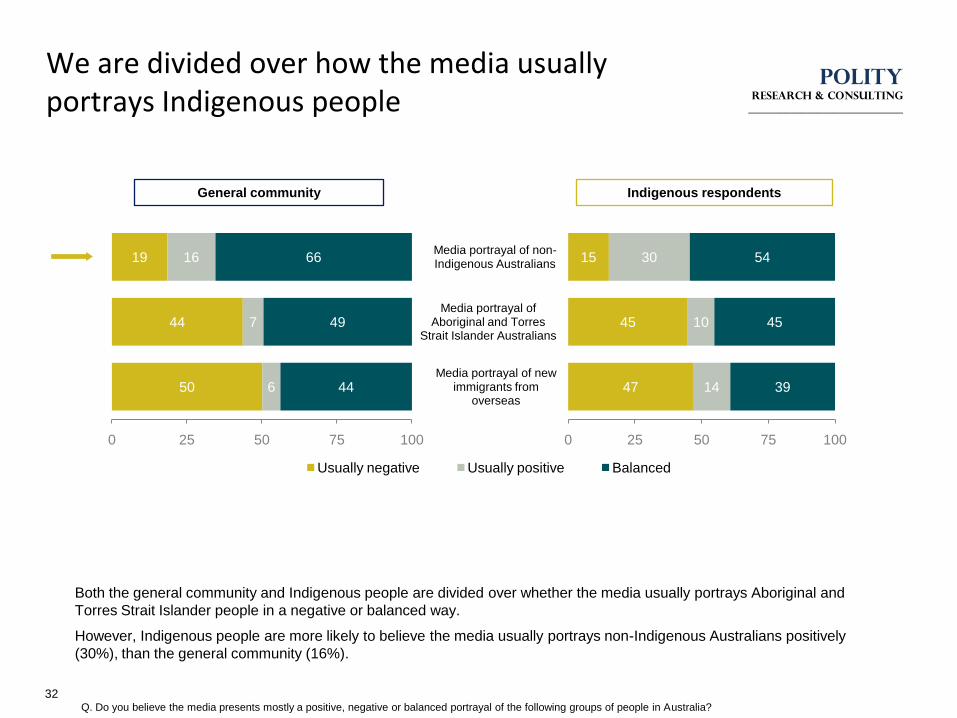
We are divided over how the media usually portrays Indigenous people
32
Both the general community and Indigenous people are divided over whether the media usually portrays Aboriginal and
Torres Strait Islander people in a negative or balanced way.
However, Indigenous people are more likely to believe the media usually portrays non-Indigenous Australians positively
(30%), than the general community (16%).
Q. Do you believe the media presents mostly a positive, negative or balanced portrayal of the following groups of people in Australia?
50
44
19
6
7
16
44
49
66
0 25 50 75 100
Usually negative Usually positive Balanced
General community
47 14 39
45
15
10
30
45
54
0 25 50 75 100
Media portrayal of new immigrants from
overseas
Media portrayal of Aboriginal and Torres
Strait Islander Australians
Media portrayal of non-Indigenous Australians
Indigenous respondents
POLITYRESEARCH & consulting
_____________________________
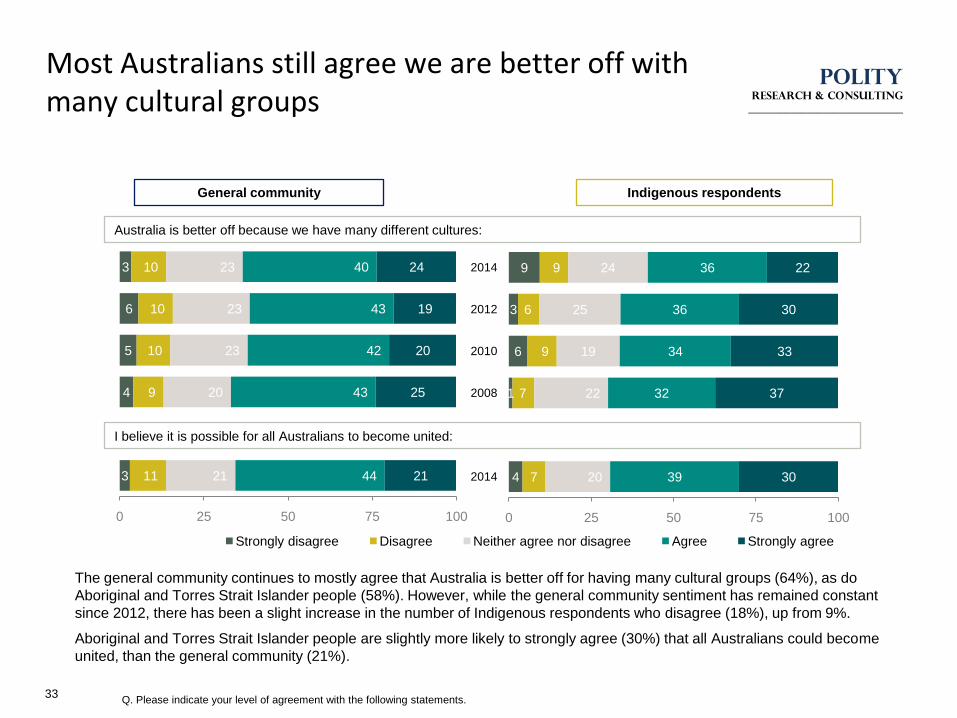
Most Australians still agree we are better off with many cultural groups
33
The general community continues to mostly agree that Australia is better off for having many cultural groups (64%), as do
Aboriginal and Torres Strait Islander people (58%). However, while the general community sentiment has remained constant
since 2012, there has been a slight increase in the number of Indigenous respondents who disagree (18%), up from 9%.
Aboriginal and Torres Strait Islander people are slightly more likely to strongly agree (30%) that all Australians could become
united, than the general community (21%).
3
4
5
6
3
11
9
10
10
10
21
20
23
23
23
44
43
42
43
40
21
25
20
19
24
0 25 50 75 100
Strongly disagree Disagree Neither agree nor disagree Agree Strongly agree
4
1
6
3
9
7
7
9
6
9
20
22
19
25
24
39
32
34
36
36
30
37
33
30
22
0 25 50 75 100
2014
2008
2010
2012
2014
Q. Please indicate your level of agreement with the following statements.
General community Indigenous respondents
Australia is better off because we have many different cultures:
I believe it is possible for all Australians to become united:
POLITYRESEARCH & consulting
_____________________________
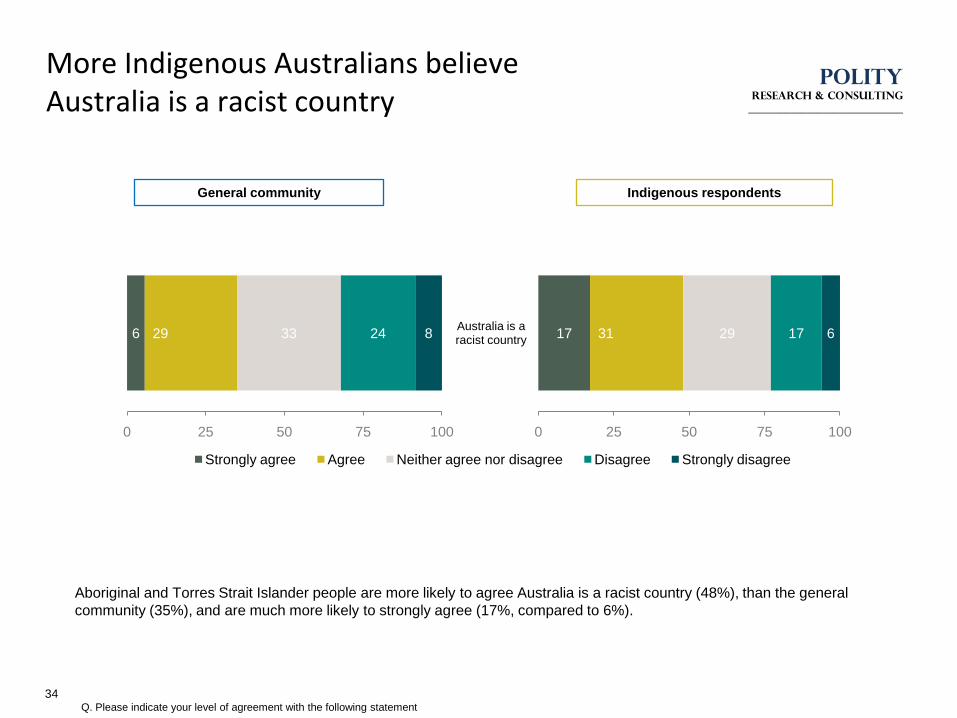
More Indigenous Australians believe Australia is a racist country
34
Aboriginal and Torres Strait Islander people are more likely to agree Australia is a racist country (48%), than the general
community (35%), and are much more likely to strongly agree (17%, compared to 6%).
Q. Please indicate your level of agreement with the following statement
6 29 33 24 8
0 25 50 75 100
Strongly agree Agree Neither agree nor disagree Disagree Strongly disagree
General community
17 31 29 17 6
0 25 50 75 100
Australia is a racist country
Indigenous respondents
POLITYRESEARCH & consulting
_____________________________
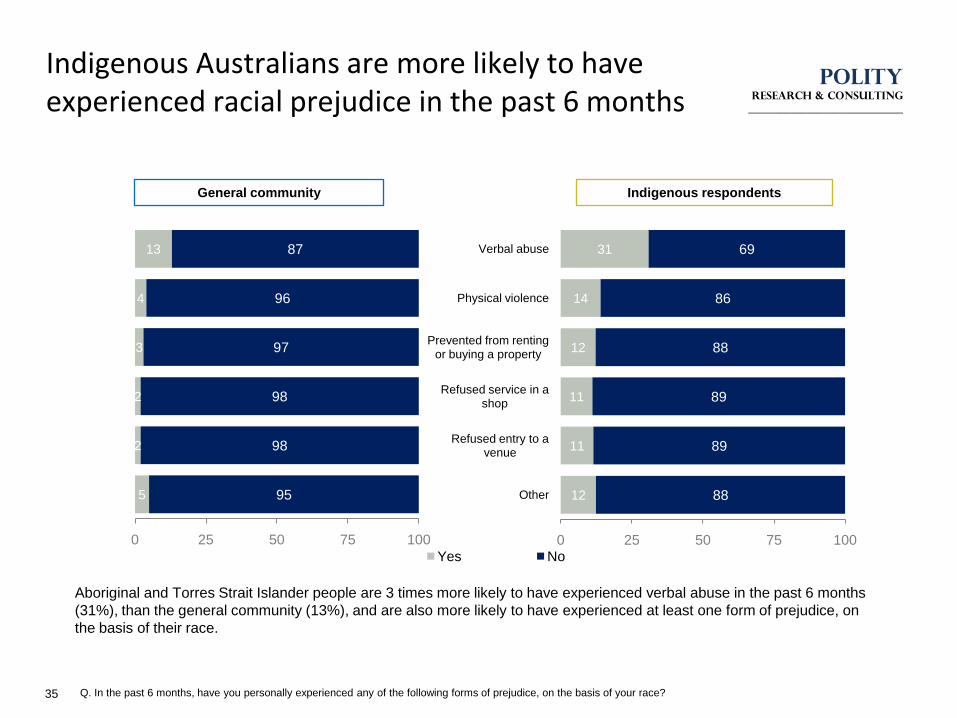
Indigenous Australians are more likely to have experienced racial prejudice in the past 6 months
35
Aboriginal and Torres Strait Islander people are 3 times more likely to have experienced verbal abuse in the past 6 months
(31%), than the general community (13%), and are also more likely to have experienced at least one form of prejudice, on
the basis of their race.
5
2
2
3
4
13
95
98
98
97
96
87
0 25 50 75 100
Yes No
Q. In the past 6 months, have you personally experienced any of the following forms of prejudice, on the basis of your race?
General community
12 88
11
11
12
14
31
89
89
88
86
69
0 25 50 75 100
Other
Refused entry to a venue
Refused service in a shop
Prevented from renting or buying a property
Physical violence
Verbal abuse
Indigenous respondents
POLITYRESEARCH & consulting
_____________________________
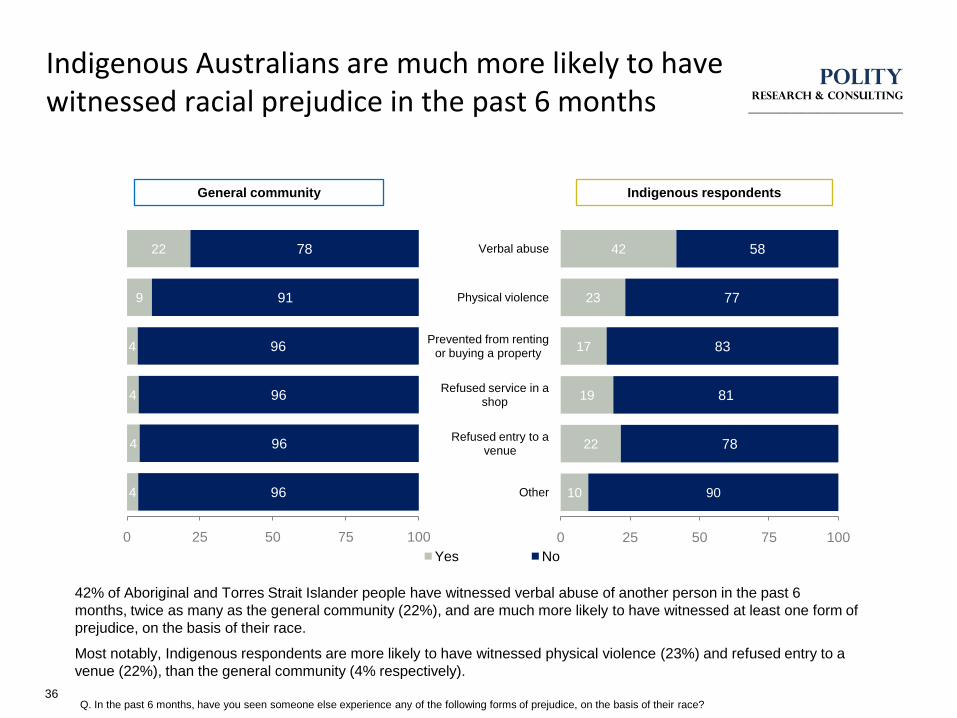
Indigenous Australians are much more likely to have witnessed racial prejudice in the past 6 months
36
42% of Aboriginal and Torres Strait Islander people have witnessed verbal abuse of another person in the past 6
months, twice as many as the general community (22%), and are much more likely to have witnessed at least one form of
prejudice, on the basis of their race.
Most notably, Indigenous respondents are more likely to have witnessed physical violence (23%) and refused entry to a
venue (22%), than the general community (4% respectively).
4
4
4
4
9
22
96
96
96
96
91
78
0 25 50 75 100
Yes No
Q. In the past 6 months, have you seen someone else experience any of the following forms of prejudice, on the basis of their race?
General community
10 90
22
19
17
23
42
78
81
83
77
58
0 25 50 75 100
Other
Refused entry to a venue
Refused service in a shop
Prevented from renting or buying a property
Physical violence
Verbal abuse
Indigenous respondents
POLITYRESEARCH & consulting
_____________________________
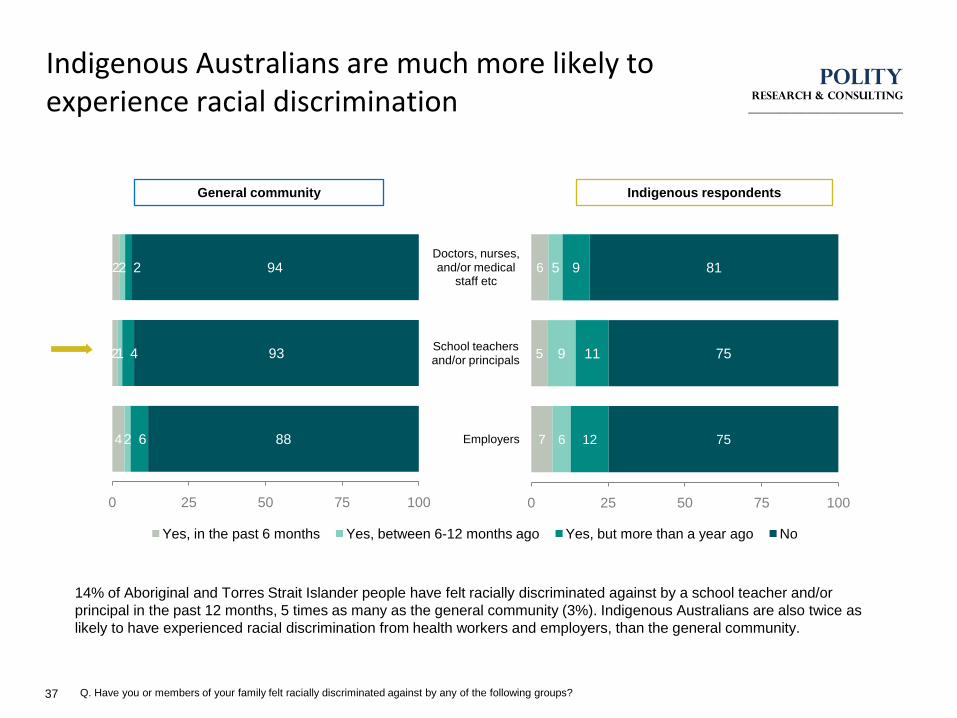
Indigenous Australians are much more likely to experience racial discrimination
37
14% of Aboriginal and Torres Strait Islander people have felt racially discriminated against by a school teacher and/or
principal in the past 12 months, 5 times as many as the general community (3%). Indigenous Australians are also twice as
likely to have experienced racial discrimination from health workers and employers, than the general community.
4
2
2
2
1
2
6
4
2
88
93
94
0 25 50 75 100
Yes, in the past 6 months Yes, between 6-12 months ago Yes, but more than a year ago No
Q. Have you or members of your family felt racially discriminated against by any of the following groups?
General community
7 6 12 75
5
6
9
5
11
9
75
81
0 25 50 75 100
Employers
School teachers and/or principals
Doctors, nurses, and/or medical
staff etc
Indigenous respondents
POLITYRESEARCH & consulting
_____________________________
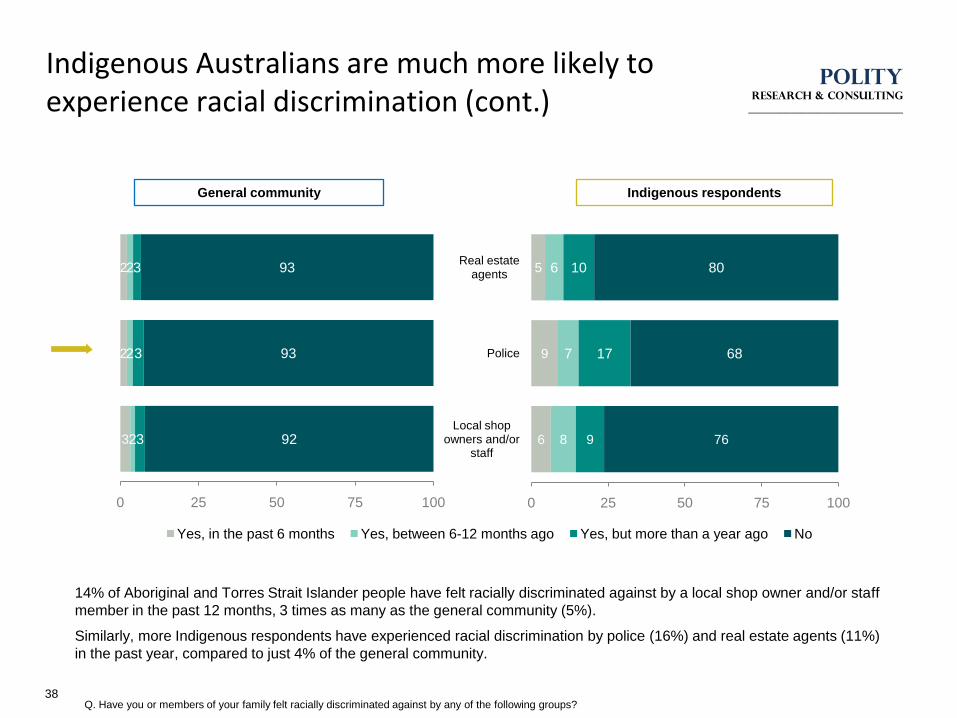
Indigenous Australians are much more likely to experience racial discrimination (cont.)
38
14% of Aboriginal and Torres Strait Islander people have felt racially discriminated against by a local shop owner and/or staff
member in the past 12 months, 3 times as many as the general community (5%).
Similarly, more Indigenous respondents have experienced racial discrimination by police (16%) and real estate agents (11%)
in the past year, compared to just 4% of the general community.
3
2
2
2
2
2
3
3
3
92
93
93
0 25 50 75 100
Yes, in the past 6 months Yes, between 6-12 months ago Yes, but more than a year ago No
Q. Have you or members of your family felt racially discriminated against by any of the following groups?
General community
6 8 9 76
9
5
7
6
17
10
68
80
0 25 50 75 100
Local shop owners and/or
staff
Police
Real estate agents
Indigenous respondents
Unity
39
How much do we all value Aboriginal and Torres Strait
Islander cultures?
POLITYRESEARCH & consulting
_____________________________
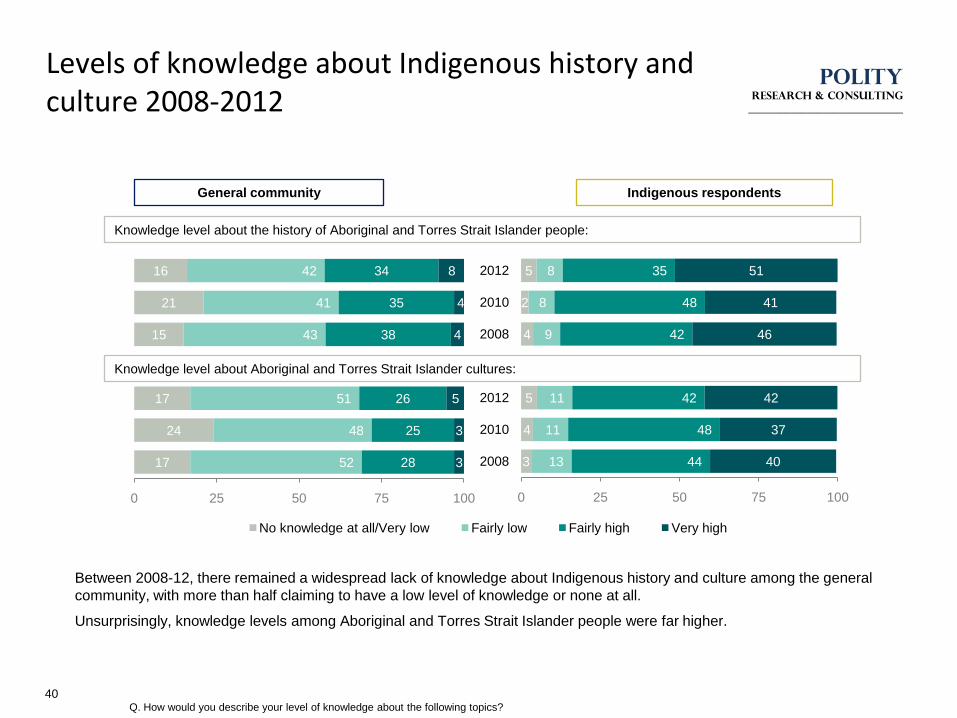
Levels of knowledge about Indigenous history and culture 2008-2012
40
Between 2008-12, there remained a widespread lack of knowledge about Indigenous history and culture among the general
community, with more than half claiming to have a low level of knowledge or none at all.
Unsurprisingly, knowledge levels among Aboriginal and Torres Strait Islander people were far higher.
17
24
17
15
21
16
52
48
51
43
41
42
28
25
26
38
35
34
3
3
5
4
4
8
0 25 50 75 100
No knowledge at all/Very low Fairly low Fairly high Very high
3
4
5
4
2
5
13
11
11
9
8
8
44
48
42
42
48
35
40
37
42
46
41
51
0 25 50 75 100
2008
2010
2012
2008
2010
2012
Q. How would you describe your level of knowledge about the following topics?
Knowledge level about the history of Aboriginal and Torres Strait Islander people:
Knowledge level about Aboriginal and Torres Strait Islander cultures:
General community Indigenous respondents
POLITYRESEARCH & consulting
_____________________________
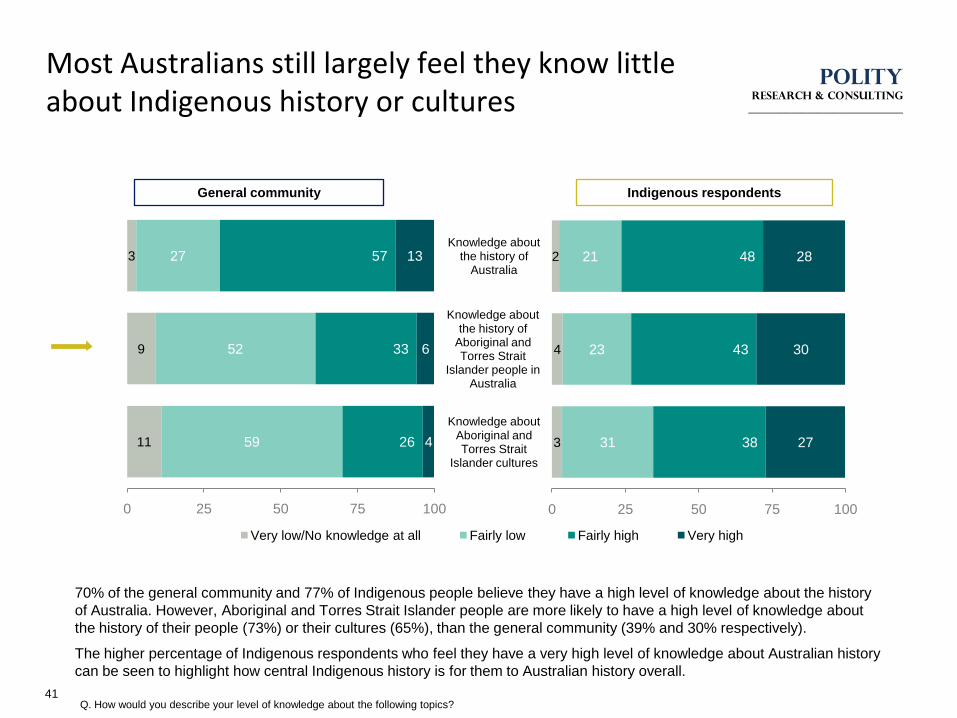
Most Australians still largely feel they know little about Indigenous history or cultures
41
70% of the general community and 77% of Indigenous people believe they have a high level of knowledge about the history
of Australia. However, Aboriginal and Torres Strait Islander people are more likely to have a high level of knowledge about
the history of their people (73%) or their cultures (65%), than the general community (39% and 30% respectively).
The higher percentage of Indigenous respondents who feel they have a very high level of knowledge about Australian history
can be seen to highlight how central Indigenous history is for them to Australian history overall.
11
9
3
59
52
27
26
33
57
4
6
13
0 25 50 75 100
Very low/No knowledge at all Fairly low Fairly high Very high
Q. How would you describe your level of knowledge about the following topics?
General community
3
4
2
31
23
21
38
43
48
27
30
28
0 25 50 75 100
Knowledge about Aboriginal and Torres Strait
Islander cultures
Knowledge about the history of
Aboriginal and Torres Strait
Islander people in Australia
Knowledge about the history of
Australia
Indigenous respondents
POLITYRESEARCH & consulting
_____________________________
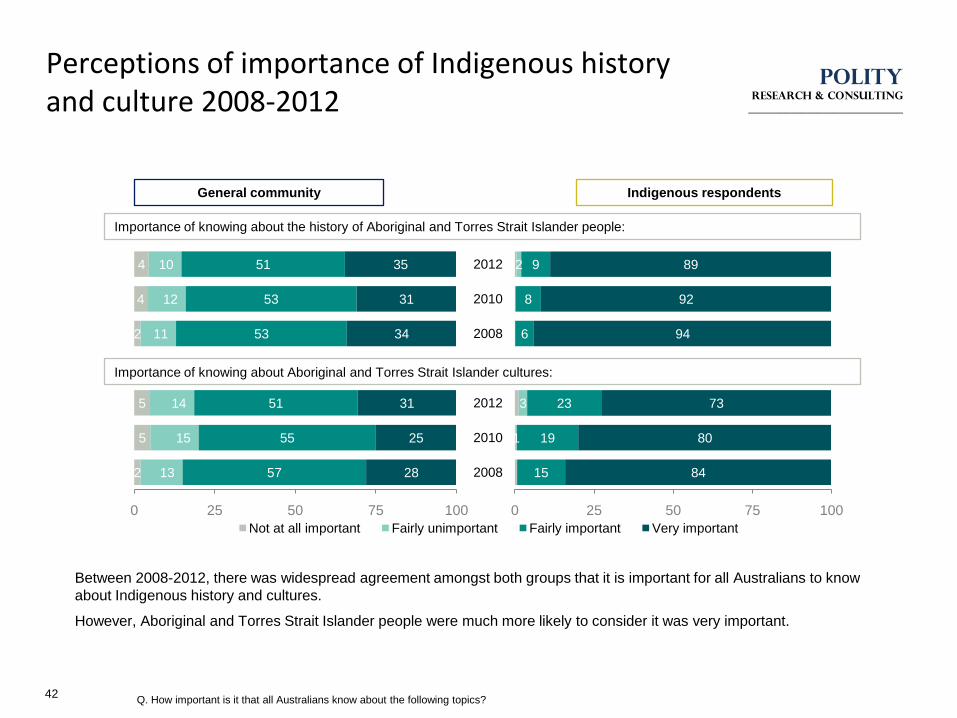
Perceptions of importance of Indigenous history and culture 2008-2012
42
Between 2008-2012, there was widespread agreement amongst both groups that it is important for all Australians to know
about Indigenous history and cultures.
However, Aboriginal and Torres Strait Islander people were much more likely to consider it was very important.
2
5
5
2
4
4
13
15
14
11
12
10
57
55
51
53
53
51
28
25
31
34
31
35
0 25 50 75 100
Not at all important Fairly unimportant Fairly important Very important
1
3
2
15
19
23
6
8
9
84
80
73
94
92
89
0 25 50 75 100
2008
2010
2012
2008
2010
2012
Q. How important is it that all Australians know about the following topics?
Importance of knowing about the history of Aboriginal and Torres Strait Islander people:
Importance of knowing about Aboriginal and Torres Strait Islander cultures:
General community Indigenous respondents
POLITYRESEARCH & consulting
_____________________________
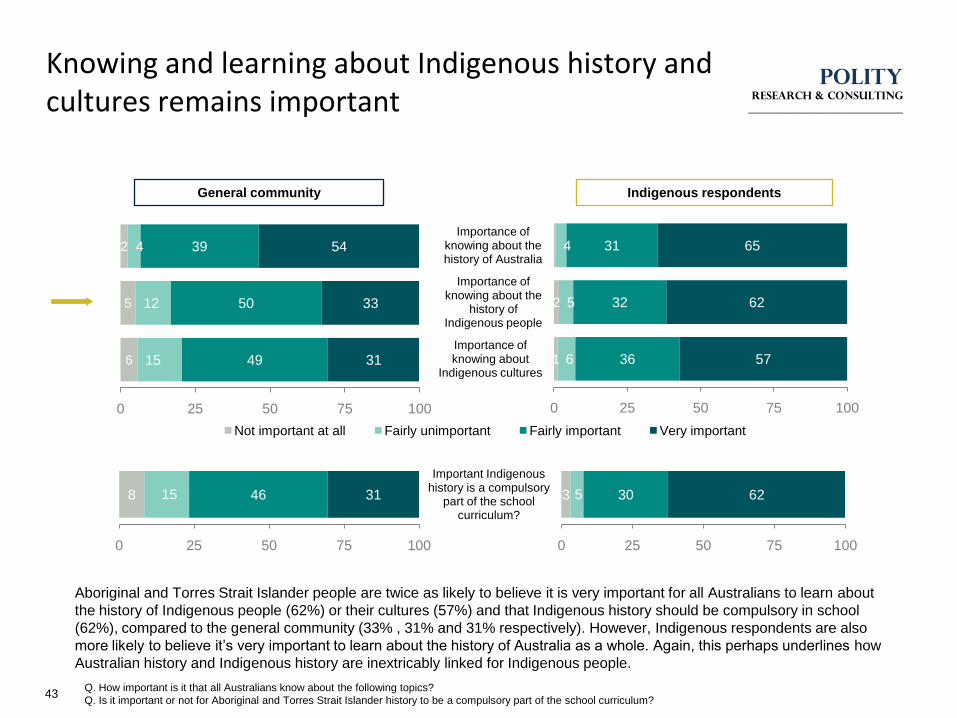
Knowing and learning about Indigenous history and cultures remains important
43
Aboriginal and Torres Strait Islander people are twice as likely to believe it is very important for all Australians to learn about
the history of Indigenous people (62%) or their cultures (57%) and that Indigenous history should be compulsory in school
(62%), compared to the general community (33% , 31% and 31% respectively). However, Indigenous respondents are also
more likely to believe it‟s very important to learn about the history of Australia as a whole. Again, this perhaps underlines how
Australian history and Indigenous history are inextricably linked for Indigenous people.
6
5
2
15
12
4
49
50
39
31
33
54
0 25 50 75 100
Not important at all Fairly unimportant Fairly important Very important
Q. How important is it that all Australians know about the following topics?
Q. Is it important or not for Aboriginal and Torres Strait Islander history to be a compulsory part of the school curriculum?
General community
1
2
6
5
4
36
32
31
57
62
65
0 25 50 75 100
Importance of knowing about
Indigenous cultures
Importance of knowing about the
history of Indigenous people
Importance of knowing about the history of Australia
Indigenous respondents
8 15 46 31
0 25 50 75 100
3 5 30 62
0 25 50 75 100
Important Indigenous history is a compulsory
part of the school curriculum?
POLITYRESEARCH & consulting
_____________________________
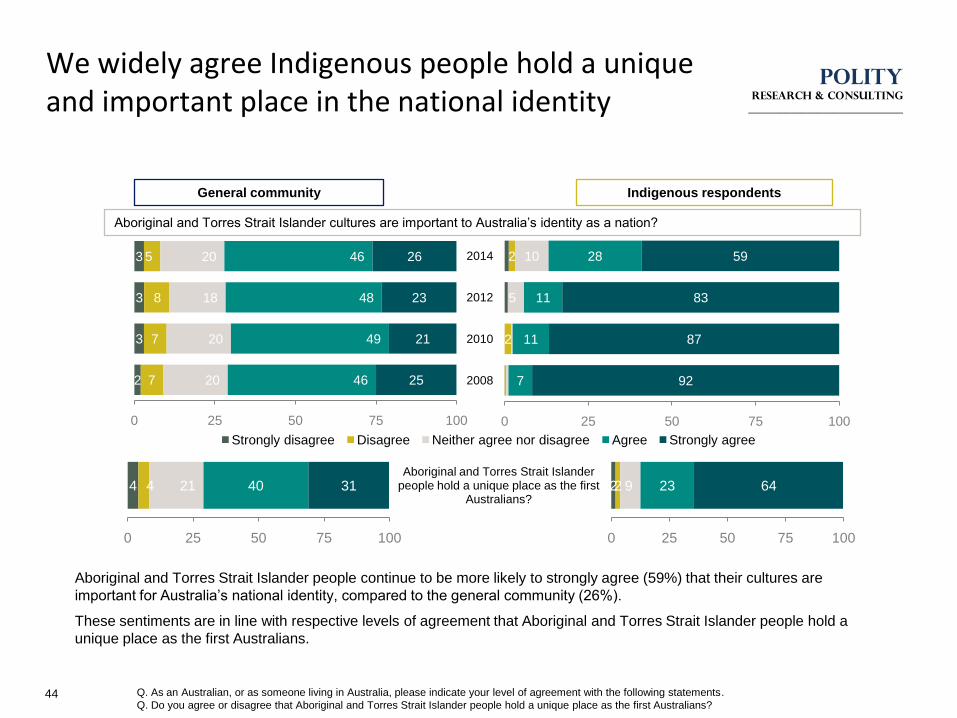
We widely agree Indigenous people hold a unique and important place in the national identity
44
Aboriginal and Torres Strait Islander people continue to be more likely to strongly agree (59%) that their cultures are
important for Australia‟s national identity, compared to the general community (26%).
These sentiments are in line with respective levels of agreement that Aboriginal and Torres Strait Islander people hold a
unique place as the first Australians.
2
3
3
3
7
7
8
5
20
20
18
20
46
49
48
46
25
21
23
26
0 25 50 75 100
Strongly disagree Disagree Neither agree nor disagree Agree Strongly agree
2
2
5
10
7
11
11
28
92
87
83
59
0 25 50 75 100
2008
2010
2012
2014
Q. As an Australian, or as someone living in Australia, please indicate your level of agreement with the following statements.
Q. Do you agree or disagree that Aboriginal and Torres Strait Islander people hold a unique place as the first Australians?
General community Indigenous respondents
Aboriginal and Torres Strait Islander cultures are important to Australia‟s identity as a nation?
4 4 21 40 31
0 25 50 75 100
22 9 23 64
0 25 50 75 100
Aboriginal and Torres Strait Islander people hold a unique place as the first
Australians?
POLITYRESEARCH & consulting
_____________________________
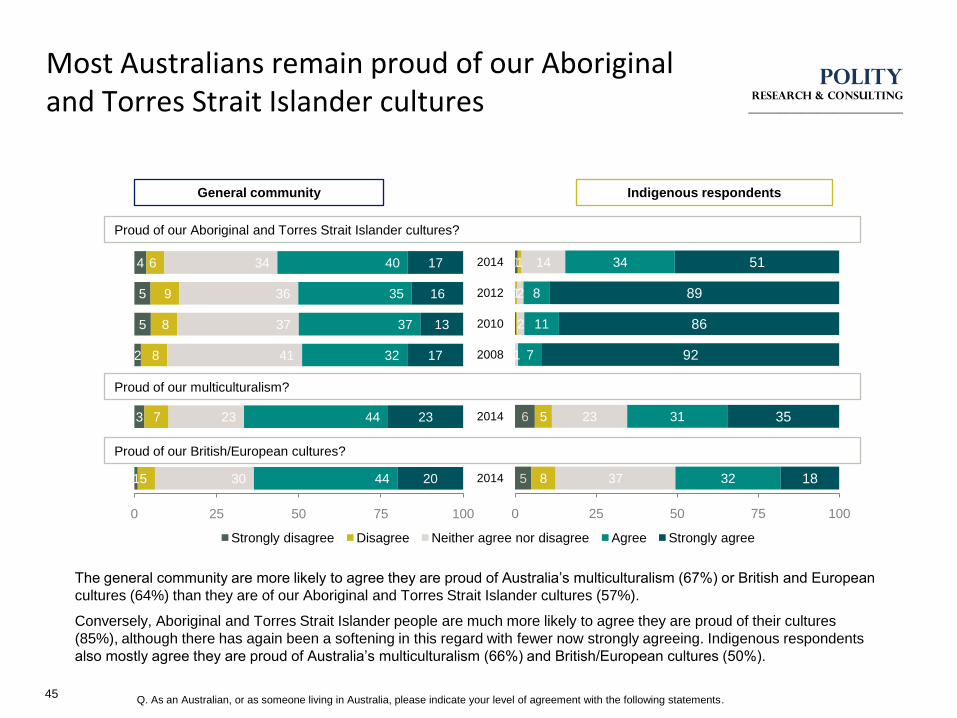
Most Australians remain proud of our Aboriginal and Torres Strait Islander cultures
45
The general community are more likely to agree they are proud of Australia‟s multiculturalism (67%) or British and European
cultures (64%) than they are of our Aboriginal and Torres Strait Islander cultures (57%).
Conversely, Aboriginal and Torres Strait Islander people are much more likely to agree they are proud of their cultures
(85%), although there has again been a softening in this regard with fewer now strongly agreeing. Indigenous respondents
also mostly agree they are proud of Australia‟s multiculturalism (66%) and British/European cultures (50%).
1
3
2
5
5
4
5
7
8
8
9
6
30
23
41
37
36
34
44
44
32
37
35
40
20
23
17
13
16
17
0 25 50 75 100
Strongly disagree Disagree Neither agree nor disagree Agree Strongly agree
5
6
1
8
5
1
1
37
23
1
2
2
14
32
31
7
11
8
34
18
35
92
86
89
51
0 25 50 75 100
2014
2014
2008
2010
2012
2014
Q. As an Australian, or as someone living in Australia, please indicate your level of agreement with the following statements.
General community Indigenous respondents
Proud of our Aboriginal and Torres Strait Islander cultures?
Proud of our multiculturalism?
Proud of our British/European cultures?
POLITYRESEARCH & consulting
_____________________________
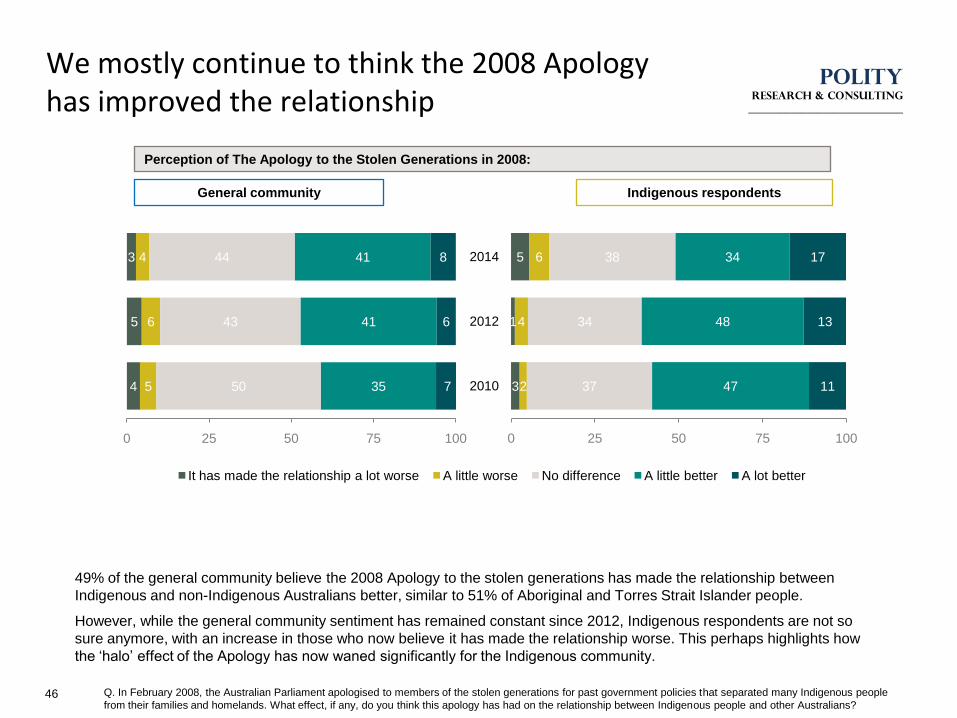
We mostly continue to think the 2008 Apology has improved the relationship
46
49% of the general community believe the 2008 Apology to the stolen generations has made the relationship between
Indigenous and non-Indigenous Australians better, similar to 51% of Aboriginal and Torres Strait Islander people.
However, while the general community sentiment has remained constant since 2012, Indigenous respondents are not so
sure anymore, with an increase in those who now believe it has made the relationship worse. This perhaps highlights how
the „halo‟ effect of the Apology has now waned significantly for the Indigenous community.
4
5
3
5
6
4
50
43
44
35
41
41
7
6
8
0 25 50 75 100
It has made the relationship a lot worse A little worse No difference A little better A lot better
3
1
5
2
4
6
37
34
38
47
48
34
11
13
17
0 25 50 75 100
2010
2012
2014
Q. In February 2008, the Australian Parliament apologised to members of the stolen generations for past government policies that separated many Indigenous people
from their families and homelands. What effect, if any, do you think this apology has had on the relationship between Indigenous people and other Australians?
General community Indigenous respondents
Perception of The Apology to the Stolen Generations in 2008:
POLITYRESEARCH & consulting
_____________________________
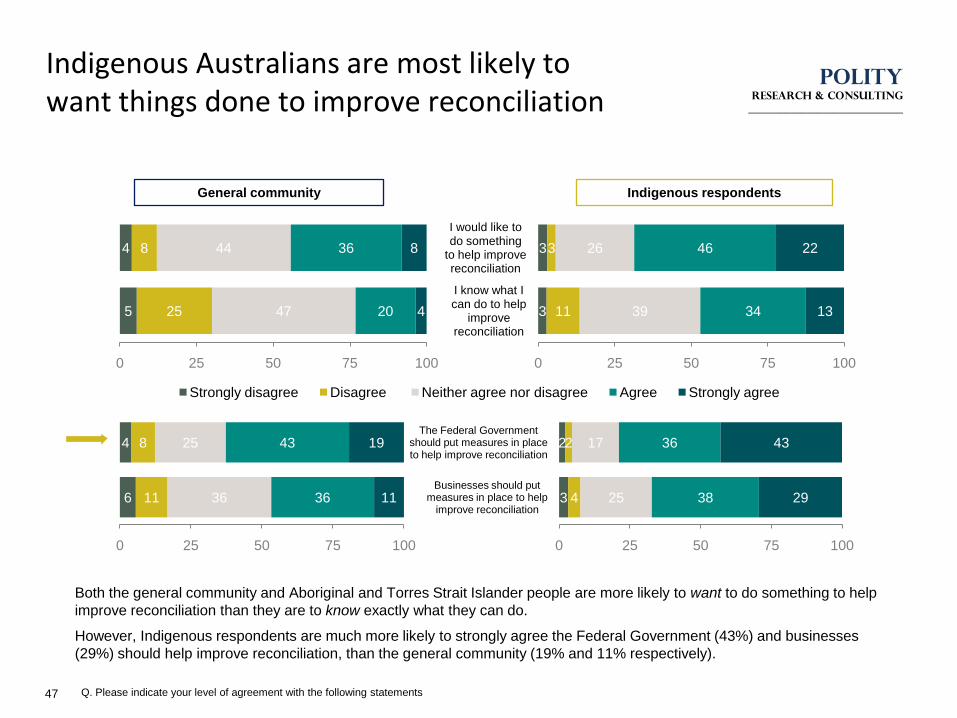
Indigenous Australians are most likely to want things done to improve reconciliation
47
Both the general community and Aboriginal and Torres Strait Islander people are more likely to want to do something to help
improve reconciliation than they are to know exactly what they can do.
However, Indigenous respondents are much more likely to strongly agree the Federal Government (43%) and businesses
(29%) should help improve reconciliation, than the general community (19% and 11% respectively).
Q. Please indicate your level of agreement with the following statements
5
4
25
8
47
44
20
36
4
8
0 25 50 75 100
Strongly disagree Disagree Neither agree nor disagree Agree Strongly agree
General community
3
3
11
3
39
26
34
46
13
22
0 25 50 75 100
I know what I can do to help
improve reconciliation
I would like to do something
to help improve reconciliation
Indigenous respondents
6
4
11
8
36
25
36
43
11
19
0 25 50 75 100
3
2
4
2
25
17
38
36
29
43
0 25 50 75 100
Businesses should put measures in place to help
improve reconciliation
The Federal Government should put measures in place to help improve reconciliation
POLITYRESEARCH & consulting
_____________________________
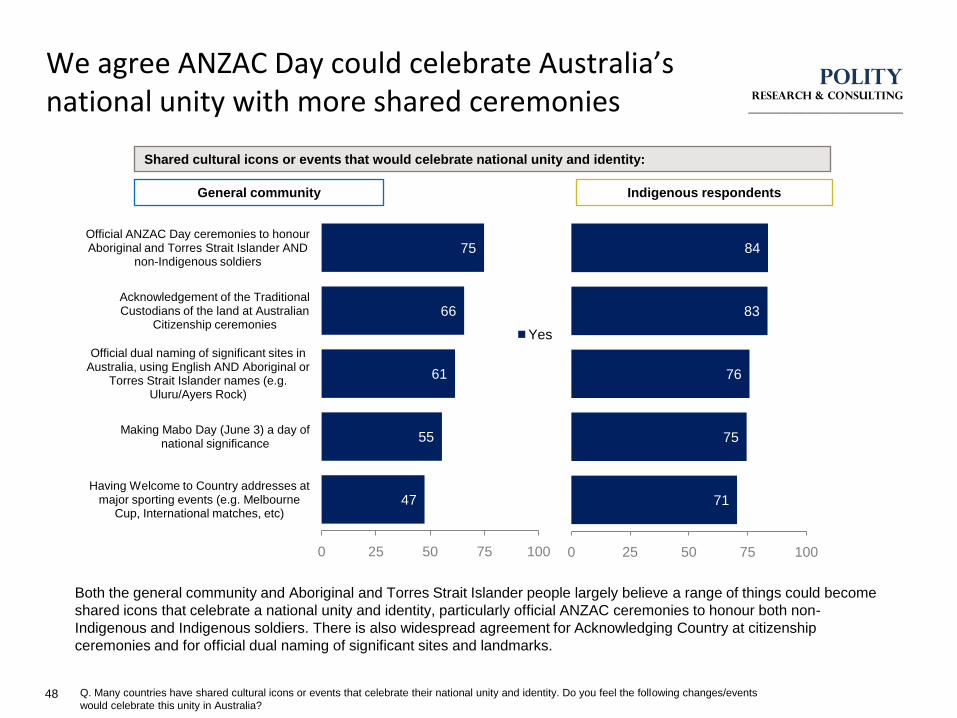
We agree ANZAC Day could celebrate Australia’s national unity with more shared ceremonies
48
Both the general community and Aboriginal and Torres Strait Islander people largely believe a range of things could become
shared icons that celebrate a national unity and identity, particularly official ANZAC ceremonies to honour both non-
Indigenous and Indigenous soldiers. There is also widespread agreement for Acknowledging Country at citizenship
ceremonies and for official dual naming of significant sites and landmarks.
47
55
61
66
75
0 25 50 75 100
Having Welcome to Country addresses at major sporting events (e.g. Melbourne
Cup, International matches, etc)
Making Mabo Day (June 3) a day of national significance
Official dual naming of significant sites in Australia, using English AND Aboriginal or
Torres Strait Islander names (e.g. Uluru/Ayers Rock)
Acknowledgement of the Traditional Custodians of the land at Australian
Citizenship ceremonies
Official ANZAC Day ceremonies to honour Aboriginal and Torres Strait Islander AND
non-Indigenous soldiers
Yes
Q. Many countries have shared cultural icons or events that celebrate their national unity and identity. Do you feel the following changes/events
would celebrate this unity in Australia?
General community
71
75
76
83
84
0 25 50 75 100
Indigenous respondents
Shared cultural icons or events that would celebrate national unity and identity:
POLITYRESEARCH & consulting
_____________________________
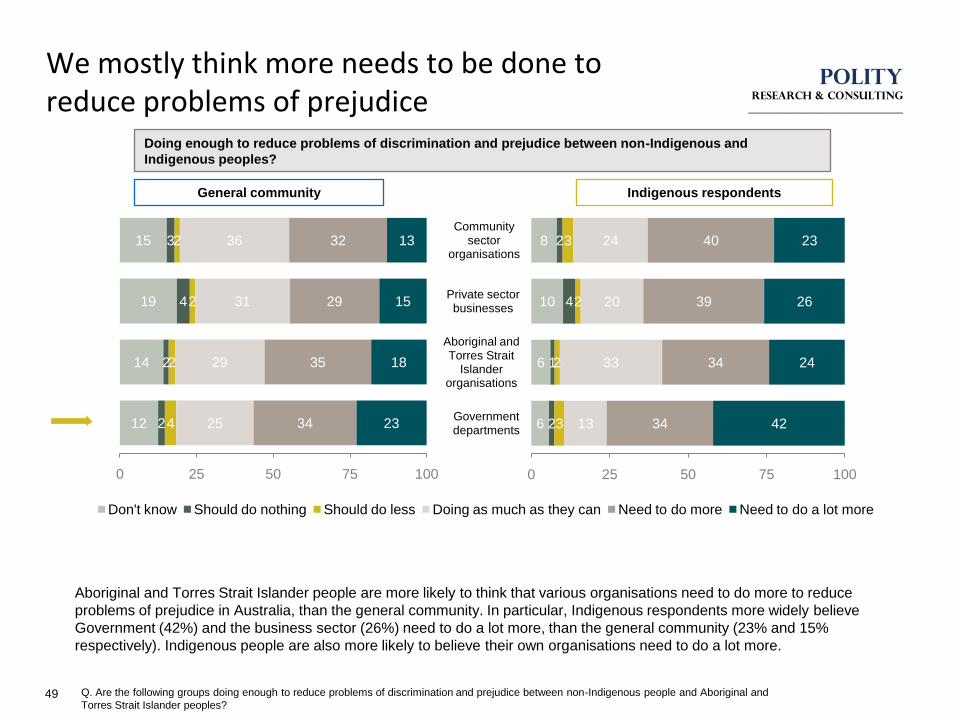
We mostly think more needs to be done to reduce problems of prejudice
49
Aboriginal and Torres Strait Islander people are more likely to think that various organisations need to do more to reduce
problems of prejudice in Australia, than the general community. In particular, Indigenous respondents more widely believe
Government (42%) and the business sector (26%) need to do a lot more, than the general community (23% and 15%
respectively). Indigenous people are also more likely to believe their own organisations need to do a lot more.
Q. Are the following groups doing enough to reduce problems of discrimination and prejudice between non-Indigenous people and Aboriginal and
Torres Strait Islander peoples?
12
14
19
15
2
2
4
3
4
2
2
2
25
29
31
36
34
35
29
32
23
18
15
13
0 25 50 75 100
Don't know Should do nothing Should do less Doing as much as they can Need to do more Need to do a lot more
General community
6
6
10
8
2
1
4
2
3
2
2
3
13
33
20
24
34
34
39
40
42
24
26
23
0 25 50 75 100
Government departments
Aboriginal and Torres Strait
Islander organisations
Private sector businesses
Community sector
organisations
Doing enough to reduce problems of discrimination and prejudice between non-Indigenous and
Indigenous peoples?
Indigenous respondents
POLITYRESEARCH & consulting
_____________________________
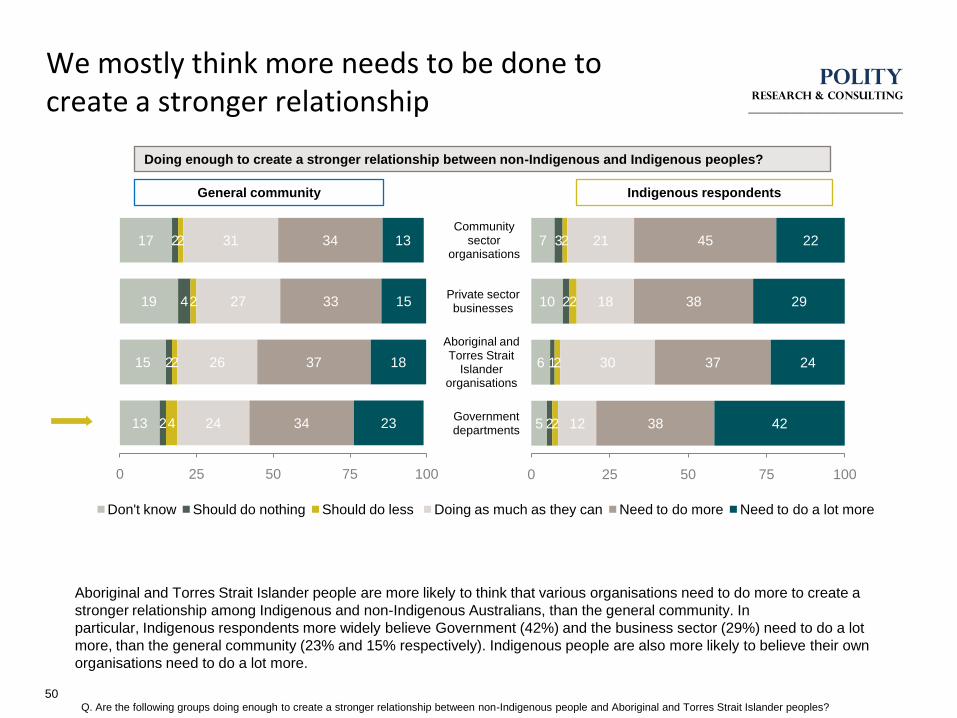
We mostly think more needs to be done to create a stronger relationship
50
Aboriginal and Torres Strait Islander people are more likely to think that various organisations need to do more to create a
stronger relationship among Indigenous and non-Indigenous Australians, than the general community. In
particular, Indigenous respondents more widely believe Government (42%) and the business sector (29%) need to do a lot
more, than the general community (23% and 15% respectively). Indigenous people are also more likely to believe their own
organisations need to do a lot more.
Q. Are the following groups doing enough to create a stronger relationship between non-Indigenous people and Aboriginal and Torres Strait Islander peoples?
13
15
19
17
2
2
4
2
4
2
2
2
24
26
27
31
34
37
33
34
23
18
15
13
0 25 50 75 100
Don't know Should do nothing Should do less Doing as much as they can Need to do more Need to do a lot more
General community
5
6
10
7
2
1
2
3
2
2
2
2
12
30
18
21
38
37
38
45
42
24
29
22
0 25 50 75 100
Government departments
Aboriginal and Torres Strait
Islander organisations
Private sector businesses
Community sector
organisations
Doing enough to create a stronger relationship between non-Indigenous and Indigenous peoples?
Indigenous respondents
Material Equity and Cultural Security
51
How do we feel about our living standards and is enough
being done to close the gap?
POLITYRESEARCH & consulting
_____________________________
Racial/cultural differences are seen as the biggest cause of social divisions in Australia
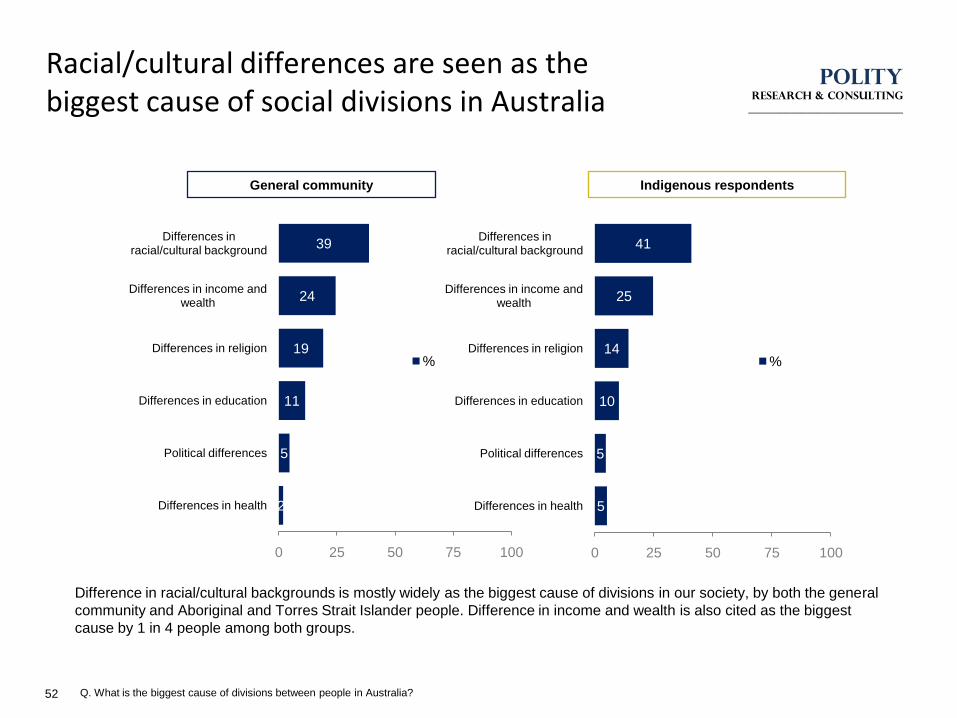
52
Difference in racial/cultural backgrounds is mostly widely as the biggest cause of divisions in our society, by both the general
community and Aboriginal and Torres Strait Islander people. Difference in income and wealth is also cited as the biggest
cause by 1 in 4 people among both groups.
5
5
10
14
25
41
0 25 50 75 100
Differences in health
Political differences
Differences in education
Differences in religion
Differences in income and wealth
Differences in racial/cultural background
%
2
5
11
19
24
39
0 25 50 75 100
Differences in health
Political differences
Differences in education
Differences in religion
Differences in income and wealth
Differences in racial/cultural background
%
General community Indigenous respondents
Q. What is the biggest cause of divisions between people in Australia?
POLITYRESEARCH & consulting
_____________________________
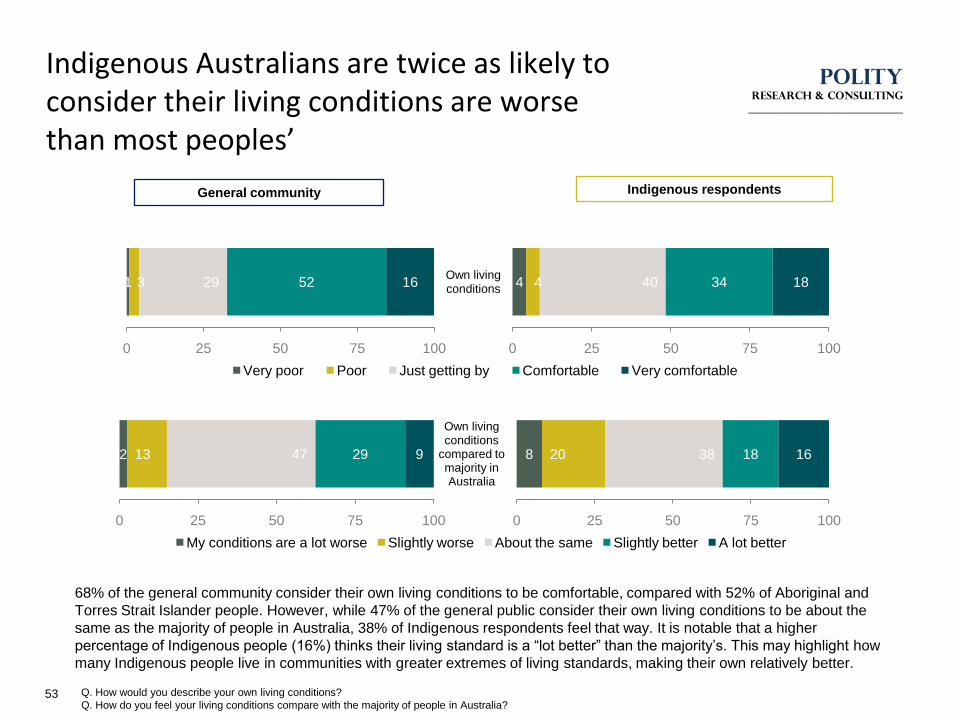
Indigenous Australians are twice as likely to consider their living conditions are worse than most peoples’
53
68% of the general community consider their own living conditions to be comfortable, compared with 52% of Aboriginal and
Torres Strait Islander people. However, while 47% of the general public consider their own living conditions to be about the
same as the majority of people in Australia, 38% of Indigenous respondents feel that way. It is notable that a higher
percentage of Indigenous people (16%) thinks their living standard is a “lot better” than the majority‟s. This may highlight how
many Indigenous people live in communities with greater extremes of living standards, making their own relatively better.
Q. How would you describe your own living conditions?
Q. How do you feel your living conditions compare with the majority of people in Australia?
1 3 29 52 16
0 25 50 75 100
Very poor Poor Just getting by Comfortable Very comfortable
General community
2 13 47 29 9
0 25 50 75 100
My conditions are a lot worse Slightly worse About the same Slightly better A lot better
Indigenous respondents
4 4 40 34 18
0 25 50 75 100
Own living conditions
8 20 38 18 16
0 25 50 75 100
Own living conditions
compared to majority in Australia
POLITYRESEARCH & consulting
_____________________________
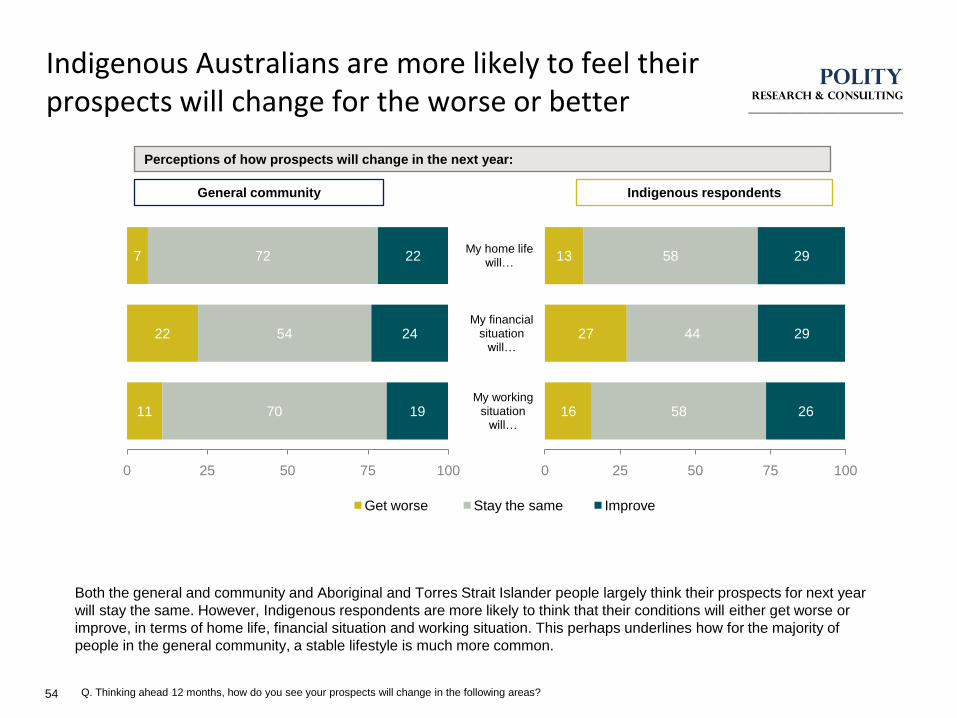
Indigenous Australians are more likely to feel their prospects will change for the worse or better
54
Both the general and community and Aboriginal and Torres Strait Islander people largely think their prospects for next year
will stay the same. However, Indigenous respondents are more likely to think that their conditions will either get worse or
improve, in terms of home life, financial situation and working situation. This perhaps underlines how for the majority of
people in the general community, a stable lifestyle is much more common.
Q. Thinking ahead 12 months, how do you see your prospects will change in the following areas?
11
22
7
70
54
72
19
24
22
0 25 50 75 100
Get worse Stay the same Improve
General community
16
27
13
58
44
58
26
29
29
0 25 50 75 100
My working situation
will…
My financial situation
will…
My home life will…
Perceptions of how prospects will change in the next year:
Indigenous respondents
POLITYRESEARCH & consulting
_____________________________
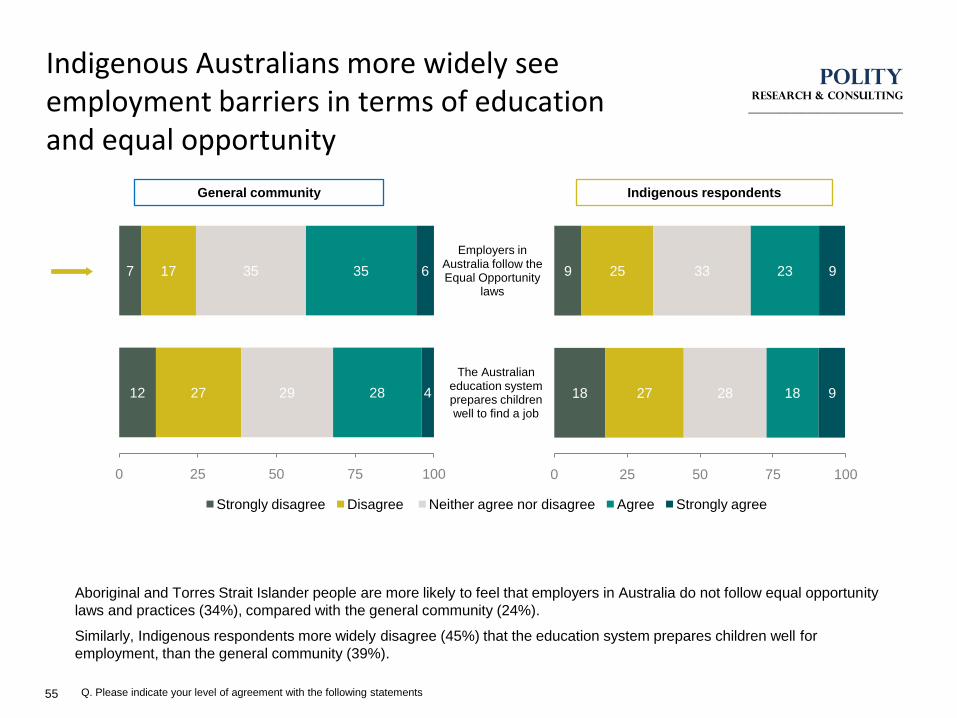
Indigenous Australians more widely see employment barriers in terms of education and equal opportunity
55
Aboriginal and Torres Strait Islander people are more likely to feel that employers in Australia do not follow equal opportunity
laws and practices (34%), compared with the general community (24%).
Similarly, Indigenous respondents more widely disagree (45%) that the education system prepares children well for
employment, than the general community (39%).
Q. Please indicate your level of agreement with the following statements
12
7
27
17
29
35
28
35
4
6
0 25 50 75 100
Strongly disagree Disagree Neither agree nor disagree Agree Strongly agree
General community
18
9
27
25
28
33
18
23
9
9
0 25 50 75 100
The Australian education system prepares children well to find a job
Employers in Australia follow the Equal Opportunity
laws
Indigenous respondents
POLITYRESEARCH & consulting
_____________________________
We mostly think more needs to be done in areas of education to close the gap
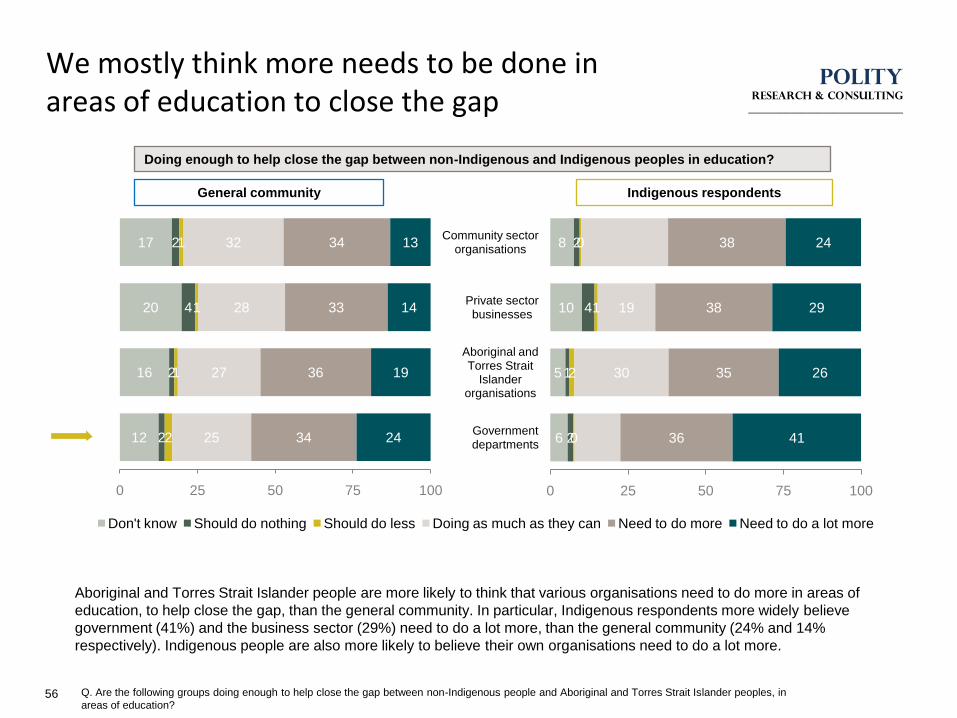
56
Aboriginal and Torres Strait Islander people are more likely to think that various organisations need to do more in areas of
education, to help close the gap, than the general community. In particular, Indigenous respondents more widely believe
government (41%) and the business sector (29%) need to do a lot more, than the general community (24% and 14%
respectively). Indigenous people are also more likely to believe their own organisations need to do a lot more.
Q. Are the following groups doing enough to help close the gap between non-Indigenous people and Aboriginal and Torres Strait Islander peoples, in
areas of education?
12
16
20
17
2
2
4
2
2
1
1
1
25
27
28
32
34
36
33
34
24
19
14
13
0 25 50 75 100
Don't know Should do nothing Should do less Doing as much as they can Need to do more Need to do a lot more
General community
Doing enough to help close the gap between non-Indigenous and Indigenous peoples in education?
6
5
10
8
2
1
4
2
0
2
1
0
30
19
36
35
38
38
41
26
29
24
0 25 50 75 100
Government departments
Aboriginal and Torres Strait
Islander organisations
Private sector businesses
Community sector organisations
Indigenous respondents
POLITYRESEARCH & consulting
_____________________________
We mostly think more needs to be done in areas of health to close the gap
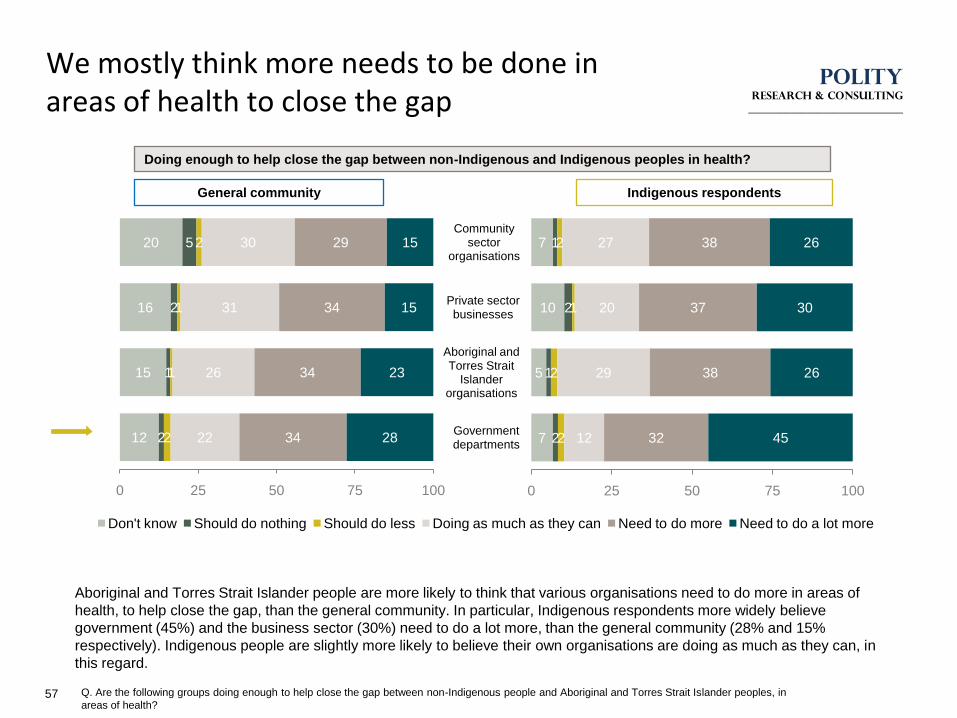
57
Aboriginal and Torres Strait Islander people are more likely to think that various organisations need to do more in areas of
health, to help close the gap, than the general community. In particular, Indigenous respondents more widely believe
government (45%) and the business sector (30%) need to do a lot more, than the general community (28% and 15%
respectively). Indigenous people are slightly more likely to believe their own organisations are doing as much as they can, in
this regard.
Q. Are the following groups doing enough to help close the gap between non-Indigenous people and Aboriginal and Torres Strait Islander peoples, in
areas of health?
12
15
16
20
2
1
2
5
2
1
1
2
22
26
31
30
34
34
34
29
28
23
15
15
0 25 50 75 100
Don't know Should do nothing Should do less Doing as much as they can Need to do more Need to do a lot more
General community
Doing enough to help close the gap between non-Indigenous and Indigenous peoples in health?
7
5
10
7
2
1
2
1
2
2
1
2
12
29
20
27
32
38
37
38
45
26
30
26
0 25 50 75 100
Government departments
Aboriginal and Torres Strait
Islander organisations
Private sector businesses
Community sector
organisations
Indigenous respondents
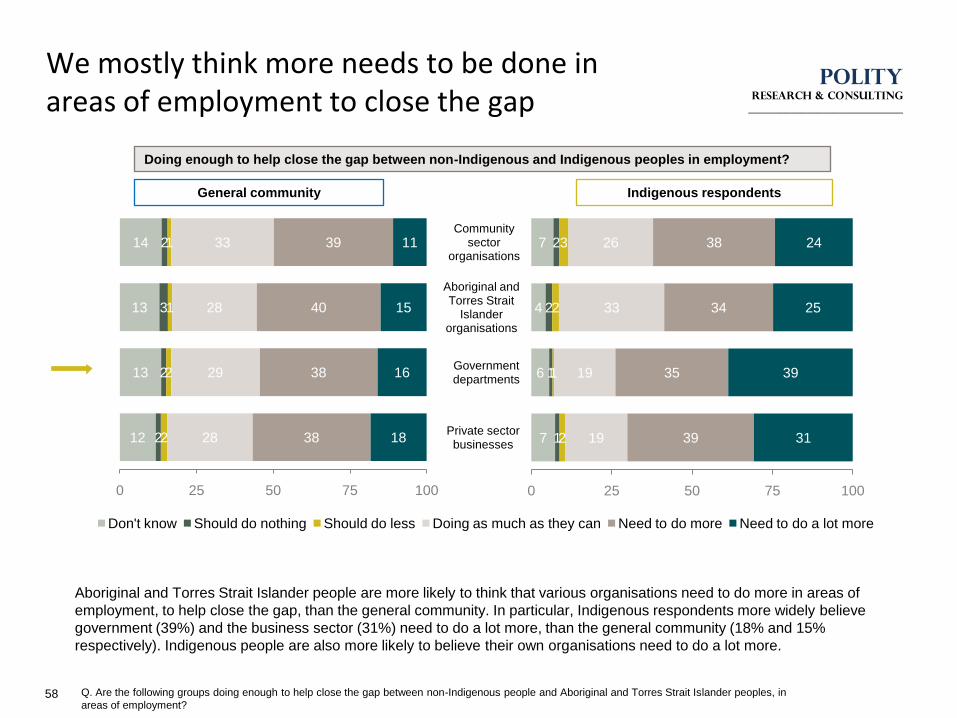
POLITYRESEARCH & consulting
_____________________________
We mostly think more needs to be done in areas of employment to close the gap
58
Aboriginal and Torres Strait Islander people are more likely to think that various organisations need to do more in areas of
employment, to help close the gap, than the general community. In particular, Indigenous respondents more widely believe
government (39%) and the business sector (31%) need to do a lot more, than the general community (18% and 15%
respectively). Indigenous people are also more likely to believe their own organisations need to do a lot more.
Q. Are the following groups doing enough to help close the gap between non-Indigenous people and Aboriginal and Torres Strait Islander peoples, in
areas of employment?
12
13
13
14
2
2
3
2
2
2
1
1
28
29
28
33
38
38
40
39
18
16
15
11
0 25 50 75 100
Don't know Should do nothing Should do less Doing as much as they can Need to do more Need to do a lot more
General community
Doing enough to help close the gap between non-Indigenous and Indigenous peoples in employment?
7
6
4
7
1
1
2
2
2
1
2
3
19
19
33
26
39
35
34
38
31
39
25
24
0 25 50 75 100
Private sector businesses
Government departments
Aboriginal and Torres Strait
Islander organisations
Community sector
organisations
Indigenous respondents
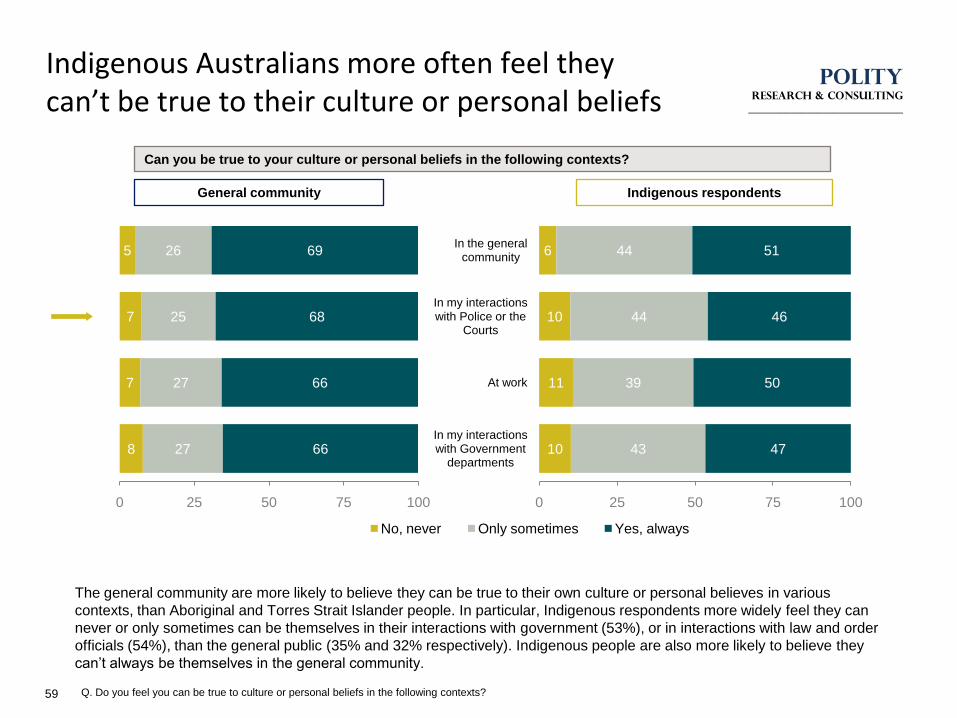
POLITYRESEARCH & consulting
_____________________________
Indigenous Australians more often feel they can’t be true to their culture or personal beliefs
59
The general community are more likely to believe they can be true to their own culture or personal believes in various
contexts, than Aboriginal and Torres Strait Islander people. In particular, Indigenous respondents more widely feel they can
never or only sometimes can be themselves in their interactions with government (53%), or in interactions with law and order
officials (54%), than the general public (35% and 32% respectively). Indigenous people are also more likely to believe they
can‟t always be themselves in the general community.
Q. Do you feel you can be true to culture or personal beliefs in the following contexts?
8
7
7
5
27
27
25
26
66
66
68
69
0 25 50 75 100
No, never Only sometimes Yes, always
General community
10
11
10
6
43
39
44
44
47
50
46
51
0 25 50 75 100
In my interactions with Government
departments
At work
In my interactions with Police or the
Courts
In the general community
Can you be true to your culture or personal beliefs in the following contexts?
Indigenous respondents
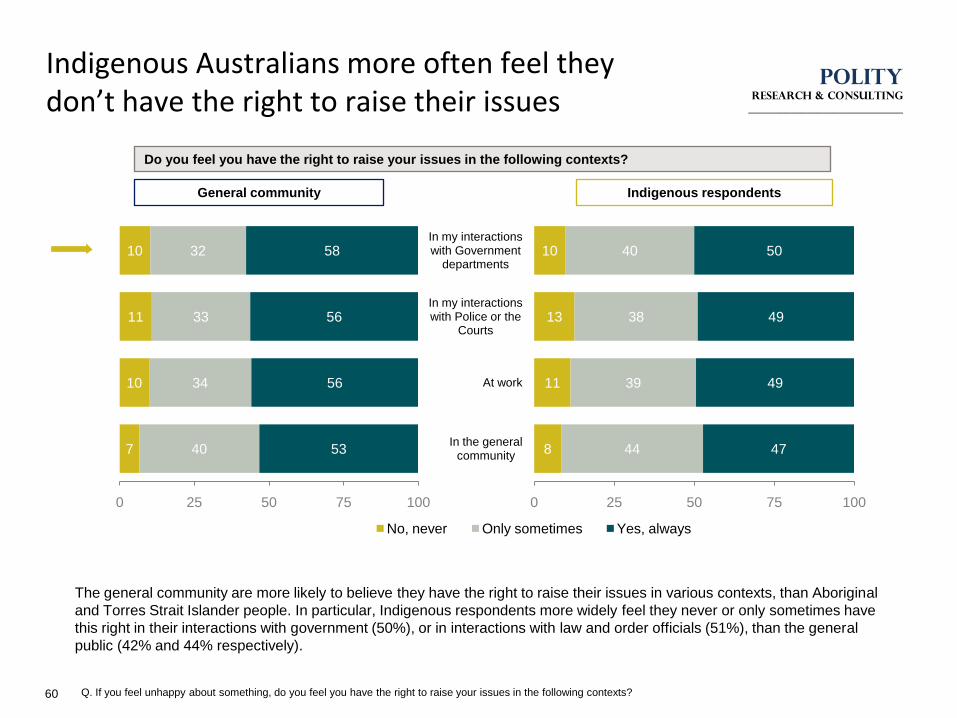
POLITYRESEARCH & consulting
_____________________________
Indigenous Australians more often feel they don’t have the right to raise their issues
60
The general community are more likely to believe they have the right to raise their issues in various contexts, than Aboriginal
and Torres Strait Islander people. In particular, Indigenous respondents more widely feel they never or only sometimes have
this right in their interactions with government (50%), or in interactions with law and order officials (51%), than the general
public (42% and 44% respectively).
Q. If you feel unhappy about something, do you feel you have the right to raise your issues in the following contexts?
7
10
11
10
40
34
33
32
53
56
56
58
0 25 50 75 100
No, never Only sometimes Yes, always
General community
8
11
13
10
44
39
38
40
47
49
49
50
0 25 50 75 100
In the general community
At work
In my interactions with Police or the
Courts
In my interactions with Government
departments
Do you feel you have the right to raise your issues in the following contexts?
Indigenous respondents
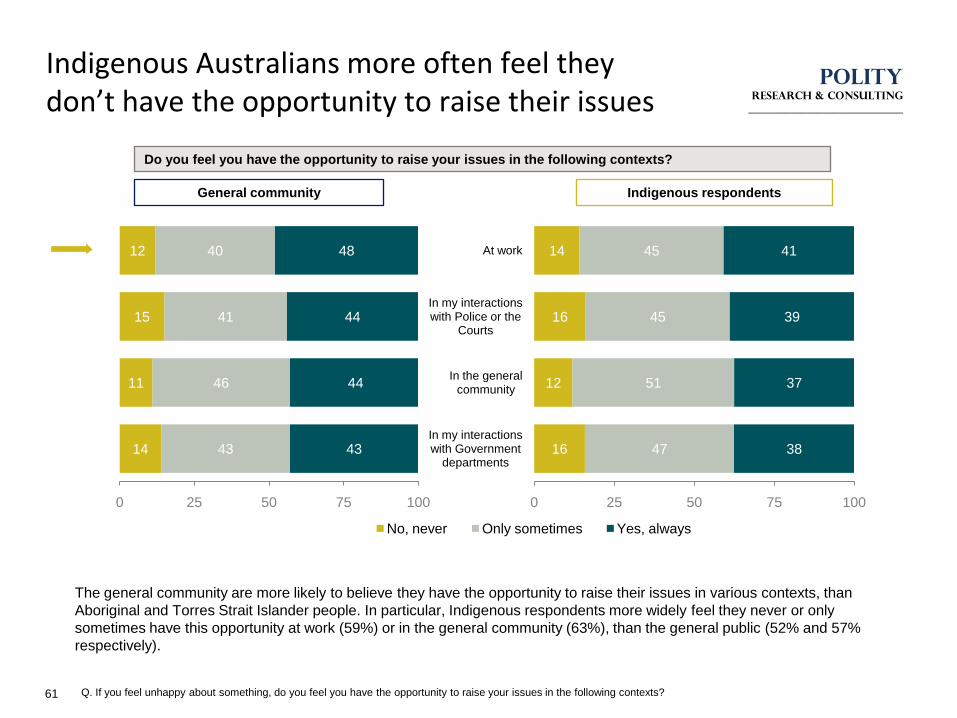
POLITYRESEARCH & consulting
_____________________________
Indigenous Australians more often feel they don’t have the opportunity to raise their issues
61
The general community are more likely to believe they have the opportunity to raise their issues in various contexts, than
Aboriginal and Torres Strait Islander people. In particular, Indigenous respondents more widely feel they never or only
sometimes have this opportunity at work (59%) or in the general community (63%), than the general public (52% and 57%
respectively).
Q. If you feel unhappy about something, do you feel you have the opportunity to raise your issues in the following contexts?
14
11
15
12
43
46
41
40
43
44
44
48
0 25 50 75 100
No, never Only sometimes Yes, always
General community
16
12
16
14
47
51
45
45
38
37
39
41
0 25 50 75 100
In my interactions with Government
departments
In the general community
In my interactions with Police or the
Courts
At work
Do you feel you have the opportunity to raise your issues in the following contexts?
Indigenous respondents
Historical Acceptance
62
How much do we accept the wrongs of the past?
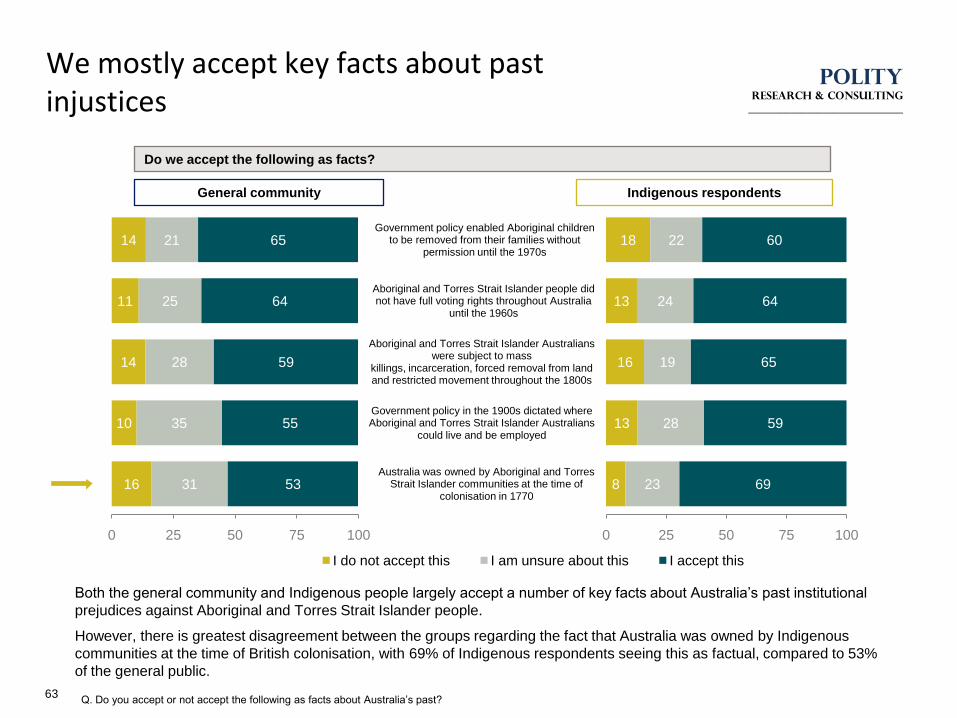
POLITYRESEARCH & consulting
_____________________________
We mostly accept key facts about past injustices
63
Both the general community and Indigenous people largely accept a number of key facts about Australia‟s past institutional
prejudices against Aboriginal and Torres Strait Islander people.
However, there is greatest disagreement between the groups regarding the fact that Australia was owned by Indigenous
communities at the time of British colonisation, with 69% of Indigenous respondents seeing this as factual, compared to 53%
of the general public.
Q. Do you accept or not accept the following as facts about Australia‟s past?
16
10
14
11
14
31
35
28
25
21
53
55
59
64
65
0 25 50 75 100
I do not accept this I am unsure about this I accept this
General community
8
13
16
13
18
23
28
19
24
22
69
59
65
64
60
0 25 50 75 100
Australia was owned by Aboriginal and Torres Strait Islander communities at the time of
colonisation in 1770
Government policy in the 1900s dictated where Aboriginal and Torres Strait Islander Australians
could live and be employed
Aboriginal and Torres Strait Islander Australians were subject to mass
killings, incarceration, forced removal from land and restricted movement throughout the 1800s
Aboriginal and Torres Strait Islander people did not have full voting rights throughout Australia
until the 1960s
Government policy enabled Aboriginal children to be removed from their families without
permission until the 1970s
Do we accept the following as facts?
Indigenous respondents
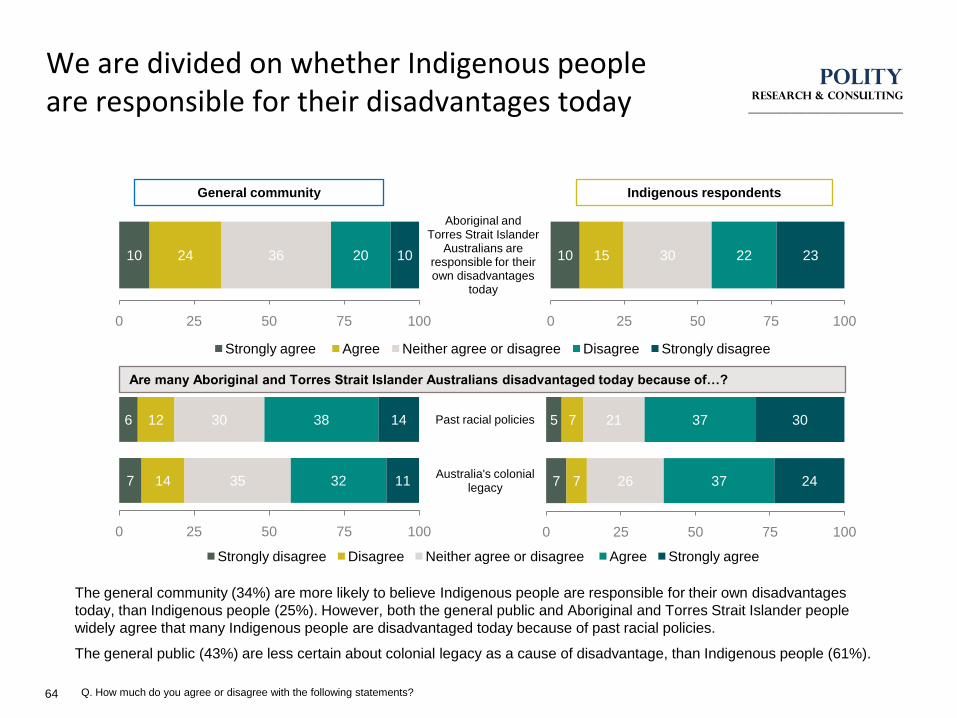
POLITYRESEARCH & consulting
_____________________________
We are divided on whether Indigenous people are responsible for their disadvantages today
64
The general community (34%) are more likely to believe Indigenous people are responsible for their own disadvantages
today, than Indigenous people (25%). However, both the general public and Aboriginal and Torres Strait Islander people
widely agree that many Indigenous people are disadvantaged today because of past racial policies.
The general public (43%) are less certain about colonial legacy as a cause of disadvantage, than Indigenous people (61%).
Q. How much do you agree or disagree with the following statements?
10 24 36 20 10
0 25 50 75 100
Strongly agree Agree Neither agree or disagree Disagree Strongly disagree
General community
10 15 30 22 23
0 25 50 75 100
Aboriginal and Torres Strait Islander
Australians are responsible for their own disadvantages
today
Indigenous respondents
7
6
14
12
35
30
32
38
11
14
0 25 50 75 100
Strongly disagree Disagree Neither agree or disagree Agree Strongly agree
7
5
7
7
26
21
37
37
24
30
0 25 50 75 100
Australia's colonial legacy
Past racial policies
Are many Aboriginal and Torres Strait Islander Australians disadvantaged today because of…?
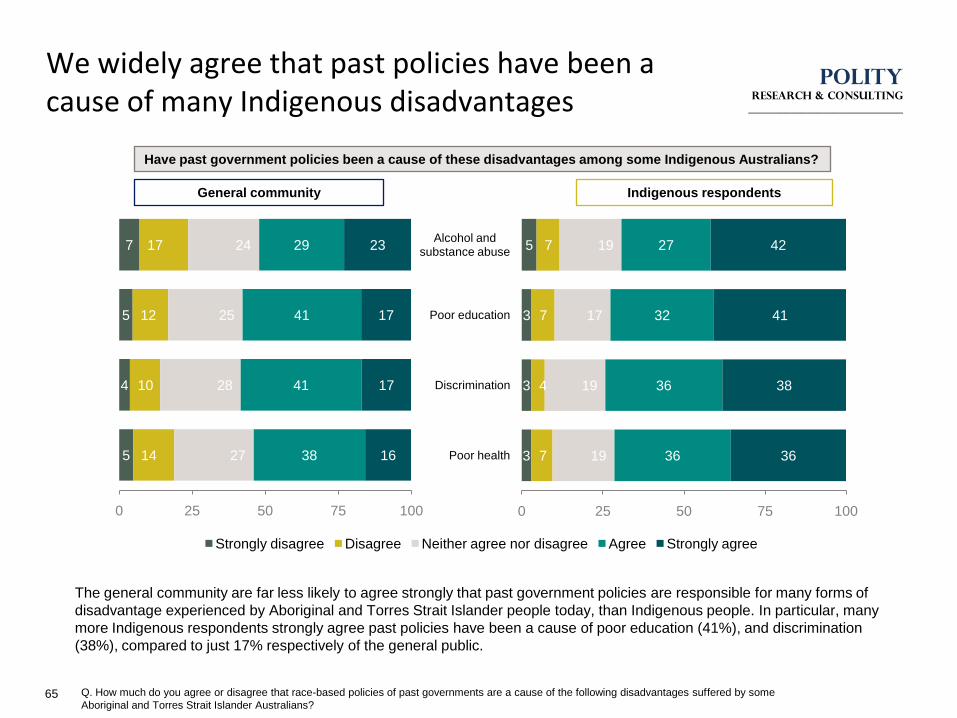
POLITYRESEARCH & consulting
_____________________________
We widely agree that past policies have been a cause of many Indigenous disadvantages
65
The general community are far less likely to agree strongly that past government policies are responsible for many forms of
disadvantage experienced by Aboriginal and Torres Strait Islander people today, than Indigenous people. In particular, many
more Indigenous respondents strongly agree past policies have been a cause of poor education (41%), and discrimination
(38%), compared to just 17% respectively of the general public.
Q. How much do you agree or disagree that race-based policies of past governments are a cause of the following disadvantages suffered by some
Aboriginal and Torres Strait Islander Australians?
5
4
5
7
14
10
12
17
27
28
25
24
38
41
41
29
16
17
17
23
0 25 50 75 100
Strongly disagree Disagree Neither agree nor disagree Agree Strongly agree
General community
3
3
3
5
7
4
7
7
19
19
17
19
36
36
32
27
36
38
41
42
0 25 50 75 100
Poor health
Discrimination
Poor education
Alcohol and substance abuse
Have past government policies been a cause of these disadvantages among some Indigenous Australians?
Indigenous respondents
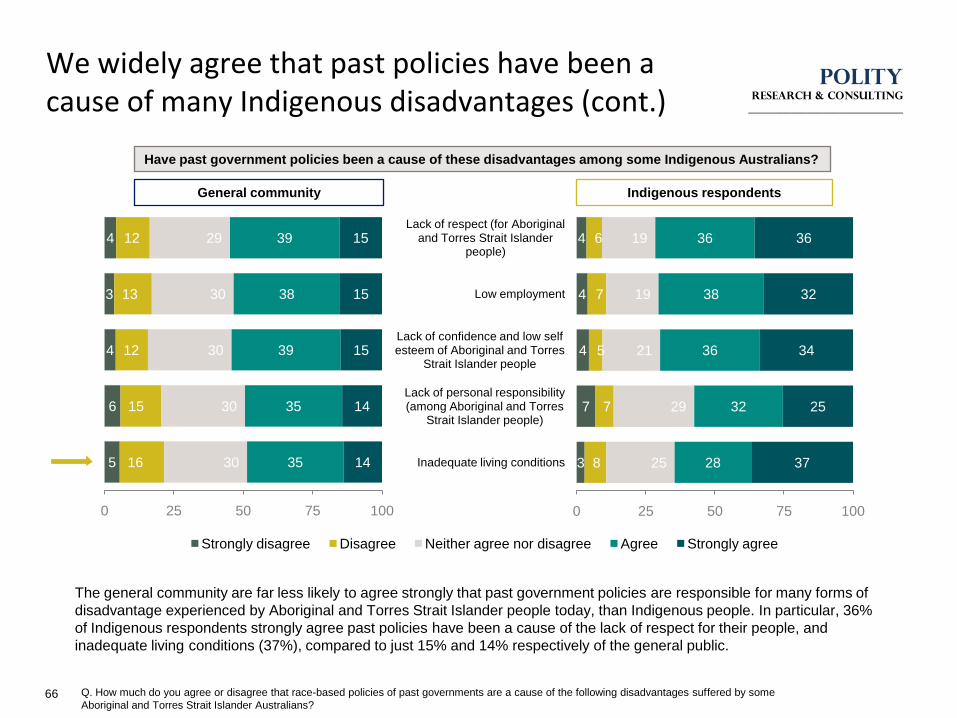
POLITYRESEARCH & consulting
_____________________________
We widely agree that past policies have been a cause of many Indigenous disadvantages (cont.)
66
The general community are far less likely to agree strongly that past government policies are responsible for many forms of
disadvantage experienced by Aboriginal and Torres Strait Islander people today, than Indigenous people. In particular, 36%
of Indigenous respondents strongly agree past policies have been a cause of the lack of respect for their people, and
inadequate living conditions (37%), compared to just 15% and 14% respectively of the general public.
Q. How much do you agree or disagree that race-based policies of past governments are a cause of the following disadvantages suffered by some
Aboriginal and Torres Strait Islander Australians?
5
6
4
3
4
16
15
12
13
12
30
30
30
30
29
35
35
39
38
39
14
14
15
15
15
0 25 50 75 100
Strongly disagree Disagree Neither agree nor disagree Agree Strongly agree
General community
3
7
4
4
4
8
7
5
7
6
25
29
21
19
19
28
32
36
38
36
37
25
34
32
36
0 25 50 75 100
Inadequate living conditions
Lack of personal responsibility (among Aboriginal and Torres
Strait Islander people)
Lack of confidence and low self esteem of Aboriginal and Torres
Strait Islander people
Low employment
Lack of respect (for Aboriginal and Torres Strait Islander
people)
Have past government policies been a cause of these disadvantages among some Indigenous Australians?
Indigenous respondents

POLITYRESEARCH & consulting
_____________________________
We widely agree it is important for all Australians to learn more about past issues
67
The general community are far less likely to agree strongly (39%) that it‟s important to learn about the past issues of European
settlement and government policies experienced by Aboriginal and Torres Strait Islander people, than Indigenous people
(66%).
Q. Is it important or not important for all Australians to learn more about the past issues of European settlement and government policy for Aboriginal and Torres Strait
Islander people?
General community
4 11 46 39
0 25 50 75 100
Not important at all Fairly unimportant Fairly important Very important
4 4 26 66
0 25 50 75 100
Important for all Australians to learn more about the past issues of
European settlement and government policy for Indigenous people?
Indigenous respondents
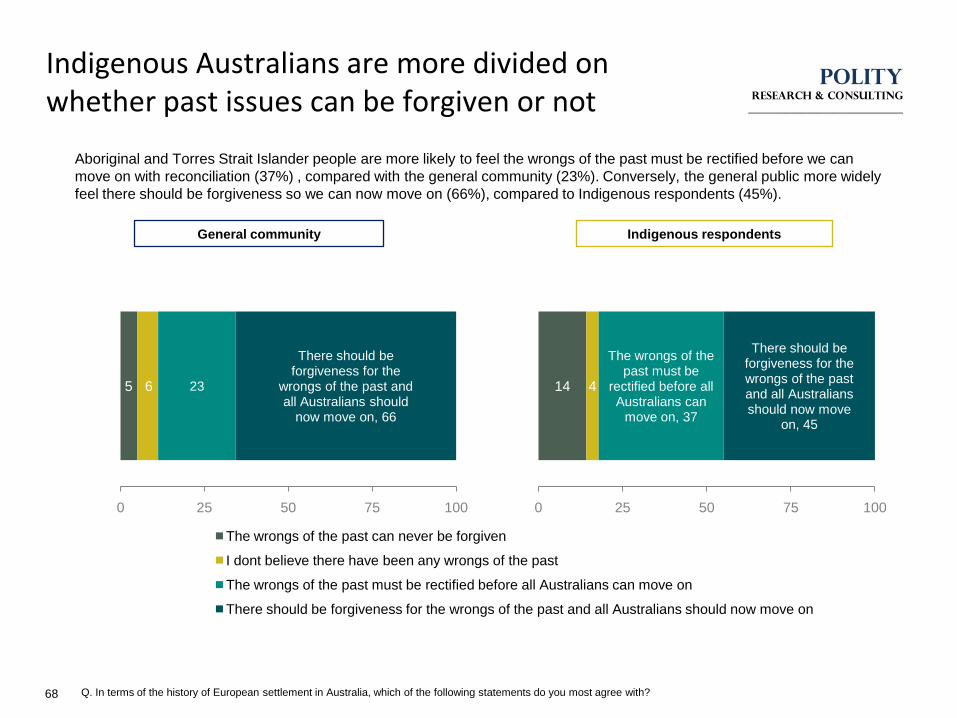
POLITYRESEARCH & consulting
_____________________________
Indigenous Australians are more divided on whether past issues can be forgiven or not
68
Aboriginal and Torres Strait Islander people are more likely to feel the wrongs of the past must be rectified before we can
move on with reconciliation (37%) , compared with the general community (23%). Conversely, the general public more widely
feel there should be forgiveness so we can now move on (66%), compared to Indigenous respondents (45%).
Q. In terms of the history of European settlement in Australia, which of the following statements do you most agree with?
General community
5 6 23
There should be forgiveness for the
wrongs of the past and all Australians should
now move on, 66
0 25 50 75 100
The wrongs of the past can never be forgiven
I dont believe there have been any wrongs of the past
The wrongs of the past must be rectified before all Australians can move on
There should be forgiveness for the wrongs of the past and all Australians should now move on
14 4
The wrongs of the past must be
rectified before all Australians can
move on, 37
There should be forgiveness for the wrongs of the past and all Australians should now move
on, 45
0 25 50 75 100
Indigenous respondents
Appendix
69
Respondent profiles
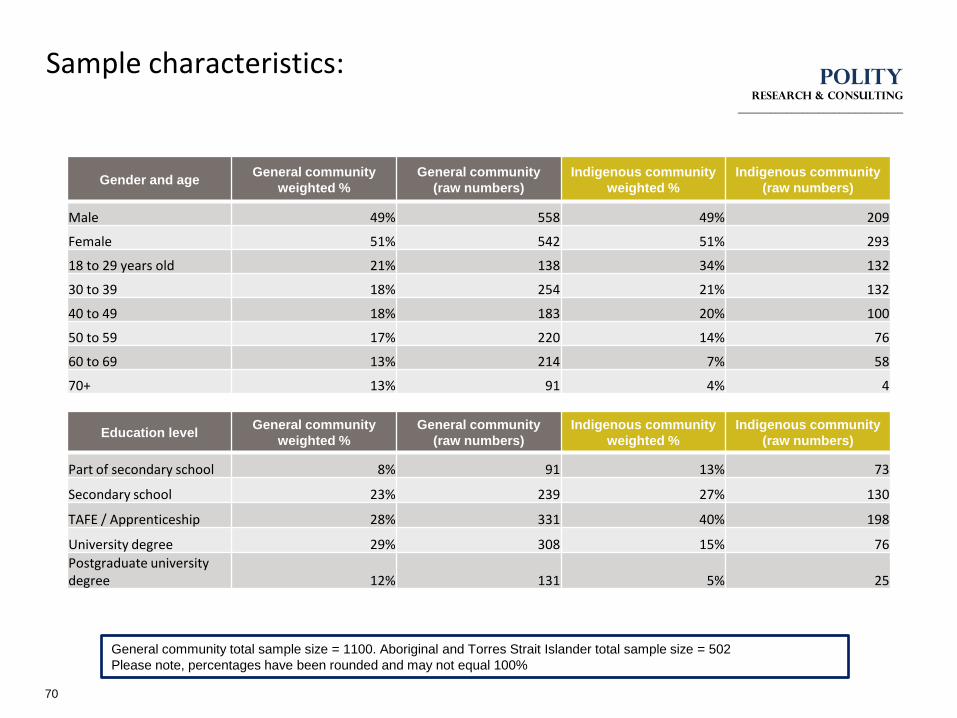
POLITYRESEARCH & Consulting
_______________________________
Sample characteristics:
70
Gender and ageGeneral community
weighted %
General community
(raw numbers)
Indigenous community
weighted %
Indigenous community
(raw numbers)
Male 49% 558 49% 209
Female 51% 542 51% 293
18 to 29 years old 21% 138 34% 132
30 to 39 18% 254 21% 132
40 to 49 18% 183 20% 100
50 to 59 17% 220 14% 76
60 to 69 13% 214 7% 58
70+ 13% 91 4% 4
Education levelGeneral community
weighted %
General community
(raw numbers)
Indigenous community
weighted %
Indigenous community
(raw numbers)
Part of secondary school 8% 91 13% 73
Secondary school 23% 239 27% 130
TAFE / Apprenticeship 28% 331 40% 198
University degree 29% 308 15% 76
Postgraduate university degree 12% 131 5% 25
General community total sample size = 1100. Aboriginal and Torres Strait Islander total sample size = 502
Please note, percentages have been rounded and may not equal 100%
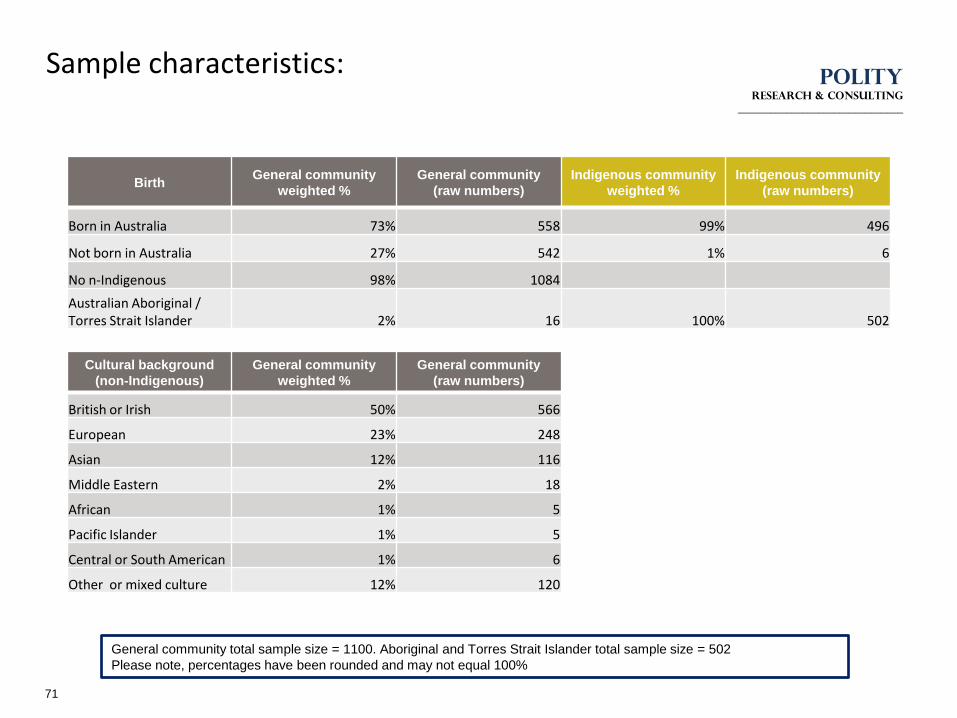
POLITYRESEARCH & Consulting
_______________________________
Sample characteristics:
71
BirthGeneral community
weighted %
General community
(raw numbers)
Indigenous community
weighted %
Indigenous community
(raw numbers)
Born in Australia 73% 558 99% 496
Not born in Australia 27% 542 1% 6
No n-Indigenous 98% 1084
Australian Aboriginal / Torres Strait Islander 2% 16 100% 502
Cultural background
(non-Indigenous)
General community
weighted %
General community
(raw numbers)
British or Irish 50% 566
European 23% 248
Asian 12% 116
Middle Eastern 2% 18
African 1% 5
Pacific Islander 1% 5
Central or South American 1% 6
Other or mixed culture 12% 120
General community total sample size = 1100. Aboriginal and Torres Strait Islander total sample size = 502
Please note, percentages have been rounded and may not equal 100%
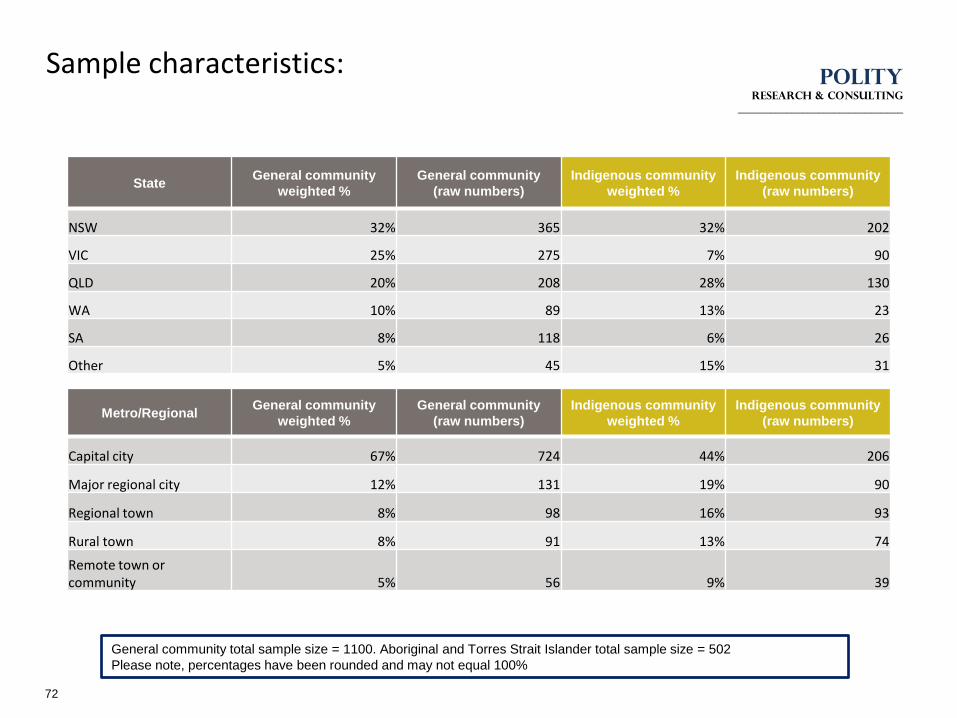
POLITYRESEARCH & Consulting
_______________________________
Sample characteristics:
72
State General community
weighted %
General community
(raw numbers)
Indigenous community
weighted %
Indigenous community
(raw numbers)
NSW 32% 365 32% 202
VIC 25% 275 7% 90
QLD 20% 208 28% 130
WA 10% 89 13% 23
SA 8% 118 6% 26
Other 5% 45 15% 31
Metro/RegionalGeneral community
weighted %
General community
(raw numbers)
Indigenous community
weighted %
Indigenous community
(raw numbers)
Capital city 67% 724 44% 206
Major regional city 12% 131 19% 90
Regional town 8% 98 16% 93
Rural town 8% 91 13% 74
Remote town or community 5% 56 9% 39
General community total sample size = 1100. Aboriginal and Torres Strait Islander total sample size = 502
Please note, percentages have been rounded and may not equal 100%
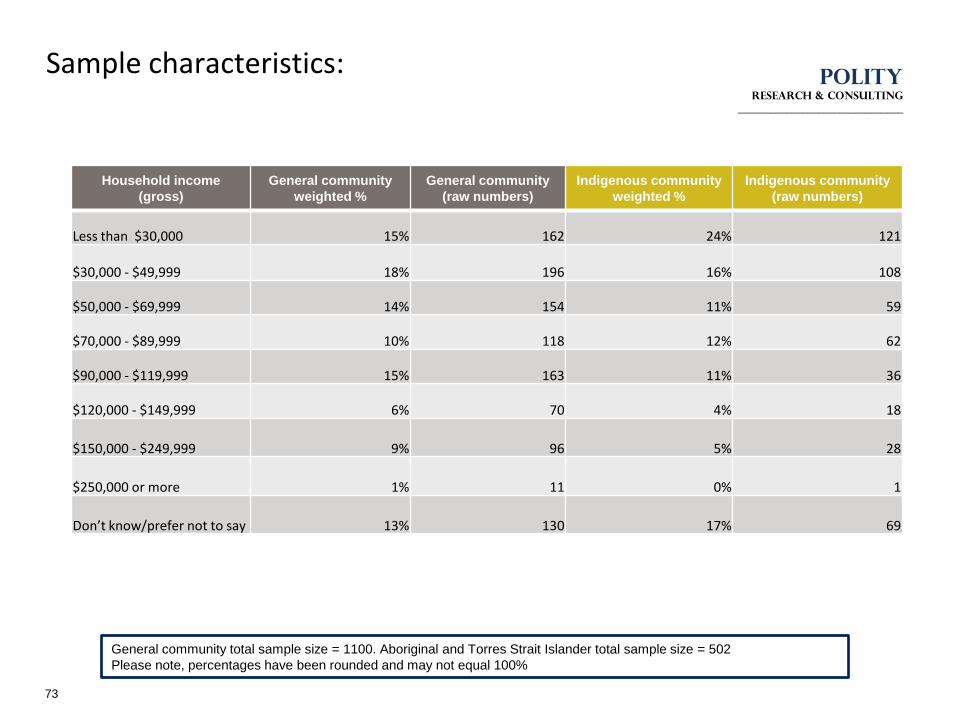
POLITYRESEARCH & Consulting
_______________________________
Sample characteristics:
73
Household income
(gross)
General community
weighted %
General community
(raw numbers)
Indigenous community
weighted %
Indigenous community
(raw numbers)
Less than $30,000 15% 162 24% 121
$30,000 - $49,999 18% 196 16% 108
$50,000 - $69,999 14% 154 11% 59
$70,000 - $89,999 10% 118 12% 62
$90,000 - $119,999 15% 163 11% 36
$120,000 - $149,999 6% 70 4% 18
$150,000 - $249,999 9% 96 5% 28
$250,000 or more 1% 11 0% 1
Don’t know/prefer not to say 13% 130 17% 69
General community total sample size = 1100. Aboriginal and Torres Strait Islander total sample size = 502
Please note, percentages have been rounded and may not equal 100%
POLITY PTY. LTD.research & CONSULTING
______________________________________________________________________
Polityresearch.com.au Sydney; NSW 2010 ABN: 93 169 495 130
Top Related