


Languages
Pages
Legal

POINT IN TIME COUNT OF
PERSONS EXPERIENCING
HOMELESSNESS:
June 2011
Marin County 2011 Report Findings
Report prepared by Felice McClenon
If you have any questions regarding this report contact:
Lisa Sepahi, County of Marin Health & Human Services
415-473-3501, [email protected]

Point in Time Count of Persons Experiencing Homelessness: Updated August 2011
Page 2
ACKNOWLEDGEMENTS
The County of Marin extends its gratitude and appreciation to the many housing and service providers, faith-based groups, educational institutions and community members who participated in the 2011 Point-in-Time Count. The 2011 Count was a great success thanks to everyone’s participation. The success of the Count depends on the work of many individuals and the following organizations, which recruited staff and volunteers, and helped to administer surveys on the day of the Count. We would also like to extend our special thanks to Warm Wishes for providing backpacks with survival gear to some of our most vulnerable residents experiencing homelessness. Adopt A Family of Marin The MYC Schools:
Bay Area Community Resources Novato Community of Christ Novato Unified
Buckelew Programs Novato Human Needs Center San Rafael City Schools
Canal Alliance Novato Wellness Clinic Dixie School District
Canal Welcome Center Open Door Church, Novato Sausalito Marin City School District
CARE Team: Community Action Marin REST Program Ross Valley School District
Catholic Charities Ritter Center Marin County Office of Education
Center for Domestic Peace (Home of MAWS) Salvation Army
Center for Independent Living San Francisco Food Bank School-based pantries
Center Point Inc. San Geronimo Valley Community Center
Coastal Health Alliance St. Andrews Presbyterian Church, Marin City
Community Action Marin St. Mary Star of the Sea, Sausalito
Fair Housing of Marin St. Vincent de Paul Society of Marin
Gilead House United Way of Bay Area/211
Grassroots Leadership Veteran’s Administration
Homeward Bound of Marin West Marin Community Resource Center
Huckleberry Youth Westminster Presbyterian, Tiburon
Legal Aid of Marin Whistlestop
Marinlink County of Marin Programs
Margaret Todd Senior Center Aging and Adult Services Point Reyes Service Center
Marguerita C. Johnson Senior Center CalWORKS Public Assistance
Marin City CDC Career Resource Center Public Guardian
Marin Community Clinics Community Mental Health Veteran’s Services
Marin Continuum of Housing & Services Connection Center Vital Statistics
Marin General Hospital Dental Clinic W.I.C.
Marin Housing Authority Detention Health Services Probation Department
Marin Head Start Employment and Training Marin Law Library
Marin School Districts Health Clinics

Point in Time Count of Persons Experiencing Homelessness: Updated August 2011
Page 3
EXECUTIVE SUMMARY
The Marin County Department of Health & Human Services, in partnership with housing and service providers,
faith based groups and schools, led this year’s effort to conduct the biennial census of persons experiencing
homelessness in Marin County.
The U.S. Department of Housing and Urban Development (HUD) requires cities and counties to conduct a
biennial Point-in-Time Count of unsheltered and sheltered persons experiencing homelessness.
Specifically HUD requires counties to:
Gather statistically reliable, unduplicated counts or estimates of homeless persons on the street (in
places not meant for human habitation), emergency shelters and transitional housing locations on
a single day.
Identify how the data were gathered for the count and;
Conduct a count every two years during the last week in January.
In addition to meeting HUD requirements Marin County used this federal mandate as an opportunity to
conduct a Community Count: a broader census which includes populations not formally recognized by HUD.
Marin County conducted its biennial “Point-in-Time Count” on January 27, 2011. The Count is intended as a
one-day snapshot of unduplicated numbers of homeless families and individuals in sheltered, unsheltered and
other locations in Marin County and is in no way a comprehensive or complete census.
METHODOLOGY
Marin’s County utilizes the Department of Housing and Urban Development Guidance for Counting Sheltered
and Unsheltered Populations in developing its count strategy and methodology. Marin conducts a detailed
survey of each individual counted. This allows for a much more robust count than a simple enumeration or
random interview method utilized by many other communities. The primary methodology for the count is a
housing survey. Surveys were administered throughout the County at over 75 locations/programs on the day
of the count.

Point in Time Count of Persons Experiencing Homelessness: Updated August 2011
Page 4
KEY FINDINGS
2011 COUNT FINDINGS Community Count Total (sheltered, unsheltered and other homeless populations)
1,220
Persons counted in places not meant for human habitation 343 Persons counted in shelter and transitional housing 533 Persons counted as part of “other homeless populations” 344 Number of children 248 Number of adults 972 Number of precariously housed 4,179 Number of chronically homeless 229
The number of persons counted decreased from 1,770 in 2009 to 1,220 in 2011. This decrease may be
attributed to the infusion of one-time federal “stimulus” funds. Over $2 million in federal financial support to prevent homelessness and move persons experiencing homelessness into housing was filtered into the community since October 2009.
The $2million in stimulus funding helped to reduce the number of persons who are homeless and to reduce the number of persons falling into homelessness. The stimulus funding for prevention and homelessness assistance has had a positive impact nationwide in reducing the number of persons experiencing homelessness.
Since October 2009, over 650 homeless adults and children have been re-housed in permanent housing and 1,522 adults and children were helped to prevent homelessness.
Of the 247 children counted, 134 were living in emergency shelters or transitional housing programs. Two were unsheltered and 112 were counted in other sheltered homeless settings (motels or temporarily living with friends due to homelessness).
The number of precariously housed increased by 38% compared to the 2009 count. This population
represents the number of persons at risk of losing their homes. Nearly half (47%) of adults counted have been homeless for one year or more. 10% (93) of those adults
counted have been homeless for 10 years or more. The primary reasons stated for cause of homelessness was loss of job, lack of affordable housing and
lack of income. These were also cited as the top reasons for homelessness in 2009.

Point in Time Count of Persons Experiencing Homelessness: Updated August 2011
Page 5
TABLE OF CONTENTS
ACKNOWLEDGEMENTS ............................................................................................... 2
EXECUTIVE SUMMARY ................................................................................................ 3
TABLE OF FIGURES ...................................................................................................... 6
GLOSSERY OF TERMS .................................................................................................. 7
INTRODUCTION .......................................................................................................... 9
DEFINING HOMELESSNESS ........................................................................................ 10
AT RISK OF HOMELESSNESS ...................................................................................... 11
HOMELESSNESS IN PERSPECTIVE ............................................................................... 11
COUNT METHODOLOGY ........................................................................................... 15
COMMUNITY COUNT RESULTS .................................................................................. 17
COMPARING PREVIOUS COUNTS .............................................................................. 18
COUNT LIMITATIONS ................................................................................................ 19
COMPARISON AND SURROUNDING COUNTIES RESULTS ............................................ 20
COMMUNITY COUNT FINDINGS: 2009 AND 2011 COMPARABLE DATA ...................... 21
PROFILES OF HOMELESSNESS IN MARIN .................................................................... 36
CONCLUSION ............................................................................................................ 39
APPENDIX A: SURVEY ............................................................................................... 42
APPENDIX B: DATA BOOK ......................................................................................... 44
APPENDIX C: PARTICIPATING AGENCY COUNTS ........................................................ 50
Point in Time Count of Persons Experiencing Homelessness: Updated August 2011
Page 6
TABLE OF FIGURES
EXHIBIT 1: Community Count Breakdown ........................................................................................................... 18
EXHIBIT 2: Comparable County Results ................................................................................................................ 20
EXHIBIT 3: Age ....................................................................................................................................................... 21
EXHIBIT 4: Gender ................................................................................................................................................ 22
EXHIBIT 5: Race and Ethnicity ............................................................................................................................... 22
EXHIBIT 6: Comparing the Count to the overall population according to race. .................................................. 23
EXHIBIT 7: Length of Homelessness ...................................................................................................................... 24
EXHIBIT 8: Length of Homelessness in 2011 Only ............................................................................................... 25
EXHIBIT 9: Episodes of Homelessness .................................................................................................................. 25
EXHIBIT 10: Health Issues (Adults Only)*............................................................................................................. 26
EXHIBIT 11: 2011 Location of Adults ..................................................................................................................... 29
EXHIBIT 12: Place of last permanent residence ................................................................................................... 30
EXHIBIT 13: Income and Government Assistance ................................................................................................ 31
EXHIBIT 14: Reasons cited for Homelessness in 2011 .......................................................................................... 32
EXHIBIT 15: Precariously Housed by City/Location .............................................................................................. 34
EXHIBIT 16: Precariously Housed by Geographic Location .................................................................................. 35

Point in Time Count of Persons Experiencing Homelessness: Updated August 2011
Page 7
GLOSSERY OF TERMS
Term Definition
HUD The U.S. Department of Housing & Urban Development, HUD oversees programs
under the McKinney-Vento Act which provides funding for homeless programs
and services.
Literally Homeless A person sleeping in a place not meant for human habitation (HUD Definition) (including living on the streets, in an abandoned building, or in a vehicle), or residing in an emergency shelter or transitional housing program. Homeless All persons defined under the HUD “literally homeless” definition plus (Community Definition) other homeless populations which include: any person in jail or an institution who would not have a permanent address after release or “literally homeless” prior to incarceration; any person who stayed temporarily with family or friends due to loss of housing and identified themselves as homeless on the day of the count; any person living in motel/hotel and; any person in hospital but homeless prior to admission. Unless otherwise stated this is the definition of homelessness presented in all the tables contained in this report. Chronically Homeless A person who is living in a place not meant for human habitation (car, street, (HUD Definition) camp) or emergency shelter and has been homeless for one year or more or has had at least four episodes of homelessness in the past three years and has a formerly recognized disabling condition. Disabling Condition A disabling condition is defined as “a diagnosable substance abuse disorder, a (HUD Definition) serious mental illness, developmental disability, or chronic physical illness or disability, including the co-occurrence of two or more of these conditions.” In addition, “a disabling condition limits an individual’s ability to work or perform one or more activities of daily living.” Sheltered Any person residing in an emergency shelter program or transitional housing program on the night of the count. HUD recognizes this population as homeless. Other Sheltered Populations This population includes those detailed as part of the Community Definition of homeless which do not fall under the HUD definition, including persons in
Point in Time Count of Persons Experiencing Homelessness: Updated August 2011
Page 8
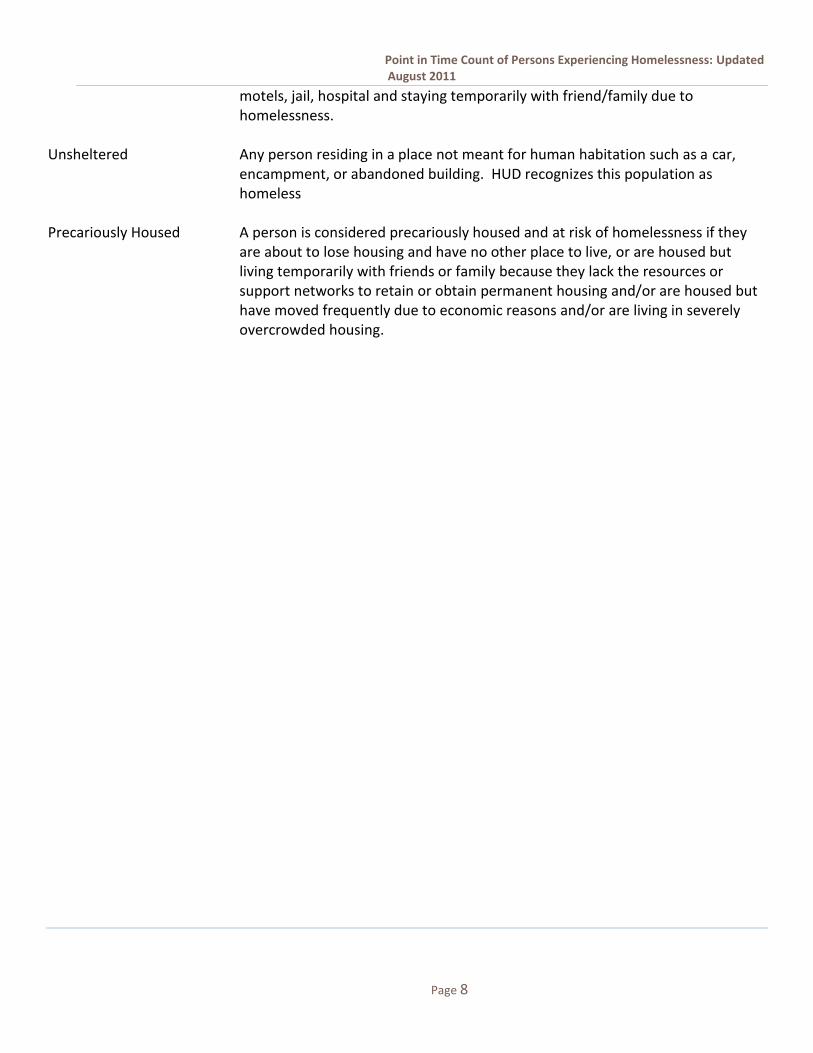
motels, jail, hospital and staying temporarily with friend/family due to homelessness. Unsheltered Any person residing in a place not meant for human habitation such as a car,
encampment, or abandoned building. HUD recognizes this population as homeless
Precariously Housed A person is considered precariously housed and at risk of homelessness if they are about to lose housing and have no other place to live, or are housed but living temporarily with friends or family because they lack the resources or support networks to retain or obtain permanent housing and/or are housed but have moved frequently due to economic reasons and/or are living in severely overcrowded housing.
Point in Time Count of Persons Experiencing Homelessness: Updated August 2011
Page 9
INTRODUCTION
The Point‐in‐Time Count of persons experiencing homelessness is a census conducted during the last seven days of January and takes place every two years. It provides a one‐day snapshot of unduplicated numbers of individuals and families in sheltered and unsheltered locations in Marin County.
The U.S. Department of Housing and Urban Development (HUD) requires a “Point‐in‐Time Count of Homeless Persons” across the country. The count helps HUD and local communities by providing accurate data on the scope of homelessness. These data help to better plan for services and programs which meet local needs. The count also helps preserve over $2.5 million in annual federal funding for homeless services in Marin County.
The last count was conducted in 2009. During that count 1,770 individuals and families were counted as part of the Community Count.
Many people are vulnerable to becoming homeless. Homelessness happens to families, individuals, and persons from every race, age, gender, class and educational background. The gap between income and the cost of housing is often the most significant factor contributing to homelessness. Simply put, families and individuals can not afford housing based on what they earn.
In Marin County the Point‐in‐Time Homeless Count is a Community Count, which includes persons who are living without shelter, in shelter and housing programs, persons who are sheltered but have lost their housing and living in temporary locations such as motels or with friends or families.
The Point‐in‐Time census can only provide a one‐day snapshot of the needs in the community, however it provides an important baseline for understanding, responding and planning for the needs of persons experiencing homelessness and those at risk of losing their homes in Marin.
Point in Time Count of Persons Experiencing Homelessness: Updated August 2011
Page 10
DEFINING HOMELESSNESS
Marin conducts a Community Count which incorporates the Department of Housing and Urban Development
(HUD) definition of homelessness and includes populations which are excluded from the HUD definition.
Point-in-Time Community Count Populations
HUD defines homeless as:
o An individual who lacks a fixed, regular, and adequate nighttime residence, and
o An individual who has a primary nighttime residence that is:
A shelter designed to provide temporary living accommodations such as an emergency shelter or transitional
housing program for persons who have come from the street or emergency shelter or;
A place not meant for human habitation such as a car, street, camp or abandoned building.
Additionally the Community Count includes other homeless populations: (these populations are excluded from HUD’s definition
of homelessness):
o Any person in jail or an institution who would not have a permanent address after release or homeless prior to
incarceration;
o Any person who stayed temporarily with family or friends due to loss of housing and identified themselves as homeless
on the day of the count;
o Any person living in motel/hotel and;
o Any person in hospital but homeless prior to admission.

Point in Time Count of Persons Experiencing Homelessness: Updated August 2011
Page 11
AT RISK OF HOMELESSNESS
PRECARIOUSLY HOUSED
In order to provide a more comprehensive picture of homelessness, the Community Count includes counts of
individuals and families who are precariously housed. The precariously housed include:
o Persons about to lose housing due to: eviction, lack of money, being forced out of current
housing and have no other place to live.
o Persons housed and living temporarily with friends or family because they lack the resources or
support networks to retain or obtain permanent housing, who were not, presumably,
immediately homeless prior to living with friends/family.
o Persons who are housed but have moved frequently due to economic reasons and/or living in
severely overcrowded housing.
HOMELESSNESS IN PERSPECTIVE
Causes of homelessness
There are many reasons why a family or individual may become homeless; however the primary factor
contributing to homelessness is that families and individuals simply cannot afford housing.
During the last two decades the amount of affordable rental housing has decreased and with a poor economy
many have been pushed into poverty. Poverty has had a significant impact on the growing homeless
population. Factors such as lack of affordable health care, eroding work opportunities and the increasing cost
of living all play a role in homelessness.
Other precipitating factors which contribute to homelessness include: drug and/or alcohol abuse, mental
illness and experience of domestic violence. It is important to note that mental illness and drug and/or alcohol
abuse are very rarely the primary factor for causing homelessness. It is other mitigating factors such as lack of
access to treatment, living in poverty and lack of health insurance that increases vulnerability to
homelessness.
Poverty and Self-sufficiency
According to American Community Survey Census data 6.4% of Marin’s population was estimated to live
below 100% of the Federal Poverty Level (See Figure 1) i Poverty and homeless are closely linked. When
households lack income to provide for basic needs, they are forced to choose between housing costs,
Point in Time Count of Persons Experiencing Homelessness: Updated August 2011
Page 12
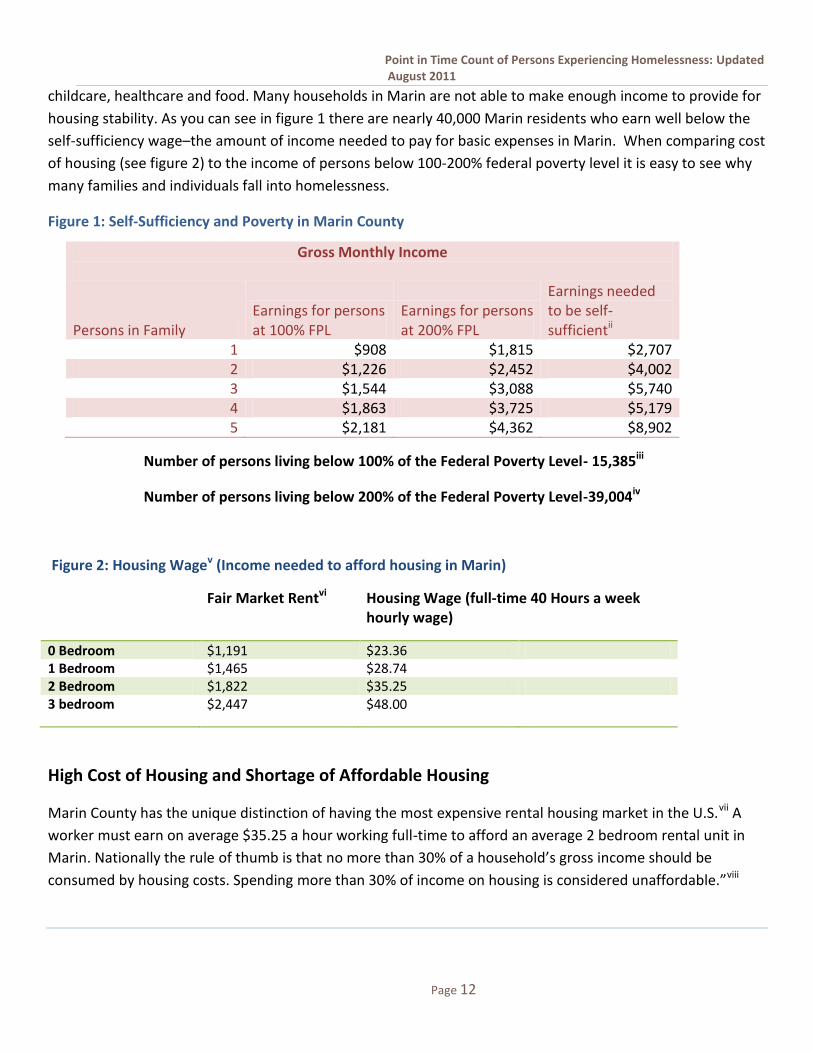
childcare, healthcare and food. Many households in Marin are not able to make enough income to provide for
housing stability. As you can see in figure 1 there are nearly 40,000 Marin residents who earn well below the
self-sufficiency wage–the amount of income needed to pay for basic expenses in Marin. When comparing cost
of housing (see figure 2) to the income of persons below 100-200% federal poverty level it is easy to see why
many families and individuals fall into homelessness.
Figure 1: Self-Sufficiency and Poverty in Marin County
Gross Monthly Income
Persons in Family Earnings for persons at 100% FPL
Earnings for persons at 200% FPL
Earnings needed to be self-sufficientii
1 $908 $1,815 $2,707 2 $1,226 $2,452 $4,002 3 $1,544 $3,088 $5,740 4 $1,863 $3,725 $5,179 5 $2,181 $4,362 $8,902
Number of persons living below 100% of the Federal Poverty Level- 15,385iii
Number of persons living below 200% of the Federal Poverty Level-39,004iv
Figure 2: Housing Wagev (Income needed to afford housing in Marin)
Fair Market Rentvi Housing Wage (full-time 40 Hours a week hourly wage)
0 Bedroom $1,191 $23.36 1 Bedroom $1,465 $28.74 2 Bedroom $1,822 $35.25 3 bedroom $2,447 $48.00
High Cost of Housing and Shortage of Affordable Housing
Marin County has the unique distinction of having the most expensive rental housing market in the U.S.vii A
worker must earn on average $35.25 a hour working full-time to afford an average 2 bedroom rental unit in
Marin. Nationally the rule of thumb is that no more than 30% of a household’s gross income should be
consumed by housing costs. Spending more than 30% of income on housing is considered unaffordable.”viii

Point in Time Count of Persons Experiencing Homelessness: Updated August 2011
Page 13
Despite this more and more households are spending more than 50% of their income on housing alone. In
2009 one in four renters nation-wide paid more than half of their income on housing. ixThis places many
families and individuals at risk of homelessness. Many more households particularly those who are currently
homeless cannot enter the rental market in Marin as their earnings fall far below the average cost of a studio
or room for rent.
Marin has a limited supply of affordable housing to meet the demand. The Marin Housing Authority in
September 2010 had over 10,000 households on the waiting list for Section 8 affordable housing. Recently the
rental market has also taken a hit with more and more households moving from ownership to renting the
completion for affordable units is fierce. This coupled with very low vacancy rates overall makes it difficult for
households to find housing altogether. The lack of affordability and the dearth of units is one driving factor
pushing households into doubled up situations. “As an indicator of things to come, the number of households
“doubling up” by moving in with friends or family members in order to reduce their housing cost burden rose
12% over the course of 2009. The National Alliance to End Homelessness estimates that the odds of a double-
up household experiencing homelessness rises to 1 in 10, and living in a doubled up housing situation is
common among adults just prior to entering the shelter system.”x
Figure 3: Rent Affordability by Selected income Levels
$1,833
$416
$260
$270
$0 $500 $1,000 $1,500 $2,000
2BR Fair Market Rent
Mininum Wage Earner
CalWORKS Recipent
Social Security Disbality Reciepent
Monthly Rent Affordablity for Selected Income Levels Compared with Two-
Bedroom Fair Market Rental
Point in Time Count of Persons Experiencing Homelessness: Updated August 2011
Page 14
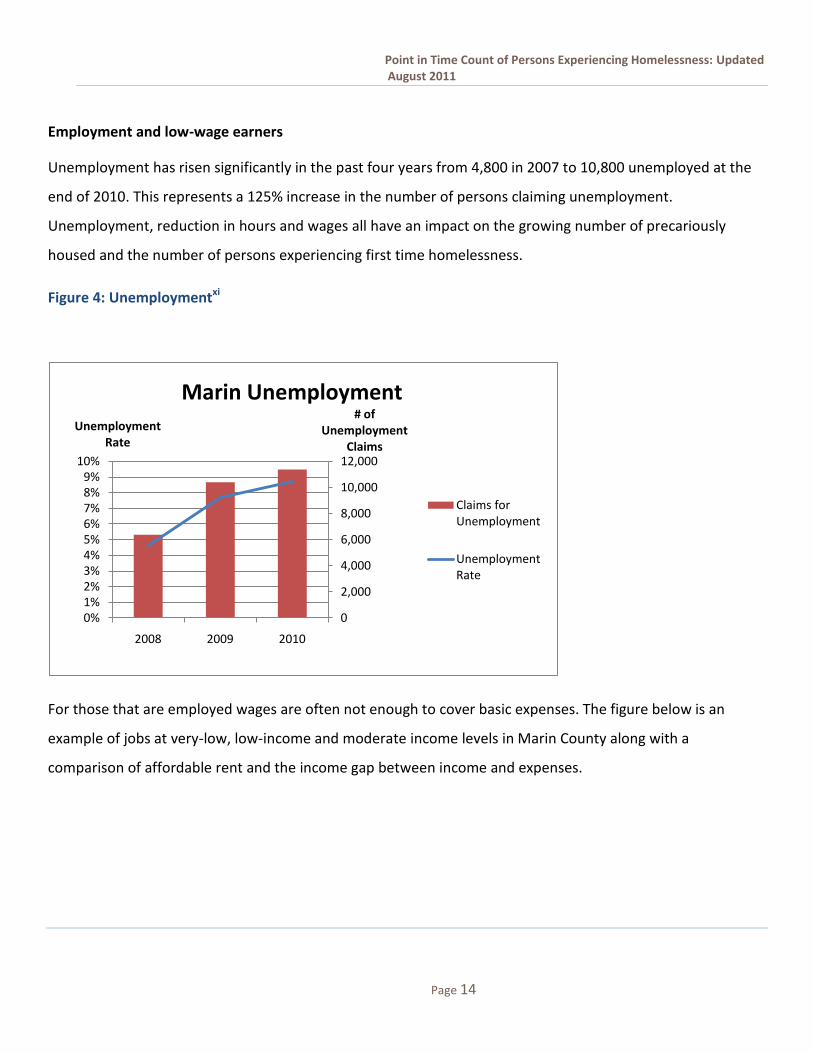
Employment and low-wage earners
Unemployment has risen significantly in the past four years from 4,800 in 2007 to 10,800 unemployed at the
end of 2010. This represents a 125% increase in the number of persons claiming unemployment.
Unemployment, reduction in hours and wages all have an impact on the growing number of precariously
housed and the number of persons experiencing first time homelessness.
Figure 4: Unemploymentxi
For those that are employed wages are often not enough to cover basic expenses. The figure below is an
example of jobs at very-low, low-income and moderate income levels in Marin County along with a
comparison of affordable rent and the income gap between income and expenses.
0
2,000
4,000
6,000
8,000
10,000
12,000
0%1%2%3%4%5%6%7%8%9%
10%
2008 2009 2010
# of Unemployment
Claims
Unemployment Rate
Marin Unemployment
Claims for Unemployment
Unemployment Rate

Point in Time Count of Persons Experiencing Homelessness: Updated August 2011
Page 15
Figure 5: Bay Area Wages and Affordable Rents xii
Bay Area Wages and Affordable Rents 1
Hourly Wage
Annual Income Affordable Rent + Utilities
Median Rent Gap
Very low income- Less than 50% of median income
Home Health Aides $11.75 $24,441 $611.03 -$830.98
Child Care Workers $12.77 $26,568 $664.20 -$777.80
Retail Salespersons $12.91 $26,852 $671.30 -$770.70
Low Income – 50%-80% of Median
Medical Assistants $18.28 $38,019 $950.48 -$491.53
Construction Laborers $21.33 $44,374 $1,109.35 -$332.65
Mental Health and Social Workers $21.57 $44,869 $1,121.73 -$320.28
Chefs and Head Cooks $21.43 $44,566 $1,114.15 -$327.85
Moderate Income – 80%-100% of Median
Police, Fire, and Ambulance Dispatchers $25.68 $53,409 $1,335.23 -$106.78
Licensed Nurses $27.31 $56,804 $1,420.10 -$21.90
Emergency Medical Technicians and Paramedics $27.94 $58,104 $1,452.60 $10.60
Civil Engineering Technicians $28.31 $58,868 $1,471.70 $29.70
COUNT METHODOLOGY
Marin follows approved methodology for counting shelter and unsheltered populations based on guidance
developed by the Department of Housing and Urban Development. The primary methodology for the count
was a brief survey method.
THE SURVEY:
A ‘housing’ survey was developed - in collaboration with homeless service and housing providers - based on
the 2009 Count survey instrument. The survey was referred to as a ‘housing’ survey rather than ‘homeless’
survey in order to encourage broad participation and not single out persons based on their housing status.
Point in Time Count of Persons Experiencing Homelessness: Updated August 2011
Page 16
The survey’s seventeen questions range from simple demographic information such as gender, race, and age
to information regarding reasons for homelessness, length of homelessness, where respondents stayed the
night before the count, information on disabilities, veteran status, income and experience of domestic
violence; valuable information on the characteristics of the population.
A number of steps were taken to avoid duplication and to ensure the validity of the data. Each survey
respondent was asked to provide a unique ID (first two letters of last name and birth date) and asked whether
they had completed a survey at another location. As part of the data collection process any duplicates were
removed.
The count consisted of three components:
Shelter & Housing Count: All emergency shelter and transitional housing programs participated in this count
by either surveying program participants on the day of the count or by providing information through Marin’s
Homeless Management Information System (HMIS). HMIS is a county-wide database for homeless services,
shelter and housing providers;, the data collected are based on HUD approved data standards. HMIS tracks
program occupancy and is an effective tool for assessing the numbers of persons in programs on a given day.
Community Site Counts: The survey was distributed through seventy-five agencies/programs around the
County on the day of the count. Any visitors to the program/agency on the day of the Count were asked to
complete the brief housing survey.
Targeted Outreach: As part of the count there were special efforts to reach and survey some of the more
marginalized populations such as families, immigrants/refugees, those living in encampments, in jail and those
in the isolated West Marin area. Outreach included special teams which surveyed in the Canal area of San
Rafael, participation from Marin County schools and Head Start programs, a peer-led team surveying
encampments, a jail team surveying inmates and reviewing booking logs and a street team surveying the
Point-Reyes and Bolinas areas.

Point in Time Count of Persons Experiencing Homelessness: Updated August 2011
Page 17
COMMUNITY COUNT RESULTS
Marin’s Community Count was conducted on January 27, 2011 based on established guidelines for counting
shelter and unsheltered homeless persons set forth by the Department of Housing and Urban Development
(HUD).
2011 Point-in-Time Count Results:
o A total of 1,220 persons were counted as homeless on January 27, 2011.2
o 876 of those persons met HUD’s definition of homeless, residing on the street, in emergency
shelters or transitional housing programs.
343 (28 %) were “literally homeless” living in places not meant for human habitation
such as cars, streets, and encampments.
533 (44%) were in either emergency shelter or transitional housing programs.
o An additional 344 (28%) were sheltered in settings not recognized by HUD, such as motels, jail,
hospitals and temporary residence with friends or family.
84 persons were found in the county jail and 3 at Marin General Hospital.
14 persons were living in motels and 100 had lost their housing and were living with
friends or family and stated they were homeless when surveyed the day of the count.
143 persons did not specify their location the night before the count.
o 4,179 persons were found to be at risk of homelessness and counted as precariously housed.
2 This total includes those populations as defined on page 7 which are excluded from HUD’s definition of homelessness.
Point in Time Count of Persons Experiencing Homelessness: Updated August 2011
Page 18
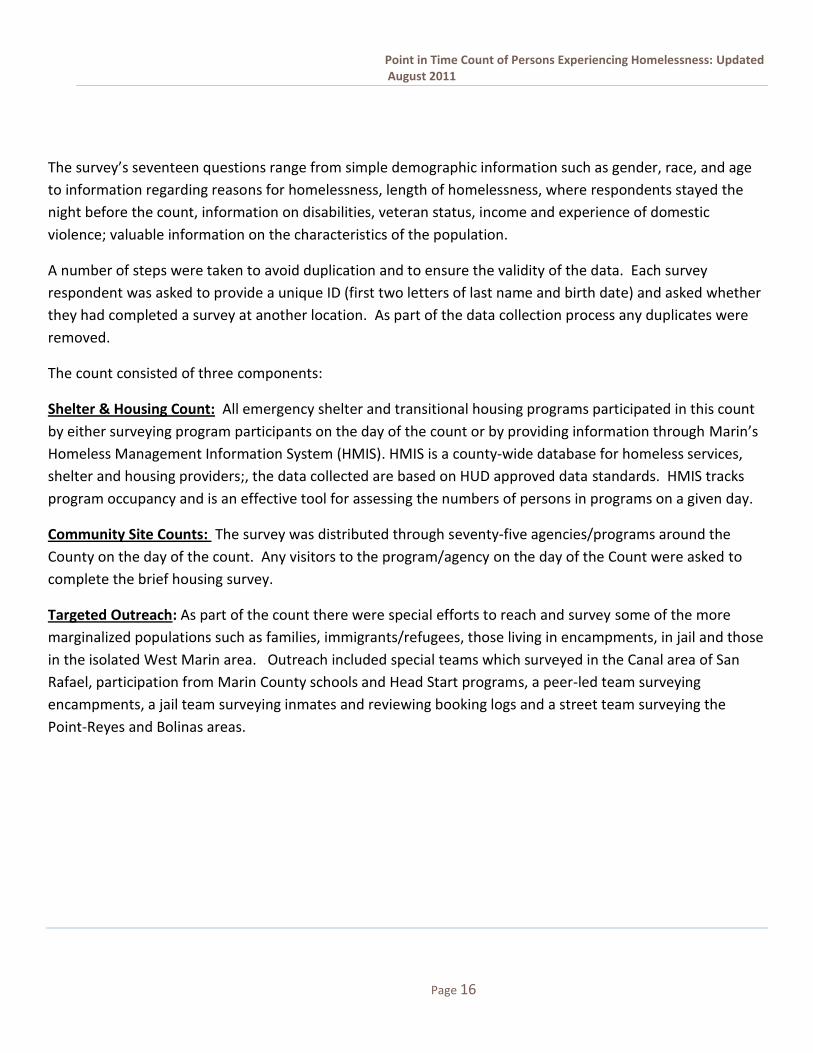
EXHIBIT 1: Community Count Breakdown
2011 Community Count 2009 2011 Unsheltered and other sheltered homeless populations
1,044 687
Sheltered (emergency shelter and transitional housing)
726 5333
Total 1,770 1,220 Precariously Housed 3,028 4,179
COMPARING PREVIOUS COUNTS
As in 2009, the 2011 Point in Time Count of homeless persons consisted of multiple data collection methods.
These included brief survey, HMIS information, and information collected by special outreach teams. The 2011
count methodology included some enhancements over that used in 2009, which contributed to the overall
improvement in data quality. This resulted in more complete data and lower frequency of missing data points.
These include:
Improvements to the housing survey: The survey was modified in 2011 as part an overall effort to reduce
incidents of missing or incomplete responses to survey questions.
Abbreviated surveys administered by special outreach teams: In 2009, data were not available for all
adults as some populations were part of a simple enumeration and no identifying information was
collected. During this year’s count, special outreach teams were able to collect information from those
counted.
Homeless Management Information System (HMIS) data quality improvement: Data on the sheltered
population was primarily collected from HMIS and through individual surveys. Improvements to HMIS
data collection procedures since 2009 contributed to overall data quality improvements to the Count.
3 The number of persons counted as sheltered is lower than 2009 due to a change in how shelter and housing beds are counted, this
resulted in fewer beds that could be included in the count. This by no means reflects a fewer number of person in shelter just a technical change in the housing inventory which requires only beds specifically dedicated for homeless to be included in the count.
Point in Time Count of Persons Experiencing Homelessness: Updated August 2011
Page 19
COUNT LIMITATIONS
One-day counts often underestimate the number of people experiencing homelessness. Homelessness, by
nature, is not static. Some people who had housing on the night of the count may later become homeless.
Others, who were homeless on the day of the count, may find housing. While point-in-time data attempts to
capture the number of people experiencing homelessness on a single day, research shows that it does not
provide accurate estimates of the homeless population throughout the year.
Identifying the homeless population is challenging for other reasons. Due to the stigma of homelessness,
many people experiencing homelessness do not wish to be counted or do not access services such as shelters
or social service programs. This is especially true of families, an often hidden group among the homeless
population. These and other factors may have impacted the outcome of the count and are discussed below:
o Inaccessible or isolated areas: Some people experiencing homelessness reside in isolated areas or
places not easily accessible, such as outlying areas, forests and open space.
o Weather: As is typical in late January, the weather was chilly and drizzly in the early morning of the
count. Some count outreach efforts took place on other days during the last week in January to
compensate for poor conditions on the count day. Special outreach team members reported rainy
conditions on one of the alternate days of the count.
o Prior knowledge of the count: Individuals and families, who do not want to be counted, may stay
isolated on the day of the count. Many families hide the fact that they are experiencing
homelessness out of fear that their children will be taken away.
o Unaccompanied Youth experiencing homelessness are often undercounted as they are more likely
to stay away from the general homeless population.
o Persons not indentifying as homeless: Although the Housing Survey attempts to assess a person’s
housing status, some persons interviewed do not identify as “homeless” although they may be
living in a place not meant for human habitation and may select that they are housed.
Point in Time Count of Persons Experiencing Homelessness: Updated August 2011
Page 20
COMPARISON AND SURROUNDING COUNTIES RESULTS
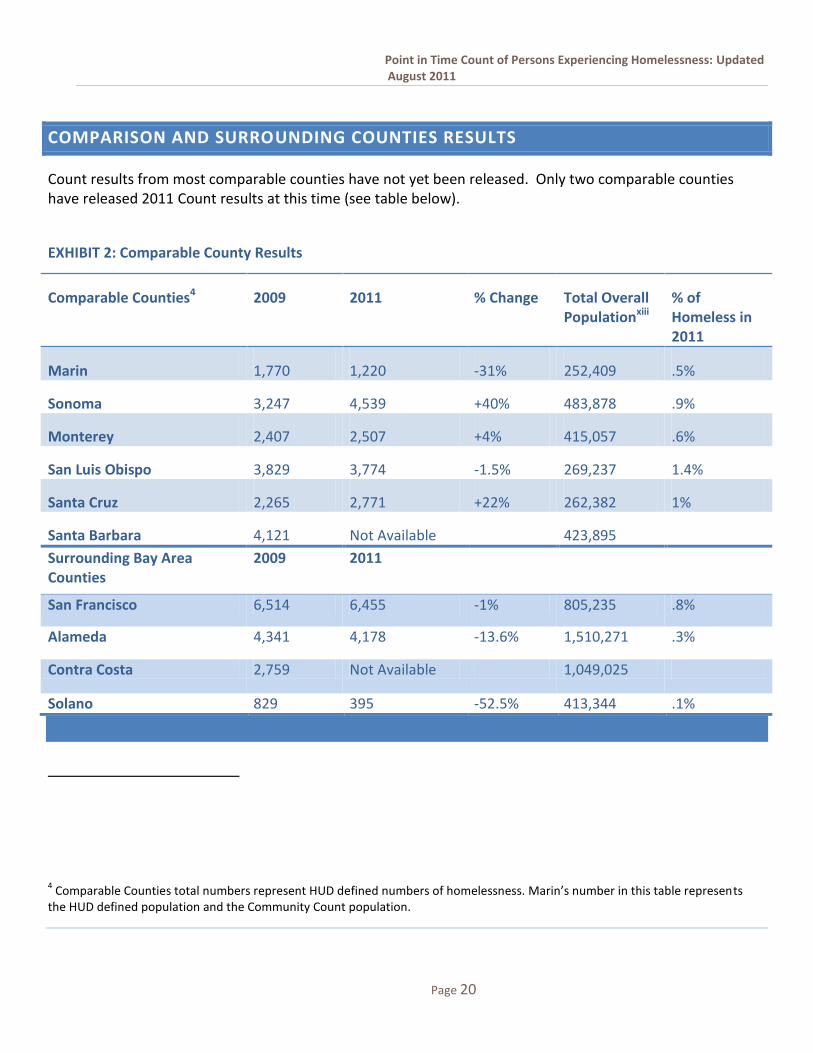
Count results from most comparable counties have not yet been released. Only two comparable counties have released 2011 Count results at this time (see table below).
EXHIBIT 2: Comparable County Results
Comparable Counties4 2009 2011 % Change Total Overall Populationxiii
% of Homeless in 2011
Marin 1,770 1,220 -31% 252,409 .5%
Sonoma 3,247 4,539 +40% 483,878 .9%
Monterey 2,407 2,507 +4% 415,057 .6%
San Luis Obispo 3,829 3,774 -1.5% 269,237 1.4%
Santa Cruz 2,265 2,771 +22% 262,382 1%
Santa Barbara 4,121 Not Available 423,895
Surrounding Bay Area Counties
2009 2011
San Francisco 6,514 6,455 -1% 805,235 .8%
Alameda 4,341 4,178 -13.6% 1,510,271 .3%
Contra Costa 2,759 Not Available 1,049,025
Solano 829 395 -52.5% 413,344 .1%
4 Comparable Counties total numbers represent HUD defined numbers of homelessness. Marin’s number in this table represents
the HUD defined population and the Community Count population.
Point in Time Count of Persons Experiencing Homelessness: Updated August 2011
Page 21
COMMUNITY COUNT FINDINGS: 2009 AND 2011 COMPARABLE DATA
The findings reported in this section provide a deeper understanding of homelessness in Marin. Comparing
data helps to identify trends, changes and similarities in data from this year’s count and data from the 2009
count. Where possible, each data set includes count results from the 2009 and the 2011 count. Although the
basic count methodology was similar in 2009, some survey questions and responses were modified in 2011.
Therefore some data sets do not include comparisons.
It is also important to note that the findings are based on data collected on individuals and families
experiencing homelessness as defined by Marin’s Community Count. This population includes the broader
definition of homelessness than the HUD definition as discussed earlier.
DEMOGRAPHICS
Collecting demographic information helps us to gain a better understanding of who is experiencing
homelessness in Marin. Findings based on questions regarding race, age and gender are presented below.
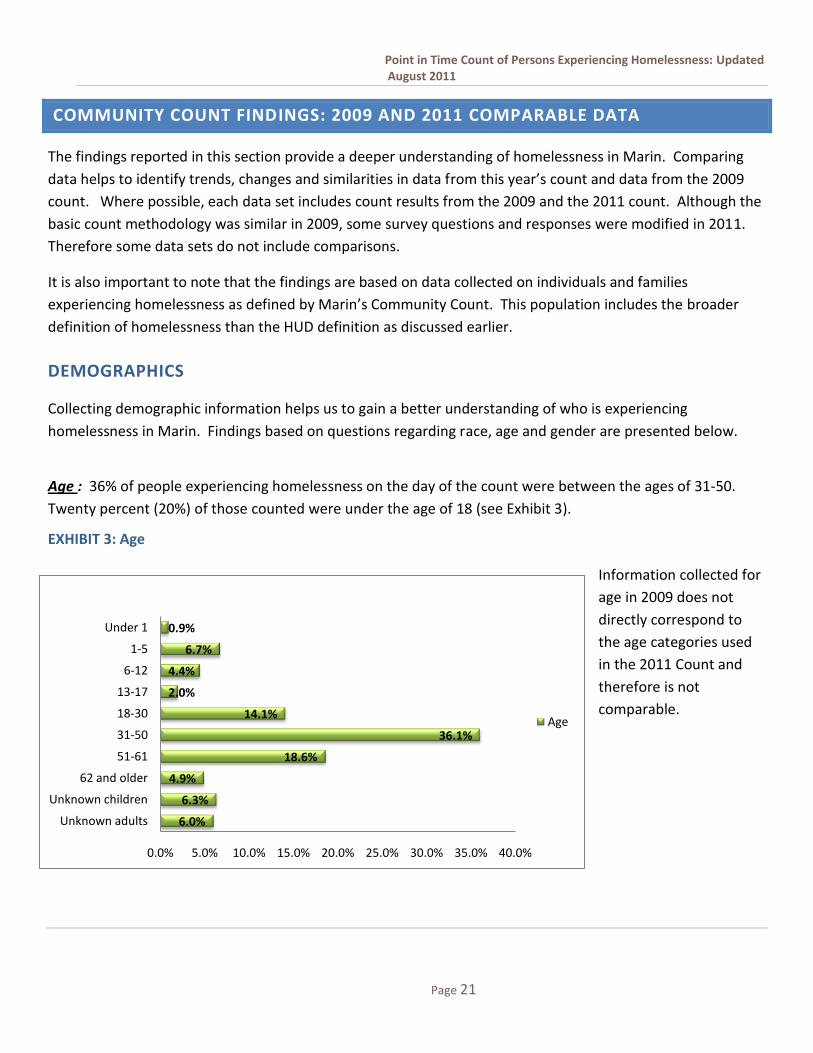
Age : 36% of people experiencing homelessness on the day of the count were between the ages of 31-50.
Twenty percent (20%) of those counted were under the age of 18 (see Exhibit 3).
EXHIBIT 3: Age
Information collected for
age in 2009 does not
directly correspond to
the age categories used
in the 2011 Count and
therefore is not
comparable.
6.0%
6.3%
4.9%
18.6%
36.1%
14.1%
2.0%
4.4%
6.7%
0.9%
Unknown adults
Unknown children
62 and older
51-61
31-50
18-30
13-17
6-12
1-5
Under 1
0.0% 5.0% 10.0% 15.0% 20.0% 25.0% 30.0% 35.0% 40.0%
Age
Point in Time Count of Persons Experiencing Homelessness: Updated August 2011
Page 22
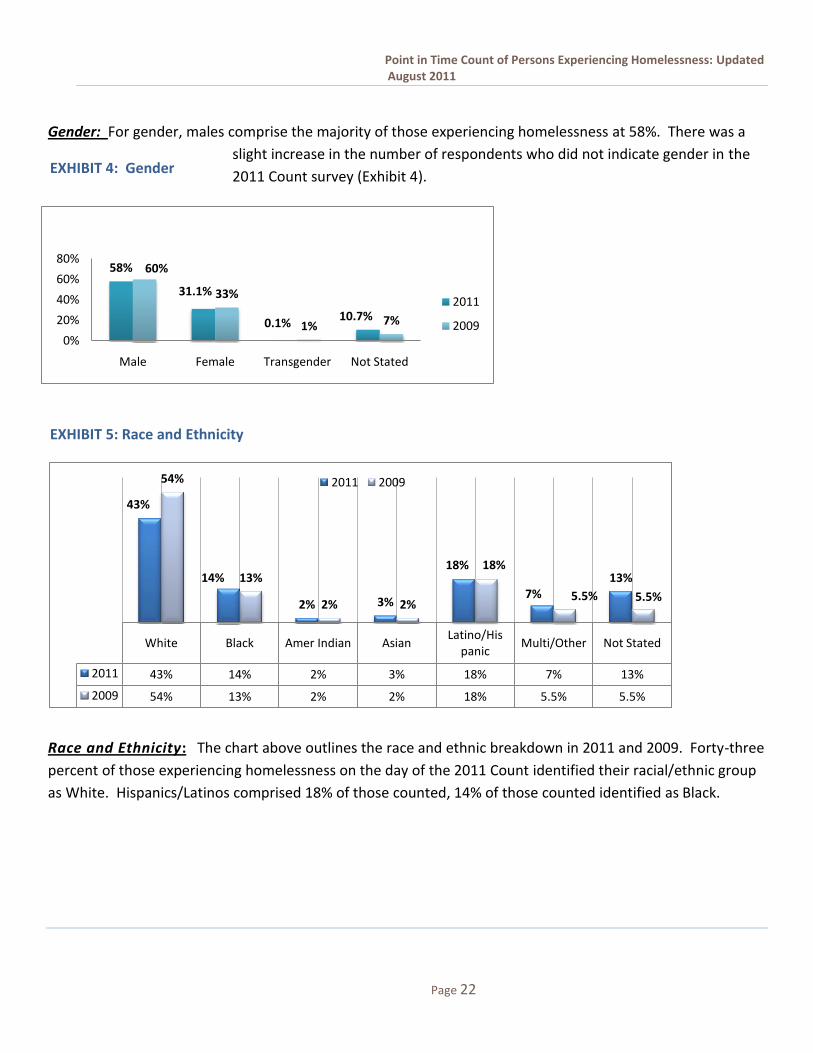
Gender: For gender, males comprise the majority of those experiencing homelessness at 58%. There was a
slight increase in the number of respondents who did not indicate gender in the
2011 Count survey (Exhibit 4).
Race and Ethnicity: The chart above outlines the race and ethnic breakdown in 2011 and 2009. Forty-three
percent of those experiencing homelessness on the day of the 2011 Count identified their racial/ethnic group
as White. Hispanics/Latinos comprised 18% of those counted, 14% of those counted identified as Black.
White Black Amer Indian AsianLatino/His
panicMulti/Other Not Stated
2011 43% 14% 2% 3% 18% 7% 13%
2009 54% 13% 2% 2% 18% 5.5% 5.5%
43%
14%
2% 3%
18%
7%13%
54%
13%
2% 2%
18%
5.5% 5.5%
2011 2009
EXHIBIT 5: Race and Ethnicity
58%
31.1%
0.1%10.7%
60%
33%
1% 7%
0%
20%
40%
60%
80%
Male Female Transgender Not Stated
2011
2009
EXHIBIT 4: Gender
Point in Time Count of Persons Experiencing Homelessness: Updated August 2011
Page 23
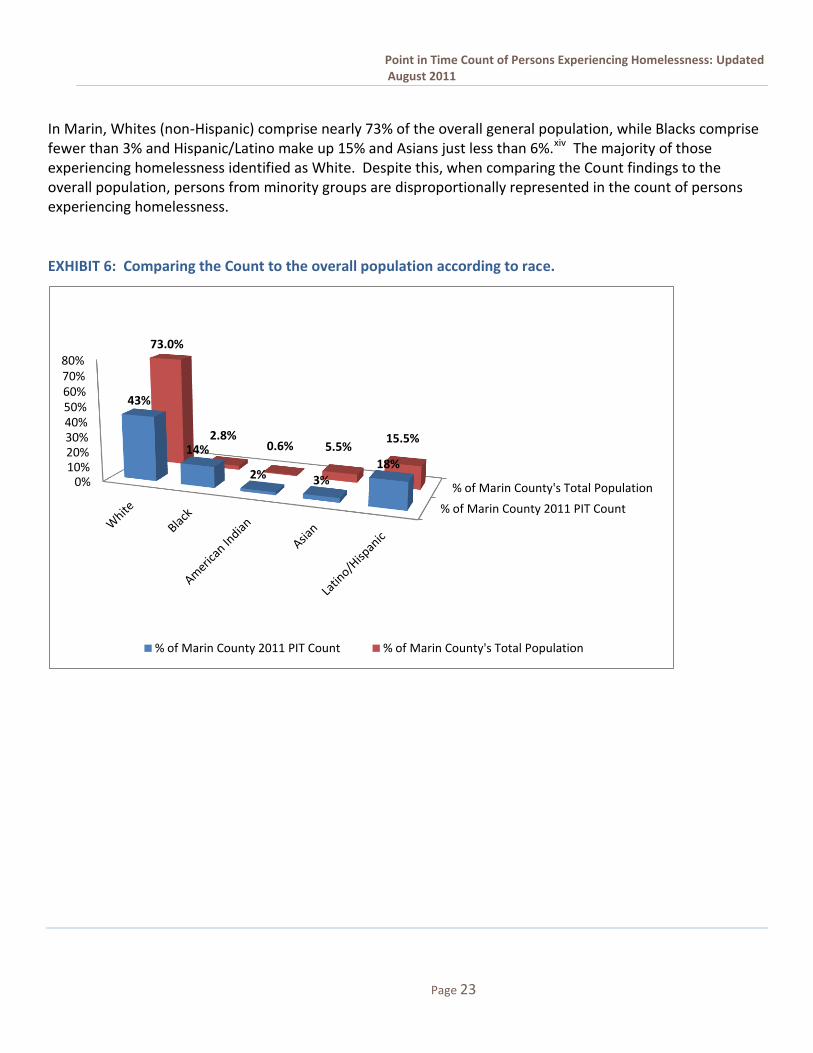
In Marin, Whites (non-Hispanic) comprise nearly 73% of the overall general population, while Blacks comprise fewer than 3% and Hispanic/Latino make up 15% and Asians just less than 6%.xiv The majority of those experiencing homelessness identified as White. Despite this, when comparing the Count findings to the overall population, persons from minority groups are disproportionally represented in the count of persons experiencing homelessness.
EXHIBIT 6: Comparing the Count to the overall population according to race.
% of Marin County 2011 PIT Count
% of Marin County's Total Population0%10%20%30%40%50%60%70%80%
43%
14%
2% 3%18%
73.0%
2.8%0.6% 5.5%
15.5%
% of Marin County 2011 PIT Count % of Marin County's Total Population
Point in Time Count of Persons Experiencing Homelessness: Updated August 2011
Page 24
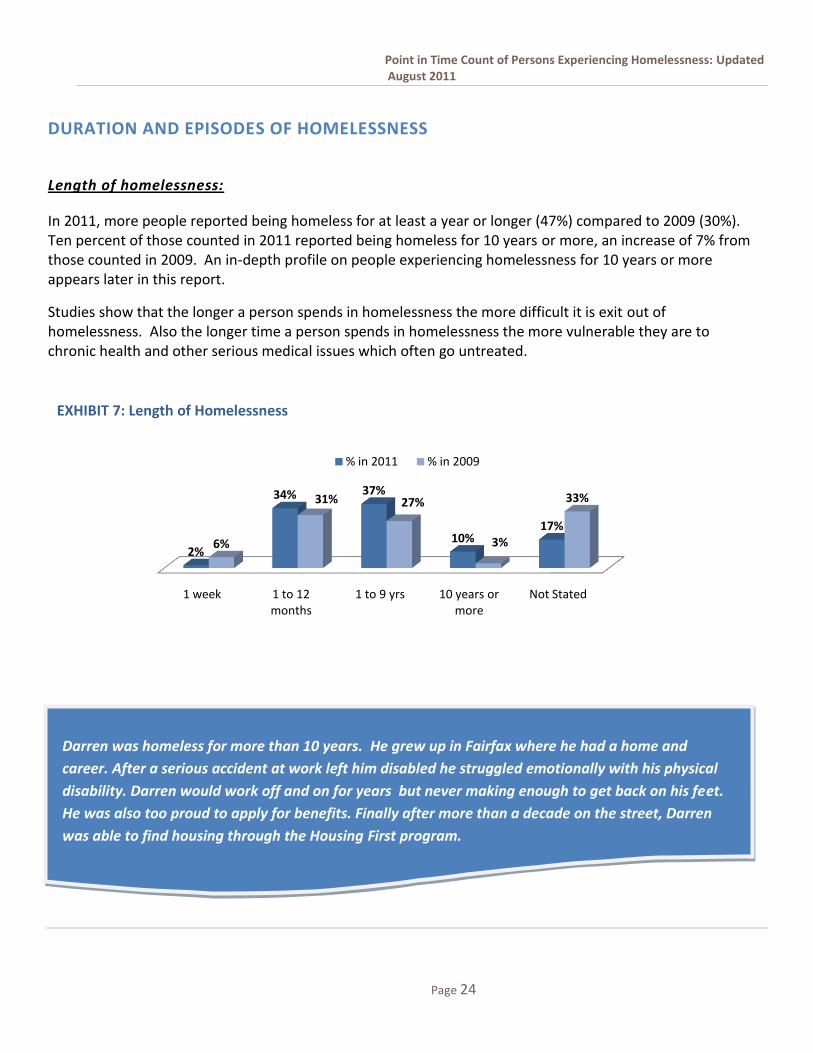
Darren was homeless for more than 10 years. He grew up in Fairfax where he had a home and
career. After a serious accident at work left him disabled he struggled emotionally with his physical
disability. Darren would work off and on for years but never making enough to get back on his feet.
He was also too proud to apply for benefits. Finally after more than a decade on the street, Darren
was able to find housing through the Housing First program.
1 week 1 to 12 months
1 to 9 yrs 10 years or more
Not Stated
2%
34% 37%
10%17%
6%
31% 27%
3%
33%
% in 2011 % in 2009
DURATION AND EPISODES OF HOMELESSNESS
Length of homelessness:
In 2011, more people reported being homeless for at least a year or longer (47%) compared to 2009 (30%). Ten percent of those counted in 2011 reported being homeless for 10 years or more, an increase of 7% from those counted in 2009. An in-depth profile on people experiencing homelessness for 10 years or more appears later in this report.
Studies show that the longer a person spends in homelessness the more difficult it is exit out of homelessness. Also the longer time a person spends in homelessness the more vulnerable they are to chronic health and other serious medical issues which often go untreated.
EXHIBIT 7: Length of Homelessness
EXHIBIT 5: Length of Homelessness

Point in Time Count of Persons Experiencing Homelessness: Updated August 2011
Page 25
EXHIBIT 8: Length of Homelessness in 2011 Adults Only
Recurrence of Homelessness: Information regarding episodes of homelessness was not available for 28% of those counted in 2011, however it is worth noting that almost 19% reported having experienced homelessness 4 or more times. (See Exhibit 7) Homeless for the first time: Although the survey did not directly ask respondents if this was their first time homeless, the number of persons counted who indicated they had been homeless for 12 months or less with no previous experience of homeless was 141.
EXHIBIT 9: Episodes of Homelessness
0%
5%
10%
15%
20%
25%
30%
1 week 1 to 3 months
3 to 12 months
1 to 4 years
5 to 9 years
10+ years Not Stated
2011
Once 2 to 3 times 4 or more Not Stated
26.1% 27.2%
18.7%
28.0%
36% 35%
13%15%
% in 2011 % in 2009

Point in Time Count of Persons Experiencing Homelessness: Updated August 2011
Page 26
Health issues
Physical, Mental Illness and Substance Use: Fifty-six percent (543) of adults
counted reported having at least one-type of disabling condition such as a
physical or developmental disability, chronic illness or a substance abuse
problem. Of the 303 single individuals in emergency shelter and transitional
housing, 78% reported having a disabling condition compared to 54% of
unsheltered single individuals. Eleven percent reported suffering from two or
more illnesses or conditions (multiple disabilities) See Exhibit 7. Ten percent
also identified as having a co-occurring condition–mental health issue along
with a substance abuse issue. Health issues are not atypical to the population
experiencing homelessness. Homelessness is a traumatic event which can
cause both physical and psychological difficulties. The lack of medical insurance
and access to housing can exacerbate problems which could much more easily
be managed with housing.
EXHIBIT 10: Health Issues (Adults Only)*
*Responses are not mutually exclusive; respondents were
asked to identify all known health issue.
Martin worked all his
life, in his younger years
as a ski instructor in
Europe moving to Marin
over 30 years ago.
Martin lived on a
houseboat in Sausalito
for many years but as he
grew older he was
unable to work due to
chronic lung and heart
problems. Martin lost his
boat as he was unable to
keep up with the slip fees
living on Social Security.
Life on the street was
hard on Martin with his
numerous health issues,
he grew more and more
frail and fragile shortly
before his death he
found housing through a
permanent supported
housing program in
Marin..
11%
10%
9%
18%
18%
1%
18%
3%
16%
19%
0% 5% 10% 15% 20%
Multiple Disabilities
Co-occurring Conditions
Not Stated
Physical Disability
Mental Illness
HIV
Drug Use
Developmental
Chronic Health Condition
Alcohol Use
Point in Time Count of Persons Experiencing Homelessness: Updated August 2011
Page 27
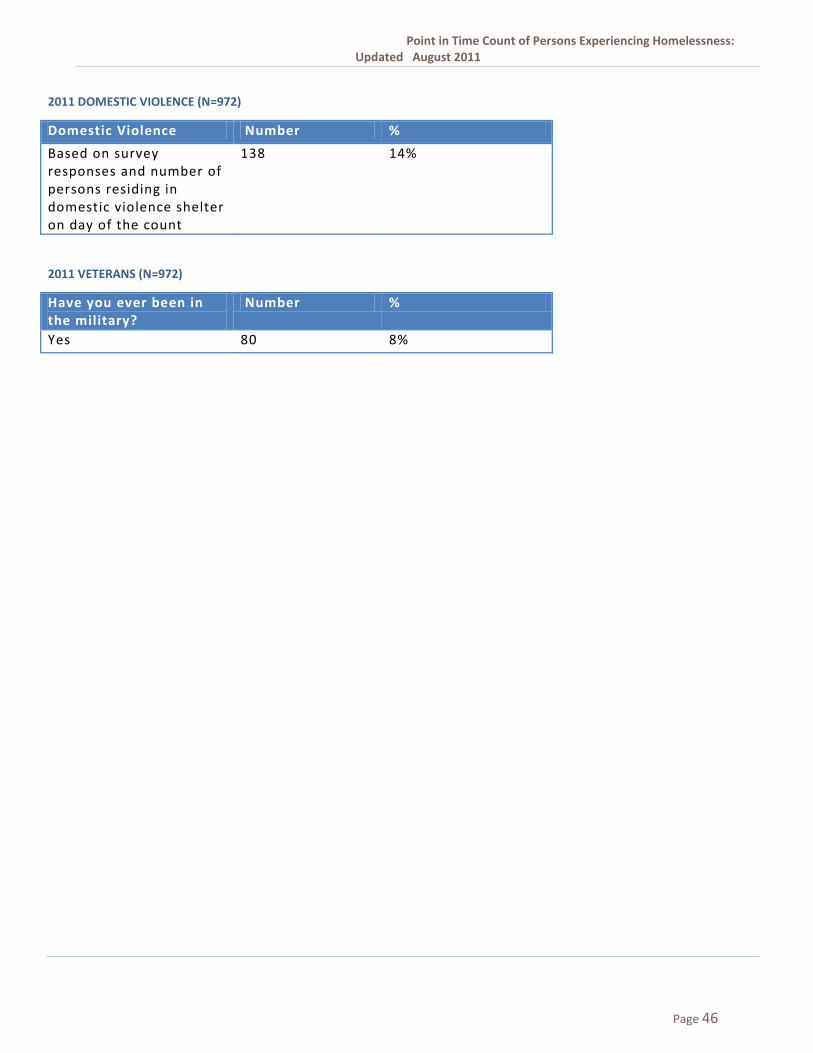
Domestic Violence:
Fourteen percent (138) of adults counted reported experiencing domestic violence, compared to 24% in
2009.
Domestic violence information was collected from two sources, the survey responses and the number of
adults residing in emergency shelter and transitional housing on the day of the count. The change in the
percentage of those experiencing domestic violence from 2009 to 2011 may be attributed to how the
domestic violence question was asked on the survey. In 2009, a separate question for domestic violence was
included on the count survey. In this year’s survey, domestic violence was included as a response under the
health issues question and the reasons for homelessness question. Women in particular who are
experiencing homelessness are more likely to have experienced domestic violence than their housed
counterparts. It is likely that that change in methodology in how domestic violence was captured will have
created a low proportion of persons reporting domestic violence issues.
Point in Time Count of Persons Experiencing Homelessness: Updated August 2011
Page 28
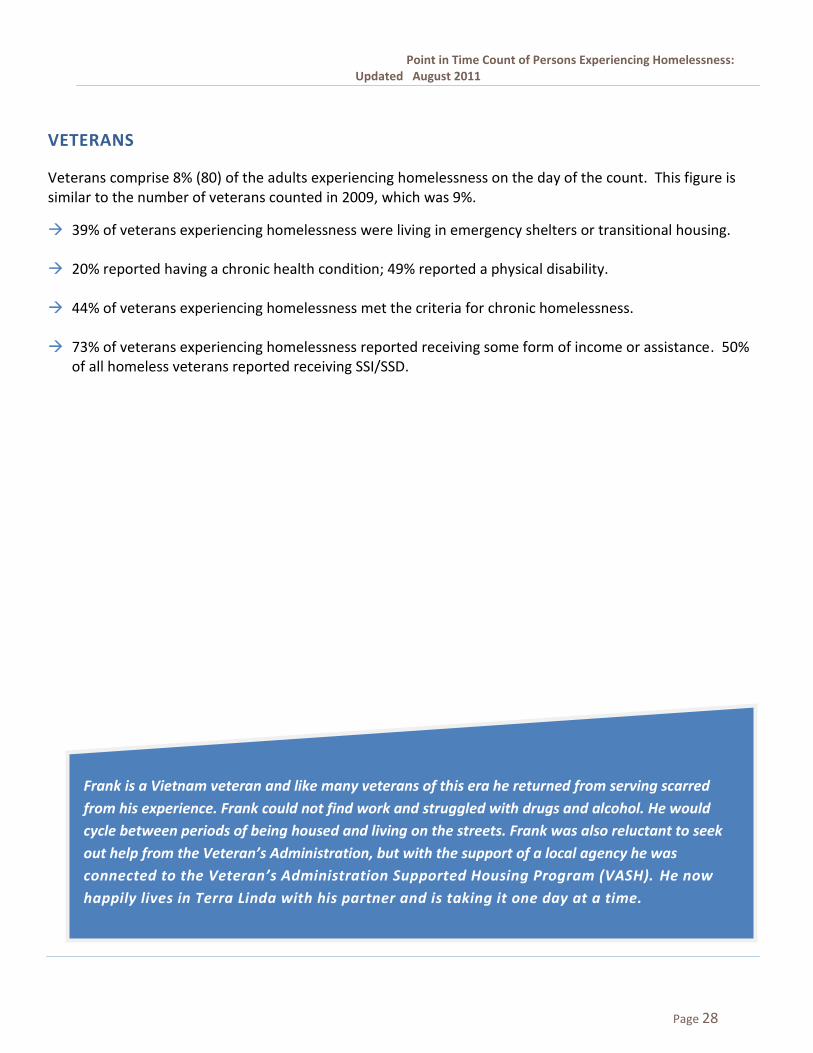
Frank is a Vietnam veteran and like many veterans of this era he returned from serving scarred
from his experience. Frank could not find work and struggled with drugs and alcohol. He would
cycle between periods of being housed and living on the streets. Frank was also reluctant to seek
out help from the Veteran’s Administration, but with the support of a local agency he was
connected to the Veteran’s Administration Supported Housing Program (VASH). He now
happily lives in Terra Linda with his partner and is taking it one day at a time.
VETERANS
Veterans comprise 8% (80) of the adults experiencing homelessness on the day of the count. This figure is similar to the number of veterans counted in 2009, which was 9%.
39% of veterans experiencing homelessness were living in emergency shelters or transitional housing.
20% reported having a chronic health condition; 49% reported a physical disability.
44% of veterans experiencing homelessness met the criteria for chronic homelessness.
73% of veterans experiencing homelessness reported receiving some form of income or assistance. 50% of all homeless veterans reported receiving SSI/SSD.

Point in Time Count of Persons Experiencing Homelessness: Updated August 2011
Page 29
15.0%
5.2%
1.0%
2.6%
0.3%
0.7%
0.3%
0.2%
0.7%
0.3%
1.7%
1.0%
14.5%
0.3%
0.7%
2.4%
0.2%
1.0%
0.5%
44.8%
5.2%
0.2%
0.3%
0.2%
0.3%
Not Stated
Bolinas
Corte Madera
Fairfax
Forest Knolls
Greenbrae
Inverness
Kentfield
Langunitas
Larkspur
Marin City
Mill Valley
Novato
Olema
Out of area
Pt Reyes
Ross
San Anselmo
San Geronimo
San Rafael
Sausalito
Stinson
Tiburon
West Marin
Woodacre
JURISDICTIONAL DATA
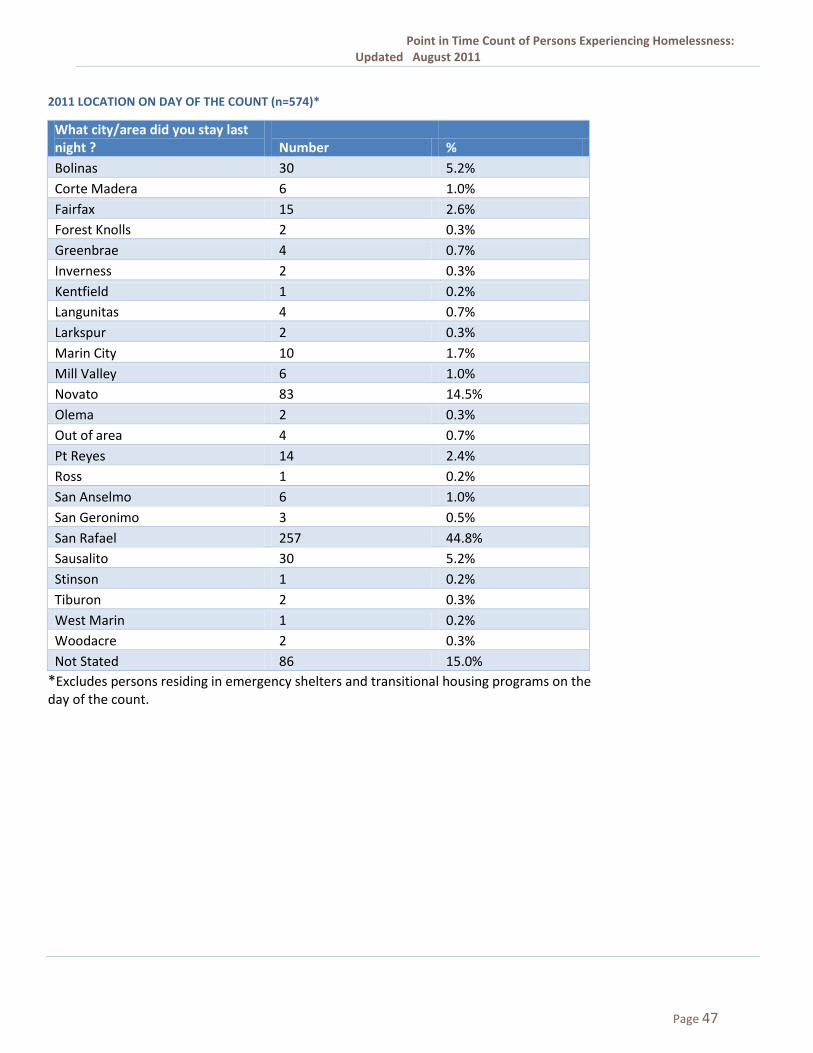
Location on the day of the Count: Approximately 45% of the unsheltered or other homeless populations
were located in San Rafael and 14% in Novato. Many people who become homeless are reluctant to leave
the area in which they became homeless. This is particularly true of older adults and families; many have
connections to the area such as family and friends. Often the thought of being homeless in an unfamiliar
area is overwhelming and many feel they will have a better chance of getting back on their feet if they stay
closer to the community in which they were previously housed.
EXHIBIT 11: 2011 Location of Adults (excludes those residing in emergency shelters or transitional housing)

Point in Time Count of Persons Experiencing Homelessness: Updated August 2011
Page 30
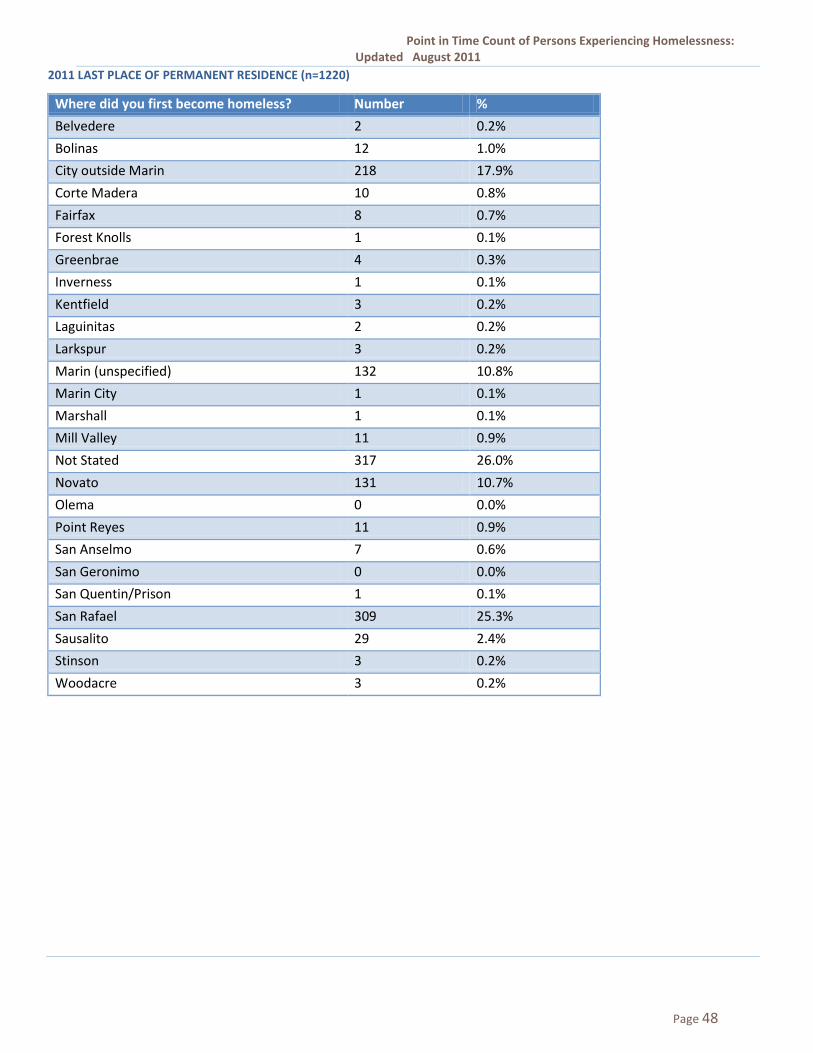
Last Permanent Residence: Over half (56%) of those counted were Marin residents prior to becoming
homeless.
EXHIBIT 12: Place of last permanent residence
0.0% 5.0% 10.0% 15.0% 20.0% 25.0% 30.0%
Belvedere
Bolinas
City outside Marin
Corte Madera
Fairfax
Forest Knolls
Greenbrae
Inverness
Kentfield
Lagunitas
Larkspur
Marin (unspecified)
Marin City
Marshall
Mill Valley
Not Stated
Novato
Olema
Point Reyes
San Anselmo
San Geronimo
San Quentin/Prison
San Rafael
Sausalito
Stinson
Woodacre
% in 2009
% in 2011

Point in Time Count of Persons Experiencing Homelessness: Updated August 2011
Page 31
INCOME AND BENEFITS
Income and government assistance received: In 2011, 60% of adults reported receiving some source of
income or assistance. In 2009, 66% reported receiving some source of income or assistance. In 2011 more
adults stated they were receiving CMSP (health benefits) and Food Stamps (food assistance). Over the past
two years concerted efforts have been made to increase access to these public assistance programs.
EXHIBIT 13: Income and Government Assistance
0%
5%
10%
15%
20%
25%
30%
CashFood
StampsUnemployment
SSI/SSD CMSPVet.
BenefitsMedi CAL
General Assist.
No Income
Not Stated
Pension TANF
2011 13% 24% 4% 21% 15% 1% 11% 9% 13% 26% 0% 3%
2009 22% 2% 3% 19% 0% 1% 0% 9% 21% 14% 2% 5%
2011
2009
Point in Time Count of Persons Experiencing Homelessness: Updated August 2011
Page 32
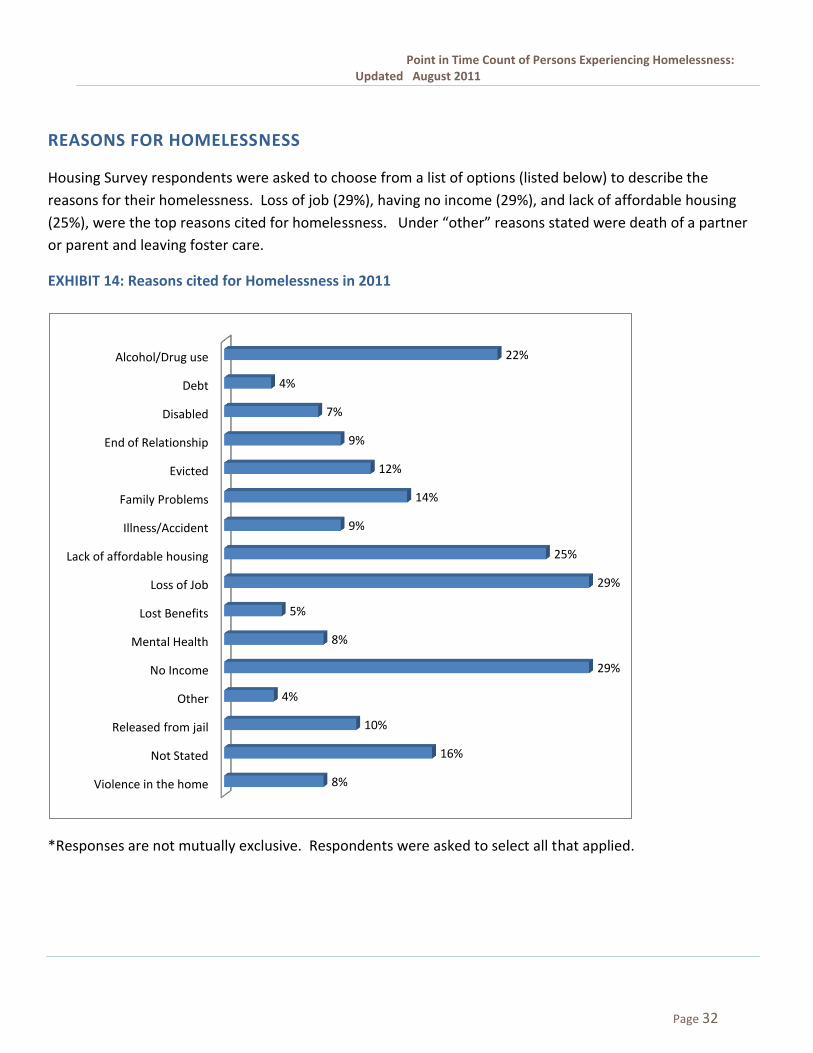
REASONS FOR HOMELESSNESS
Housing Survey respondents were asked to choose from a list of options (listed below) to describe the
reasons for their homelessness. Loss of job (29%), having no income (29%), and lack of affordable housing
(25%), were the top reasons cited for homelessness. Under “other” reasons stated were death of a partner
or parent and leaving foster care.
EXHIBIT 14: Reasons cited for Homelessness in 2011
*Responses are not mutually exclusive. Respondents were asked to select all that applied.
Violence in the home
Not Stated
Released from jail
Other
No Income
Mental Health
Lost Benefits
Loss of Job
Lack of affordable housing
Illness/Accident
Family Problems
Evicted
End of Relationship
Disabled
Debt
Alcohol/Drug use
8%
16%
10%
4%
29%
8%
5%
29%
25%
9%
14%
12%
9%
7%
4%
22%
Point in Time Count of Persons Experiencing Homelessness: Updated August 2011
Page 33
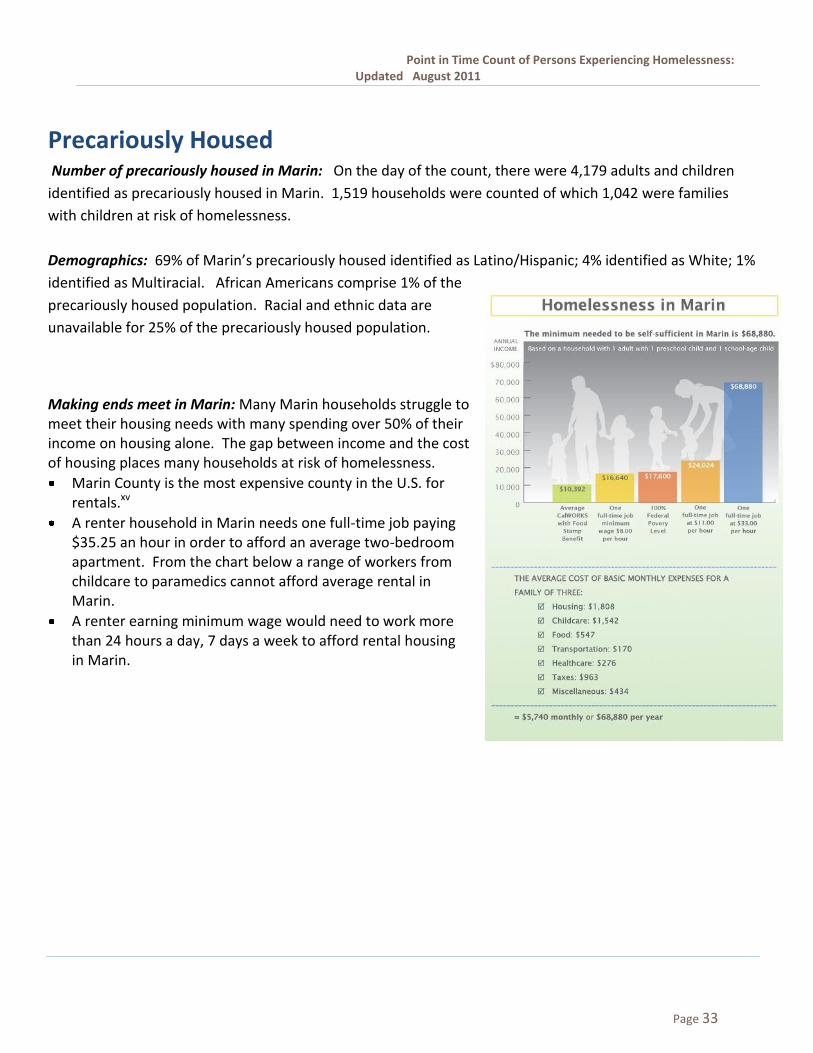
Precariously Housed Number of precariously housed in Marin: On the day of the count, there were 4,179 adults and children
identified as precariously housed in Marin. 1,519 households were counted of which 1,042 were families
with children at risk of homelessness.
Demographics: 69% of Marin’s precariously housed identified as Latino/Hispanic; 4% identified as White; 1%
identified as Multiracial. African Americans comprise 1% of the
precariously housed population. Racial and ethnic data are
unavailable for 25% of the precariously housed population.
Making ends meet in Marin: Many Marin households struggle to meet their housing needs with many spending over 50% of their income on housing alone. The gap between income and the cost of housing places many households at risk of homelessness.
Marin County is the most expensive county in the U.S. for rentals.xv
A renter household in Marin needs one full-time job paying $35.25 an hour in order to afford an average two-bedroom apartment. From the chart below a range of workers from childcare to paramedics cannot afford average rental in Marin.
A renter earning minimum wage would need to work more than 24 hours a day, 7 days a week to afford rental housing in Marin.

Point in Time Count of Persons Experiencing Homelessness: Updated August 2011
Page 34
Precariously Housed Precariously Housed Count by City/Location: The following table provides the number of people identified as precariously housed by city or location. It should be noted the Point-in-Time Count is primarily focused on homeless populations the number of persons captured in the count represent only a fraction of those individuals and families that are experiencing housing instability.
The majority of precariously housed are concentrated in San Rafael there are several factors that may lead to this concentration: o San Rafael has more renter-occupied units than any other city in Marin.xvi o Public transportation within San Rafael is more accessible than most areas in the
County. o San Rafael although similar in size to Novato has a higher percentage of persons living
below 200% of the Federal Poverty Level. This population represents those at highest risk of homelessness. 28% of San Rafael residents live below 200% of the poverty level compared to 16% in Novato. xvii
EXHIBIT 15: Precariously Housed by City/Location
Belvedere 2 Point Reyes 9
Bolinas 6 Ross 1
Corte Madera 9 San Anselmo 11
Fairfax 14 San Quentin 2
Forest Knolls 8 San Rafael 3286
Greenbrae 7 Sausalito 17
Inverness 1 San Geronimo 7
Larkspur 8 Tiburon 1
Marin City 58 Woodacre 3
Marshall 2 Not Stated 208
Mill Valley 10 Total 4179
Novato 499
Out of County 10

Point in Time Count of Persons Experiencing Homelessness: Updated August 2011
Page 35
EXHIBIT 16: Precariously Housed by Geographic Location
Area 12%
Area 212%
Area 379%
Area 40%
Area 51%
Area 61%
Out of County0%Unknown
5%
Precariously Housed by Geographic Area
Area 1
Area 2
Area 3
Area 4
Area 5
Area 6
Out of County
Unknown
Area 1 BelvedereCorte MaderaMarin CityMill Valley
Area 2Novato Marshall
Area 3San Rafael
Area 4BolinasInvernessPoint Reyes
Area 5FairfaxForest KnollsRossSan AnselmoSan GeronimoWoodacre
Area 6GreenbraeLarkspurSan Quentin

Point in Time Count of Persons Experiencing Homelessness: Updated August 2011
Page 36
PROFILES OF HOMELESSNESS IN MARIN
People Experiencing Homelessness 10 years or more
10% of adults counted on January 27, 2011, indicated they were homeless for at least 10 years or more.
Number of persons experiencing homelessness for at least 10 years: Of those who have experienced
homelessness for 10 years or more, 62 were living in places not meant for human habitation and 17 were in
emergency shelters or living in transitional housing on the day of the Count.
Demographics: The majority (86%) of those experiencing homelessness for at least ten years are male.
Seventy four percent identified as White and the average age was 52.
Health/Medical Conditions: Sixty-two percent reported at least one health issue. Over a third (38%) of this
population reported suffering from mental illness. Sixty-five percent reported suffering from alcohol and
drug use.
Number receiving assistance: Sixty-five out of 93 reported receiving some form of income or government
assistance (70%).
Veterans: 23% (21) of those persons who have been homeless for 10 years or more have served in the
military.
Where did they sleep the night before the count: Most of Marin’s long term homeless are “literally homeless”. 67% slept in a place not meant for human habitation (street, cars, camps).
Place slept night prior to count Number
Motel 1 Car 6 Temp w/Friend 4 Camp 1 Outside 49 Hospital 2 Boat 6 Jail 11 Emergency Shelter 10 Other (storage shed) 3 Total 93

Point in Time Count of Persons Experiencing Homelessness: Updated August 2011
Page 37
Children and Families
Number of families with children experiencing homelessness in Marin: 155 households with children age 18
or under were counted during the one day count (247 children and 174 adults). Two households were
considered literally homeless, living on a boat with no plumbing or electricity.
Demographics: Over one-third (36%) of Marin’s families with children experiencing homelessness identified
as Latino/Hispanic; Blacks comprise 11% of homeless families; 8% identified as White.
Domestic Violence: 34 (22%) of Marin’s homeless households with children indicated they had experienced
domestic violence.
Reasons for homelessness: Most families reported the following reasons for homelessness – lack of
affordable housing, no income/loss of job, alcohol/drug issues, or end of relationship.
Health Issues: Almost half (47%) adults in family households reported having a health issue or disability
within the family.
Income and governmental assistance: 36% reported receiving some source of income or assistance.
Where families stayed the night before the count: Most of Marin’s families experiencing homelessness
reside in shelters or transitional housing programs (84). Many families (58) that
identified as homeless did not disclose where they slept the night prior to the count.
3
8
2
58
70
14
0 10 20 30 40 50 60 70 80
Hotel
Temp w/Friend
Boat
Other places, unspecified
Transitional Housing
Emergency Shelter
Where families stayed night before count?(# of Households)
Point in Time Count of Persons Experiencing Homelessness: Updated August 2011
Page 38
Chronic Homelessness The Department of Housing and Urban Development defines chronic homelessness as applying to a person living in a place not meant for human habitation or in an emergency shelter, with a disabling condition, who has been continuously homeless for one year or more, or had at least 4 episodes of homelessness in the past three years. A “disabling condition” can include a diagnosed physical or mental disability, alcohol or drug addiction, HIV/AIDS, chronic health conditions or a developmental disability. The number of people experiencing chronic homelessness in Marin: 229 (25%) people were identified in
the 2011 count as chronically homeless. In the 2009 count, 141 (11%) people were identified as experiencing
chronic homelessness. The increase in the number of does not necessarily equate to more persons who are
chronically homeless. In 2009 missing data on length of homelessness prevented the Count team from
determining the chronic homeless status of those counted.
Demographics: The average age for this population is forty-nine. Most identify as White (67%) and male
(80%).
Income and Assistance: 68% are receiving some source of income or benefit. 66% of the chronic homeless
reported receiving Supplemental Security Disability Income (SSDI) or Social Security Disability (SSD).
Social Security Disability (SSD)/Security Disability Income (SSDI)
More than half of all chronically homeless in Marin receive SSD/SSDI. To receive SSDI/SSD you must have a
mental or physical impairment which limits your functioning.
An individual who receives Social Security Income can afford to spend as much as $255 per month in rent
based on an average SSI payment of $850 per month. For 151 individuals who are chronically homeless on
SSI their ability to move out of homelessness will be highly dependent on their ability to find a program
which provides a rental subsidy (such as Section 8 or Shelter+Care). With the average cost of a studio
apartment at $1,191, housing is far out of reach for this population with little ability to earn or move toward
self-sufficiency.
Chronically homeless individuals are also often high users of emergency services and shelters, although this population generally represents only 10-15% of those experiencing homelessness they often consume 60% of homeless related resources. xviii

Point in Time Count of Persons Experiencing Homelessness: Updated August 2011
Page 39
CONCLUSION
Since 2009, efforts to reduce the number of persons experiencing homelessness through various initiatives
and housing assistance programs have shown promising results. In a short period of time, a number of
individuals and families experiencing homelessness were moved into permanent housing or were prevented
from becoming homeless through short-term financial support and case management. The impact of the
federal Homelessness Prevention and Rapid Re-Housing Program (HPRP) and Emergency Contingency Fund
(ECF) program funded by the American Recovery and Reinvestment Act (ARRA), offered communities
significant new resources to curb homelessness. This one time fund of $659,000 provided short-term rental
assistance to persons at risk of homelessness and helped move many persons experiencing homelessness
into permanent housing. Many communities who received stimulus funds have reported a marked decrease
in the number of persons experiencing homelessness.
SHELTERED
The count included persons who are residing in an emergency shelter and transitional housing for homeless
persons. Individuals and families who reside in these programs are defined as homeless by HUD as these
programs provide only temporary accommodation.
The programs included in the sheltered count include 174 emergency shelter beds and 393 transitional
housing beds. The inventory of beds is updated every year and reported to HUD, HUD provides strict
guidelines which prohibit beds which are not dedicated solely for the homeless from being included in the
inventory. In keeping with HUD guidelines the inventory was updated in 2010, this resulted in a reduction in
the number of transitional housing beds which could be included as part of the shelter count. As a result the
2011 sheltered count numbers reflect a lower number of persons in shelter. This is not an indication that
there are fewer shelter beds in the County or fewer persons sheltered; the beds continue to exist in Marin
but can no longer be counted as part of the inventory of housing which serves only homeless persons.
It is also important to note that not all programs will have operated at full capacity on the day of the count.
UNSHELTERED AND OTHER SHELTERED HOMELESS POPULATIONS
The number of persons counted as unsheltered or part of other homeless populations has decreased. Much
of this decrease can be attributed to stimulus funded efforts and the opening of permanent housing
programs since the 2009 Count; these measures include:
Fireside Apartments permanent housing project opened providing permanent housing to 10 homeless families and 8 seniors;

Point in Time Count of Persons Experiencing Homelessness: Updated August 2011
Page 40
35 chronically homeless veterans permanently housed through Veteran’s Administration Supported Housing program;
658 homeless adults and children moved into permanent housing under one-time federal Homelessness Prevention and Rapid Re-housing Program (HPRP) stimulus and Emergency Contingency funds (ECF).
An additional 1,522 adults and children at imminent risk of homelessness assisted to prevent homelessness under HPRP and ECF stimulus funded programs.
Although these programs will have helped to move many out of homelessness the number of persons who
are precariously housed has risen significantly representing a growing population at risk of homelessness.
PRECARIOUSLY HOUSED
As noted, this year’s Count indicates a sharp increase in the number of people precariously housed. This
population includes those living with friends/family due to economic reasons with no means of accessing
permanent housing, many with limited income or who have experienced job loss, reduction in wages and
lack access to affordable housing options. These, along with other factors - expected cuts to state funded
safety net programs -- SSI, CalWORKS others -- along with the expiration of federal stimulus funding – could
pose obstacles to continuing to reduce the number of people experiencing homelessness in Marin.
TOTAL COUNT
For 2011, the combined total of persons counted was 5,323; this is inclusive of the sheltered, unsheltered, other sheltered homeless and precariously housed population. Historically, count totals were reported in this manner. The Point-in-Time Count is only a one-day snap shot into homelessness in Marin. However this one-day provides valuable insight into the needs and demographics of the population experiencing homelessness and those at risk. What we know from this count: • The gap between rent and income is forcing many into homelessness. This group represents those
persons who have been homeless for less than a year or more. • Marin has a core group of chronically homeless individuals who have been homeless continuously for
several years–many who have been homeless for over a decade. This group is unlikely to move out of homelessness without the support of subsidized housing (due to disability and chronic health needs). Without housing assistance for this population this group will continue to spend more years living on the streets and in shelters.
• Families living below self-sufficiency in Marin are at considerable risk of homelessness. Families from minority populations are disproportionally impacted.
• The lack of affordable housing continues to be the leading stressor pushing families and individuals into homelessness.
• The “literally homeless” struggle with multiple health issues and long-term disabling conditions. The impact of this will require more concerted efforts to link persons experiencing homelessness to mainstream programs such as CMSP and SSI.

Point in Time Count of Persons Experiencing Homelessness: Updated August 2011
Page 41
• Prevention services can work. Stimulus programs have had an impact on the Count findings. Despite this funding the population at risk continues to grow.
• Rapid Rehousing- moving persons out of homelessness quickly- can be effective for stabilizing
chronically homeless and families. The program helped move many individuals and families into permanent housing with a small investment with an on average onetime cost of $1,519 per household.
Our challenge is to use this information to develop strategies to address the needs of the population. The Count shows that the population experiencing homelessness is not a homogenous group and not one strategy or solution will fit the needs of this diverse group. To address homelessness the County, housing and service providers, the faith community, local jurisdictions and greater community need to work together to design approaches to help move persons out of homelessness and ensure the thousands of families and individuals who are at risk of homelessness are able to remain housed.
Point in Time Count of Persons Experiencing Homelessness: Updated August 2011
Page 42
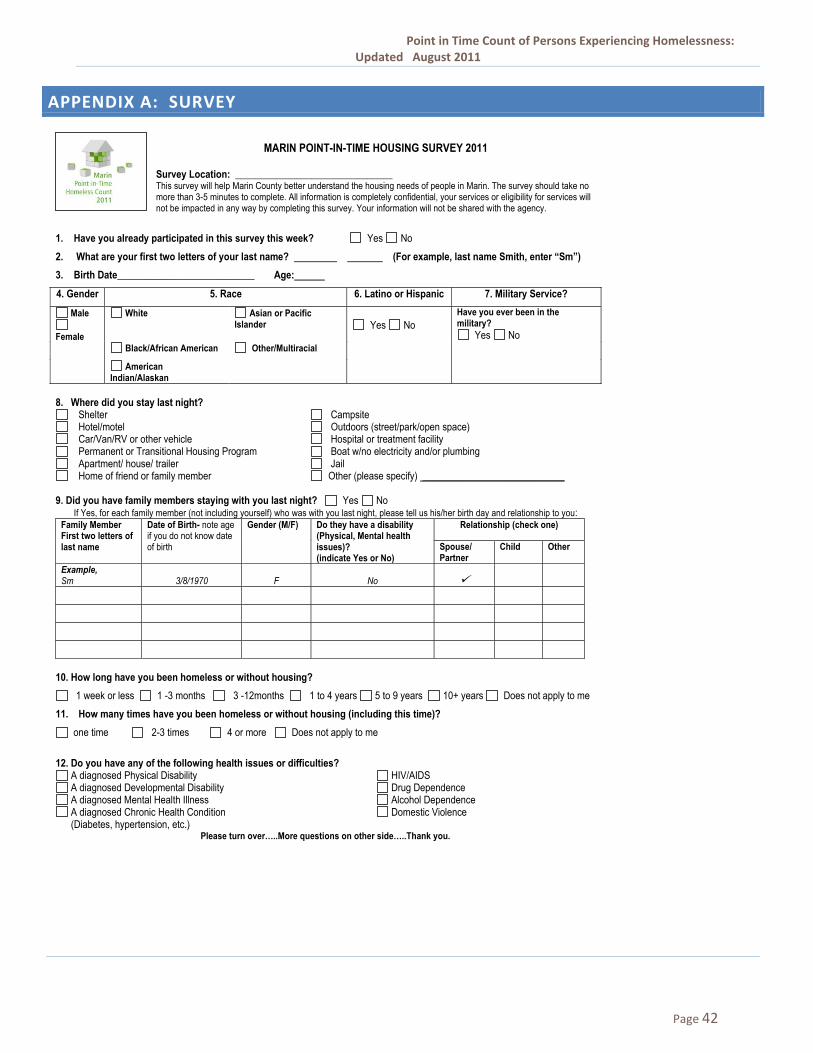
APPENDIX A: SURVEY
MARIN POINT-IN-TIME HOUSING SURVEY 2011
Survey Location: _______________________________ This survey will help Marin County better understand the housing needs of people in Marin. The survey should take no more than 3-5 minutes to complete. All information is completely confidential, your services or eligibility for services will not be impacted in any way by completing this survey. Your information will not be shared with the agency.
1. Have you already participated in this survey this week? Yes No
2. What are your first two letters of your last name? (For example, last name Smith, enter “Sm”)
3. Birth Date___________________________ Age:
4. Gender 5. Race 6. Latino or Hispanic 7. Military Service?
Male
Female
White
Asian or Pacific Islander
Yes No
Have you ever been in the military?
Yes No
Black/African American Other/Multiracial
American Indian/Alaskan
8. Where did you stay last night?
Shelter Campsite Hotel/motel Outdoors (street/park/open space) Car/Van/RV or other vehicle Hospital or treatment facility Permanent or Transitional Housing Program Boat w/no electricity and/or plumbing Apartment/ house/ trailer Jail Home of friend or family member Other (please specify) ____________________________
9. Did you have family members staying with you last night? Yes No
If Yes, for each family member (not including yourself) who was with you last night, please tell us his/her birth day and relationship to you: Family Member First two letters of last name
Date of Birth- note age if you do not know date of birth
Gender (M/F) Do they have a disability (Physical, Mental health issues)? (indicate Yes or No)
Relationship (check one)
Spouse/ Partner
Child Other
Example, Sm 3/8/1970 F No
10. How long have you been homeless or without housing?
1 week or less 1 -3 months 3 -12months 1 to 4 years 5 to 9 years 10+ years Does not apply to me
11. How many times have you been homeless or without housing (including this time)?
one time 2-3 times 4 or more Does not apply to me
12. Do you have any of the following health issues or difficulties?
A diagnosed Physical Disability A diagnosed Developmental Disability A diagnosed Mental Health Illness A diagnosed Chronic Health Condition
(Diabetes, hypertension, etc.)
HIV/AIDS Drug Dependence Alcohol Dependence Domestic Violence
Please turn over…..More questions on other side…..Thank you.

Point in Time Count of Persons Experiencing Homelessness: Updated August 2011
Page 43
13. Which best describes you housing situation right now. (Check only one)
I currently live in a shelter, transitional housing program, campsite, car, boat w/no plumbing/electricity or other place not normally meant for human habitation.
I am housed but I am about to lose my housing due any of the following reasons: eviction, lack of money, being forced out of my current housing and have no other place to live.
I am housed and living temporarily with friends or family because I lack the resources or support networks to retain or obtain permanent housing.
I am housed but have moved frequently due to economic reasons, or living in the home of a friend/family member due to economic hardship, and/or I am living in severely overcrowded housing.
I am stably housed and not at risk of losing my housing.
14. In what city/area did you stay last night? Belvedere Bolinas Corte Madera Dillon Beach Fairfax Forest Knolls Greenbrae Inverness Lagunitas
Larkspur Marin City Marshall Mill Valley Nicaso Novato Olema Pt. Reyes Ross
San Anselmo San Geronimo San Rafael Sausalito Tiburon Tomales Woodacre Out of County Don’t know
15. Where did you first become homeless? Marin County If in Marin, what city or zip code? ____________________ Outside of Marin Don’t Know Does not apply to me 16. What are some of the reasons why you are or (were) homeless? Check all that apply.
Lost job Lack affordable housing Lost benefits Disabled Evicted Alcohol/drug use Violence in the home Debt No income End of Relationship Released from jail/institution Mental Health Illness/Accident Family Problems Other . Does not apply to me
17. Do you receive any of the following income or benefits? (Read choices and check all that apply)
Cash received from work (full time, seasonal, part time etc.) Food Stamps Unemployment Supplemental Security Income (SSI) Social Security Disability County Medical Services Program (CMSP)
Retirement/Pension from former job TANF/CalWorks Veterans Pension MediCal General Assistance No income or benefits
THANK YOU FOR YOUR TIME.
For internal use only: Agency Code: Date of survey:

Point in Time Count of Persons Experiencing Homelessness: Updated August 2011
Page 44
APPENDIX B: DATA BOOK
2011 AGE (n=1220)
Age Number %
Unknown adults 73 6.0%
Unknown children 77 6.3%
62 and older 60 4.9%
51-61 227 18.6%
31-50 440 36.1%
18-30 172 14.1%
13-17 24 2.0%
6-12 54 4.4%
1-5 82 6.7%
Under 1 11 0.9%
2011 GENDER (n=1220)
Gender Number %
Male 708 58.0% Female 380 31.1% Transgender 1 0.1% Not Stated 131 10.7%
2011 RACE AND ETHNICITY (n=1220)
Race Number %
White 527 43%
Black 166 14%
American Indian 18 2%
Asian 39 3%
Latino/Hispanic 220 18%
Multi/Other 89 7%
Not Stated 161 13%

Point in Time Count of Persons Experiencing Homelessness: Updated August 2011
Page 45
2011 LENGTH OF HOMELESSNESS (n=972)
How long have you been homeless or without housing? Number %
1 week 16 2%
1 to 3 months 130 13% 3 to 12 months 209 21%
1 to 4 years 272 28%
5 to 9 91 9%
10+ 93 10%
Not Stated 161 17%
2011 EPISODES OF HOMELESSNESS (N=972)
How many times have you been homeless or without housing? Number % Once 254 26.1%
2 to 3 times 264 27.2%
4 or more 182 18.7%
Not Stated 272 28.0%
2011 HEALTH ISSUES (n=972) Responses not mutually exclusive
Do you have any of the following health issues?
Number %
Physical Disability 220 18%
Not Stated 112 9%
Multiple Disabilities 140 11%
Mental Illness 216 18%
HIV 16 1%
Drug Use 215 18%
Developmental 36 3%
Co-occurring 119 10%
Chronic Health Condition 196 16%
Alcohol Use 228 19%
Point in Time Count of Persons Experiencing Homelessness: Updated August 2011
Page 46
2011 DOMESTIC VIOLENCE (N=972)
Domestic Violence Number %
Based on survey responses and number of persons residing in domestic violence shelter on day of the count
138 14%
2011 VETERANS (N=972)
Have you ever been in the military?
Number %
Yes 80 8%
Point in Time Count of Persons Experiencing Homelessness: Updated August 2011
Page 47
2011 LOCATION ON DAY OF THE COUNT (n=574)*
What city/area did you stay last night ? Number %
Bolinas 30 5.2%
Corte Madera 6 1.0%
Fairfax 15 2.6%
Forest Knolls 2 0.3%
Greenbrae 4 0.7%
Inverness 2 0.3%
Kentfield 1 0.2%
Langunitas 4 0.7%
Larkspur 2 0.3%
Marin City 10 1.7%
Mill Valley 6 1.0%
Novato 83 14.5%
Olema 2 0.3%
Out of area 4 0.7%
Pt Reyes 14 2.4%
Ross 1 0.2%
San Anselmo 6 1.0%
San Geronimo 3 0.5%
San Rafael 257 44.8%
Sausalito 30 5.2%
Stinson 1 0.2%
Tiburon 2 0.3%
West Marin 1 0.2%
Woodacre 2 0.3%
Not Stated 86 15.0% *Excludes persons residing in emergency shelters and transitional housing programs on the day of the count.
Point in Time Count of Persons Experiencing Homelessness: Updated August 2011
Page 48
2011 LAST PLACE OF PERMANENT RESIDENCE (n=1220)
Where did you first become homeless? Number %
Belvedere 2 0.2%
Bolinas 12 1.0%
City outside Marin 218 17.9%
Corte Madera 10 0.8%
Fairfax 8 0.7%
Forest Knolls 1 0.1%
Greenbrae 4 0.3%
Inverness 1 0.1%
Kentfield 3 0.2%
Laguinitas 2 0.2%
Larkspur 3 0.2%
Marin (unspecified) 132 10.8%
Marin City 1 0.1%
Marshall 1 0.1%
Mill Valley 11 0.9%
Not Stated 317 26.0%
Novato 131 10.7%
Olema 0 0.0%
Point Reyes 11 0.9%
San Anselmo 7 0.6%
San Geronimo 0 0.0%
San Quentin/Prison 1 0.1%
San Rafael 309 25.3%
Sausalito 29 2.4%
Stinson 3 0.2%
Woodacre 3 0.2%

Point in Time Count of Persons Experiencing Homelessness: Updated August 2011
Page 49
2011 INCOME AND BENEFITS (N=972)
Do you receive any following sources of income or benefits?
Number %
Cash 128 13%
Food Stamps 234 24%
Unemployment 36 4%
SSI/SSD 205 21%
CMSP 142 15%
Veteran Pension 7 1%
Medi CAL 107 11%
General Assistance 89 9%
No Income 131 13%
Not Stated 254 26%
Pension 3 0%
TANF 32 3%
2011 REASONS FOR HOMELESSNESS
What are some of the reasons why you are homeless? Number %
Alcohol/Drug use 209 22%
Debt 36 4%
Disabled 72 7%
End of Relationship 89 9%
Evicted 112 12%
Family Problems 140 14%
Illness/Accident 89 9%
Lack of affordable housing 246 25%
Loss of Job 279 29%
Lost Benefits 44 5%
Mental Health 76 8%
No Income 279 29%
Not Stated 159 16%
Other 38 4%
Released from jail 101 10%
Violence in the home 76 8%

Point in Time Count of Persons Experiencing Homelessness: Updated August 2011
Page 50
APPENDIX C: PARTICIPATING AGENCY COUNTS
Agency Homeless Precariously Housed
Catholic Charities CYO 0
Adopt a Family 2 12
Center Point See sheltered
23
San Geronimo Valley Community Center 6 13
Marin Housing Authority 4 23
Novato Youth Center 0 7
Salvation Army 11 33
West Marin Resource Center 0 7
Canal Alliance 1 149
St. Vincent de Paul 94 32
Marin General Hospital / Case Managers 8 13
Ritter Center 103 0
Fair Housing of Marin 0 4
Buckelew Programs-TAY Program 0 1
Community Action Marin - Enterprise Resource Center
2 0
Community Action Marin Asian Advocacy 1 5
Marin City CDC-Enterprises 0 22
Catholic Charities CYO 0 0
Bay Area Community Resources 0 0
Legal Aid of Marin 0 4
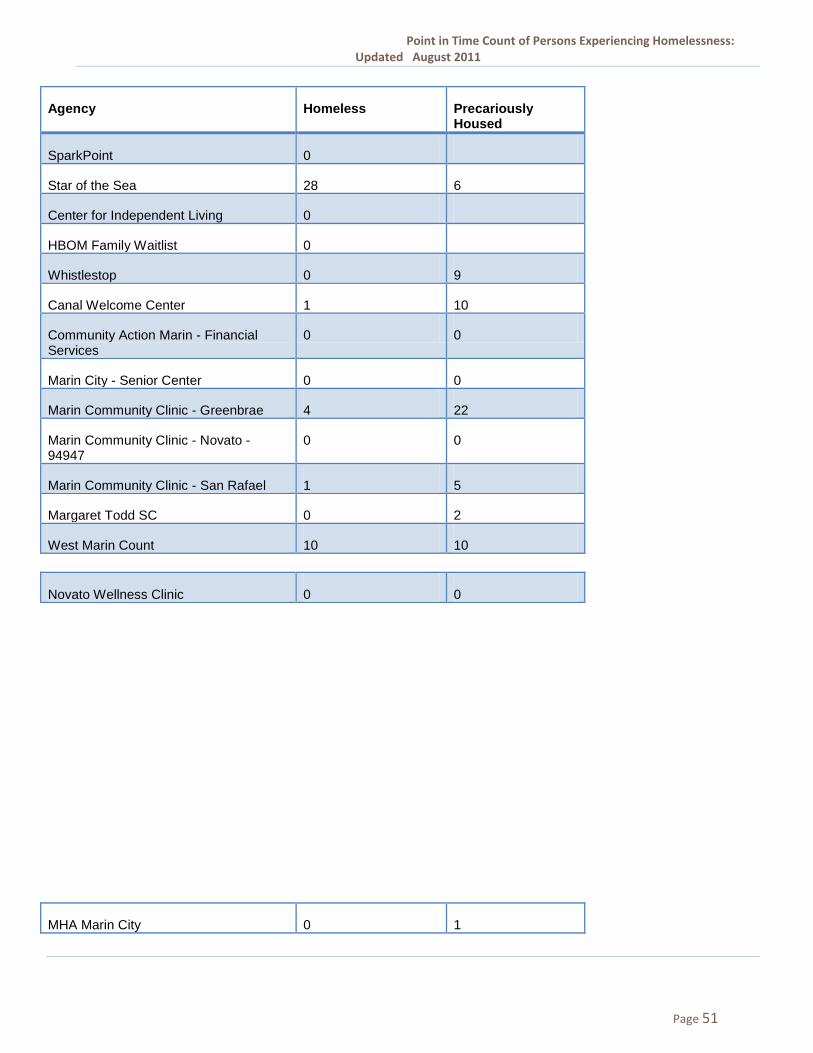
Point in Time Count of Persons Experiencing Homelessness: Updated August 2011
Page 51
Agency Homeless Precariously Housed
SparkPoint 0
Star of the Sea 28 6
Center for Independent Living 0
HBOM Family Waitlist 0
Whistlestop 0 9
Canal Welcome Center 1 10
Community Action Marin - Financial Services
0 0
Marin City - Senior Center 0 0
Marin Community Clinic - Greenbrae 4 22
Marin Community Clinic - Novato - 94947
0 0
Marin Community Clinic - San Rafael 1 5
Margaret Todd SC 0 2
West Marin Count 10 10
MHA Marin City 0 1
Novato Wellness Clinic 0 0
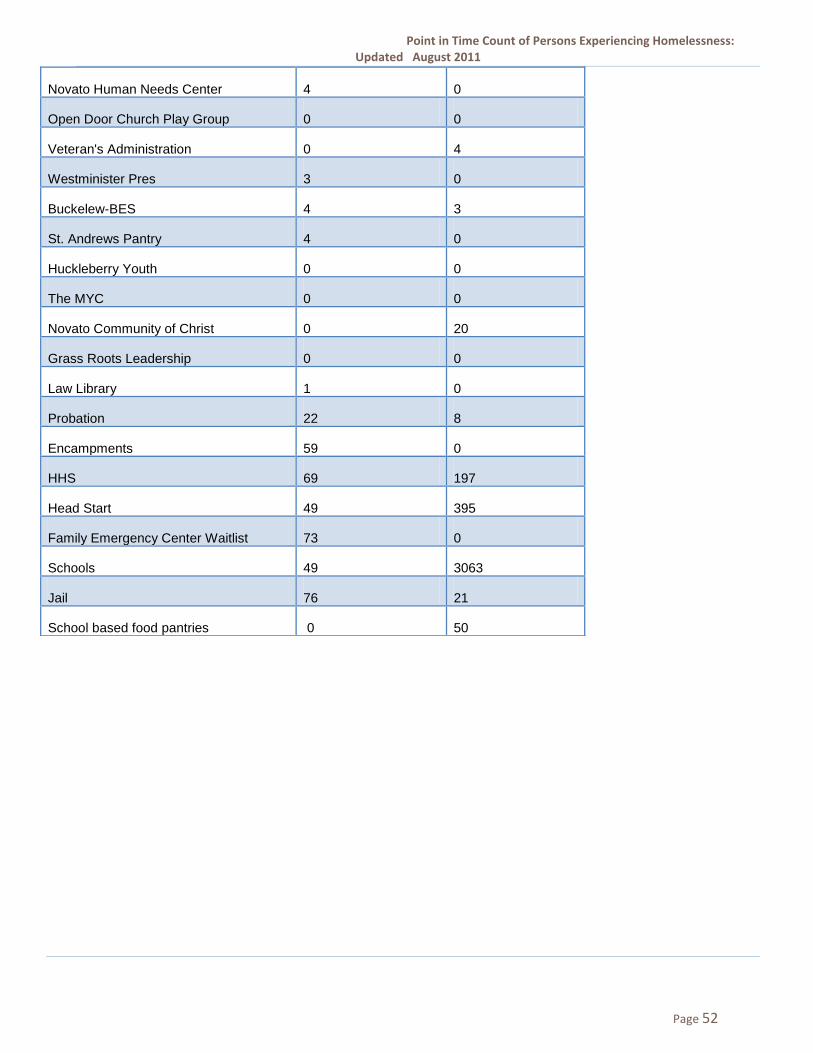
Point in Time Count of Persons Experiencing Homelessness: Updated August 2011
Page 52
Novato Human Needs Center 4 0
Open Door Church Play Group 0 0
Veteran's Administration 0 4
Westminister Pres 3 0
Buckelew-BES 4 3
St. Andrews Pantry 4 0
Huckleberry Youth 0 0
The MYC 0 0
Novato Community of Christ 0 20
Grass Roots Leadership 0 0
Law Library 1 0
Probation 22 8
Encampments 59 0
HHS 69 197
Head Start 49 395
Family Emergency Center Waitlist 73 0
Schools 49 3063
Jail 76 21
School based food pantries 0 50
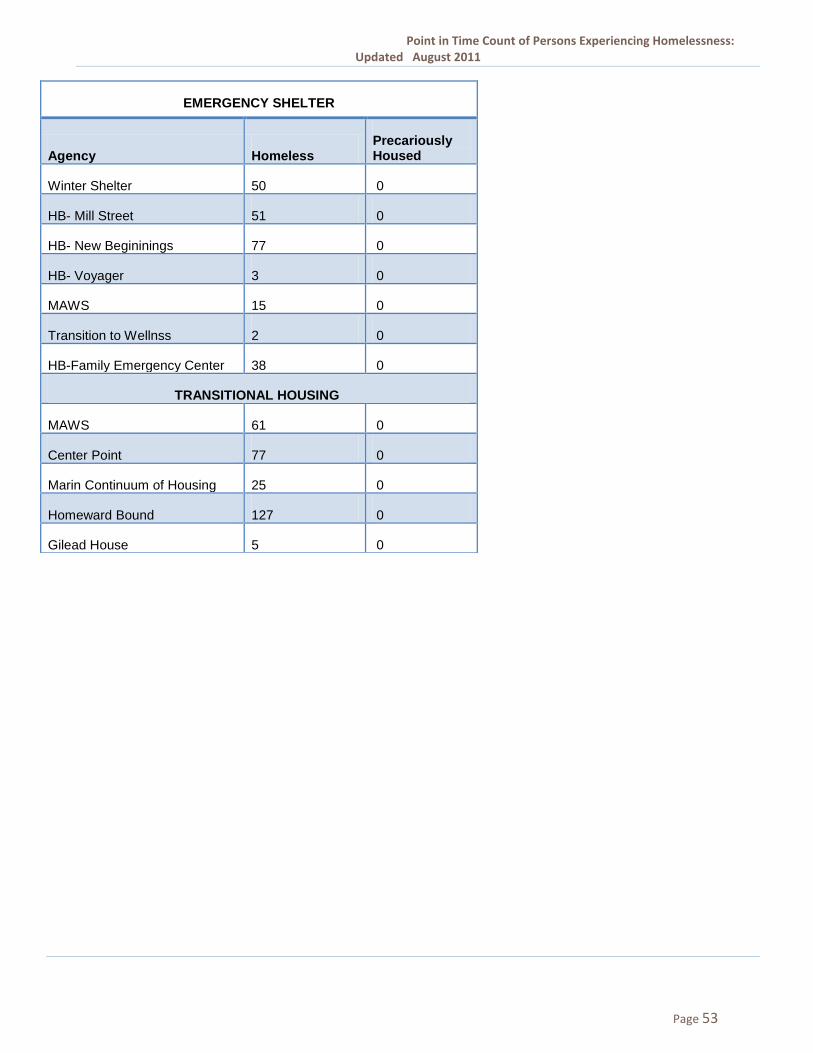
Point in Time Count of Persons Experiencing Homelessness: Updated August 2011
Page 53
EMERGENCY SHELTER
Agency Homeless Precariously Housed
Winter Shelter 50 0
HB- Mill Street 51 0
HB- New Begininings 77 0
HB- Voyager 3 0
MAWS 15 0
Transition to Wellnss 2 0
HB-Family Emergency Center 38 0
TRANSITIONAL HOUSING
MAWS 61 0
Center Point 77 0
Marin Continuum of Housing 25 0
Homeward Bound 127 0
Gilead House 5 0
Point in Time Count of Persons Experiencing Homelessness: Updated August 2011
Page 54
i U.S. Census Bureau. (2005-2009) American Community Survey. S1701 Poverty Status in Last 12 months. Retrieved July 22, 2011, from http://www.census.gov/.
ii Insight: Center for Community Economic Development. (2008). How much is enough in Marin County? www.insightcced.org. Oakland, CA.
iii U.S. Census Bureau. (2005-2009) American Community Survey. S1701 Poverty Status in Last 12 months. Retrieved July 22, 2011, from http://www.census.gov/.
iv Ibid
v National Low Income Housing Coalition (2011) Out of reach 2011, renters await the recovery. vi Department of Housing and Urban Development (2011) FY2011-Final Fair Market Rents for Existing Housing. www.huduser.org/portal/datasets/.../fmr2011f/FY2011F_ScheduleB_rev2.p...
vii National Low Income Housing Coalition (2011) Out of reach 2011, renters await the recovery viii 7 The Housing and Urban-Rural Recovery Act of 1983 made the 30% “rule of thumb” applicable to all current rental housing assistance program.
ix National Low Income Housing Coalition (2011) Out of reach 2011, renters await the recovery
x Ibid
xi Employment Development Department, State of California. http://www.labormarketinfo.edd.ca.gov/?pageid=131
xii Marin County Community Development Agency (2008). Marin County affordable housing inventory. Table Excerpt.
xiv Marin County, 2010, State & County Quick Facts: US Census Bureau. Retrieved June 3, 2011 from
http://www.quickfacts.census.gov
xv National Low Income Housing Coalition (2011) Out of reach 2011: Renters await the recovery.
xvi American Factfinder, San Rafael American Community Survey 2005-2009 estimates retrieved July 21, 2011
xvii Ibid
xviii Culhane, D. (2010) Five myths about America’s homeless. The Washington Post, July 11, 2010.
Top Related