


Languages
Pages
Legal

U.S. Department of the InteriorU.S. Geological Survey
Podiform Chromite Deposits—Database and Grade and Tonnage Models
Scientific Investigations Report 2012–5157

COVERView of the abandoned Chrome Concentrating Company mill, opened in 1917, near the No. 5 chromite mine in Del Puerto Canyon, Stanislaus County, California (USGS photograph by Dan Mosier, 1972). Insets show (upper right) specimen of massive chromite ore from the Pillikin mine, El Dorado County, California, and (lower left) specimen showing disseminated layers of chromite in dunite from the No. 5 mine, Stanislaus County, California (USGS photographs by Dan Mosier, 2012).
Podiform Chromite Deposits—Database and Grade and Tonnage Models
By Dan L. Mosier, Donald A. Singer, Barry C. Moring, and John P. Galloway
Scientific Investigations Report 2012-5157
U.S. Department of the InteriorU.S. Geological Survey

U.S. Department of the InteriorKEN SALAZAR, Secretary
U.S. Geological SurveyMarcia K. McNutt, Director
U.S. Geological Survey, Reston, Virginia: 2012
This report and any updates to it are available online at: http://pubs.usgs.gov/sir/2012/5157/
For more information on the USGS—the Federal source for science about the Earth, its natural and living resources, natural hazards, and the environment—visit http://www.usgs.gov or call 1–888–ASK–USGS
For an overview of USGS information products, including maps, imagery, and publications, visit http://www.usgs.gov/pubprod
To order this and other USGS information products, visit http://store.usgs.gov
Suggested citation: Mosier, D.L., Singer, D.A., Moring, B.C., and Galloway, J.P., 2012, Podiform chromite deposits—database and grade and tonnage models: U.S. Geological Survey Scientific Investigations Report 2012-5157, 45 p. and database.
Any use of trade, product, or firm names is for descriptive purposes only and does not imply endorsement by the U.S. Government.
Although this report is in the public domain, permission must be secured from the individual copyright owners to reproduce any copyrighted material contained within this report.

iii
Contents
Abstract ...........................................................................................................................................................1Introduction.....................................................................................................................................................1Podiform Chromite Deposits ........................................................................................................................2
General Definitions ...............................................................................................................................2Host Rocks and Structure ...................................................................................................................3Morphology ............................................................................................................................................3Ore Textures ...........................................................................................................................................3Mineralogy .............................................................................................................................................4
Orgin .......................................................................................................................................................4Exploration and Exploitation ...............................................................................................................4Ore Types ................................................................................................................................................5
Rules Used ......................................................................................................................................................5Classification of Podiform Chromite Subtypes .........................................................................................9Preliminary Analysis ....................................................................................................................................10
Grade and Tonnage Models ..............................................................................................................10Conclusions...................................................................................................................................................20Explanation of Data Fields ..........................................................................................................................20Location Maps ..............................................................................................................................................22Acknowledgments .......................................................................................................................................34References ....................................................................................................................................................34Appendix A. Summary Statistics For Podiform Chromite Grade-Tonnage Models ..........................40Appendix B. Deposit Model Country Codes and Country Names ........................................................45
Figures 1. World map showing the distribution of podiform chromite deposits used in this study.. .......2 2. Geologic map of the Masinloc mine, Zambales Province, Philippines, showing the chro-
mite ore bodies grouped into chromite deposits based on the 100-meter rule .................7 3. Illustrations of an ophiolite stratigraphic column showing the zones with lithologies and
distribution of podiform chromite ...............................................................................................8 4. Box plots of deposit tonnages by podiform chromite deposit subtypes .................................11 5. Cumulative frequency of ore tonnages of major podiform chromite deposits .......................14 6. Cumulative frequency of chromic oxide grades of major podiform chromite deposits ........14 7. Cumulative frequency plots of rhodium, iridium, ruthenium, palladium, and platinum
grades of major podiform chromite deposits .........................................................................15 8. Cumulative frequency of ore tonnages of minor podiform chromite deposits .......................16 9. Cumulative frequency of chromic oxide grades of minor podiform chromite deposits ........16 10. Cumulative frequency plots of rhodium, iridium, ruthenium, palladium, and platinum
grades of minor podiform chromite deposits .........................................................................17 11. Cumulative frequency of ore tonnages of banded podiform chromite deposits ....................18

iv
12. Cumulative frequency of chromic oxide grades of banded podiform chromite deposits ......................................................................................................18
13. Cumulative frequency plots of rhodium, iridium, ruthenium, palladium, and platinum of banded podiform chromite deposits ........................................................................................19
14. Map showing the distribution of podiform chromite deposit subtypes in Northern California, Oregon, and Washington, U.S.A. ..........................................................................23
15. Map showing the distribution of podiform chromite deposit subtypes in Southern Oregon and Northern California, U.S.A. ............................................................24
16. Map showing the distribution of podiform chromite deposit subtypes in Central California, U.S.A. .........................................................................................................................25
17. Map showing the distribution of podiform chromite deposit subtypes in Pennsylvania, Maryland, North Carolina, and Georgia, U.S.A. .....................................................................26
18. Map showing the distribution of podiform chromite deposit subtypes in Alaska, U.S.A .. .......................................................................................................27
19. Map showing the distribution of podiform chromite deposit subtypes in Quebec, Canada .....................................................................................................................28
20. Map showing the distribution of podiform chromite deposit subtypes in Newfoundland, Canada. ........................................................................................................29
21. Map showing the distribution of podiform chromite deposit subtypes in Cuba ....................30 22. Map showing the distribution of podiform chromite deposit
subtypes in New Caledonia ......................................................................................................31 23. Map showing the distribution of podiform chromite deposit subtypes
in the Philippines. ........................................................................................................................32 24. Map showing the distribution of podiform chromite deposit subtypes
in Greece, Cyprus, and Turkey. .................................................................................................33
Tables 1. Specifications for chromite ore compiled from DeYoung and others (1984), Harben (2004),
and U.S. Business and Defense Services Administration (1962) ..........................................6 2. Podiform chromite deposit subtypes studied in this paper .........................................................10 3. Grade and tonnage models of major podiform, minor podiform, and banded podiform chro-
mite deposits ...............................................................................................................................12 4. Summary of correlations of tonnages and grades grouped by podiform chromite
subtypes .......................................................................................................................................13
Podiform Chromite Deposits—Database and Grade and Tonnage Models
By Dan L. Mosier, Donald A. Singer, Barry C. Moring, and John P. Galloway
Abstract
Chromite ((Mg, Fe++)(Cr, Al, Fe+++)2O4) is the only source for the metallic element chromium, which is used in the metallurgical, chemical, and refractory industries. Podiform chromite deposits are small magmatic chromite bodies formed in the ultramafic section of an ophiolite complex in the oceanic crust. These deposits have been found in midoceanic ridge, off-ridge, and suprasubduction tectonic settings. Most podiform chromite deposits are found in dunite or peridotite near the contact of the cumulate and tectonite zones in ophiolites. We have identified 1,124 individual podiform chromite deposits, based on a 100-meter spatial rule, and have compiled them in a database. Of these, 619 deposits have been used to create three new grade and tonnage models for podiform chromite deposits. The major podiform chromite model has a median tonnage of 11,000 metric tons and a mean grade of 45 percent Cr2O3. The minor podiform chromite model has a median tonnage of 100 metric tons and a mean grade of 43 percent Cr2O3. The banded podiform chromite model has a median tonnage of 650 metric tons and a mean grade of 42 percent Cr2O3. Observed frequency distributions are also given for grades of rhodium, iridium, ruthenium, palladium, and platinum. In resource assessment applications, both major and minor podiform chromite models may be used for any ophiolite complex regardless of its tectonic setting or ophiolite zone. Expected sizes of undiscovered podiform chromite deposits, with respect to degree of deformation or ore-forming process, may deter-mine which model is appropriate. The banded podiform chro-mite model may be applicable for ophiolites in both suprasubduction and midoceanic ridge settings.
IntroductionPodiform chromite deposits are an important source for
chromite, which is the only ore for chromium, and they are the primary source for both high-chromium, low-aluminum ore, used in metallurgical applications, and high-aluminum,
low-chromium ore, used in refractories (Thayer, 1946; Thayer, 1963; Dickey, 1975). Concentrations of chromite as small masses or lenses were first called “pods” by Wells and others (1940) and later referred to as “podiform” by Thayer (1960). These deposits are found in alpine-type peridotites formed in oceanic crust and tectonically emplaced as ophio-lites along continental margins (Thayer, 1960; Coleman, 1971; Roberts and others, 1988; Coleman, 2000). Podiform chromite mines have produced 57.4 percent of the world’s total chromite production (Stowe, 1987b). In 2010, about 25 percent of the world’s chromite production came from podi-form chromite deposits, and this percentage has held for the past 50 years (Papp, 2011; Leblanc, 1987). Podiform chro-mite production has been reported from, in decreasing order of importance: Kazakhstan, Turkey, Philippines, Albania, Yugoslavia, New Caledonia, Cuba, Russia, Iran, Japan, Paki-stan, Sudan, Greece, Canada, United States, Cyprus, Norway, Shetland Islands, and Australia (DeYoung and others, 1984; Stowe, 1987b; Silk, 1988).
Grade and tonnage models are useful in quantitative mineral-resource assessments (Singer and Menzie, 2010). The models and database presented in this report are an update of earlier publications about podiform chromite deposits (Singer and Page, 1986; Singer and others, 1986). These chromite deposits include what were formerly classified as major and minor podiform chromite deposits based on deposit size and regional distribution—that is, minor podiform chromite deposits represent relatively smaller deposits in California and Oregon, and major podiform chromite deposits repre-sent larger deposits in other countries, such as Turkey, Cuba, Philippines, Iran, and New Caledonia. The update is necessary because of new additional information on podiform chromite deposits and their geologic settings. This study also examines the tonnages and grades of podiform chromite deposits in dif-ferent paleotectonic settings and ophiolite zones.
Tonnage and grade data are revised here using a sepa-ration rule of 100 m to define a deposit. Geologic data are compiled in a database with documentation. This global com-pilation of podiform chromite deposits contains 1,124 deposits (fig. 1). It is not our intent to include every known deposit in the world. More importantly, for this study, the regions

2 Podiform Chromite Deposits—Database and Grade and Tonnage Models
selected are considered well studied, with detailed deposit descriptions, maps and sections of ore bodies, and production or reserve data for most of the podiform chromite deposits. In this paper, 619 deposits with reliable tonnages and grades are used to construct revised grade and tonnage models. We present three new models: major podiform chromite, minor podiform chromite, and banded podiform chromite deposits. Our new models are based on a reclassification and testing of deposits with reference to paleotectonic settings, ophiolite positions, and deposit subtypes. The major and minor podi-form chromite tonnage and grade models are not significantly different from those of the original models of Singer and Page (1986) and Singer and others (1986). This report includes a new model for the associated disseminated and banded chro-mite deposits, which hereafter will be referred to as “banded podiform chromite” deposits, not considered in the former studies. The deposit density model for podiform chromite deposits (Singer, 1994) remains applicable for the minor podiform chromite subtype, but deposit density models for the other subtypes have yet to be developed.
The purpose of this publication is to present the latest geologic information and newly developed grade and tonnage models for podiform chromite deposits in digital form. The data are presented in FileMaker Pro and text files to make the information available to a wider audience. Location informa-tion is provided for displaying deposit locations in Google Earth or in geographic information system (GIS) programs.
0
0
1,000
1,000
2,000
2,000
3,000
3,000
4,000 5,000 KILOMETERS
MILES
EXPLANATION
Podiform chromite deposit
165˚W
85˚N
75˚N
65˚N
55˚N
45˚N
35˚N
25˚N
15˚N
5˚N
5˚S
15˚S
25˚S
35˚S
45˚S
55˚S
150˚W 135˚W 120˚W 105˚W 90˚W 75˚W 60˚W 45˚W 30˚W 15˚W 5˚W 5˚E 15˚E 30˚E 45˚E 60˚E 75˚E 90˚E 105˚E 120˚E 135˚E 150˚E 165˚E
Base map from ESRI, 2012. Geographic coordinates. 1:150,000,000.
SOUTH ATLANTICSOUTH PACIFIC
NORTH PACIFICNORTH ATLANTIC
INDIAN OCEAN
ARCTIC OCEANARCTIC OCEAN
A U S T R A L I A
S O U T H A M E R I C A
N O R T HA M E R I CA
A S I AE U R O P EE U R O P E
A F R I C AA F R I C A
Figure 1. World map showing the distribution of podiform chromite deposits (green dots) used in this study. Country outlines shown for reference.
First we discuss the current knowledge of podiform chromite deposits. Second, we discuss the rules used in this compila-tion, because the value of this information and any derived analyses depends critically on the consistent manner of data gathering. Next, we discuss how the podiform chromite deposits were classified into three model subtypes. Then, we provide new grade and tonnage models and analysis of data. Finally, the fields of the database are explained. Appendix A gives the summary statistics for the new grade and tonnage models and appendix B displays the country codes used in the database.
Podiform Chromite Deposits
General Definitions
A mineral deposit is defined as a mineral occurrence of sufficient size and grade that might, under the most favor-able circumstances, be considered to have economic potential (Cox and others, 1986). Deposits sharing a relatively wide variety and large number of attributes are characterized as a “type,” and a model representing that type can be developed.
The mineral chromite ((Mg, Fe++)(Cr, Al, Fe+++)2O4), is a member of the spinel group of minerals and is ubiquitous, constituting about 1 percent, within the ultramafic part of
Podiform Chromite Deposits 3
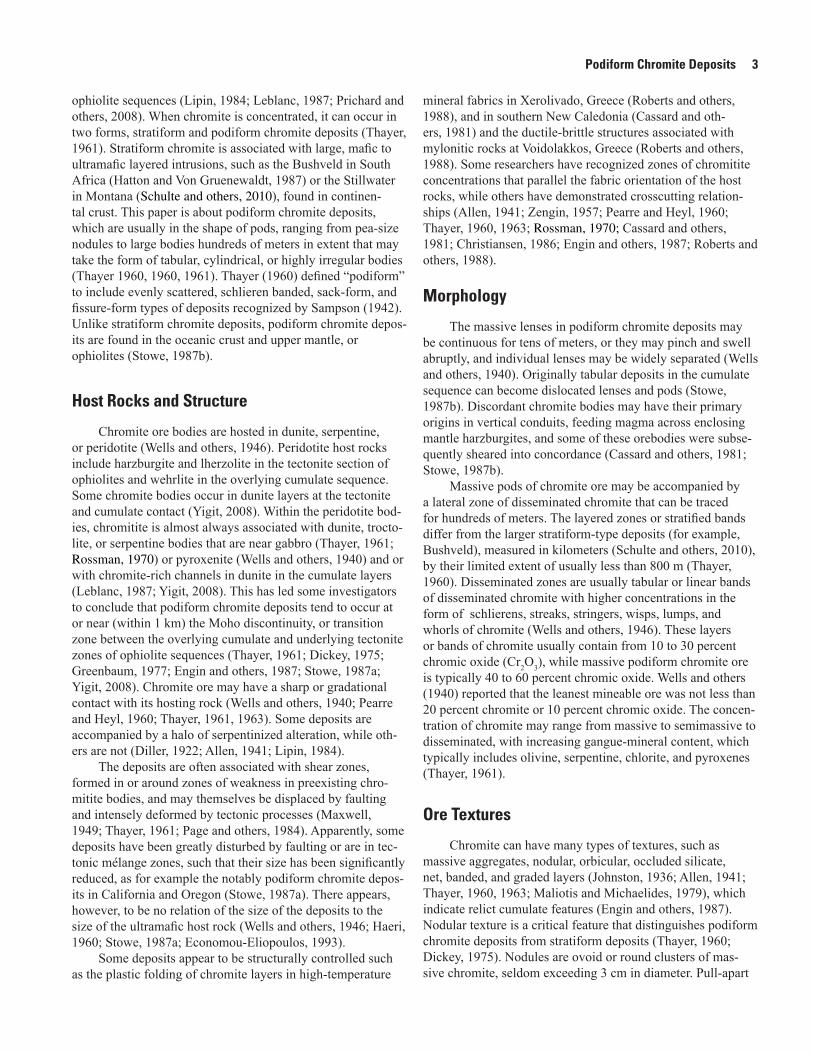
ophiolite sequences (Lipin, 1984; Leblanc, 1987; Prichard and others, 2008). When chromite is concentrated, it can occur in two forms, stratiform and podiform chromite deposits (Thayer, 1961). Stratiform chromite is associated with large, mafic to ultramafic layered intrusions, such as the Bushveld in South Africa (Hatton and Von Gruenewaldt, 1987) or the Stillwater in Montana (Schulte and others, 2010), found in continen-tal crust. This paper is about podiform chromite deposits, which are usually in the shape of pods, ranging from pea-size nodules to large bodies hundreds of meters in extent that may take the form of tabular, cylindrical, or highly irregular bodies (Thayer 1960, 1960, 1961). Thayer (1960) defined “podiform” to include evenly scattered, schlieren banded, sack-form, and fissure-form types of deposits recognized by Sampson (1942). Unlike stratiform chromite deposits, podiform chromite depos-its are found in the oceanic crust and upper mantle, or ophiolites (Stowe, 1987b).
Host Rocks and Structure
Chromite ore bodies are hosted in dunite, serpentine, or peridotite (Wells and others, 1946). Peridotite host rocks include harzburgite and lherzolite in the tectonite section of ophiolites and wehrlite in the overlying cumulate sequence. Some chromite bodies occur in dunite layers at the tectonite and cumulate contact (Yigit, 2008). Within the peridotite bod-ies, chromitite is almost always associated with dunite, trocto-lite, or serpentine bodies that are near gabbro (Thayer, 1961; Rossman, 1970) or pyroxenite (Wells and others, 1940) and or with chromite-rich channels in dunite in the cumulate layers (Leblanc, 1987; Yigit, 2008). This has led some investigators to conclude that podiform chromite deposits tend to occur at or near (within 1 km) the Moho discontinuity, or transition zone between the overlying cumulate and underlying tectonite zones of ophiolite sequences (Thayer, 1961; Dickey, 1975; Greenbaum, 1977; Engin and others, 1987; Stowe, 1987a; Yigit, 2008). Chromite ore may have a sharp or gradational contact with its hosting rock (Wells and others, 1940; Pearre and Heyl, 1960; Thayer, 1961, 1963). Some deposits are accompanied by a halo of serpentinized alteration, while oth-ers are not (Diller, 1922; Allen, 1941; Lipin, 1984).
The deposits are often associated with shear zones, formed in or around zones of weakness in preexisting chro-mitite bodies, and may themselves be displaced by faulting and intensely deformed by tectonic processes (Maxwell, 1949; Thayer, 1961; Page and others, 1984). Apparently, some deposits have been greatly disturbed by faulting or are in tec-tonic mélange zones, such that their size has been significantly reduced, as for example the notably podiform chromite depos-its in California and Oregon (Stowe, 1987a). There appears, however, to be no relation of the size of the deposits to the size of the ultramafic host rock (Wells and others, 1946; Haeri, 1960; Stowe, 1987a; Economou-Eliopoulos, 1993).
Some deposits appear to be structurally controlled such as the plastic folding of chromite layers in high-temperature
mineral fabrics in Xerolivado, Greece (Roberts and others, 1988), and in southern New Caledonia (Cassard and oth-ers, 1981) and the ductile-brittle structures associated with mylonitic rocks at Voidolakkos, Greece (Roberts and others, 1988). Some researchers have recognized zones of chromitite concentrations that parallel the fabric orientation of the host rocks, while others have demonstrated crosscutting relation-ships (Allen, 1941; Zengin, 1957; Pearre and Heyl, 1960; Thayer, 1960, 1963; Rossman, 1970; Cassard and others, 1981; Christiansen, 1986; Engin and others, 1987; Roberts and others, 1988).
Morphology
The massive lenses in podiform chromite deposits may be continuous for tens of meters, or they may pinch and swell abruptly, and individual lenses may be widely separated (Wells and others, 1940). Originally tabular deposits in the cumulate sequence can become dislocated lenses and pods (Stowe, 1987b). Discordant chromite bodies may have their primary origins in vertical conduits, feeding magma across enclosing mantle harzburgites, and some of these orebodies were subse-quently sheared into concordance (Cassard and others, 1981; Stowe, 1987b).
Massive pods of chromite ore may be accompanied by a lateral zone of disseminated chromite that can be traced for hundreds of meters. The layered zones or stratified bands differ from the larger stratiform-type deposits (for example, Bushveld), measured in kilometers (Schulte and others, 2010), by their limited extent of usually less than 800 m (Thayer, 1960). Disseminated zones are usually tabular or linear bands of disseminated chromite with higher concentrations in the form of schlierens, streaks, stringers, wisps, lumps, and whorls of chromite (Wells and others, 1946). These layers or bands of chromite usually contain from 10 to 30 percent chromic oxide (Cr2O3), while massive podiform chromite ore is typically 40 to 60 percent chromic oxide. Wells and others (1940) reported that the leanest mineable ore was not less than 20 percent chromite or 10 percent chromic oxide. The concen-tration of chromite may range from massive to semimassive to disseminated, with increasing gangue-mineral content, which typically includes olivine, serpentine, chlorite, and pyroxenes (Thayer, 1961).
Ore Textures
Chromite can have many types of textures, such as massive aggregates, nodular, orbicular, occluded silicate, net, banded, and graded layers (Johnston, 1936; Allen, 1941; Thayer, 1960, 1963; Maliotis and Michaelides, 1979), which indicate relict cumulate features (Engin and others, 1987). Nodular texture is a critical feature that distinguishes podiform chromite deposits from stratiform deposits (Thayer, 1960; Dickey, 1975). Nodules are ovoid or round clusters of mas-sive chromite, seldom exceeding 3 cm in diameter. Pull-apart

4 Podiform Chromite Deposits—Database and Grade and Tonnage Models
textures seen in some deposits indicate that the chromite was subjected to tensional forces during plastic deformation (Engin and others, 1987).
Mineralogy
Chromite crystals vary from anhedral to euhedral, but most are anhedral, and they range in size from less than 1 mm to as much as 10 mm in diameter (Thayer, 1963). Miner-als associated with chromite include olivine, pyroxene, ser-pentine, magnetite, ferrochromite, chlorite, talc, magnesite, uvarovite, kammererite, and others (Allen, 1941; Thayer, 1961). Interstitial nickel and copper base-metal sulfides and alloys may also be present as millerite (NiS), pentlandite ((Ni,Fe)9S8), heazlewoodite (Ni3S2), godlevskite ((Ni,Fe)7S6), awaruite (Ni2-3Fe), native copper, polydymite ((Ni,Fe,Co,Cu)Ni2S4), bornite (Cu5FeS4), digenite (Cu9S5), and others (Page and others, 1984; Akbulut and others, 2010; Uysal and oth-ers, 2009).
Ophiolite chromitite is usually enriched in osmium (Os), iridium (Ir), and ruthenium (Ru), but it can also be enriched in platinum (Pt), palladium (Pd), and rhodium (Rh), as was reported at Al ‘Ays in Saudi Arabia, with maximum values of 2,570 ppb Pt, 6,870 ppb Pd, 840 ppb Rh, 5,800 Ru, 6,200 ppb Ir, and 3,300 ppb Os (Prichard and others, 2008). Platinum group minerals include Os, Ir, and Ru alloys, laurite (Ru(Ir, Os)S2), erlichmanite (OsS2), irarsite (IrAsS), hollingworthite (RhAsS), and Pt-, Pd-, and Rh-bearing minerals, such as isoferroplatinum (Pt3Fe), cooperite (PtS), sperrylite (PtAs2), geversite (PtSb2), hongshiite (PtCu), stibiopalladinite (Pd5Sb2), native Pd, and others (Page and others, 1984; Prichard and others, 2008; Akbulut and others, 2010).
Origin
The origin of podiform chromite deposits has been controversial. Most investigators, however, agree that they are formed in alpine ultramafic rocks or ophiolites in the oceanic crust, which are differentiated from the ultramafic layered complexes in continental crust found at Bushveld, South Africa, and Stillwater, Montana (Thayer, 1960; Lipin, 1984). Various hypotheses on chromite formation have been suggested, such as partial melting and remobilization of rocks differentiated at depth by fractional crystallization (Thayer, 1961; Dickey, 1975); multiple injections in differentiated magma (Zengin, 1957); late emplacement in the magmatic cycle, after partial consolidation of the rock and contem-poraneous with the early deuteric activity of the magma (Allen, 1941); emplacement in residual mantle (harzburgite and dunite) after extensive extraction of melt from their mantle host (Uysal and others, 2009); cumulate filling of a magma conduit inside the residual mantle (Lago and oth-ers, 1982); infolding in the underlying harzburgite from the overlying cumulate sequence (Greenbaum, 1977); forma-tion with dunites in the magma segregation zone along the
tectonite-cumulate boundary and sinking of chromite crystals and pods from the magma segregation zone into the underly-ing harzburgite (Dickey, 1975); and multistage melting, melt/rock, or melt/melt interaction, such as magma-mixing (Pak-tunc, 1990; Uysal and others, 2009). Platinum group elements (PGE) and chalcophile elements may provide evidence for discrimination between chromite ores derived from primitive magmas (low Pd/Ir, high Ni/Cu ratios) and those derived from partially fractionated magmas (high Pd/Ir, low Ni/Cu ratios) (Economou-Eliopoulos, 1996).
Exploration and Exploitation
Exploration for podiform chromite deposits has been a challenge because of the unpredictable nature of their occur-rence. In most locations, the podiform chromite deposits appear to be randomly distributed within the ultramafic rocks, which makes for difficult exploration. Although podiform chromite deposits are associated with dunite bodies, not all dunites contain podiform chromite deposits, and dunite bodies themselves appear to be randomly distributed in the peridotite (Wells and others, 1946). Recognition that podiform chromite deposits tend to occur at or near (within 1 km) the Moho dis-continuity, or transition zone between the overlying cumulate and underlying tectonite zones of ophiolite sequences, narrows the geologic target (Thayer, 1961; Dickey, 1975; Greenbaum, 1977; Engin and others, 1987; Stowe, 1987a; Yigit, 2008). Recognition of these zones, however, is not always clear, especially in tectonic mélange zones (Kaaden, 1959; Choi and others, 2008).
In regions in which exploration for podiform chromite deposits has been thorough, most of the deposits at or near the surface have been found (Wells and others, 1946). Because of their relative resistance to erosion, podiform chromite deposits can often be found protruding from less resistant host rocks in outcrops, which facilitates their ease of location on the surface (Wells and others, 1946). The shallow deposits are commonly mined by open pits or quarries and the deeper extensions by underground workings. Highly eroded deposits may be accom-panied by placer chromite concentrations in nearby streams or coastal beach sands that may be of economic interest (Wells and others, 1940; Maxwell, 1949; Pearre and Heyl, 1960; Thayer and Ramp, 1969; Jordt, 1984).
When developed, the deposits are quickly mined out, and exploration drilling around these deposits has had limited success. In California, it was not economical to drill below 90 m in search of new ore bodies, so undiscovered chromite deposits may exist at depth below known deposits (Wells and others, 1946). Although chromite pods tend to be found in clusters (Allen, 1941; Wells and others, 1946; Stowe, 1987a), and chances for discovery of additional ore bodies are greater around known deposits, there are no proven geologic guide-lines for finding associated ore bodies.
Drilling downplunge of regional lineation at a dunite-mylonite surface intersection has resulted in finding blind
Rules Used 5
chromite bodies at depth (Grivas and Rassios, 1993). Some success has been demonstrated in finding chromite deposits by tracing particular shear zones (Rynearson, 1948; Pearre and Heyl, 1960). A better understanding of the local and regional structural geology may be useful in finding podiform chromite deposits.
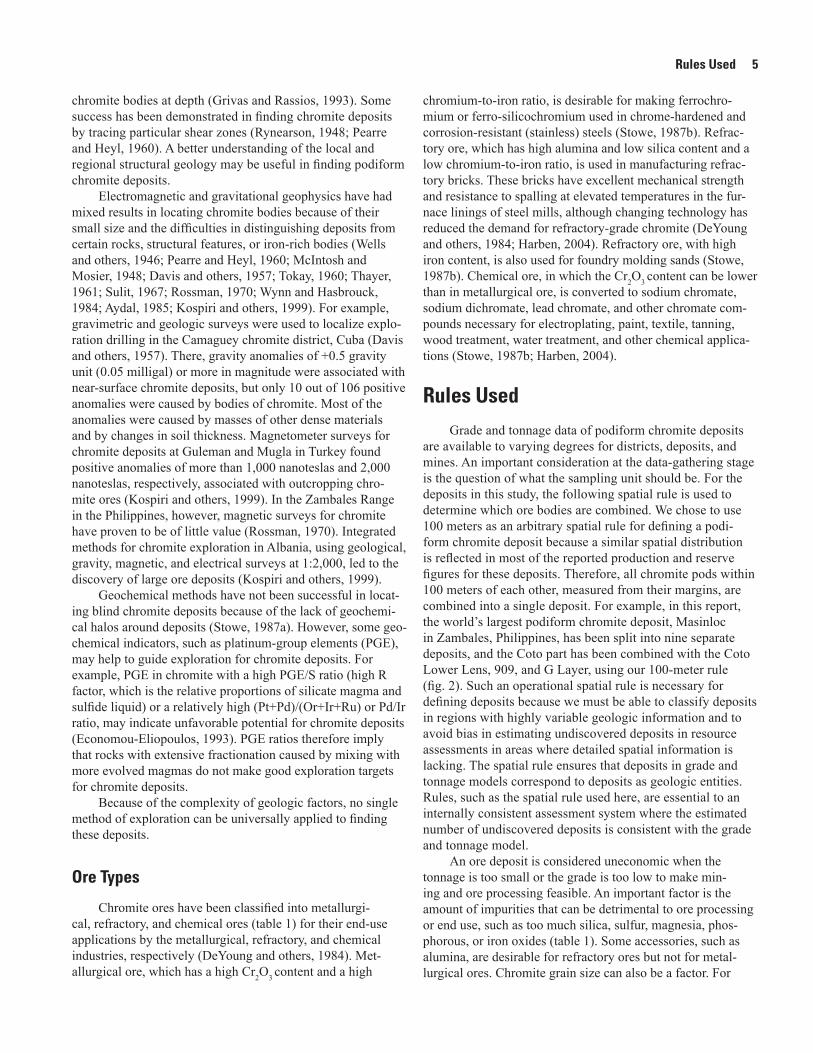
Electromagnetic and gravitational geophysics have had mixed results in locating chromite bodies because of their small size and the difficulties in distinguishing deposits from certain rocks, structural features, or iron-rich bodies (Wells and others, 1946; Pearre and Heyl, 1960; McIntosh and Mosier, 1948; Davis and others, 1957; Tokay, 1960; Thayer, 1961; Sulit, 1967; Rossman, 1970; Wynn and Hasbrouck, 1984; Aydal, 1985; Kospiri and others, 1999). For example, gravimetric and geologic surveys were used to localize explo-ration drilling in the Camaguey chromite district, Cuba (Davis and others, 1957). There, gravity anomalies of +0.5 gravity unit (0.05 milligal) or more in magnitude were associated with near-surface chromite deposits, but only 10 out of 106 positive anomalies were caused by bodies of chromite. Most of the anomalies were caused by masses of other dense materials and by changes in soil thickness. Magnetometer surveys for chromite deposits at Guleman and Mugla in Turkey found positive anomalies of more than 1,000 nanoteslas and 2,000 nanoteslas, respectively, associated with outcropping chro-mite ores (Kospiri and others, 1999). In the Zambales Range in the Philippines, however, magnetic surveys for chromite have proven to be of little value (Rossman, 1970). Integrated methods for chromite exploration in Albania, using geological, gravity, magnetic, and electrical surveys at 1:2,000, led to the discovery of large ore deposits (Kospiri and others, 1999).
Geochemical methods have not been successful in locat-ing blind chromite deposits because of the lack of geochemi-cal halos around deposits (Stowe, 1987a). However, some geo-chemical indicators, such as platinum-group elements (PGE), may help to guide exploration for chromite deposits. For example, PGE in chromite with a high PGE/S ratio (high R factor, which is the relative proportions of silicate magma and sulfide liquid) or a relatively high (Pt+Pd)/(Or+Ir+Ru) or Pd/Ir ratio, may indicate unfavorable potential for chromite deposits (Economou-Eliopoulos, 1993). PGE ratios therefore imply that rocks with extensive fractionation caused by mixing with more evolved magmas do not make good exploration targets for chromite deposits.
Because of the complexity of geologic factors, no single method of exploration can be universally applied to finding these deposits.
Ore Types
Chromite ores have been classified into metallurgi-cal, refractory, and chemical ores (table 1) for their end-use applications by the metallurgical, refractory, and chemical industries, respectively (DeYoung and others, 1984). Met-allurgical ore, which has a high Cr2O3 content and a high
chromium-to-iron ratio, is desirable for making ferrochro-mium or ferro-silicochromium used in chrome-hardened and corrosion-resistant (stainless) steels (Stowe, 1987b). Refrac-tory ore, which has high alumina and low silica content and a low chromium-to-iron ratio, is used in manufacturing refrac-tory bricks. These bricks have excellent mechanical strength and resistance to spalling at elevated temperatures in the fur-nace linings of steel mills, although changing technology has reduced the demand for refractory-grade chromite (DeYoung and others, 1984; Harben, 2004). Refractory ore, with high iron content, is also used for foundry molding sands (Stowe, 1987b). Chemical ore, in which the Cr2O3 content can be lower than in metallurgical ore, is converted to sodium chromate, sodium dichromate, lead chromate, and other chromate com-pounds necessary for electroplating, paint, textile, tanning, wood treatment, water treatment, and other chemical applica-tions (Stowe, 1987b; Harben, 2004).
Rules UsedGrade and tonnage data of podiform chromite deposits
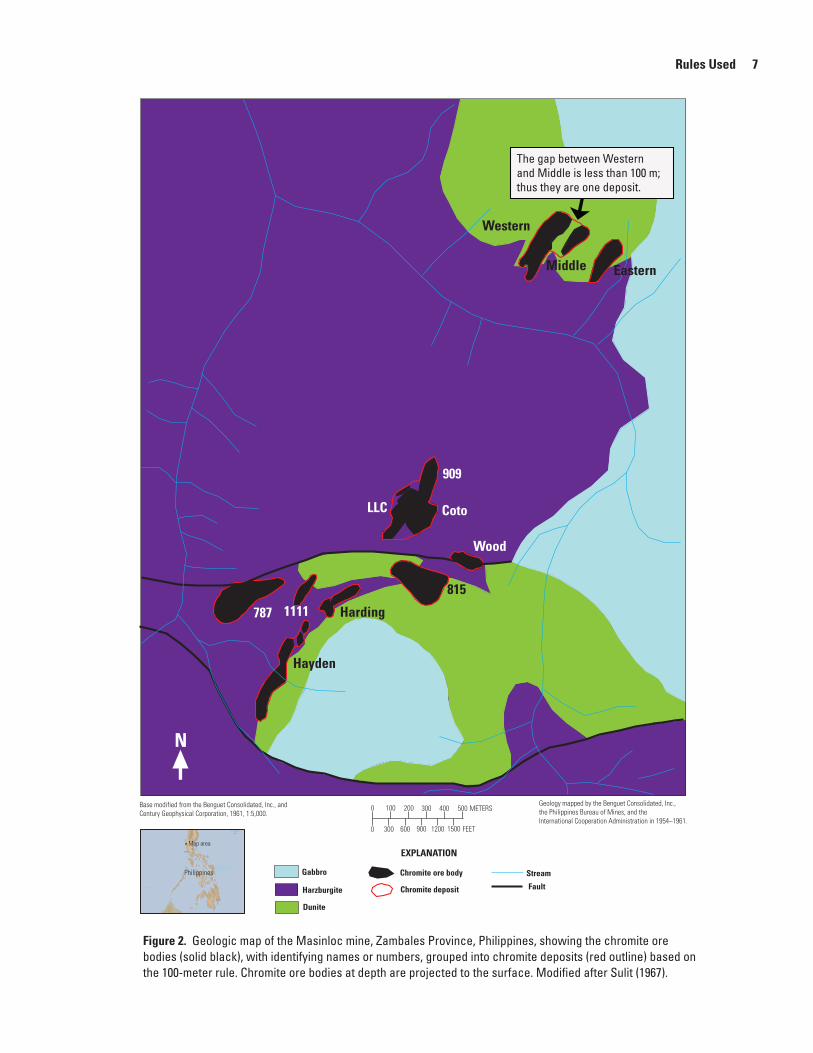
are available to varying degrees for districts, deposits, and mines. An important consideration at the data-gathering stage is the question of what the sampling unit should be. For the deposits in this study, the following spatial rule is used to determine which ore bodies are combined. We chose to use 100 meters as an arbitrary spatial rule for defining a podi-form chromite deposit because a similar spatial distribution is reflected in most of the reported production and reserve figures for these deposits. Therefore, all chromite pods within 100 meters of each other, measured from their margins, are combined into a single deposit. For example, in this report, the world’s largest podiform chromite deposit, Masinloc in Zambales, Philippines, has been split into nine separate deposits, and the Coto part has been combined with the Coto Lower Lens, 909, and G Layer, using our 100-meter rule (fig. 2). Such an operational spatial rule is necessary for defining deposits because we must be able to classify deposits in regions with highly variable geologic information and to avoid bias in estimating undiscovered deposits in resource assessments in areas where detailed spatial information is lacking. The spatial rule ensures that deposits in grade and tonnage models correspond to deposits as geologic entities. Rules, such as the spatial rule used here, are essential to an internally consistent assessment system where the estimated number of undiscovered deposits is consistent with the grade and tonnage model.
An ore deposit is considered uneconomic when the tonnage is too small or the grade is too low to make min-ing and ore processing feasible. An important factor is the amount of impurities that can be detrimental to ore processing or end use, such as too much silica, sulfur, magnesia, phos-phorous, or iron oxides (table 1). Some accessories, such as alumina, are desirable for refractory ores but not for metal-lurgical ores. Chromite grain size can also be a factor. For
6 Podiform Chromite Deposits—Database and Grade and Tonnage Models
instance, coarse-grained chromite, or lump ore, is preferred for refractory ores while fine-grained chromite is preferred for chemical ores. Friable ore is permitted for chemical ore but not for refractory ore (U.S. Business and Defense Services Administration, 1962). A deposit presently considered to be uneconomic may have been economic at earlier times when the cost was favorable for chromite extraction or may become economic in the future. For example, many of the podiform chromite deposits that were mined in the United States during the two world wars, when chromite mining was subsidized by the government, were small deposits that are considered uneconomic by current standards. Many small podiform chromite deposits, containing less than one metric ton of ore, were mined. Because such small bodies are not currently being explored for and mined, we use an arbitrary cutoff of one metric ton to exclude them. In this compilation for the regions studied, we include all deposits that contain at least one metric ton of ore regardless of the chromic oxide grade. In cases where tonnage is not available, tonnage is calculated from the reported or measured dimensions or volume of the deposit or, in some cases, from the size of the mined-out workings, using a factor of 0.28 cubic meters per metric ton of ore. The volume equation for a tabular body (length x width x depth) was used.
Likewise, if we consider a particular grade to be too low, or anomalously high, it is excluded from the grade fields of the database, but the grade information is recorded in the com-ments field. Although we attempt to report the average chromic oxide grade representative of the deposit, the literature is not always clear as to what the reported grade represents. Hand-sorted ore and concentrates are not usually representative of the ore-deposit grade. Therefore when these types of ore could not be combined with their associated lower grade portions, they are excluded from the grade field. For the chromic oxide grade model, we exclude all deposits with average grades below 30 percent Cr2O3, which is considered uneconomic. When average grades are not available, we use the reported assays of typically mined ore sampled from the mine wall or stockpile. In a few cases, where the grade of a deposit is not reported, but it is in a cluster of deposits with similar grade, we infer the grade from the nearest deposit. For ores with only the content of chro-mite given, we use a factor of 0.5 to convert to the percentage
of chromic oxide (chromite typically contains from 30 to 70 percent Cr2O3) (Wells and others, 1940). When available, the average assay values in parts per million for ruthenium, rhodium, iridium, palladium, and platinum are reported in their respective grade fields, and their reported ranges are given in the comments field. It is important to note, however, that the PGE grades are converted to parts per billion in the grade plots.
Deposits included here must be associated with alpine ultramafic rocks (Thayer, 1961). These ultramafic rocks have been recognized in three paleotectonic settings, namely mid-ocean ridges, off-ridge settings or oceanic islands, and supra-subduction zones. Although classification of ophiolites into these tectonic settings is actively debated (Wakabayashi and Dilek, 2000, and references therein), for the purpose of this study, the most popular or accepted views are selected in assigning the paleotectonic settings for each deposit. These views are usu-ally based on the reported element-ratio discriminant diagrams for midocean ridge basalt and boninitic suprasubduction zones (Dick and Bullen, 1984; Roberts, 1988; Pearce and others, 2000; Stowe, 1994; Bloomer and others, 1995).
The ultramafic rocks in each of these paleotectonic set-tings may contain ophiolite zones or stratigraphic positions that comprise an upper cumulate zone, a transition zone, and a basal tectonite zone (fig. 3). These ophiolite zones vary widely in thickness, some may be absent in dismem-bered ophiolites, and some that are highly metamorphosed or deformed have unrecognized zones (Akbulut and others, 2010, Stowe, 1987b). Lithologically, the upper cumulate zone contains layered gabbro, norite, diorite, pyroxenite, wehrlite, and dunite. The transition zone, or the Moho, contains mostly dunite along with some mixing of the other cumulate and tectonite rocks, and this zone can be as much as 3 km thick (Stern and others, 2004). The Moho is defined as the base of the cumulate section and the top of the tectonized perido-tites. The transition zone includes the uppermost part of the tectonite section, the Moho discontinuity, and the cumulate ultramafic section up to the base of gabbros. The basal tec-tonite zone consists mostly of harzburgite and dunite, along with lherzolite and pyroxenite (Dickey, 1975; Stowe, 1987a). Chromite is usually associated with dunite or serpentinized dunite in all three ophiolite sequences (Stowe, 1987b).
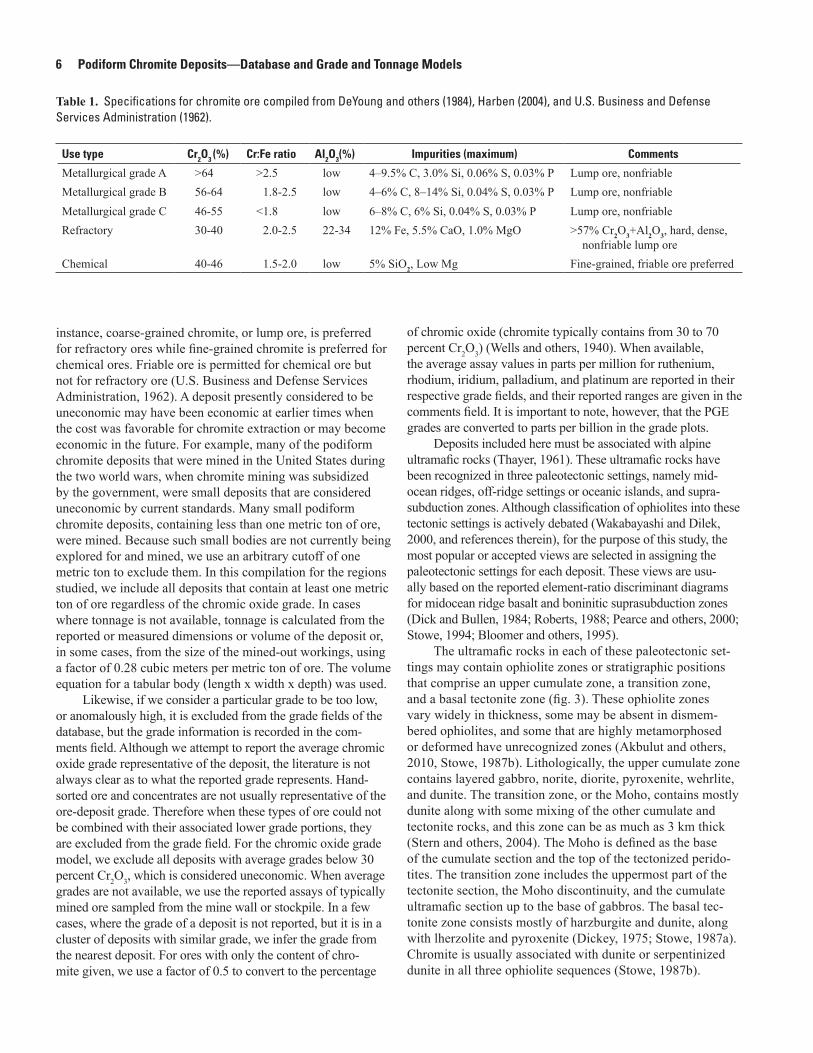
Table 1. Specifications for chromite ore compiled from DeYoung and others (1984), Harben (2004), and U.S. Business and Defense Services Administration (1962).
Use type Cr2O3 (%) Cr:Fe ratio Al2O3(%) Impurities (maximum) Comments
Metallurgical grade A >64 >2.5 low 4–9.5% C, 3.0% Si, 0.06% S, 0.03% P Lump ore, nonfriableMetallurgical grade B 56-64 1.8-2.5 low 4–6% C, 8–14% Si, 0.04% S, 0.03% P Lump ore, nonfriableMetallurgical grade C 46-55 <1.8 low 6–8% C, 6% Si, 0.04% S, 0.03% P Lump ore, nonfriableRefractory 30-40 2.0-2.5 22-34 12% Fe, 5.5% CaO, 1.0% MgO >57% Cr2O3+Al2O3, hard, dense,
nonfriable lump oreChemical 40-46 1.5-2.0 low 5% SiO2, Low Mg Fine-grained, friable ore preferred
Rules Used 7
Philippines
Map area
Gabbro
Harzburgite
Chromite ore body
Dunite
Chromite deposit
Stream
Fault
METERS
FEET
Base modified from the Benguet Consolidated, Inc., and Century Geophysical Corporation, 1961, 1:5,000.
Geology mapped by the Benguet Consolidated, Inc., the Philippines Bureau of Mines, and the International Cooperation Administration in 1954–1961.
EXPLANATION
909
CotoLLC
815
Wood
787
Hayden
Harding1111
Western
Middle Eastern
The gap between Western and Middle is less than 100 m; thus they are one deposit.
0 100 200 300 400 500
0 300 600 900 1200 1500
N
Figure 2. Geologic map of the Masinloc mine, Zambales Province, Philippines, showing the chromite ore bodies (solid black), with identifying names or numbers, grouped into chromite deposits (red outline) based on the 100-meter rule. Chromite ore bodies at depth are projected to the surface. Modified after Sulit (1967).

8 Podiform Chromite Deposits—Database and Grade and Tonnage Models
Moho
0
1
2
3
4
5
6
7
8
9
10
sediments
pillow lava
diabase dikes
dunite + chromite
dunite + chromite
dunite + chromite
harzburgite + banded harzburgite
deformed harzburgite
harzburgite
Cum
ulat
es
Transition
Tect
onite deformed dunite
massive diorite + gabbro
pyroxenite + wehrlite
layered gabbro
deformed lherzolite
lherzolite
Dept
h be
low
orig
inal
sea
bot
tom
, in
kilo
met
ers
Figure 3. Generalized stratigraphic column of an ophiolite sequence showing the zones with their lithologies and the distribution of podiform chromite (black blebs) (modified after Dickey, 1975; Laurent and Kacira, 1987; and Leblanc, 1987).

Classification of Podiform Chromite Subtypes 9
Classification of Podiform Chromite Subtypes
Grade and tonnage data and selected geologic information on worldwide podiform chromite deposits are compiled into a database with the purpose of updating the grade and tonnage models that were initially published in Cox and Singer (1986). In the initial studies, Singer and others (1986) and Singer and Page (1986) found a bimodal distribution in the tonnages of worldwide podiform chromite deposits, so these were split into two groups, which they called major podiform chromite (174 deposits) and minor podiform chromite (435 deposits), respec-tively. The major podiform chromite deposits are relatively larger deposits (median size is 20,000 metric tons) that occur in Turkey, Cuba, Philippines, Iran, and New Caledonia. The minor podiform chromite deposits are relatively smaller depos-its (median size is 130 metric tons) that are found in California and Oregon. The chromic oxide grades among the two groups are not significantly different (46 percent Cr2O3 in the major podiform chromite and 44 percent Cr2O3 in the minor podiform chromite). Because the geology is similar, both models shared the same geologic descriptive model. The ultramafic rocks are not differentiated in the former studies because of the premise that most geologic maps simply report undifferentiated ultra-mafic rocks (Singer, 1994). For that reason, the paleotectonic settings and ophiolite zones were not examined in the former studies. The podiform chromite deposits, furthermore, were not defined by any spatial rule, and this resulted in some mixing of data from mines and districts.
In the present study, we improve on the former models with data from additional podiform chromite deposits from other regions, application of a 100-meter separation rule for deposits, and elimination of deposits that represented districts or lacked critical geologic information, for example in Turkey and Iran. As in the former studies (Singer and others, 1986; Singer and Page, 1986), we accepted deposits with a minimum size of one metric ton. The former studies did not have a minimum chromic oxide grade; we use a minimum of 30 percent chromic oxide in this study. Because of our use of a grade limit and the spatial rule, which combines some of the deposits used in the former studies, the number of deposits for the same regions decreased in the two models—the minor podiform chromite deposits in California and Oregon reduced from 467 to 248 deposits and the major podiform chromite deposits in Turkey, New Caledonia, Cuba, and Philippines reduced from 487 to 227 deposits. The reduction of the number of deposits in those models is also due to the reassignment of some deposits to the banded podiform chromite group in this study. We also classify the podiform chromite deposits, using the groups in the former studies, with some modifications, according to their respective paleotectonic settings and ophiolite zones.
Podiform chromite deposits are known to occur in dif-ferent paleotectonic settings, which include the ocean crust at midocean ridges, at off-ridge sites beneath seamounts, and in arc environments beneath the forearc, intra-arc, and backarc
settings. In this report these arc settings are designated as the suprasubduction setting. Within these tectonic settings, the deposits reside in different ultramafic ophiolite zones, specifically the upper cumulate, transition (Moho), and basal tectonite zones (see table 2). In this study, we test the grades and tonnages of the podiform chromite deposits that occur in each of these environments to see if their grades or tonnages are significantly different.
The three final podiform chromite grade and tonnage models presented in this paper are the results of statistical analyses of various categories of podiform chromite deposits based on certain geologic information. A preliminary test of the tonnages (converted to logarithms) of all 619 podiform chromite deposits found that the tonnages are significantly different from the lognormal distribution, using the Shapiro-Wilk goodness-of-fit probability at the 1-percent significance level, suggesting the presence of mixed populations among the deposits. Mixed populations for tonnages may be due to differences in mineralization, deformation, or geologic set-tings, which we proceeded to test. Podiform chromite depos-its are classified into three subtypes based on their size and form: major podiform, minor podiform, and banded podiform chromite. They are also classified into three paleotectonic settings (suprasubduction, midocean ridge, and off-ridge) and three ophiolite zones (cumulate, transition, and tectonite). Deposits with uncertainties, usually ranging to 11 percent of the deposits (see appendix A), in any of the named categories are excluded from this analysis. The tests for the 9 groups of podiform chromite deposits grouped by the three paleotectonic settings, three ophiolite zones, or three deposit subtypes again found that the tonnages in each of these groups are signifi-cantly different from the lognormal distribution, indicating that mixed populations probably are present in each group.
In testing the tonnages further using a combination of geologic factors, there are 17 podiform chromite groups with tonnages out of a total of 27 possible types (table 2). These are differentiated on the basis of a combination of their paleotec-tonic settings, ophiolite zones, and deposit subtypes. With the exception of the minor podiform chromite deposits hosted in tectonite in suprasubduction zones, the tonnages in each of the groups fit the lognormal distribution using the Shapiro-Wilk goodness-of-fit probability at the 1-percent significance level, indicating that each group contains a homogenous population. The possible mixed population in the minor podiform chromite deposits in the tectonite zone of suprasubduction settings may be due to other factors that were not tested in this investigation, such as ore-forming processes, degree of deformation, or end-use ore types.
In testing the chromic oxide grades using a 30-percent cutoff, only those for the banded podiform chromite deposits fit the normal distribution. The grades for the other groups are significantly different from the normal distribution, which may be a result of economic factors and the limit on maxi-mum grade because of mineralogy. Because similar behavior of metal grades that are greater than 10 percent has been observed in other types of deposits (Singer and Menzie, 2010)

10 Podiform Chromite Deposits—Database and Grade and Tonnage Models
Table 2. Podiform chromite deposit groups considered in this study.
Paleotectonic setting Ophiolite zone Deposit subtype Number of deposits Final model class
Suprasubduction Tectonite Minor podiform 223 Minor podiform chromiteMidocean ridge Tectonite Minor podiform 28 Minor podiform chromite Off-ridge Tectonite Minor podiform 5 Minor podiform chromiteSuprasubduction Tectonite Major podiform 99 Major podiform chromiteMidocean ridge Tectonite Major podiform 8 Major podiform chromiteSuprasubduction Transition Major podiform 104 Major podiform chromiteMidocean ridge Transition Major podiform 19 Major podiform chromiteOff-ridge Transition Major podiform 2 Major podiform chromiteSuprasubduction Cumulate Major podiform 38 Major podiform chromiteMidocean ridge Cumulate Major podiform 3 Major podiform chromiteSuprasubduction Tectonite Banded podiform 24 Banded podiform chromiteMidocean ridge Tectonite Banded podiform 1 Banded podiform chromiteSuprasubduction Cumulate Minor podiform 20 Banded podiform chromiteSuprasubduction Transition Minor podiform 32 Banded podiform chromiteSuprasubduction Transition Banded podiform 8 Banded podiform chromiteMidocean ridge Transition Banded podiform 1 Banded podiform chromiteSuprasubduction Cumulate Banded podiform 6 Banded podiform chromite
and because there is little difference in the average chromic oxide grades among the groups, we did no further testing on grades. The possible reasons for the departure of grades from normality are discussed in more detail in the next section.
In further testing of group differences, analysis of vari-ance and Student’s t of the tonnages of the 15 groups in table 2 (two groups with only one deposit each are excluded) reveal that the tonnages are not significantly different among sev-eral of the groups, which therefore allows consolidation to just three groups or subtypes for the tonnage model (fig. 4). This should not be surprising, because one of the variables is deposit size, which splits deposits into major and minor podi-form chromite groupings by regions.
Interestingly, two of the minor podiform chromite groups that occur in the cumulate or transition zones in suprasubduction settings have tonnages more in common with the banded podiform chromite deposits than with the minor podiform chromite deposits in the tectonite zones, which suggest a possible misclassification of deposits, so these are combined with the banded podiform chromite deposits. All of these minor podiform chromite deposits in the cumulate or transition zones in suprasubduction settings occur in the California Coast Ranges and the Appalachians of the United States, and they have seams or zones of dissemi-nated chromite associated with small chromite pods, which may make it difficult to distinguish the minor podiform chromite from the banded podiform chromite subtypes.
Regardless of deposit subtypes, there are no differ-ences in tonnages in either the transition or cumulate groups, so the deposits in these two ophiolite zones are combined. The banded podiform chromite deposits, however, are
significantly different in tonnage from both major and minor podiform chromite deposits and, therefore, are treated as a separate group (fig. 4). It is also interesting to note that the different paleotectonic settings and ophiolite zones that contain the major podiform chromite deposits have median tonnages that are not significantly different from one another, so these are combined.
The chromic oxide grades among the three groups—major podiform chromite (median 44 percent), minor podiform chromite (median 43 percent), and banded podiform chromite (median 42 percent)—are not significantly different at the 1-percent significance level, so chromic oxide grades cannot be used to distinguish among the podiform chromite subtypes.
The last column in table 2 displays the final tonnage and grade models that are recommended for use for each of the groups. The analyses of the three grade-tonnage models are discussed in more detail in the following section of this paper.
Preliminary Analysis
Grade and Tonnage Models
Grade and tonnage models of mineral deposits are useful in quantitative resource assessments and exploration planning. They are useful in classifying the known deposits in a region, aiding in delineation of areas permissive for specific deposit types, and providing information about the potential value of undiscovered deposits in the assessment area. Construc-tion of grade and tonnage models involves multiple steps.
Preliminary Analysis 11
Major Minor Banded
Log
tonn
age
Podiform chromite deposit subtype
-2
-1
0
1
-3
Tonn
age
in m
illio
ns o
f met
ric to
ns1.0
10
0.001
0.0001
0.00001
0.000001
0.1
0.01
-4
-5
-6
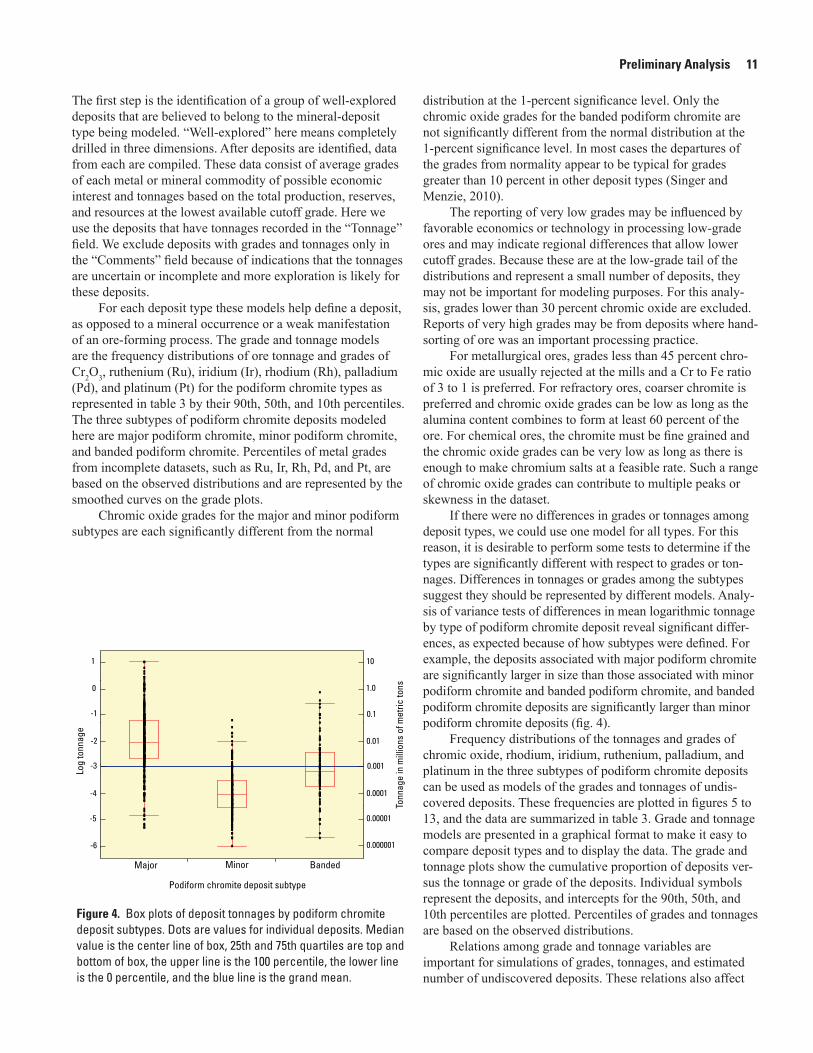
Figure 4. Box plots of deposit tonnages by podiform chromite deposit subtypes. Dots are values for individual deposits. Median value is the center line of box, 25th and 75th quartiles are top and bottom of box, the upper line is the 100 percentile, the lower line is the 0 percentile, and the blue line is the grand mean.
The first step is the identification of a group of well-explored deposits that are believed to belong to the mineral-deposit type being modeled. “Well-explored” here means completely drilled in three dimensions. After deposits are identified, data from each are compiled. These data consist of average grades of each metal or mineral commodity of possible economic interest and tonnages based on the total production, reserves, and resources at the lowest available cutoff grade. Here we use the deposits that have tonnages recorded in the “Tonnage” field. We exclude deposits with grades and tonnages only in the “Comments” field because of indications that the tonnages are uncertain or incomplete and more exploration is likely for these deposits.
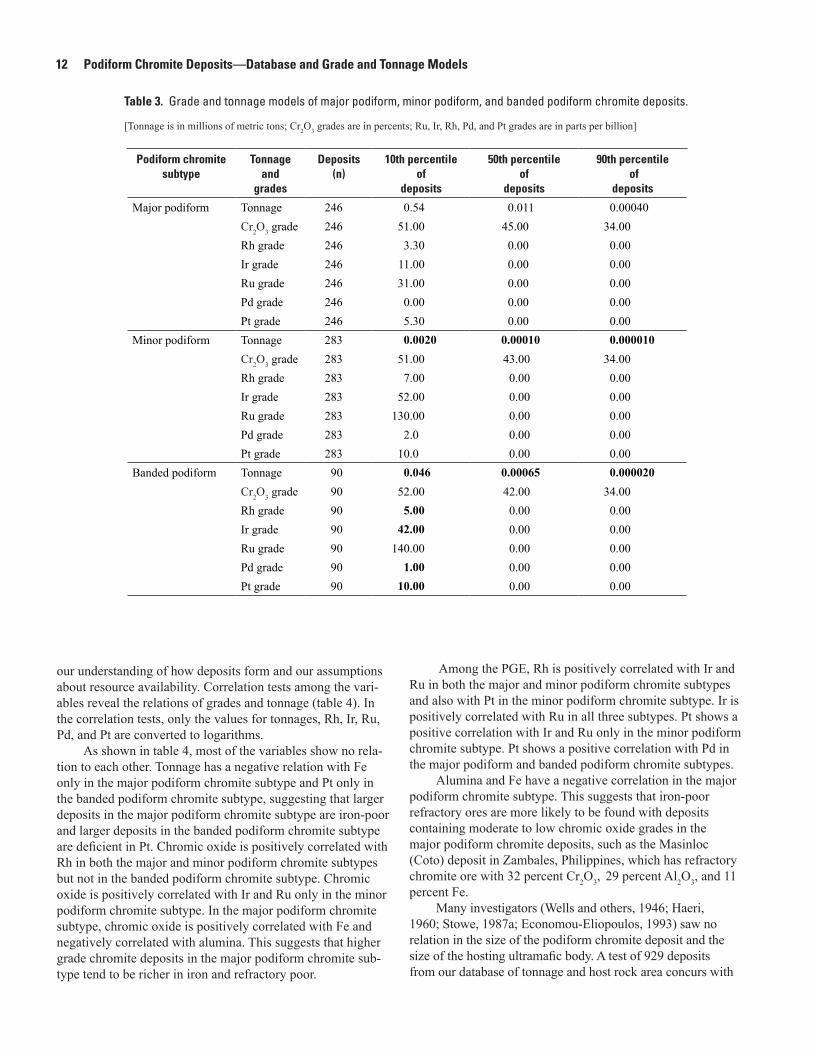
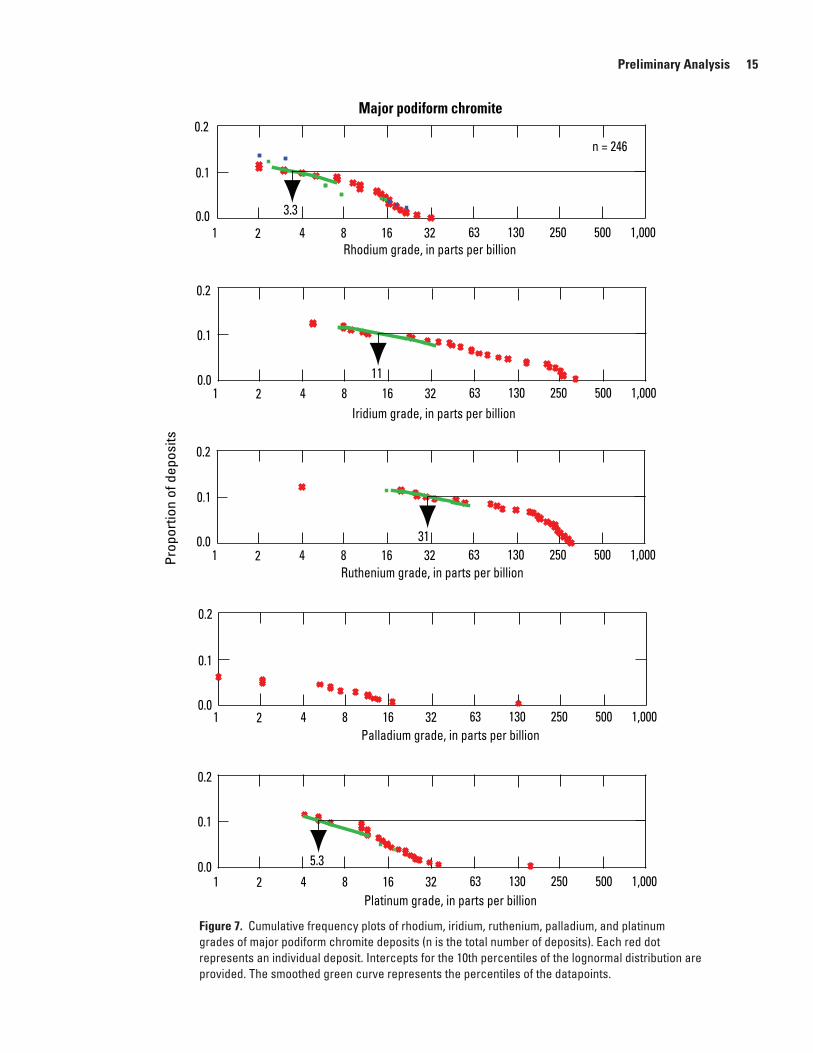
For each deposit type these models help define a deposit, as opposed to a mineral occurrence or a weak manifestation of an ore-forming process. The grade and tonnage models are the frequency distributions of ore tonnage and grades of Cr2O3, ruthenium (Ru), iridium (Ir), rhodium (Rh), palladium (Pd), and platinum (Pt) for the podiform chromite types as represented in table 3 by their 90th, 50th, and 10th percentiles. The three subtypes of podiform chromite deposits modeled here are major podiform chromite, minor podiform chromite, and banded podiform chromite. Percentiles of metal grades from incomplete datasets, such as Ru, Ir, Rh, Pd, and Pt, are based on the observed distributions and are represented by the smoothed curves on the grade plots.
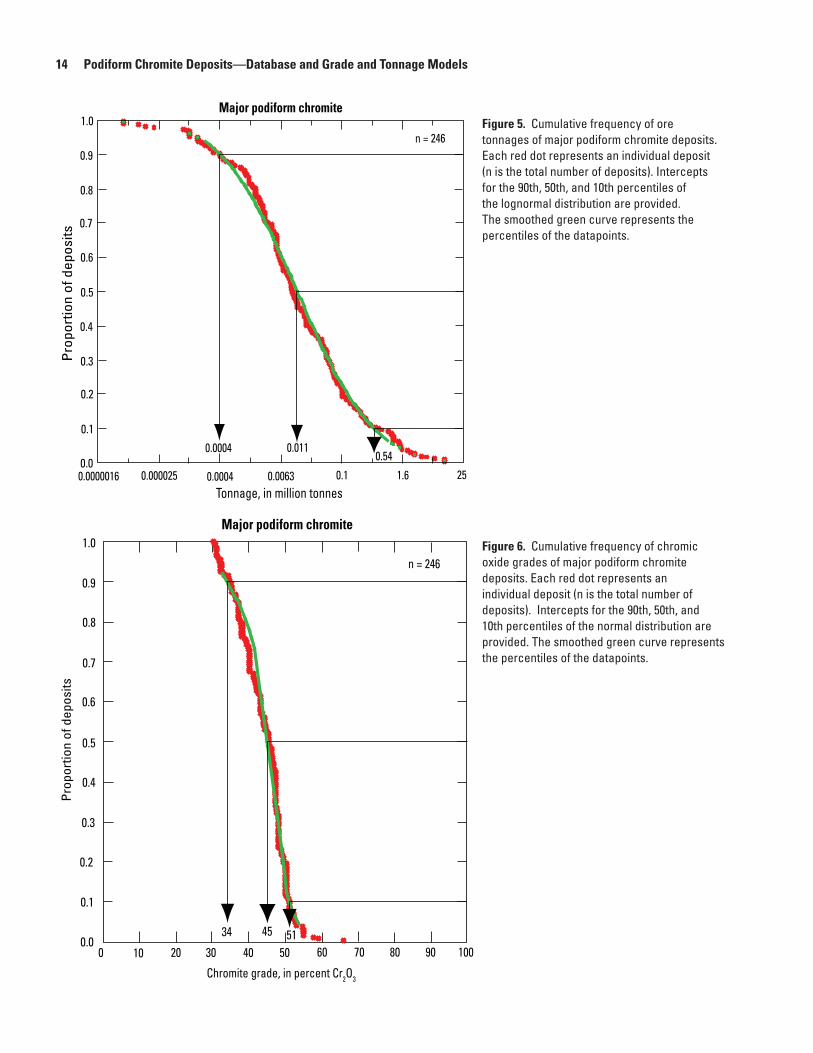
Chromic oxide grades for the major and minor podiform subtypes are each significantly different from the normal
distribution at the 1-percent significance level. Only the chromic oxide grades for the banded podiform chromite are not significantly different from the normal distribution at the 1-percent significance level. In most cases the departures of the grades from normality appear to be typical for grades greater than 10 percent in other deposit types (Singer and Menzie, 2010).
The reporting of very low grades may be influenced by favorable economics or technology in processing low-grade ores and may indicate regional differences that allow lower cutoff grades. Because these are at the low-grade tail of the distributions and represent a small number of deposits, they may not be important for modeling purposes. For this analy-sis, grades lower than 30 percent chromic oxide are excluded. Reports of very high grades may be from deposits where hand-sorting of ore was an important processing practice.
For metallurgical ores, grades less than 45 percent chro-mic oxide are usually rejected at the mills and a Cr to Fe ratio of 3 to 1 is preferred. For refractory ores, coarser chromite is preferred and chromic oxide grades can be low as long as the alumina content combines to form at least 60 percent of the ore. For chemical ores, the chromite must be fine grained and the chromic oxide grades can be very low as long as there is enough to make chromium salts at a feasible rate. Such a range of chromic oxide grades can contribute to multiple peaks or skewness in the dataset.
If there were no differences in grades or tonnages among deposit types, we could use one model for all types. For this reason, it is desirable to perform some tests to determine if the types are significantly different with respect to grades or ton-nages. Differences in tonnages or grades among the subtypes suggest they should be represented by different models. Analy-sis of variance tests of differences in mean logarithmic tonnage by type of podiform chromite deposit reveal significant differ-ences, as expected because of how subtypes were defined. For example, the deposits associated with major podiform chromite are significantly larger in size than those associated with minor podiform chromite and banded podiform chromite, and banded podiform chromite deposits are significantly larger than minor podiform chromite deposits (fig. 4).
Frequency distributions of the tonnages and grades of chromic oxide, rhodium, iridium, ruthenium, palladium, and platinum in the three subtypes of podiform chromite deposits can be used as models of the grades and tonnages of undis-covered deposits. These frequencies are plotted in figures 5 to 13, and the data are summarized in table 3. Grade and tonnage models are presented in a graphical format to make it easy to compare deposit types and to display the data. The grade and tonnage plots show the cumulative proportion of deposits ver-sus the tonnage or grade of the deposits. Individual symbols represent the deposits, and intercepts for the 90th, 50th, and 10th percentiles are plotted. Percentiles of grades and tonnages are based on the observed distributions.
Relations among grade and tonnage variables are important for simulations of grades, tonnages, and estimated number of undiscovered deposits. These relations also affect
12 Podiform Chromite Deposits—Database and Grade and Tonnage Models
Table 3. Grade and tonnage models of major podiform, minor podiform, and banded podiform chromite deposits.
[Tonnage is in millions of metric tons; Cr2O3 grades are in percents; Ru, Ir, Rh, Pd, and Pt grades are in parts per billion]
Podiform chromite subtype
Tonnage and
grades
Deposits(n)
10th percentile of
deposits
50th percentile of
deposits
90th percentile of
deposits
Major podiform Tonnage 246 0.54 0.011 0.00040Cr2O3 grade 246 51.00 45.00 34.00Rh grade 246 3.30 0.00 0.00Ir grade 246 11.00 0.00 0.00Ru grade 246 31.00 0.00 0.00Pd grade 246 0.00 0.00 0.00Pt grade 246 5.30 0.00 0.00
Minor podiform Tonnage 283 0.0020 0.00010 0.000010Cr2O3 grade 283 51.00 43.00 34.00Rh grade 283 7.00 0.00 0.00Ir grade 283 52.00 0.00 0.00Ru grade 283 130.00 0.00 0.00Pd grade 283 2.0 0.00 0.00Pt grade 283 10.0 0.00 0.00
Banded podiform Tonnage 90 0.046 0.00065 0.000020Cr2O3 grade 90 52.00 42.00 34.00Rh grade 90 5.00 0.00 0.00Ir grade 90 42.00 0.00 0.00Ru grade 90 140.00 0.00 0.00Pd grade 90 1.00 0.00 0.00Pt grade 90 10.00 0.00 0.00
our understanding of how deposits form and our assumptions about resource availability. Correlation tests among the vari-ables reveal the relations of grades and tonnage (table 4). In the correlation tests, only the values for tonnages, Rh, Ir, Ru, Pd, and Pt are converted to logarithms.
As shown in table 4, most of the variables show no rela-tion to each other. Tonnage has a negative relation with Fe only in the major podiform chromite subtype and Pt only in the banded podiform chromite subtype, suggesting that larger deposits in the major podiform chromite subtype are iron-poor and larger deposits in the banded podiform chromite subtype are deficient in Pt. Chromic oxide is positively correlated with Rh in both the major and minor podiform chromite subtypes but not in the banded podiform chromite subtype. Chromic oxide is positively correlated with Ir and Ru only in the minor podiform chromite subtype. In the major podiform chromite subtype, chromic oxide is positively correlated with Fe and negatively correlated with alumina. This suggests that higher grade chromite deposits in the major podiform chromite sub-type tend to be richer in iron and refractory poor.
Among the PGE, Rh is positively correlated with Ir and Ru in both the major and minor podiform chromite subtypes and also with Pt in the minor podiform chromite subtype. Ir is positively correlated with Ru in all three subtypes. Pt shows a positive correlation with Ir and Ru only in the minor podiform chromite subtype. Pt shows a positive correlation with Pd in the major podiform and banded podiform chromite subtypes.
Alumina and Fe have a negative correlation in the major podiform chromite subtype. This suggests that iron-poor refractory ores are more likely to be found with deposits containing moderate to low chromic oxide grades in the major podiform chromite deposits, such as the Masinloc (Coto) deposit in Zambales, Philippines, which has refractory chromite ore with 32 percent Cr2O3, 29 percent Al2O3, and 11 percent Fe.
Many investigators (Wells and others, 1946; Haeri, 1960; Stowe, 1987a; Economou-Eliopoulos, 1993) saw no relation in the size of the podiform chromite deposit and the size of the hosting ultramafic body. A test of 929 deposits from our database of tonnage and host rock area concurs with

Preliminary A
nalysis 13
Table 4. Summary of correlations of tonnages and grades grouped by podiform chromite subtypes.
[First number is the correlation coefficient (shown as positive or negative correlations), second is the number of deposits. Correlations significant at the 0.01 level are shown in red. NA, not available.]
Major Tonnage Cr2O3 Rh Ir Ru Pd Pt Fe
Cr2O3 0.155, 246Rh 0.190, 28 0.574, 28Ir 0.397, 30 0.394, 30 0.874, 28Ru 0.406, 30 0.441, 30 0.813, 28 0.870, 30Pd 0.065, 15 0.227, 15 0.285, 14 0.298, 15 0.255, 15Pt 0.063, 28 0.094, 28 0.441, 27 0.447, 28 0.314, 28 0.652, 15Fe –0.282, 100 0.324, 100 NA NA NA NA NA
Al2O3 0.025, 63 –0.624, 63 NA NA NA NA NA –0.337, 62
Minor Tonnage Cr2O3 Rh Ir Ru Pd Pt Fe
Cr2O3 0.019, 283Rh 0.306, 57 0.417, 57Ir 0.024, 48 0.462, 48 0.533, 47Ru 0.094, 44 0.439, 44 0.632, 43 0.754, 44Pd 0.101, 35 0.037, 35 0.273, 34 0.020, 27 0.088, 26Pt 0.144, 37 0.238, 37 0.466, 35 0.653, 29 0.559, 26 0.157, 27Fe 0.191, 114 0.218, 114 NA NA NA NA NA
Al2O3 0.300, 23 0.278, 23 NA NA NA NA NA 0.165, 20
Banded Tonnage Cr2O3 Rh Ir Ru Pd Pt Fe
Cr2O3 0.020, 90Rh 0.519, 14 0.256, 14Ir 0.100, 14 0.110, 14 0.244, 13Ru 0.150, 15 0.248, 15 0.346, 14 0.866, 14Pd 0.731, 11 0.013, 11 0.566, 11 0.324, 10 0.265, 11Pt –0.833 12 0.006, 12 0.230, 12 0.472, 11 0.356, 12 0.784, 11Fe 0.178, 36 0.069, 36 NA NA NA NA NA
Al2O3 0.013, 23 0.160, 23 NA NA NA NA NA 0.047, 20
14 Podiform Chromite Deposits—Database and Grade and Tonnage ModelsP
ropo
rtio
n of
dep
osits
1.0
0.9
0.8
0.7
0.6
0.5
0.4
0.3
0.2
0.1
0.00.0000016 0.000025 0.0004 0.0063 0.1
Tonnage, in million tonnes1.6 25
n = 246
0.0004 0.0110.54
Major podiform chromite
Prop
ortio
n of
dep
osits
1.0
0.9
0.8
0.7
0.6
0.5
0.4
0.3
0.2
0.1
0.034 45 51
n = 246
Major podiform chromite
60 10070 80 9050403020100
Chromite grade, in percent Cr2O3
Figure 5. Cumulative frequency of ore tonnages of major podiform chromite deposits. Each red dot represents an individual deposit (n is the total number of deposits). Intercepts for the 90th, 50th, and 10th percentiles of the lognormal distribution are provided. The smoothed green curve represents the percentiles of the datapoints.
Figure 6. Cumulative frequency of chromic oxide grades of major podiform chromite deposits. Each red dot represents an individual deposit (n is the total number of deposits). Intercepts for the 90th, 50th, and 10th percentiles of the normal distribution are provided. The smoothed green curve represents the percentiles of the datapoints.
Preliminary Analysis 15
0.2
0.1
0.0
0.2
0.1
0.0
0.2
0.1
0.0
0.2
0.1
0.0
0.2
0.1
0.0
Prop
ortio
n of
dep
osits
Major podiform chromite
3.3
n = 246
11
31
5.3
63 1,000130 250 50032168421
63 1,000130 250 50032168421
63 1,000130 250 50032168421
63 1,000130 250 50032168421
63 1,000130 250 50032168421
Iridium grade, in parts per billion
Ruthenium grade, in parts per billion
Palladium grade, in parts per billion
Platinum grade, in parts per billion
Rhodium grade, in parts per billion
Figure 7. Cumulative frequency plots of rhodium, iridium, ruthenium, palladium, and platinum grades of major podiform chromite deposits (n is the total number of deposits). Each red dot represents an individual deposit. Intercepts for the 10th percentiles of the lognormal distribution are provided. The smoothed green curve represents the percentiles of the datapoints.

16 Podiform Chromite Deposits—Database and Grade and Tonnage ModelsPr
opor
tion
of d
epos
its
1.0
0.9
0.8
0.7
0.6
0.5
0.4
0.3
0.2
0.1
0.00.0000004 0.0000063 0.0001 0.0016 0.025 0.4
Tonnage, in millions tonnes
n = 283
0.00001 0.00010.002
Minor podiform chromite
Prop
ortio
n of
dep
osits
1.0
0.9
0.8
0.7
0.6
0.5
0.4
0.3
0.2
0.1
0.034 43 51
n = 283
Minor podiform chromite
60 10070 80 9050403020100Chromite grade, in percent Cr2O3
Figure 8. Cumulative frequency of ore tonnages of minor podiform chromite deposits. Each red dot represents an individual deposit (n is the total number of deposits). Intercepts for the 90th, 50th, and 10th percentiles of the lognormal distribution are provided. The smoothed green curve represents the percentiles of the datapoints.
Figure 9. Cumulative frequency of chromic oxide grades of minor podiform chromite deposits (n is the total number of deposits). Each dot represents an individual deposit. Intercepts for the 90th, 50th, and 10th percentiles of the normal distribution are provided. The smoothed green curve represents the percentiles of the datapoints.

Preliminary Analysis 17
0.2
0.1
0.0
0.2
0.1
0.0
0.2
0.1
0.0
0.2
0.1
0.0
0.2
0.1
0.0
Prop
ortio
n of
dep
osits
Minor podiform chromite
7
n = 283
52
130
10
2
63 1,000130 250 50032168421
63 1,000130 250 50032168421
63 1,000130 250 5003216842 2,000
630.5 130 2500.25 32168421
63 1,000130 250 5003216840 2,000
Iridium grade, in parts per billion
Ruthenium grade, in parts per billion
Palladium grade, in parts per billion
Platinum grade, in parts per billion
Rhodium grade, in parts per billion
Figure 10. Cumulative frequency plots of rhodium, iridium, ruthenium, palladium, and platinum grades of minor podiform chromite deposits. Each red dot represents an individual deposit (n is the total number of deposits). Intercepts for the 10th percentiles of the lognormal distribution are provided. The smoothed green curve represents the percentiles of the datapoints.
18 Podiform Chromite Deposits—Database and Grade and Tonnage ModelsPr
opor
tion
of d
epos
its
1.0
0.9
0.8
0.7
0.6
0.5
0.4
0.3
0.2
0.1
0.00.0000016 0.000025 0.0004 0.0063 0.1 1.6
Tonnage, in million tonnes
n = 90
0.00002 0.00065 0.046
Banded podiform chromite
1.0
0.9
0.8
0.7
0.6
0.5
0.4
0.3
0.2
0.1
0.0
Prop
ortio
n of
dep
osits
34 42 52
n = 90
Banded podiform chromite
60 10070 80 9050403020100
Chromite grade, in percent Cr2O3
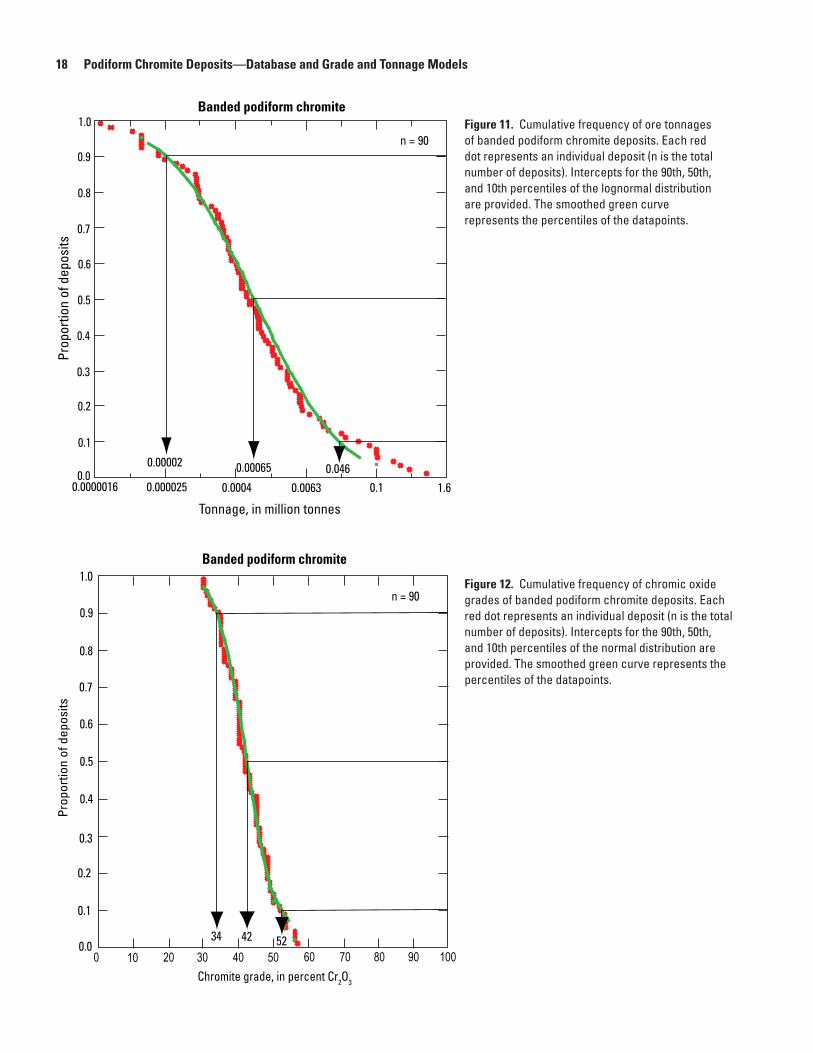
Figure 11. Cumulative frequency of ore tonnages of banded podiform chromite deposits. Each red dot represents an individual deposit (n is the total number of deposits). Intercepts for the 90th, 50th, and 10th percentiles of the lognormal distribution are provided. The smoothed green curve represents the percentiles of the datapoints.
Figure 12. Cumulative frequency of chromic oxide grades of banded podiform chromite deposits. Each red dot represents an individual deposit (n is the total number of deposits). Intercepts for the 90th, 50th, and 10th percentiles of the normal distribution are provided. The smoothed green curve represents the percentiles of the datapoints.
Preliminary Analysis 19
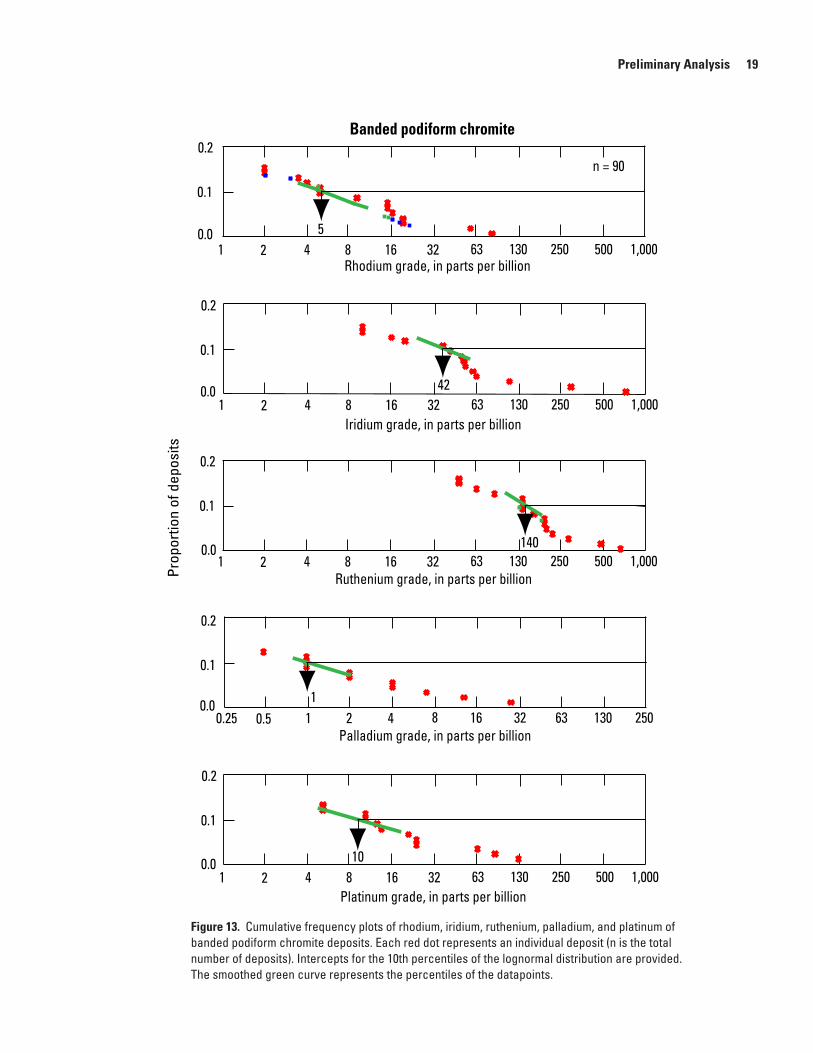
Figure 13. Cumulative frequency plots of rhodium, iridium, ruthenium, palladium, and platinum of banded podiform chromite deposits. Each red dot represents an individual deposit (n is the total number of deposits). Intercepts for the 10th percentiles of the lognormal distribution are provided. The smoothed green curve represents the percentiles of the datapoints.
0.2
0.1
0.0
0.2
0.1
0.0
0.2
0.1
0.0
0.2
0.1
0.0
0.2
0.1
0.0
Prop
ortio
n of
dep
osits
Banded podiform chromite
5
n = 90
42
140
10
1
63 1,000130 250 50032168421
63 1,000130 250 50032168421
63 1,000130 250 50032168421
16 25032 63 13084210.50.25
63 1,000130 250 50032168421
Iridium grade, in parts per billion
Ruthenium grade, in parts per billion
Palladium grade, in parts per billion
Platinum grade, in parts per billion
Rhodium grade, in parts per billion
20 Podiform Chromite Deposits—Database and Grade and Tonnage Models
the observation that there is no correlation with size. Stowe (1987a) proposed that this may be caused by the tendency for chromite bodies to be clustered into small areas of the ophiolite complexes, leaving large areas of the complexes barren.
ConclusionsThe use of three grade and tonnage models for podiform
chromite deposits in resource assessments can be applied to a range of geologic settings. On most regional-scale maps, the permissive host unit will likely be alpine ultramafic rocks (ophiolites) or serpentine. Preferably, if the ultramafic units are differentiated, the permissive unit will be peridotite or dunite. The major and minor podiform chromite deposits occur in similar tectonic settings (suprasubduction, midocean ridge, or off-ridge), the only difference being the size of the podiform chromite deposits. The reason is not known for the difference in sizes of these deposits, but deposits of similar size tend to occur together on a regional scale, such as for the smaller deposits in the California and Oregon Coast Ranges and in the Appalachian range. We might speculate that the size difference is due to the different conditions favorable for chromite crystallization, the duration of the ore-forming pro-cess, the degree of deformation of the hosting rocks, or some combination of these. Further investigations will be neces-sary to determine the reason for the size differences. It is not necessary to interpret the tectonic setting or ophiolite zone for deposits in the major and minor podiform chromite mod-els, except that the ultramafic rocks should originate from the oceanic crust. But if the tectonic setting and ophiolite zone are known, table 2 may be used to determine which model is most appropriate for the geology.
The banded podiform chromite deposits modeled here, however, are all from the suprasubduction setting, and therefore that model can be applied to permissive rocks in the suprasu-bduction zone. The different parts of the suprasubduction zone, that is, forearc, intra-arc, and backarc, are not distinguished here. Although a small number of banded podiform chromite deposits are known to occur in midocean ridge settings, there are not enough of them to create a grade-tonnage model. The banded podiform chromite model can be used for the midocean ridge settings because the tonnages and grades for the midocean ridge banded podiform chromite deposits do fit on the grade and tonnage curves. No banded podiform chromite deposits were found in the off-ridge settings, so they could not be modeled in this study.
In summary, the major or minor podiform chromite models can be used for any ophiolite complex, regardless of its tectonic origin. The difference between the two models is in the expected size of the podiform chromite deposits, which may be based on assumptions about the ore-forming process or degree of deformation. The banded podiform chromite model can be used for ophiolite complexes formed in suprasubduction zones or at midocean ridges. These grade and tonnage models can be used to estimate the grades and
tonnages of undiscovered deposits that may occur in their respective geologic environments.
Explanation of Data FieldsThe data on podiform chromite deposits are contained
in a FileMaker Pro 9 file “podiform_chromite_database.fp9”, Excel 11.6.5 file “podiform_chromite_database.xls”, and tab-delineated text files “podiform_chromite_database.tab” and “podiform_chromite_locations.tab”. The text and Excel formats are made available for those who may not have access to FileMaker Pro software. In addition, the file “podiform_chromite_locations.kmz” allows locations of all deposits to be plotted in Google Earth and the “podiform_chromite_loca-tions.tab” may be used to plot locations in other GIS applica-tions. The fields in the database are described below.
Deposit Name—The most recent deposit name, “NameDeposit,” is used. There is another field, “Other-Names,” which contains alternative names that have been used for the deposit. A third field, “Includes,” provides the names of deposits that have been combined with the primary deposit as a result of the 100-m minimum separation rule.
Location—Twelve fields are provided for the deposit’s location. “Country” and “StateProvince” are used for general locations. “CountryCode” is an abbreviated version of the country information (see appendix B). Degrees, minutes, and, in some cases, seconds of longitude and latitude are provided in the separate fields. From these, decimal degrees of latitude (“LatitudeDecimal”) and longitude (“LongitudeDecimal”) are calculated. Southern latitudes and western longitudes are negative values. Accuracy of location (“LocationAcc”) is qualified at three levels: Accurate, Approximate, or Uncer-tain. Accurate is a verified point location based on a surface mine, tailings, or surface disturbance supported by detailed map location. Approximate is for a general location given by description or from a large-scale map or where exact surface indications could not be found, but it is reasonably certain that it is very near the target location. Uncertain designates a location (center point) within an ultramafic body or a geo-graphic area in which the deposit occurs, but its exact loca-tion is unknown; it also can be an unverified mine, tailings, or surface disturbance. Blanks indicate no information available.
Activity—If the discovery date is known it is recorded in the “DiscoveryDate” field. If the start date of mining or production is known, it is listed in the “StartupDate” field.
Grade and Tonnage—Data gathered for each deposit include average grade of each metal of possible economic interest and the associated tonnage based on the total produc-tion, reserves, and resources at the lowest possible cutoff grade. All further references to tonnage follow this definition. All tonnages reported here (“Tonnage”) are in millions of metric tons (tonnes). Chromic oxide (“ChromicOxideGrade”) grades are reported as a percentage of the metal. Rhodium (“RhodiumGrade”), iridium (“IridiumGrade”), ruthenium (“RutheniumGrade”), palladium (“PalladiumGrade”), and platinum (“PlatinumGrade”) grades are reported as grams per
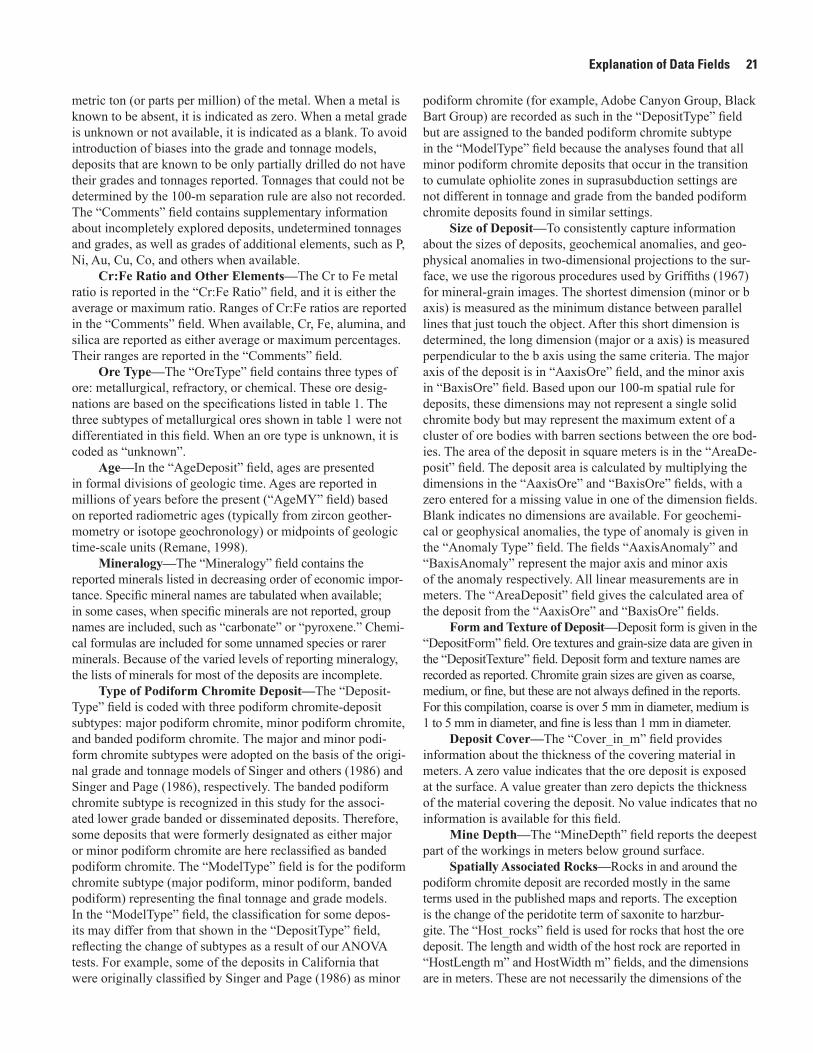
Explanation of Data Fields 21
metric ton (or parts per million) of the metal. When a metal is known to be absent, it is indicated as zero. When a metal grade is unknown or not available, it is indicated as a blank. To avoid introduction of biases into the grade and tonnage models, deposits that are known to be only partially drilled do not have their grades and tonnages reported. Tonnages that could not be determined by the 100-m separation rule are also not recorded. The “Comments” field contains supplementary information about incompletely explored deposits, undetermined tonnages and grades, as well as grades of additional elements, such as P, Ni, Au, Cu, Co, and others when available.
Cr:Fe Ratio and Other Elements—The Cr to Fe metal ratio is reported in the “Cr:Fe Ratio” field, and it is either the average or maximum ratio. Ranges of Cr:Fe ratios are reported in the “Comments” field. When available, Cr, Fe, alumina, and silica are reported as either average or maximum percentages. Their ranges are reported in the “Comments” field.
Ore Type—The “OreType” field contains three types of ore: metallurgical, refractory, or chemical. These ore desig-nations are based on the specifications listed in table 1. The three subtypes of metallurgical ores shown in table 1 were not differentiated in this field. When an ore type is unknown, it is coded as “unknown”.
Age—In the “AgeDeposit” field, ages are presented in formal divisions of geologic time. Ages are reported in millions of years before the present (“AgeMY” field) based on reported radiometric ages (typically from zircon geother-mometry or isotope geochronology) or midpoints of geologic time-scale units (Remane, 1998).
Mineralogy—The “Mineralogy” field contains the reported minerals listed in decreasing order of economic impor-tance. Specific mineral names are tabulated when available; in some cases, when specific minerals are not reported, group names are included, such as “carbonate” or “pyroxene.” Chemi-cal formulas are included for some unnamed species or rarer minerals. Because of the varied levels of reporting mineralogy, the lists of minerals for most of the deposits are incomplete.
Type of Podiform Chromite Deposit—The “Deposit-Type” field is coded with three podiform chromite-deposit subtypes: major podiform chromite, minor podiform chromite, and banded podiform chromite. The major and minor podi-form chromite subtypes were adopted on the basis of the origi-nal grade and tonnage models of Singer and others (1986) and Singer and Page (1986), respectively. The banded podiform chromite subtype is recognized in this study for the associ-ated lower grade banded or disseminated deposits. Therefore, some deposits that were formerly designated as either major or minor podiform chromite are here reclassified as banded podiform chromite. The “ModelType” field is for the podiform chromite subtype (major podiform, minor podiform, banded podiform) representing the final tonnage and grade models. In the “ModelType” field, the classification for some depos-its may differ from that shown in the “DepositType” field, reflecting the change of subtypes as a result of our ANOVA tests. For example, some of the deposits in California that were originally classified by Singer and Page (1986) as minor
podiform chromite (for example, Adobe Canyon Group, Black Bart Group) are recorded as such in the “DepositType” field but are assigned to the banded podiform chromite subtype in the “ModelType” field because the analyses found that all minor podiform chromite deposits that occur in the transition to cumulate ophiolite zones in suprasubduction settings are not different in tonnage and grade from the banded podiform chromite deposits found in similar settings.
Size of Deposit—To consistently capture information about the sizes of deposits, geochemical anomalies, and geo-physical anomalies in two-dimensional projections to the sur-face, we use the rigorous procedures used by Griffiths (1967) for mineral-grain images. The shortest dimension (minor or b axis) is measured as the minimum distance between parallel lines that just touch the object. After this short dimension is determined, the long dimension (major or a axis) is measured perpendicular to the b axis using the same criteria. The major axis of the deposit is in “AaxisOre” field, and the minor axis in “BaxisOre” field. Based upon our 100-m spatial rule for deposits, these dimensions may not represent a single solid chromite body but may represent the maximum extent of a cluster of ore bodies with barren sections between the ore bod-ies. The area of the deposit in square meters is in the “AreaDe-posit” field. The deposit area is calculated by multiplying the dimensions in the “AaxisOre” and “BaxisOre” fields, with a zero entered for a missing value in one of the dimension fields. Blank indicates no dimensions are available. For geochemi-cal or geophysical anomalies, the type of anomaly is given in the “Anomaly Type” field. The fields “AaxisAnomaly” and “BaxisAnomaly” represent the major axis and minor axis of the anomaly respectively. All linear measurements are in meters. The “AreaDeposit” field gives the calculated area of the deposit from the “AaxisOre” and “BaxisOre” fields.
Form and Texture of Deposit—Deposit form is given in the “DepositForm” field. Ore textures and grain-size data are given in the “DepositTexture” field. Deposit form and texture names are recorded as reported. Chromite grain sizes are given as coarse, medium, or fine, but these are not always defined in the reports. For this compilation, coarse is over 5 mm in diameter, medium is 1 to 5 mm in diameter, and fine is less than 1 mm in diameter.
Deposit Cover—The “Cover_in_m” field provides information about the thickness of the covering material in meters. A zero value indicates that the ore deposit is exposed at the surface. A value greater than zero depicts the thickness of the material covering the deposit. No value indicates that no information is available for this field.
Mine Depth—The “MineDepth” field reports the deepest part of the workings in meters below ground surface.
Spatially Associated Rocks—Rocks in and around the
podiform chromite deposit are recorded mostly in the same terms used in the published maps and reports. The exception is the change of the peridotite term of saxonite to harzbur-gite. The “Host_rocks” field is used for rocks that host the ore deposit. The length and width of the host rock are reported in “HostLength m” and HostWidth m” fields, and the dimensions are in meters. These are not necessarily the dimensions of the
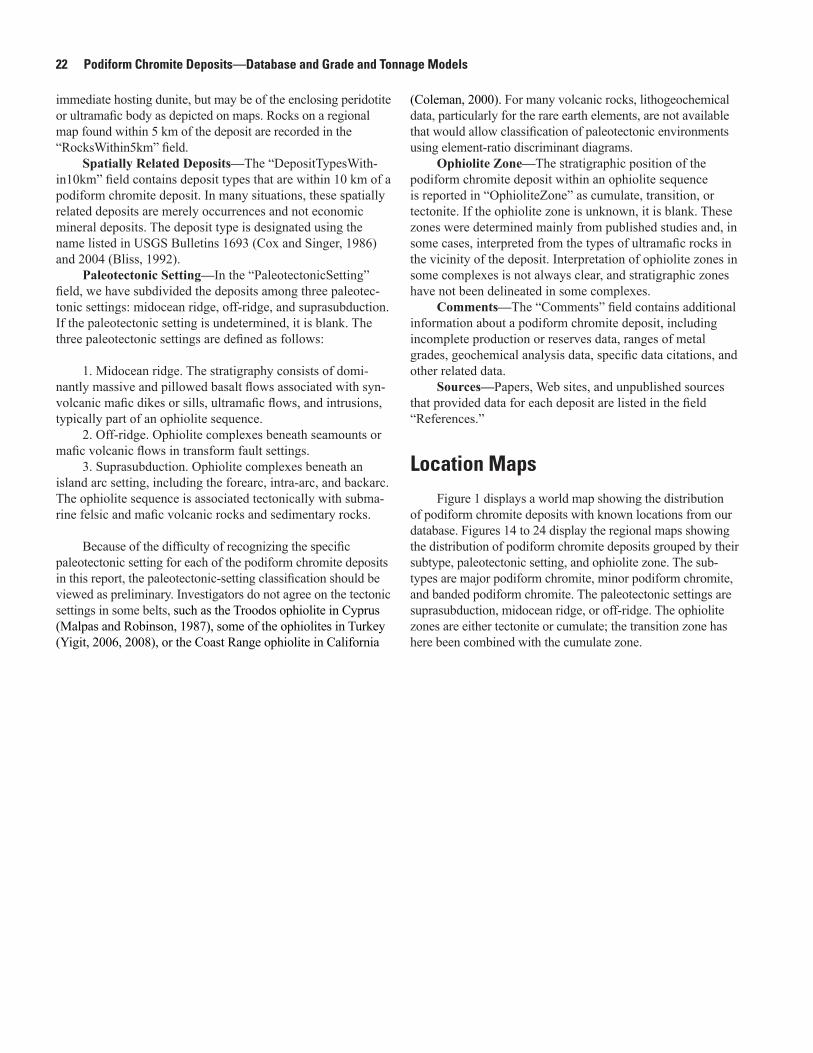
22 Podiform Chromite Deposits—Database and Grade and Tonnage Models
immediate hosting dunite, but may be of the enclosing peridotite or ultramafic body as depicted on maps. Rocks on a regional map found within 5 km of the deposit are recorded in the “RocksWithin5km” field.
Spatially Related Deposits—The “DepositTypesWith-in10km” field contains deposit types that are within 10 km of a podiform chromite deposit. In many situations, these spatially related deposits are merely occurrences and not economic mineral deposits. The deposit type is designated using the name listed in USGS Bulletins 1693 (Cox and Singer, 1986) and 2004 (Bliss, 1992).
Paleotectonic Setting—In the “PaleotectonicSetting” field, we have subdivided the deposits among three paleotec-tonic settings: midocean ridge, off-ridge, and suprasubduction. If the paleotectonic setting is undetermined, it is blank. The three paleotectonic settings are defined as follows:
1. Midocean ridge. The stratigraphy consists of domi-nantly massive and pillowed basalt flows associated with syn-volcanic mafic dikes or sills, ultramafic flows, and intrusions, typically part of an ophiolite sequence.
2. Off-ridge. Ophiolite complexes beneath seamounts or mafic volcanic flows in transform fault settings.
3. Suprasubduction. Ophiolite complexes beneath an island arc setting, including the forearc, intra-arc, and backarc. The ophiolite sequence is associated tectonically with subma-rine felsic and mafic volcanic rocks and sedimentary rocks.
Because of the difficulty of recognizing the specific paleotectonic setting for each of the podiform chromite deposits in this report, the paleotectonic-setting classification should be viewed as preliminary. Investigators do not agree on the tectonic settings in some belts, such as the Troodos ophiolite in Cyprus (Malpas and Robinson, 1987), some of the ophiolites in Turkey (Yigit, 2006, 2008), or the Coast Range ophiolite in California
(Coleman, 2000). For many volcanic rocks, lithogeochemical data, particularly for the rare earth elements, are not available that would allow classification of paleotectonic environments using element-ratio discriminant diagrams.
Ophiolite Zone—The stratigraphic position of the podiform chromite deposit within an ophiolite sequence is reported in “OphioliteZone” as cumulate, transition, or tectonite. If the ophiolite zone is unknown, it is blank. These zones were determined mainly from published studies and, in some cases, interpreted from the types of ultramafic rocks in the vicinity of the deposit. Interpretation of ophiolite zones in some complexes is not always clear, and stratigraphic zones have not been delineated in some complexes.
Comments—The “Comments” field contains additional information about a podiform chromite deposit, including incomplete production or reserves data, ranges of metal grades, geochemical analysis data, specific data citations, and other related data.
Sources—Papers, Web sites, and unpublished sources that provided data for each deposit are listed in the field “References.”
Location MapsFigure 1 displays a world map showing the distribution
of podiform chromite deposits with known locations from our database. Figures 14 to 24 display the regional maps showing the distribution of podiform chromite deposits grouped by their subtype, paleotectonic setting, and ophiolite zone. The sub-types are major podiform chromite, minor podiform chromite, and banded podiform chromite. The paleotectonic settings are suprasubduction, midocean ridge, or off-ridge. The ophiolite zones are either tectonite or cumulate; the transition zone has here been combined with the cumulate zone.
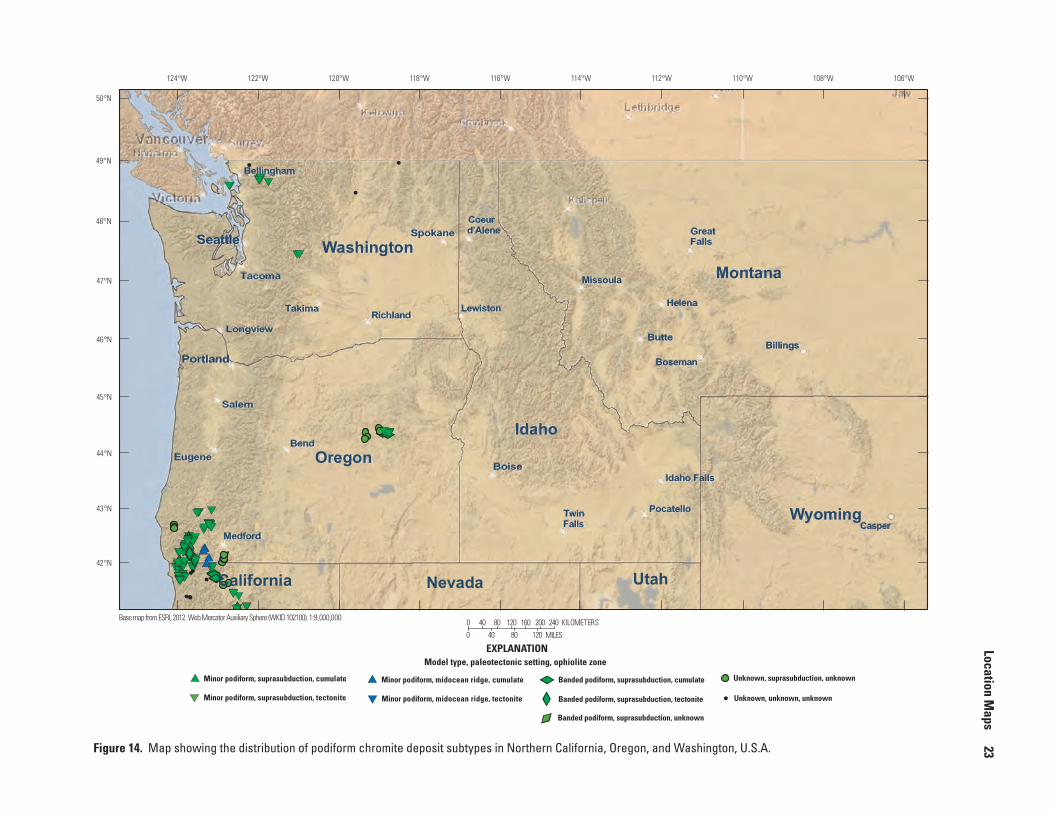
Location Maps
23
WashingtonMontana
Wyoming
Idaho
Oregon
Nevada UtahCalifornia
106°W108°W110°W112°W114°W116°W118°W120°W122°W124°W
50°N
49°N
48°N
47°N
46°N
45°N
44°N
43°N
42°N
120
120 MILES
160 200 24080
80
40
40
0
0
KILOMETERSBase map from ESRI, 2012. Web Mercator Auxiliary Sphere (WKID 102100). 1:9,000,000
EXPLANATION
Minor podiform, suprasubduction, cumulate
Minor podiform, suprasubduction, tectonite Minor podiform, midocean ridge, tectonite
Banded podiform, suprasubduction, cumulate
Banded podiform, suprasubduction, tectonite
Banded podiform, suprasubduction, unknown
Unknown, suprasubduction, unknown
Unknown, unknown, unknown
Minor podiform, midocean ridge, cumulate
Medford
Eugene
Bellingham
Portland
Salem
Longview
Tacoma
RichlandTakima Lewiston
Boise
TwinFalls
Idaho Falls
Pocatello
Casper
Billings
Boseman
Helena
Butte
Missoula
GreatFalls
CoeurSpokaneSeattle
Bend
d’Alene
Model type, paleotectonic setting, ophiolite zone
Figure 14. Map showing the distribution of podiform chromite deposit subtypes in Northern California, Oregon, and Washington, U.S.A.
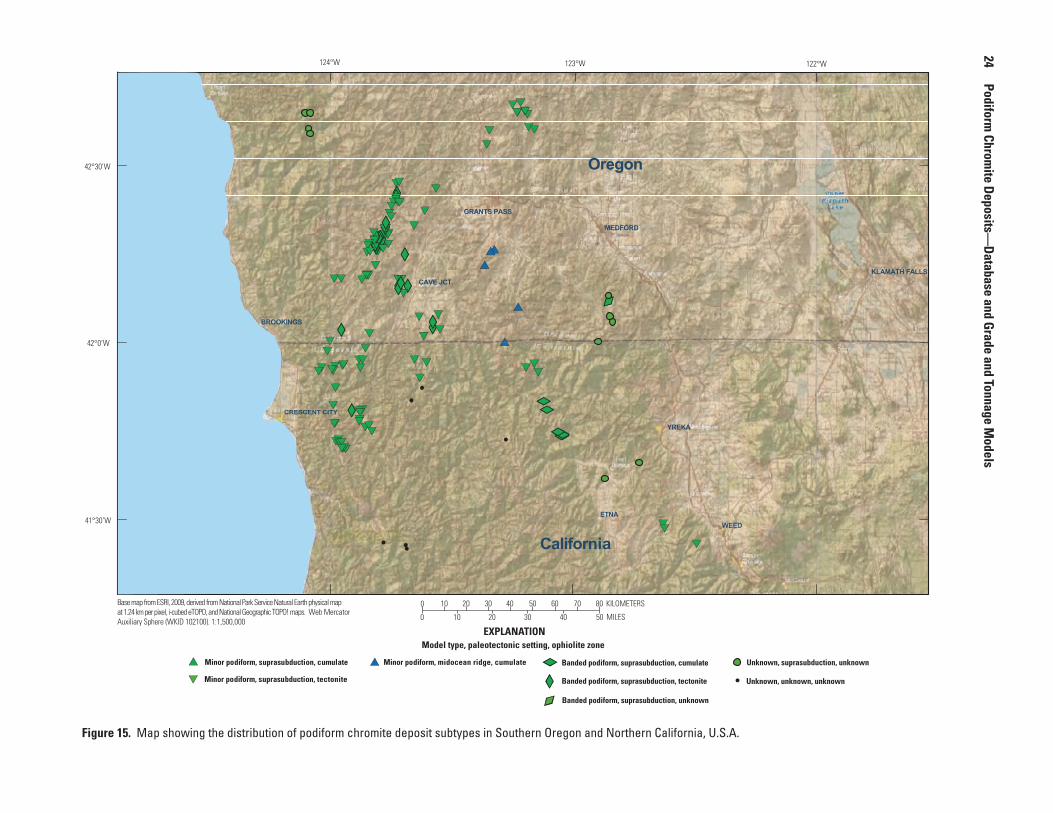
24 Podiform
Chromite Deposits—
Database and Grade and Tonnage Models
124°W 123°W 122°W
42°30’W
41°30’W
42°0’W
10
10
20
20
30
30
40
40
50
50 MILES
60 70 80 KILOMETERS0
0
Base map from ESRI, 2009, derived from National Park Service Natural Earth physical map at 1.24 km per pixel, i-cubed eTOPO, and National Geographic TOPO! maps. Web MercatorAuxiliary Sphere (WKID 102100). 1:1,500,000
EXPLANATION
Oregon
CaliforniaWEED
ETNA
YREKA
MEDFORD
KLAMATH FALLS
GRANTS PASS
BROOKINGS
CAVE JCT.
CRESCENT CITY
Minor podiform, suprasubduction, cumulate
Minor podiform, suprasubduction, tectonite
Minor podiform, midocean ridge, cumulate Banded podiform, suprasubduction, cumulate
Banded podiform, suprasubduction, tectonite
Banded podiform, suprasubduction, unknown
Unknown, suprasubduction, unknown
Unknown, unknown, unknown
Model type, paleotectonic setting, ophiolite zone
Figure 15. Map showing the distribution of podiform chromite deposit subtypes in Southern Oregon and Northern California, U.S.A.
Location Maps
25116°W118°W120°W122°W124°W126°W
41°N
40°N
39°N
38°N
37°N
36°N
35°N0
40
40
0
80
80
120
120 160
200
200 MILES
240 280 KILOMETERS160Base map from ESRI, 2012. Web Mercator Auxiliary Sphere (WKID 102100). 1:5,500,000
EXPLANATION
Fairfield
Antioch
Livermore Modesto
Stockton
Napa
Redding
Chico
Eureka
Santa Rosa
San Francisco
San Jose
Fremont
Concord
Vacaville
Santa Cruz Fresno
Visalia
BakersfieldSan Luis Obispo
Santa Maria
Sacramento
Carson City
Reno
Elko
California
Nevada
Model type, paleotectonic setting, ophiolite zone
Minor podiform, suprasubduction, cumulate
Minor podiform, suprasubduction, tectonite
Minor podiform, suprasubduction, unknown
Minor podiform, midocean ridge, cumulate
Minor podiform, off-ridge, tectonite
Minor podiform, off-ridge, cumulate
Banded podiform, suprasubduction, cumulate
Banded podiform, suprasubduction, unknown
Unknown, suprasubduction, unknown
Unknown, unknown, unknown
Unknown, unknown, tectonite
Figure 16. Map showing the distribution of podiform chromite deposit subtypes in Central California, U.S.A.

26 Podiform
Chromite Deposits—
Database and Grade and Tonnage Models
Pennsylvania
New Jersey
Indiana
Ohio
District of ColumbiaDelaware
West Virginia
Maryland
KentuckyVirginia
North Carolina
Tennessee
AlabamaGeorgia
South Carolina
74°W76°W78°W80°W82°W84°W86°W
40°N
39°N
38°N
37°N
36°N
35°N
34°N
33°N
0
0
40
40
80
80
120
120
160
160 MILES
200 280 KILOMETERS240Base map from ESRI, 2012. Web Mercator Auxiliary Sphere (WKID 102100). 1:6,500,000
EXPLANATION
Asheville
Greenville
Athens
Chattanooga
Atlanta
Birmingham
Huntsville
Augusta
Charlotte
Winston-SalemGreenshore
Annapolis
Dover
Philadelphia
Harrisburg
Baltimore
Harrisonburg
Staunton
LynchburgRoanoke
Blacksburg
Charleston
Richmond
Atlantic City
Toms River
Trenton
Johnson City
Bristol
Kingsport
Knoxville
Minor podiform, suprasubduction, tectonite Banded podiform, suprasubduction, cumulate
Model type, paleotectonic setting, ophiolite zone
Figure 17. Map showing the distribution of podiform chromite deposit subtypes in Pennsylvania, Maryland, North Carolina, and Georgia, U.S.A.

Location Maps
27
Alaska
134°W136°W138°W140°W142°W144°W146°W148°W150°W152°W154°W156°W158°W160°W162°W164°W166°W168°W170°W172°W174°W176°W69°N
68°N
67°N
66°N
65°N
64°N
63°N
62°N
61°N
60°N
59°N
58°N
57°N
0
0
200
200
300
300
500
500
600
600 MILES
700 900 1,000 KILOMETERS800400
400
100
100
Base map from ESRI, 2012. Web Mercator Auxiliary Sphere (WKID 102100). 1:20,000,000
EXPLANATION
Minor podiform, midocean ridge, tectonite
Minor podiform, midocean ridge, cumulate Minor podiform, suprasubduction, cumulate
Minor podiform, suprasubduction, tectonite
Banded podiform, suprasubduction, cumulate
Banded podiform, suprasubduction, tectonite
Unknown, midocean ridge, cumulate
Unknown, midocean ridge, tectonite
Model type, paleotectonic setting, ophiolite zone
Figure 18. Map showing the distribution of podiform chromite deposit subtypes in Alaska, U.S.A.
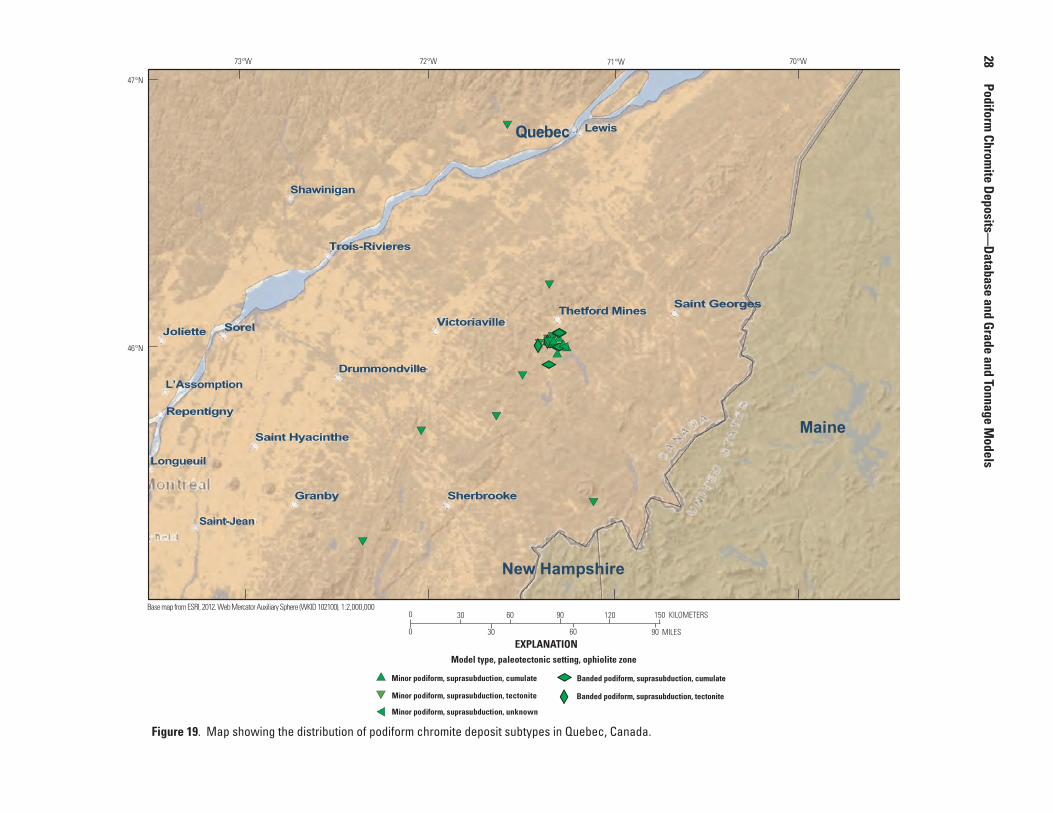
28 Podiform
Chromite Deposits—
Database and Grade and Tonnage Models
Maine
New Hampshire
70°W72°W 71°W73°W
47°N
46°N
0
0
30
30
60
60
90
90 MILES
120 150 KILOMETERSBase map from ESRI, 2012. Web Mercator Auxiliary Sphere (WKID 102100). 1:2,000,000
EXPLANATION
Sherbrooke
Thetford Mines Saint GeorgesVictoriaville
Drummondville
Trois-Rivieres
Shawinigan
Lewis
Sorel
Saint Hyacinthe
Granby
Saint-Jean
Longueuil
Repentigny
L’Assomption
Joliette
Quebec
Model type, paleotectonic setting, ophiolite zone
Minor podiform, suprasubduction, cumulate
Minor podiform, suprasubduction, tectonite
Minor podiform, suprasubduction, unknown
Banded podiform, suprasubduction, cumulate
Banded podiform, suprasubduction, tectonite
Figure 19. Map showing the distribution of podiform chromite deposit subtypes in Quebec, Canada.

Location Maps
295 2 °W5 4 °W5 6 °W5 8 °W6 0 °W6 2 °W6 4 °W
5 1 °N
5 0 °N
4 9 °N
4 8 °N
4 7 °N
0
0 40 80 120 160 200 240 280 320 360
40 80 120 160 200 MILES
KILOMETERS
EXPLANATIONModel type, paleotectonic setting, ophiolite zone
Major podiform, midocean ridge, tectonite
Base map from ESRI, 2012. Web Mercator Auxiliary Sphere (WKID 102100). 1:6,000,000
Newfoundland and LabradorStephenville
Gaspe
Lac Allard
Saint Augustin
Saint Pierre
Marystown
Bay RobertsSaint John’s
Corner Brook
Figure 20. Map showing the distribution of podiform chromite deposit subtypes in Newfoundland, Canada.
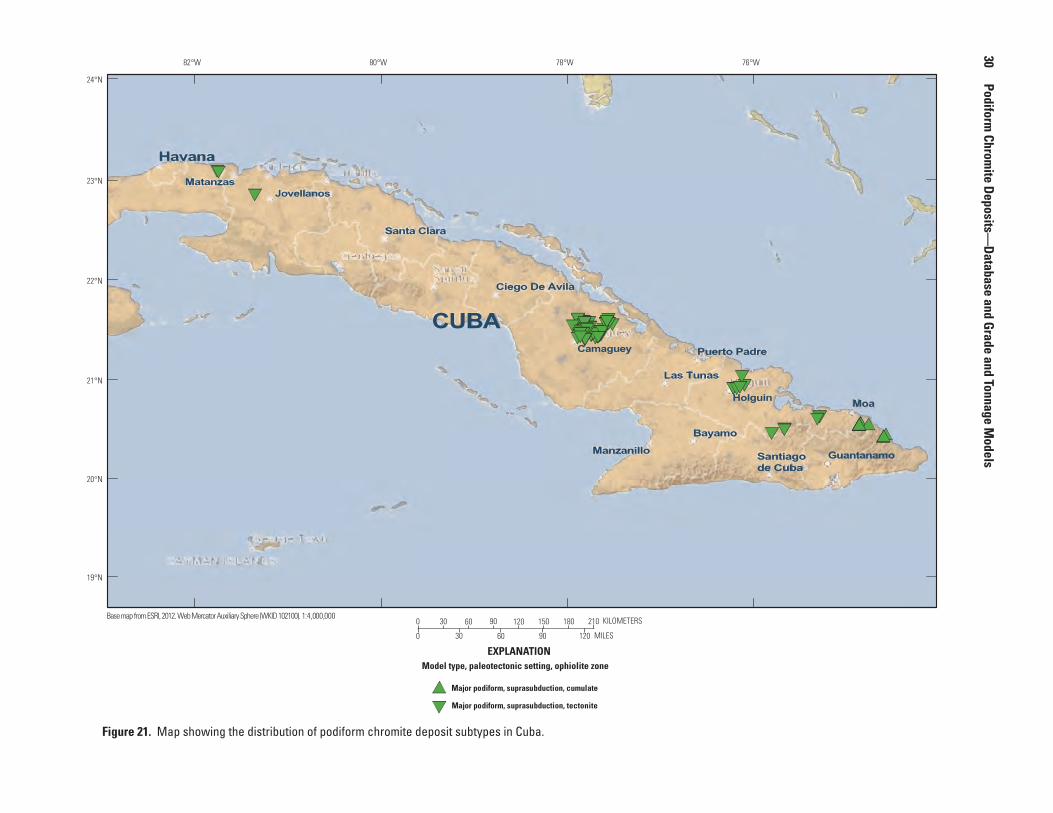
30 Podiform
Chromite Deposits—
Database and Grade and Tonnage Models
76°W78°W80°W82°W
24°N
23°N
22°N
21°N
20°N
19°N
0
0
30
30
60
60
90
90
120
120 MILES
150 180 210 KILOMETERSBase map from ESRI, 2012. Web Mercator Auxiliary Sphere (WKID 102100). 1:4,000,000
EXPLANATION
CUBA
Las Tunas
Holguin
Bayamo
Manzanillo Santiagode Cuba
Guantanamo
Moa
Camaguey
Ciego De Avila
Jovellanos
Santa Clara
Matanzas
Havana
Puerto Padre
Model type, paleotectonic setting, ophiolite zone
Major podiform, suprasubduction, cumulate
Major podiform, suprasubduction, tectonite
Figure 21. Map showing the distribution of podiform chromite deposit subtypes in Cuba.
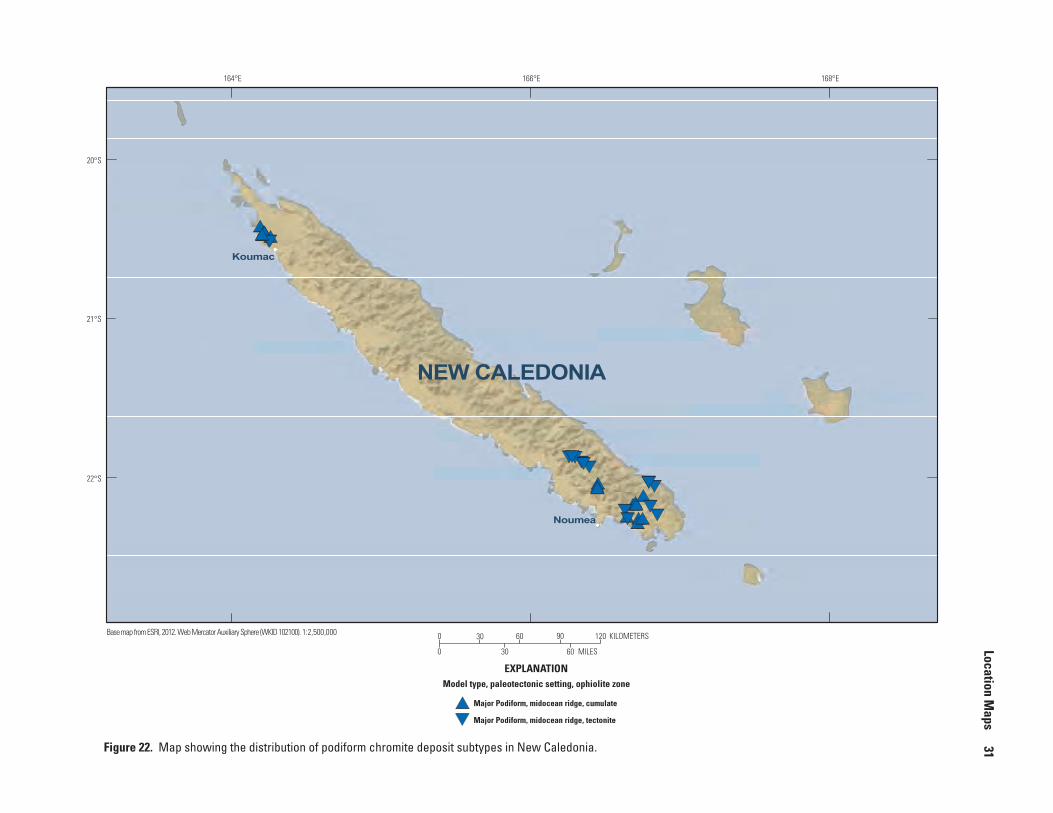
Location Maps
31168°E166°E164°E
20°S
21°S
22°S
0
0
30
30
60
60 MILES
90 120 KILOMETERSBase map from ESRI, 2012. Web Mercator Auxiliary Sphere (WKID 102100). 1:2,500,000
EXPLANATION
Major Podiform, midocean ridge, cumulate
Major Podiform, midocean ridge, tectonite
NEW CALEDONIA
Noumea
Koumac
Model type, paleotectonic setting, ophiolite zone
Figure 22. Map showing the distribution of podiform chromite deposit subtypes in New Caledonia.

32 Podiform
Chromite Deposits—
Database and Grade and Tonnage Models
World m
ap showing the distribution of podiform
chromite
deposits (green dots) used in this study. Country outlines shown
for reference.
Specifications for chromite ore com
piled from D
eYoung and others (1984), H
arben (2004), and U.S. B
usiness and Defense
Services Adm
inistration (1962).
Geologic m
ap of the Masinloc m
ine, Zambales Province,
Philippines, showing the chrom
ite ore bodies (solid black), with
identifying names or num
bers, grouped into chromite deposits
(red outline) based on the 100-meter rule. Chrom
ite ore bodies at depth are projected to the surface. M
odified after Sulit (1967).
Generalized stratigraphic colum
n of an ophiolite sequence show
ing the zones with their lithologies and the distribution of
podiform chrom
ite (black blebs) (modified after D
ickey, 1975; Laurent and Kacira, 1987; and Leblanc, 1987).
Box plots of deposit tonnages by podiform
chromite deposit
subtypes. Dots are values for individual deposits. M
edian value is the center line of box, 25th and 75th quartiles are top and bottom
of box, the upper line is the 100%
percentile, the lower line is the
0% percentile, and the blue line is the grand m
ean.
Summ
ary of correlations of tonnages and grades grouped by podiform
chromite subtypes. First num
ber is the correlation coefficient (show
n as positive or negative correlations), second is the num
ber of deposits. Correlations significant at the 0.01 level are show
n in red. N
A m
eans not available.
Cumulative frequency of ore tonnages of m
ajor podiform
chromite deposits. Each red dot represents an individual deposit
(n is the total number of deposits). Intercepts for the 90th, 50th,
and 10th percentiles of the lognormal distribution are provided.
The smoothed green curve represents the percentiles of the
datapoints.
Cumulative frequency of chrom
ic oxide grades of major podiform
chrom
ite deposits. Each red dot represents an individual deposit (n is the total num
ber of deposits). Intercepts for the 90th, 50th, and 10th percentiles of the lognorm
al distribution are provided. The sm
oothed green curve represents the percentiles of the datapoints.
Cumulative frequency plots of rhodium
, iridium, ruthenium
, palladium
, and platinum grades of m
ajor podiform chrom
ite deposits (n is the total num
ber of deposits). Each red dot represents an individual deposit. Intercepts 10th percentiles of the lognorm
al distribution are provided. The smoothed green
curve represents the percentiles of the datapoints.
Cumulative frequency of ore tonnages of m
inor podiform
chromite deposits. Each red dot represents an individual deposit
(n is the total number of deposits). Intercepts for the 50th and
10th percentiles of the lognormal distribution are provided.
The smoothed green curve represents the percentiles of the
datapoints.
Cumulative frequency of chrom
ic oxide grades of minor podiform
chrom
ite deposits. Each dot represents an individual deposit. Intercepts for the 50th and 10th percentiles of the lognorm
al distribution are provided. The sm
oothed green curve represents the percentiles of the datapoints.
Cumulative frequency plots of rhodium
, iridium, ruthenium
, palladium
, and platinum grades of m
inor podiform chrom
ite deposits. Each red dot represents an individual deposit (n is the total num
ber of deposits). Intercepts for the 10th percentiles of the lognorm
al distribution are provided. The smoothed green
curve represents the percentiles of the datapoints.
130°E128°E126°E124°E122°E120°E118°E116°E114°E112°E
17°N
16°N
15°N
14°N
13°N
12°N
11°N
10°N
9°N
8°N
7°N
6°N
0
0
60 120 180 240 300 360 420 KILOMETERS
240 MILES18012060
Base map from ESRI, 2012. Web Mercator Auxiliary Sphere (WKID 102100). 1:9,000,000
EXPLANATION
QuezonCity
Davao
Manila
PHILIPPINES
Model type, paleotectonic setting, ophiolite zone
Major Podiform, midocean ridge, tectonite
Major Podiform, off-ridge, cumulate
Major Podiform, suprasubduction, cumulate
Major Podiform, suprasubduction, tectonite
Major Podiform, suprasubduction, unknown
Figure 23. Map showing the distribution of podiform chromite deposit subtypes in the Philippines.

Location Maps
3340°E38°E36°E34°E32°E30°E28°E26°E24°E
42°N
41°N
40°N
39°N
38°N
37°N
36°N
35°N
34°N
0
0
60
60
120
120
180
180
240
240 MILES
300 360 420 KILOMETERSBase map from ESRI, 2012. Web Mercator Auxiliary Sphere (WKID 102100). 1:8,500,000
EXPLANATION
Çorum
Diya
Kayseri
Sakarya
EskisehirKutahya
Usak
Denizli Isparta
Antalya
Aydin
Manisa
Balikesir
Bursa
Kocaeli
Istanbul
EdirneZonguldak
Izmir
Ankara
TURKEY
Konya Kahramanmaras
Seyhan Aintab
Adiyaman
Malatya
Elazig
Sivas
Ordu TrabzonSamsun
Burgas
AleppoAntioch
Al Ladhiqlyah
Hamah
Homs
TripoliLEBANONBeirutSidon
Damascus
Sanhurfa
Ar Raggah
DayrZawr
Nicosia
CYPRUS
Mersin
SYRIAHeraklion
AthensPiraeus
Larisa
GREECE
Thessalonika
Model type, paleotectonic setting, ophiolite zone
Major Podiform, suprasubduction, cumulate
Major Podiform, suprasubduction, tectonite
Major Podiform, suprasubduction, unknown
Banded Podiform, suprasubduction, cumulate
Banded Podiform, suprasubduction, tectonite
Banded Podiform, suprasubduction, unknown
Figure 24. Map showing the distribution of podiform chromite deposit subtypes in Greece, Cyprus, and Turkey.
34 Podiform Chromite Deposits—Database and Grade and Tonnage Models
AcknowledgmentsFor information, data, or discussion on podiform chro-
mite deposits, we thank James D. Bliss, Donald F. Huber, Vic-tor G. Mossotti, Bruce Lipin, Dennis Cox, and Paul Schruben, all of the U.S. Geological Survey, and Antonio N. Apostol, Jr., of the Mines and Geosciences Bureau, Philippines. We appre-ciate the help in locating maps and references from Chuck Wenger, Jon DeBord, and Sharon Sachse of the U.S. Geologi-cal Survey Library. For the reviews and improvements to this paper, we are grateful to Dennis Cox, David Sutphin, Thomas Frost and Peter Stauffer.
References
Akbulut, M., Piskin, Ö., Arai, S., Özgenç, I, and Minareci, F., 2010, Base metal (BM) and platinum-group elements (PGE) mineralogy and geochemistry of the Elmaslar chromite deposit (Denizli, SW Turkey)—Implications for a local BM and PGE enrichment: Ofioliti, v. 35, no. 1, p. 1–20.
Allen , J.E., 1941, Geological investigation of the chromite deposits of California: California Journal of Mines and Geology, v. 37, p. 101–167.
Aydal, D., 1985, Determining two dimensions of a concealed chromite ore by microcomputer modelling of magnetic total field intensity profile: Ankara, Turkey, Maden Tetkik ve Arama Enstitusu (Mineral Research and Exploration Insti-tute of Turkey) Bulletin 105–106, p. 97–122.
Bliss, J.D., ed., 1992, Developments in deposit modeling: U.S. Geological Survey Bulletin 2004, 168 p.
Bloomer, S.H., Taylor, B., MacLeod, C.J., Stern, R.J., Fryer, P., Hawkins, J.W., and Johnson, L., 1995, Early arc vol-canism and the ophiolite problem—A perspective from drilling in the Western Pacific, in Taylor, B., and Natland, J., eds., Active margins and marginal basins of the Western Pacific: American Geophysical Union Geophysical Mono-graph 88, p. 1–30.
Cassard, D., Nicolas, A., Rabinovitch, M., Moutte, J., Leblanc, M., and Prinzhofer, A., 1981, Structural classification of chromite pods in southern New Caledonia: Economic Geology, v. 76, no. 4, p. 805–831.
Choi, S.H., Shervais, J.W., and Mukasa, S.B., 2008, Supra-subduction and abyssal mantle peridotites of the Coast Range ophiolite, California: Contributions to Mineralogy and Petrology, v. 156, p. 551–576.
Christiansen, F.G., 1986, Structural classification of ophiolitic chromite deposits, in Gallagher, M.J., Ixer, R.A., Neary, C.R., and Prichard, H.M., eds., Metallogeny of basic and ultrabasic rocks: London, The Institution of Mining and
Metallurgy, Proceedings of the conference “Metallogeny of basic and ultrabasic rocks,” Edinburgh, Scotland, 9 to 12 April 1985, p. 279–289.
Coleman, R.G., 1971, Plate tectonic emplacement of upper mantle peridotites along continental edges: Journal of Geophysical Research, v. 76, no. 5, p. 1212–1222.
Coleman, R.G., 2000, Prospecting for ophiolites along the California continental margin, in Dilek, Y., Moores, E.M., Elthon, D., and Nicolas, A., eds., Ophiolites and oceanic crust—New insights from field studies and the Ocean Drill-ing Program: Geological Society of America Special Paper 349, p. 351–364.
Cox, D.P., and Singer, D.A., eds., 1986, Mineral deposit mod-els: U.S. Geological Survey Bulletin 1693, 379 p.
Cox, D.P., Barton, P.R., and Singer, D.A., 1986, Introduction, in Cox, D.P., and Singer, D.A., eds., Mineral deposit models: U.S. Geological Survey Bulletin 1693, p. 1–10.
Davis, W.E., Jackson, W.H., and Richter, D.H., 1957, Gravity prospecting for chromite deposits in Camaguey Province, Cuba: Geophysics, v. 22, no. 4, p. 848–869.
DeYoung, J.H., Jr., Lee, M.P., and Lipin, B.R., 1984, Interna-tional strategic minerals inventory summary report—Chro-mium: U.S. Geological Survey Circular 930-B, 41 p.
Dick, H.J.B., and Bullen, T., 1984, Chromian spinel as a petro-genetic indicator in abyssal and alpine-type peridotites and spatially associated lavas: Contributions to Mineralogy and Petrology, v. 86, p. 54–76.
Dickey, J.S., Jr., 1975, A hypothesis of origin for podiform chromite deposits: Geochimica et Cosmochimica Acta, v. 39, p. 1061–1074.
Diller, J.S., 1922, Chromite in the Klamath Mountains, Cali-fornia and Oregon: U.S. Geological Survey Bulletin 725, p. 1–35.
Economou-Eliopoulos, M., 1993, Platinum-group element (PGE) distribution in chromite ores from ophiolite com-plexes of Greece—Implications for chromite exploration: Ofioliti, v. 18, no. 1, p. 83–97.
Economou-Eliopoulos, M., 1996, Platinum-group element distribution in chromite ores from ophiolite complexes—Implications for their exploration: Ore Geology Reviews, v. 22, p. 363–381.
Engin, T., Özkoçak, O., and Artan, Ü., 1987, General geologi-cal setting and character of chromite deposits in Turkey, in Stowe, C.W., ed., Evolution of chromium ore fields: New York, Van Nostrand Reinhold Company, p. 194–219.
Greenbaum, D., 1977, The chromitiferous rocks of the Troo-dos ophiolite complex, Cyprus: Economic Geology, v. 72, p. 1175–1194.
References 35
Griffiths, J.C., 1967, Scientific method in analysis of sediments: New York, McGraw-Hill, 508 p.
Grivas, E., and Rassios, A., 1993, Drilling for “blind” podi-form chromite orebodies at Voidolakkos in the Vourinos Ophiolite Complex, Greece: Economic Geology, v. 88, p. 461–468.
Haeri, Y., 1960, Geology of Iran’s chromite deposits, in Sym-posium on chrome ore, Ankara, Turkey, September 1960: Central Treaty Organization, p. 21–26.
Harben, P.W., 2004, The industrial minerals handbook: Worcester Park, Surrey, UK, Industrial Minerals Information, 412 p.
Hatton, C.J., and Von Gruenewaldt, G., 1987, The geological setting and petrogenesis of the Bushveld chromitite layers, in Stowe, C.W., ed., Evolution of chromium ore fields: New York, Van Nostrand Reinhold Company, p. 109–143.
Johnston, W.D., Jr., 1936, Nodular, orbicular, and banded chromite in northern California: Economic Geology, v. 31, p. 417–427.
Jordt, D.K., 1984, Exploration assessment of the Turkish chro-mite environment: Dallas, Texas, Petrominex, Inc., 29 p.
Kaaden, G., 1959, On relationship between the composition of chromites and their tectonic-magmatic position in peridotite bodies in the SW of Turkey: Ankara, Turkey, Maden Tetkik ve Arama Enstitusu (Mineral Research and Exploration Institute of Turkey) Bulletin 52, p. 1–14.
Kospiri, A., Kosho, P., and Vuksaj, N., 1999, Case histories of the application of geophysical methods to chromite exploration in the Balkans, in Second Balkan Geophysical Congress and Exhibition, July 5-9, 1999, Istanbul: Balkan Geophysical Society, last accessed October 11, 2011, at http://www.balkangeophysoc.gr/menu/congresses/oral/38-40-O7-3-kospiri-alexandre.PDF.
Lago, B.L., Rabinowich, M., and Nicolas, A., 1982, Podiform chromite ore bodies—A genetic model: Journal of Petrol-ogy, v. 23, p. 103–125.
Laurent, R., and Kacira, N., 1987, Chromite deposits in the Appalachian ophiolites, in Stowe, C.W., ed., Evolution of chromium ore fields: New York, Van Nostrand Reinhold Company, p. 169–193.
Leblanc, M., 1987, Chromite in oceanic arc environ-ments—New Caledonia, in Stowe, C.W., ed., Evolution of chromium ore fields: New York, Van Nostrand Reinhold Company, p. 265–296.
Lipin, B.R., 1984, Chromite from the Blue Ridge Province of North Carolina: American Journal of Science, v. 284, nos. 4 and 5, p. 507–529.
Maliotis, G., and Michaelides, A., 1979, The asbestos and chromite mineralizations of the Troodos Plutonic Complex, in Field excursion guidebook, International Ophiolite Sym-posium, Nicosia-Cyprus, 1-8 April 1979: Nicosia, Geologi-cal Survey Department, p. 51–60.
Malpas, J., and Robinson, P.T., 1987, Chromite mineraliza-tion in the Troodos ophiolite, Cyprus, in Stowe, C.W., ed., Evolution of chromium ore fields: New York, Van Nostrand Reinhold Company, p. 220–237.
Maxwell, J.C., 1949, Some occurrences of chromite in New Caledonia: Economic Geology, v. 44, p. 525–544.
McIntosh, F.K., and Mosier, M., 1948, Investigation of Wood chromite mine area, Lancaster County, Pa.: U.S. Bureau of Mines Report of Investigations 4383, 5 p.
Page, N.J, Engin, T., Singer, D.A., and Haffty, J., 1984, Distri-bution of platinum-group elements in the Bati Kef chromite deposit, Guleman-Elazig area, eastern Turkey: Economic Geology, v. 79, p. 177–184.
Paktunc, A.D., 1990, Origin of podiform chromite deposits by multistage melting, melt segregation and magma mixing in the upper mantle: Ore Geology Reviews, v. 5, p. 211–222.
Papp, J.F., 2011, Chromium: U.S. Geological Survey Mineral Commodity Summaries 2011, p. 42, last accessed Septem-ber 20, 2011, at http://minerals.usgs.gov/minerals/pubs/commodity/chromium/mcs-2011-chrom.pdf.
Pearce, J.A., Barker, P.F., Edwards, S.J., Parkinson, I.J., and Leat, P.T., 2000, Geochemistry and tectonic significance of peridotites from the South Sandwich arc-basin system, South Atlantic: Contributions to Mineralogy and Petrology, v. 139, p. 36–53.
Pearre, N.C., and Heyl, A.V., Jr., 1960, Chromite and other mineral deposits in serpentine rocks of the Piedmont upland Maryland, Pennsylvania and Delaware: U.S. Geological Survey Bulletin 1082–K, p. 707–827.
Prichard, H.M., Neary, C.R., Fisher, P.C., and O’Hara, M.J., 2008, PGE-rich podiform chromitites in the Al ‘Ays Ophio-lite Complex, Saudi Arabia—An example of critical mantle melting to extract and concentrate PGE: Economic Geology, v. 103, p. 1507–1529.
Remane, J., 1998, Explanatory note to global stratigraphic chart, in Circular of International Subcommission on Strati-graphic Classification (ISSC) of IUGS Commission on Stra-tigraphy, Appendix B: International Union of Geological Sciences (IUGS) Commission on Stratigraphy, v. 93, 11 p.
Roberts, S., 1988, Ophiolitic chromitite formation—A mar-ginal basin phenomenon?: Economic Geology, v. 82, p. 1034–1036.

36 Podiform Chromite Deposits—Database and Grade and Tonnage Models
Roberts, S., Rassios, A., Wright, L., Vacondios, I., Vrachatis, G., Grivas, E., Nesbitt, R.W., Neary, C.R., Moat, T., and Konstantopolou, L., 1988, Structural controls on the loca-tion and form of the Vourinos chromite deposits, in Bois-sonnas, J., and Omenetto, P., eds., Mineral deposits within the European community: Berlin, Springer-Verlag, p. 249–266.
Rossman, D.L., 1970, Chromite deposits of the north-central Zambales Range, Luzon, Philippines: U.S. Geological Survey Open-File Report 70-281, 65 p.
Rynearson, G.A., 1948, Chromite deposits of Tulare and eastern Fresno counties, California: California Division of Mines Bulletin 134, pt. 3, ch. 3, 104 p.
Sampson, E., 1942, Chromite deposits, in Newhouse, W.H., ed., Ore deposits as related to structural features: Princeton, New Jersey, Princeton University Press, p. 110–125.
Schulte, R.F., Taylor, R.D., Piatak, N.M., and Seal, R.R., II, 2010, Stratiform chromite deposit model: U.S. Geological Survey Open-File Report 2010-1232, 7 p.
Silk, M.H., 1988, World chromite resources and ferrochromium production: Randburg, South Africa, Council for Mineral Technology, Mintek Special Publication no. 11, 149 p.
Singer, D.A., 1994, Conditional estimates of the number of podiform chromite deposits: Nonrenewable Resources, v. 3, no. 3, p. 200–204.
Singer, D.A., and Menzie, W.D., 2010, Quantitative mineral resource assessments—An integrated approach: New York, Oxford University Press, Inc., 219 p.
Singer, D.A., and Page, N.J, 1986, Grade and tonnage model of minor podiform chromite, in Cox, D.P., and Singer, D.A., eds., Mineral deposit models: U.S. Geological Survey Bulletin 1693, p. 34–38.
Singer, D.A., Page, N.J, and Lipin, B.R., 1986, Grade and ton-nage model of major podiform chromite, in Cox, D.P., and Singer, D.A., eds., Mineral deposit models: U.S. Geological Survey Bulletin 1693, p. 38–44.
Stern, R.J., Johnson, P.R., Kröner, A., and Yibas, B., 2004, Neoproterozoic ophiolites of the Arabian-Nubian Shield, in Kusky, T.M., ed., Precambrian ophiolites and related rocks: Elsevier B.V., Developments in Precambrian geology, v. 13, ch. 3, p. 95–128.
Stowe, C.W., 1987a, Summary and Guidelines, in Stowe, C.W., ed., Evolution of chromium ore fields: New York, Van Nostrand Reinhold Company, p. 321–332.
Stowe, C.W., 1987b, The mineral chromite, in Stowe, C.W., ed., Evolution of chromium ore fields: New York, Van Nostrand Reinhold Company, p. 1–22.
Stowe, C.W., 1994, Compositions and tectonic settings of chromite deposits through time: Economic Geology, v. 89, p. 528–546.
Sulit, J.P., 1967, Geophysical exploration and discovery of chromite ore bodies in the Masinloc Mines of Consolidated Mines, Inc.: Geological Society of the Philippines, Pro-ceedings of the Second Geological Convention and First Symposium on the Geology of the Mineral Resources of the Philippines and Neighboring Countries, January 11–14, 1967, v. 1, p. 89–108.
Thayer, T.P., 1946, Preliminary chemical correlation of chro-mite with the containing rocks: Economic Geology, v. 41, p. 202–217.
Thayer, T.P., 1960, Some critical differences between alpine-type and stratiform peridotite-gabbro complexes: Interna-tional Geologic Congress Report, 21st Session, Norden, pt. 13, p. 247–259.
Thayer, T.P., 1961, Application of geology in chromite explo-ration and mining, in Symposium on chrome ore, Ankara, Turkey, September 1960: Central Treaty Organization, p. 197–223.
Thayer, T.P., 1963, Geologic features of podiform chromite deposits, in Woodtli, R., ed., Méthodes de prospection de la chromite (Methods of prospecting for chromite): Proceed-ings of an OECD seminar on modern scientific methods of chromite prospecting, Athens 16–30 April 1963, Organisa-tion de coopération et de Développement Economiques, p. 135–148.
Thayer, T.P., and Ramp, L., 1969, Chromite, in Mineral and water resources of Oregon: Washington, U.S. Government Printing Office, p. 108–116.
Tokay, M., 1960, Chromite in Turkey—Investigations on chrome ore deposits made by the Mineral Research and Exploration Institute of Turkey, in Symposium on chrome ore, Ankara, Turkey, September 1960: Central Treaty Organization, p. 82–91.
U.S. Business and Defense Services Administration, 1962, Materials survey, chromium: U.S. Department of Com-merce, Business and Defense Services Administration, 96 p.
Uysal, I., Zaccarini, F., Sadiklar, M.B., Tarkian, M., Thalham-mer, O.A.R., and Garuti, G., 2009, The podiform chro-mitites in the Dagüplü and Kavak mines, Eskisehir ophiolite (NW Turkey)—Genetic implications of mineralogic and geochemical data: Geologica Acta, v. 7, no. 3, p. 351–362.
Wakabayashi, J., and Dilek, Y., 2000, Spatial and temporal relationships between ophiolites and their metamorphic soles—A test of models of forearc ophiolite genesis, in Dilek, Y., Moores, E.M., Elthon, D., and Nicolas, A., eds., Ophiolites and oceanic crust—New insights from field stud-ies and the Ocean Drilling Program: Geological Society of America Special Paper 349, p. 53–64.

References 37
Wells, F.G., Page, L.R., and James, H.L., 1940, Chromite deposits of the Pilliken area, El Dorado County, California: U.S. Geological Survey Bulletin 922-O, p. 417–460.
Wells, F.G., Cater, F.W., Jr., and Rynearson, G.A., 1946, Chromite deposits of Del Norte County, California: Califor-nia Division of Mines Bulletin 134, pt. 1, ch. 1, 76 p.
Wynn, J.C., and Hasbrouck, W.P., 1984, Geophysical studies of chromite deposits in the Josephine peridotite of north-western California and southwestern Oregon: U.S. Geologi-cal Survey Bulletin 1546-D, p. 65–86.
Yigit, O., 2006, Gold in Turkey—A missing link in Tethyan metallogeny: Ore Geology Reviews, v. 28, no. 2, p. 147–179.
Yigit, O., 2008, Mineral deposits of Turkey in relation to Tethyan metallogeny—Implications for future mineral exploration: Economic Geology, v. 104, no. 1, p. 19–51.
Zengin, Y., 1957, The mode of distribution of chrome ores in Turkey: Ankara, Turkey, Maden Tetkik ve Arama Enstitusu (Mineral Research and Exploration Institute of Turkey) Bulletin 49, p. 84–91.

38 Podiform Chromite Deposits—Database and Grade and Tonnage Models
This page intentionally left blank.

References 39
Appendixes A–B
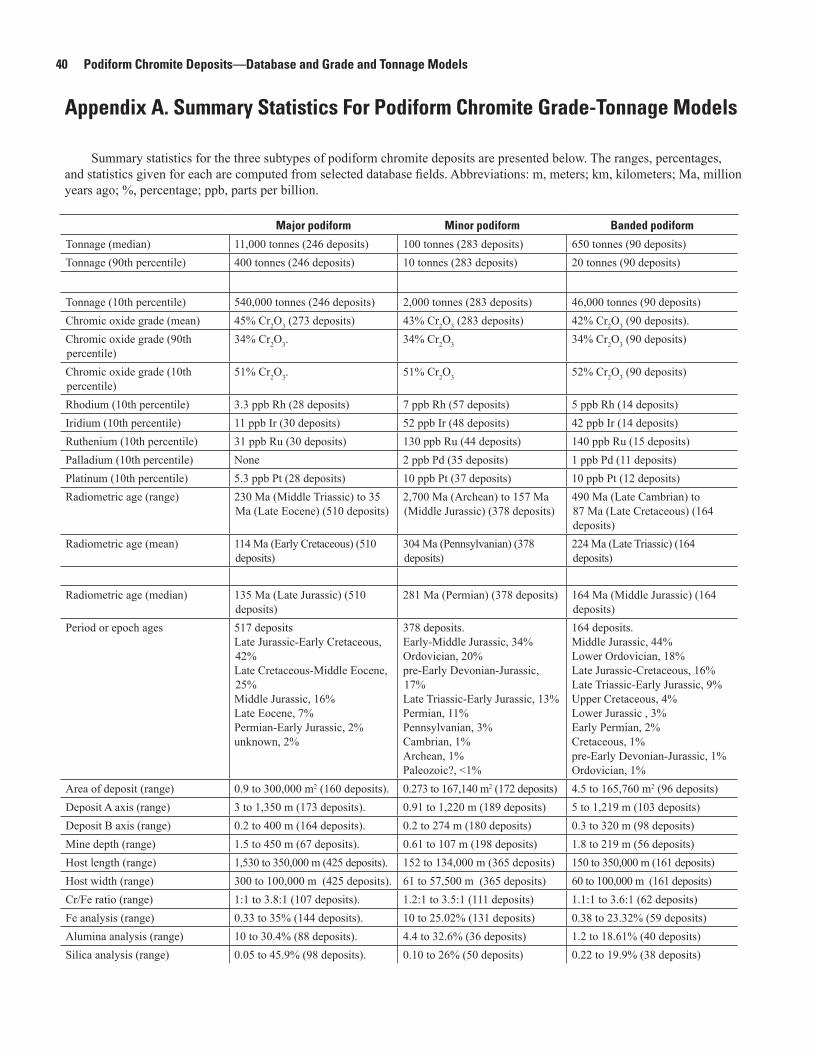
40 Podiform Chromite Deposits—Database and Grade and Tonnage Models
Appendix A. Summary Statistics For Podiform Chromite Grade-Tonnage Models
Summary statistics for the three subtypes of podiform chromite deposits are presented below. The ranges, percentages, and statistics given for each are computed from selected database fields. Abbreviations: m, meters; km, kilometers; Ma, million years ago; %, percentage; ppb, parts per billion.
Major podiform Minor podiform Banded podiform
Tonnage (median) 11,000 tonnes (246 deposits) 100 tonnes (283 deposits) 650 tonnes (90 deposits)Tonnage (90th percentile) 400 tonnes (246 deposits) 10 tonnes (283 deposits) 20 tonnes (90 deposits)
Tonnage (10th percentile) 540,000 tonnes (246 deposits) 2,000 tonnes (283 deposits) 46,000 tonnes (90 deposits)Chromic oxide grade (mean) 45% Cr2O3 (273 deposits) 43% Cr2O3 (283 deposits) 42% Cr2O3 (90 deposits).Chromic oxide grade (90th percentile)
34% Cr2O3. 34% Cr2O3 34% Cr2O3 (90 deposits)
Chromic oxide grade (10th percentile)
51% Cr2O3. 51% Cr2O3 52% Cr2O3 (90 deposits)
Rhodium (10th percentile) 3.3 ppb Rh (28 deposits) 7 ppb Rh (57 deposits) 5 ppb Rh (14 deposits)Iridium (10th percentile) 11 ppb Ir (30 deposits) 52 ppb Ir (48 deposits) 42 ppb Ir (14 deposits)Ruthenium (10th percentile) 31 ppb Ru (30 deposits) 130 ppb Ru (44 deposits) 140 ppb Ru (15 deposits)Palladium (10th percentile) None 2 ppb Pd (35 deposits) 1 ppb Pd (11 deposits)Platinum (10th percentile) 5.3 ppb Pt (28 deposits) 10 ppb Pt (37 deposits) 10 ppb Pt (12 deposits)Radiometric age (range) 230 Ma (Middle Triassic) to 35
Ma (Late Eocene) (510 deposits)2,700 Ma (Archean) to 157 Ma (Middle Jurassic) (378 deposits)
490 Ma (Late Cambrian) to 87 Ma (Late Cretaceous) (164 deposits)
Radiometric age (mean) 114 Ma (Early Cretaceous) (510 deposits)
304 Ma (Pennsylvanian) (378 deposits)
224 Ma (Late Triassic) (164 deposits)
Radiometric age (median) 135 Ma (Late Jurassic) (510 deposits)
281 Ma (Permian) (378 deposits) 164 Ma (Middle Jurassic) (164 deposits)
Period or epoch ages 517 depositsLate Jurassic-Early Cretaceous, 42%Late Cretaceous-Middle Eocene, 25%Middle Jurassic, 16%Late Eocene, 7%Permian-Early Jurassic, 2%unknown, 2%
378 deposits.Early-Middle Jurassic, 34%Ordovician, 20%pre-Early Devonian-Jurassic, 17%Late Triassic-Early Jurassic, 13%Permian, 11%Pennsylvanian, 3%Cambrian, 1%Archean, 1%Paleozoic?, <1%
164 deposits.Middle Jurassic, 44%Lower Ordovician, 18%Late Jurassic-Cretaceous, 16%Late Triassic-Early Jurassic, 9%Upper Cretaceous, 4%Lower Jurassic , 3%Early Permian, 2%Cretaceous, 1%pre-Early Devonian-Jurassic, 1%Ordovician, 1%
Area of deposit (range) 0.9 to 300,000 m2 (160 deposits). 0.273 to 167,140 m2 (172 deposits) 4.5 to 165,760 m2 (96 deposits)Deposit A axis (range) 3 to 1,350 m (173 deposits). 0.91 to 1,220 m (189 deposits) 5 to 1,219 m (103 deposits)Deposit B axis (range) 0.2 to 400 m (164 deposits). 0.2 to 274 m (180 deposits) 0.3 to 320 m (98 deposits)Mine depth (range) 1.5 to 450 m (67 deposits). 0.61 to 107 m (198 deposits) 1.8 to 219 m (56 deposits)Host length (range) 1,530 to 350,000 m (425 deposits). 152 to 134,000 m (365 deposits) 150 to 350,000 m (161 deposits)Host width (range) 300 to 100,000 m (425 deposits). 61 to 57,500 m (365 deposits) 60 to 100,000 m (161 deposits)Cr/Fe ratio (range) 1:1 to 3.8:1 (107 deposits). 1.2:1 to 3.5:1 (111 deposits) 1.1:1 to 3.6:1 (62 deposits)Fe analysis (range) 0.33 to 35% (144 deposits). 10 to 25.02% (131 deposits) 0.38 to 23.32% (59 deposits)Alumina analysis (range) 10 to 30.4% (88 deposits). 4.4 to 32.6% (36 deposits) 1.2 to 18.61% (40 deposits)Silica analysis (range) 0.05 to 45.9% (98 deposits). 0.10 to 26% (50 deposits) 0.22 to 19.9% (38 deposits)
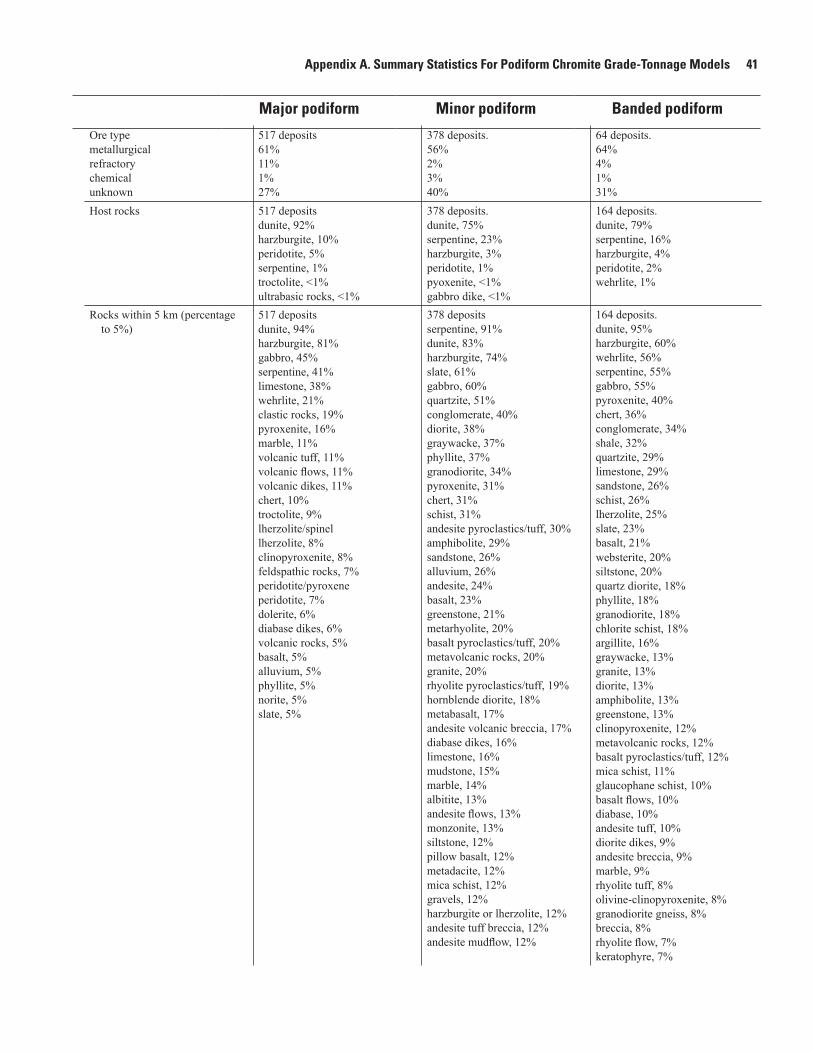
Appendix A. Summary Statistics For Podiform Chromite Grade-Tonnage Models 41
Major podiform Minor podiform Banded podiform
Ore typemetallurgicalrefractorychemicalunknown
517 deposits61%11%1%27%
378 deposits.56%2%3%40%
64 deposits. 64%4%1%31%
Host rocks 517 depositsdunite, 92%harzburgite, 10%peridotite, 5%serpentine, 1%troctolite, <1%ultrabasic rocks, <1%
378 deposits. dunite, 75%serpentine, 23%harzburgite, 3%peridotite, 1%pyoxenite, <1%gabbro dike, <1%
164 deposits. dunite, 79%serpentine, 16%harzburgite, 4%peridotite, 2%wehrlite, 1%
Rocks within 5 km (percentage to 5%)
517 depositsdunite, 94%harzburgite, 81%gabbro, 45%serpentine, 41%limestone, 38%wehrlite, 21% clastic rocks, 19%pyroxenite, 16%marble, 11%volcanic tuff, 11%volcanic flows, 11%volcanic dikes, 11%chert, 10%troctolite, 9%lherzolite/spinellherzolite, 8%clinopyroxenite, 8% feldspathic rocks, 7%peridotite/pyroxeneperidotite, 7%dolerite, 6%diabase dikes, 6% volcanic rocks, 5%basalt, 5%alluvium, 5%phyllite, 5% norite, 5%slate, 5%
378 depositsserpentine, 91%dunite, 83%harzburgite, 74%slate, 61%gabbro, 60%quartzite, 51%conglomerate, 40%diorite, 38%graywacke, 37%phyllite, 37%granodiorite, 34%pyroxenite, 31%chert, 31%schist, 31%andesite pyroclastics/tuff, 30%amphibolite, 29%sandstone, 26%alluvium, 26%andesite, 24%basalt, 23%greenstone, 21%metarhyolite, 20%basalt pyroclastics/tuff, 20%metavolcanic rocks, 20%granite, 20%rhyolite pyroclastics/tuff, 19%hornblende diorite, 18%metabasalt, 17%andesite volcanic breccia, 17%diabase dikes, 16%limestone, 16%mudstone, 15%marble, 14%albitite, 13%andesite flows, 13%monzonite, 13%siltstone, 12%pillow basalt, 12%metadacite, 12%mica schist, 12%gravels, 12%harzburgite or lherzolite, 12%andesite tuff breccia, 12%andesite mudflow, 12%
164 deposits. dunite, 95%harzburgite, 60%wehrlite, 56%serpentine, 55%gabbro, 55%pyroxenite, 40%chert, 36%conglomerate, 34%shale, 32%quartzite, 29%limestone, 29%sandstone, 26%schist, 26%lherzolite, 25%slate, 23%basalt, 21%websterite, 20%siltstone, 20%quartz diorite, 18%phyllite, 18%granodiorite, 18%chlorite schist, 18%argillite, 16%graywacke, 13%granite, 13%diorite, 13%amphibolite, 13%greenstone, 13%clinopyroxenite, 12%metavolcanic rocks, 12%basalt pyroclastics/tuff, 12%mica schist, 11%glaucophane schist, 10%basalt flows, 10%diabase, 10%andesite tuff, 10%diorite dikes, 9%andesite breccia, 9%marble, 9%rhyolite tuff, 8%olivine-clinopyroxenite, 8%granodiorite gneiss, 8%breccia, 8%rhyolite flow, 7%keratophyre, 7%

42 Podiform Chromite Deposits—Database and Grade and Tonnage Models
Rocks within 5 km (percentage to 5%)
amphibole gneiss, 12%hornfels, 11%argillite, 11%quartz diorite, 11%metachert, 11%wehrlite, 10%basalt flows, 10%shale, 10%diabase, 10%rhyolite flows, 9%andesite breccia, 8%trondhjemite, 8%metaconglomerate, 8%tactite, 8%granitic intrusions, 8%mudflow breccia, 7%granulite, 7%claystone, 7%quartz porphyrite, 7%breccia, 7%alaskite, 7%tuff, 6%basalt agglomerate, 6%metagraywacke, 5%metabasalt dikes, 5%metabasalt breccia, 5%trachyte, 5%
hornblende schist, 7%hornblende diorite, 7%andesite flow, 7%amphibole gneiss, 7%tonalite, 6%andesite, 6%volcanic rocks, 5%quartz keratophyre, 5%peridotite, 5%mafic metavolcanic rocks, 5%hornfels, 5%greenschist, 5%graphitic schist, 5%blueschist, 5%
Minerals 517 depositschromite, 100%olivine, 30%serpentine, 19%magnetite, 8%kammererite, 6%sulfides, 5%uvarovite, 5%limonite, 5%pyrrhotite, 3%clinopyroxene, 2%pentlandite, 2%tremolite, 2%chalcopyrite, 2%laurite, 2%violarite, 2%troilite, 2%talc, 1%chlorite, 1%
378 depositschromite, 100%kammererite, 11%talc, 11%serpentine, 10%olivine, 7%uvarovite, 6%chlorite, 4%magnesite, 2%calcite, 2%magnetite, 2%antigorite, 1%aragonite, 1%actinolite, 1%kotschubeite, 1%asbestos, 1%nickel silicate, 1%quartz, 1%rutile, <1%
164 deposits. chromite, 100%serpentine, 20%kammererite, 15%olivine, 14%magnetite, 11%uvarovite, 9%talc, 7%magnesite, 7%chlorite, 5%sulfides, 5%williamsite, 4%limonite, 4%Fe-Mg silicates, 4%brucite, 3%hydromagnesite, 2%genthite, 2%deweylite, 2%zaratite, 2%
Major podiform Minor podiform Banded podiform
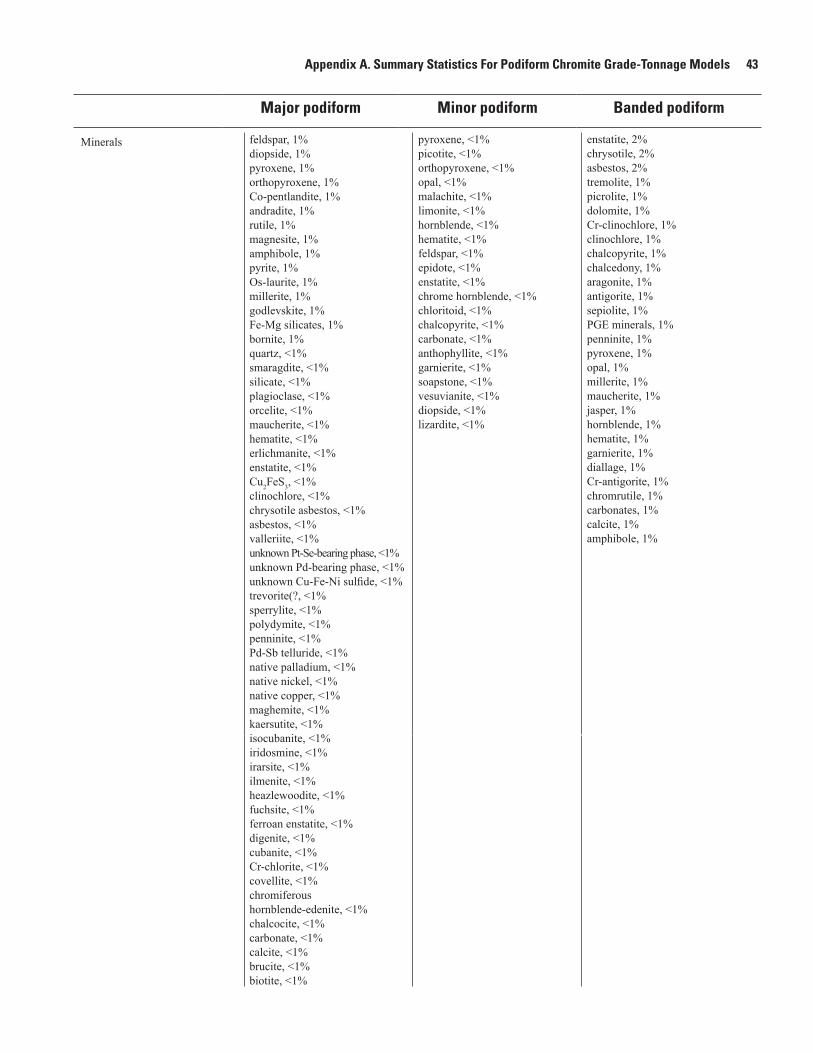
Appendix A. Summary Statistics For Podiform Chromite Grade-Tonnage Models 43
Minerals feldspar, 1%diopside, 1%pyroxene, 1%orthopyroxene, 1%Co-pentlandite, 1%andradite, 1%rutile, 1%magnesite, 1%amphibole, 1%pyrite, 1%Os-laurite, 1%millerite, 1%godlevskite, 1%Fe-Mg silicates, 1%bornite, 1%quartz, <1%smaragdite, <1%silicate, <1%plagioclase, <1%orcelite, <1%maucherite, <1%hematite, <1%erlichmanite, <1%enstatite, <1%Cu2FeS3, <1%clinochlore, <1%chrysotile asbestos, <1%asbestos, <1%valleriite, <1%unknown Pt-Se-bearing phase, <1%unknown Pd-bearing phase, <1%unknown Cu-Fe-Ni sulfide, <1%trevorite(?, <1%sperrylite, <1%polydymite, <1%penninite, <1%Pd-Sb telluride, <1%native palladium, <1%native nickel, <1%native copper, <1%maghemite, <1%kaersutite, <1%isocubanite, <1%iridosmine, <1%irarsite, <1%ilmenite, <1%heazlewoodite, <1%fuchsite, <1%ferroan enstatite, <1%digenite, <1%cubanite, <1%Cr-chlorite, <1%covellite, <1%chromiferous hornblende-edenite, <1%chalcocite, <1%carbonate, <1%calcite, <1%brucite, <1%biotite, <1%
pyroxene, <1%picotite, <1%orthopyroxene, <1%opal, <1%malachite, <1%limonite, <1%hornblende, <1%hematite, <1%feldspar, <1%epidote, <1%enstatite, <1%chrome hornblende, <1%chloritoid, <1%chalcopyrite, <1%carbonate, <1%anthophyllite, <1%garnierite, <1%soapstone, <1%vesuvianite, <1%diopside, <1%lizardite, <1%
enstatite, 2%chrysotile, 2%asbestos, 2%tremolite, 1%picrolite, 1%dolomite, 1%Cr-clinochlore, 1%clinochlore, 1%chalcopyrite, 1%chalcedony, 1%aragonite, 1%antigorite, 1%sepiolite, 1%PGE minerals, 1%penninite, 1%pyroxene, 1%opal, 1%millerite, 1%maucherite, 1%jasper, 1%hornblende, 1%hematite, 1%garnierite, 1%diallage, 1%Cr-antigorite, 1%chromrutile, 1%carbonates, 1%calcite, 1%amphibole, 1%
Major podiform Minor podiform Banded podiform
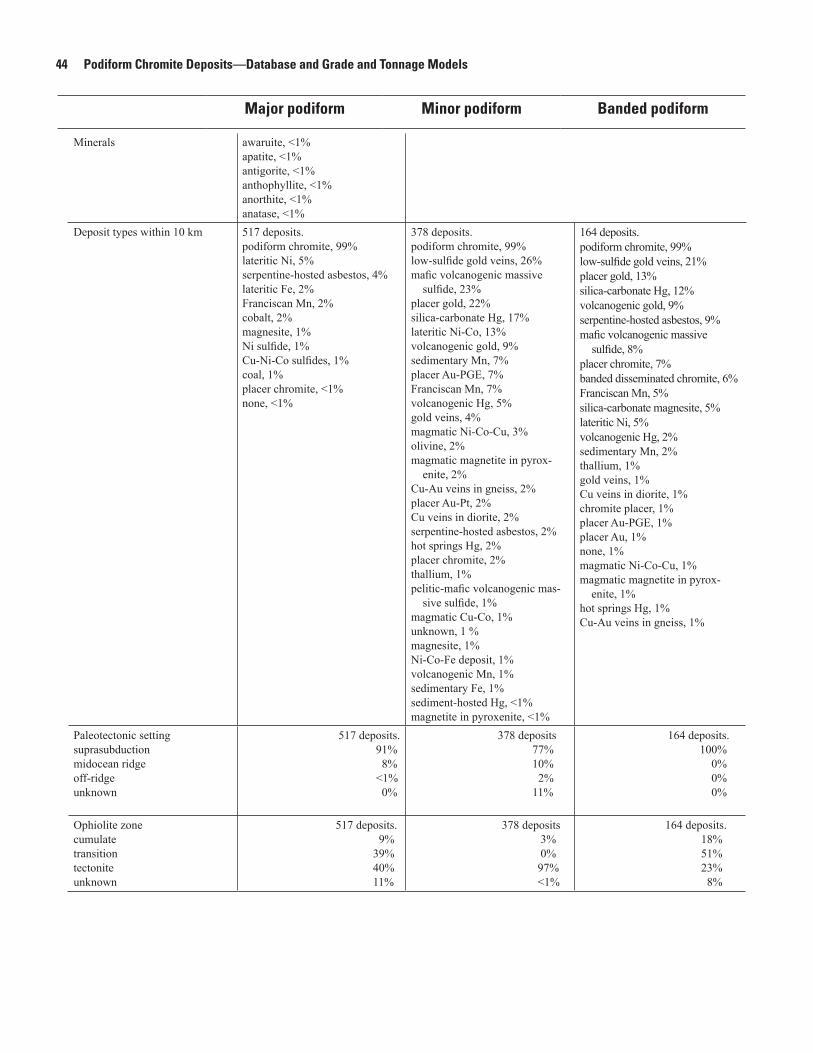
44 Podiform Chromite Deposits—Database and Grade and Tonnage Models
Minerals awaruite, <1%apatite, <1%antigorite, <1%anthophyllite, <1%anorthite, <1%anatase, <1%
Deposit types within 10 km 517 deposits.podiform chromite, 99%lateritic Ni, 5%serpentine-hosted asbestos, 4%lateritic Fe, 2%Franciscan Mn, 2%cobalt, 2%magnesite, 1%Ni sulfide, 1%Cu-Ni-Co sulfides, 1%coal, 1%placer chromite, <1%none, <1%
378 deposits.podiform chromite, 99%low-sulfide gold veins, 26%mafic volcanogenic massive
sulfide, 23%placer gold, 22%silica-carbonate Hg, 17%lateritic Ni-Co, 13%volcanogenic gold, 9%sedimentary Mn, 7%placer Au-PGE, 7%Franciscan Mn, 7%volcanogenic Hg, 5%gold veins, 4%magmatic Ni-Co-Cu, 3%olivine, 2%magmatic magnetite in pyrox-
enite, 2%Cu-Au veins in gneiss, 2%placer Au-Pt, 2%Cu veins in diorite, 2%serpentine-hosted asbestos, 2%hot springs Hg, 2%placer chromite, 2%thallium, 1%pelitic-mafic volcanogenic mas-
sive sulfide, 1%magmatic Cu-Co, 1%unknown, 1 %magnesite, 1%Ni-Co-Fe deposit, 1%volcanogenic Mn, 1%sedimentary Fe, 1%sediment-hosted Hg, <1%magnetite in pyroxenite, <1%
164 deposits.podiform chromite, 99%low-sulfide gold veins, 21%placer gold, 13%silica-carbonate Hg, 12%volcanogenic gold, 9%serpentine-hosted asbestos, 9%mafic volcanogenic massive
sulfide, 8%placer chromite, 7%banded disseminated chromite, 6%Franciscan Mn, 5%silica-carbonate magnesite, 5%lateritic Ni, 5%volcanogenic Hg, 2%sedimentary Mn, 2%thallium, 1%gold veins, 1%Cu veins in diorite, 1%chromite placer, 1%placer Au-PGE, 1%placer Au, 1%none, 1%magmatic Ni-Co-Cu, 1%magmatic magnetite in pyrox-
enite, 1%hot springs Hg, 1%Cu-Au veins in gneiss, 1%
Paleotectonic settingsuprasubductionmidocean ridgeoff-ridgeunknown
517 deposits. 91% 8% <1% 0%
378 deposits77%10% 2%11%
164 deposits.100% 0% 0% 0%
Ophiolite zonecumulatetransitiontectoniteunknown
517 deposits. 9%39%40%11%
378 deposits 3% 0%97%<1%
164 deposits.18%51%23% 8%
Major podiform Minor podiform Banded podiform
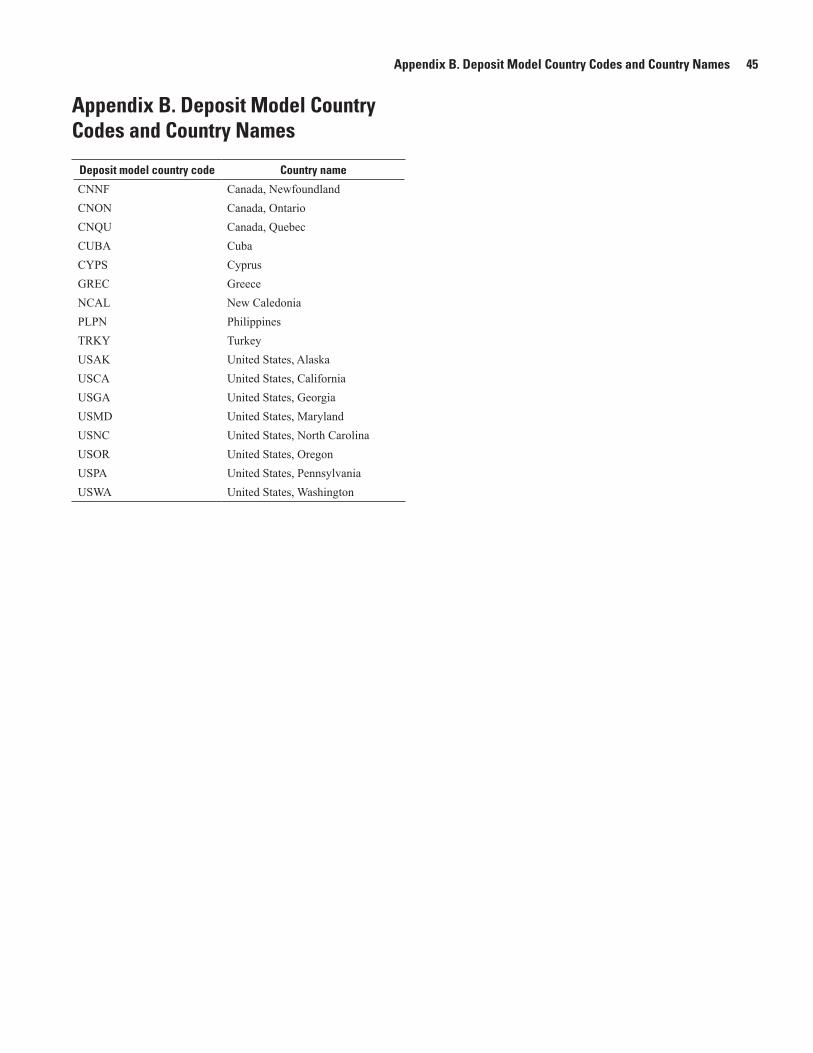
Appendix B. Deposit Model Country Codes and Country Names 45
Appendix B. Deposit Model Country Codes and Country Names
Deposit model country code Country name
CNNF Canada, NewfoundlandCNON Canada, OntarioCNQU Canada, QuebecCUBA CubaCYPS CyprusGREC GreeceNCAL New CaledoniaPLPN PhilippinesTRKY TurkeyUSAK United States, AlaskaUSCA United States, CaliforniaUSGA United States, GeorgiaUSMD United States, MarylandUSNC United States, North CarolinaUSOR United States, OregonUSPA United States, PennsylvaniaUSWA United States, Washington

This page intentionally left blank

Produced in the Menlo Park Publishing Service Center, CaliforniaManuscript approved for publication July 23, 2012
Text edited by Peter H. Stauffer Layout and design by Judy Weathers

Mosier and others—
Podiform Chrom
ite Deposits—
Database and G
rade and Tonnage Models—
Scientific Investigations Report 2012–5157
Top Related