


Languages
Pages
Legal

Rules for Residential Development:Regulations, Incentives, and Guidelines
City Council/Planning Commission
Joint Study Session
May 2, 2015
City Council/Planning Commission Joint Study Session – May 2, 2015
2
• Introduction and Overview (10 minutes)
• Regulations and Guidelines for Unit Mix and Family‐Friendly Design (90 minutes)
• Break (20 minutes)
• Incentives for Affordable and Ownership Housing, Including Bonus Point System (90 minutes)
• Summary Comments, Wrap‐Up, and Next Steps(10 minutes)
Agenda
City Council/Planning Commission Joint Study Session – May 2, 2015

Introduction and Overview
• Development Patterns• Issues to be Addressed• Available Tools
3City Council/Planning Commission Joint Study Session – May 2, 2015
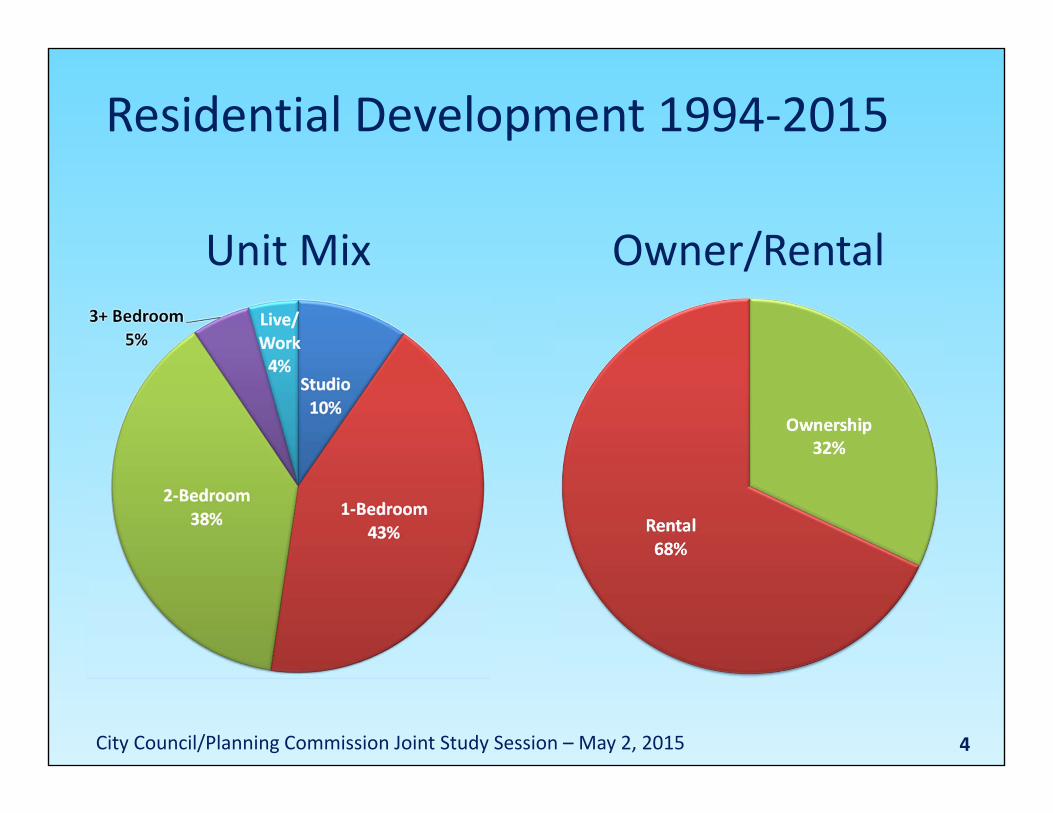
Residential Development 1994‐2015
4
Unit Mix Owner/Rental
City Council/Planning Commission Joint Study Session – May 2, 2015

Total Units 2000‐2014 by Bedrooms
5
2,7892,934
3,084 3,1103,304 3,304
3,5923,807 3,831
3,996 3,996 3,996 3,996 4,022 4,022
1,182 1,261 1,303 1,3301,497 1,528
1,7621,900
2,021 2,064 2,064 2,064 2,064 2,098 2,098
303 303 303 305 346 346 349 369 369 376 376 376 376 403 403
4,2744,498
4,690 4,745
5,147 5,178
5,703
6,0766,221
6,436 6,436 6,436 6,436 6,523 6,523
0
1,000
2,000
3,000
4,000
5,000
6,000
7,000
2000 2001 2002 2003 2004 2005 2006 2007 2008 2009 2010 2011 2012 2013 2014
Studio & 1 Bedroom
2 Bedroom
3+ Bedrooms
TOTAL
City Council/Planning Commission Joint Study Session – May 2, 2015
6
• Unit Mix (2 and 3+ bedroom units)
• Unit Size
• Family‐Friendly Design
• Affordable Housing
• Ownership Housing
• Development Bonus System
Issues to be Addressed
City Council/Planning Commission Joint Study Session – May 2, 2015

7
Available Tools
Tools
Attributes
Design Guidelines
Incentives(Bonus System)
Develop‐ment Impact
FeesCity Subsidies
Inclusionary Zoning without Incentives/ Concessions
State Density
Bonus Law
Regulations/Requirements
Unit Mix /✓ ✓
Family‐Friendly Units /✓ ✓
General Residential Amenities
✓
Affordable Units (rental) ✓ /✓ X
Affordable Units (condo) ✓ /✓
Ownership Units ✓ X
= already in place or in process ✓ = possibility to study /✓ = in place but could be enhanced X = prohibited
City Council/Planning Commission Joint Study Session – May 2, 2015
Family Friendly Housing
• Demographic Mix• EUSD Enrollment Levels• Unit Mix• Unit Size• Family Friendly Design Guidelines• Discussion Questions
8City Council/Planning Commission Joint Study Session – May 2, 2015
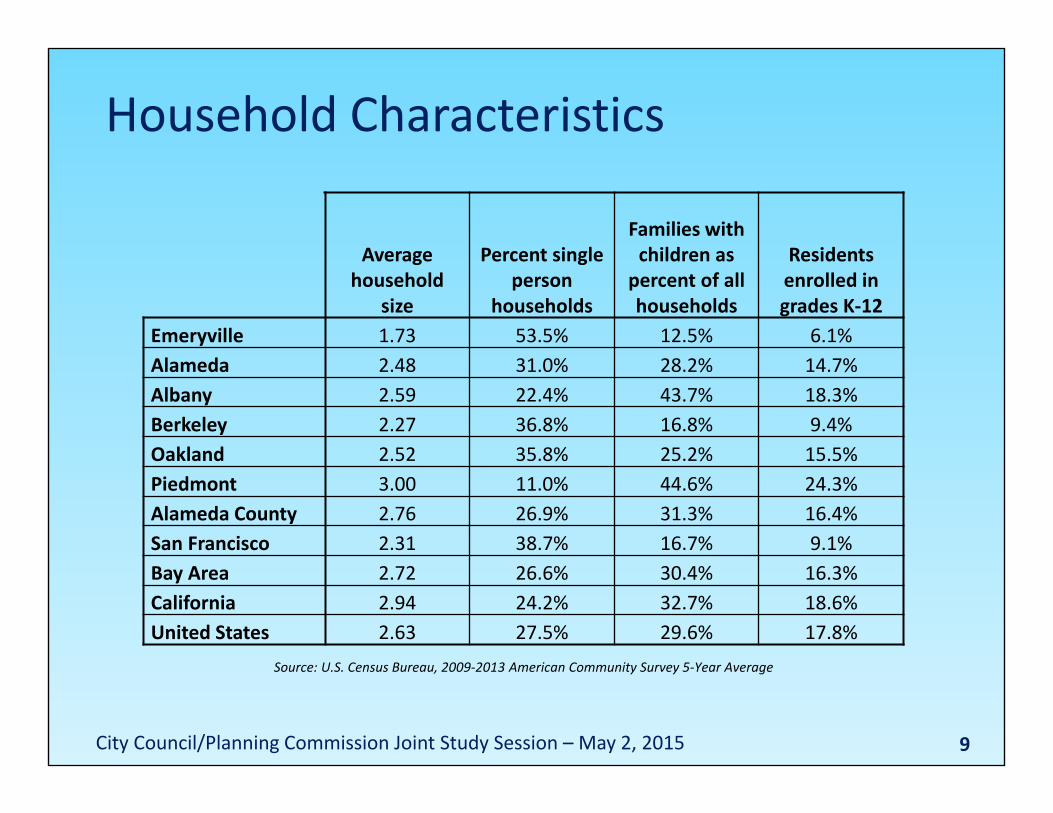
Household Characteristics
9
Average household
size
Percent single person
households
Families with children as percent of all households
Residents enrolled in grades K‐12
Emeryville 1.73 53.5% 12.5% 6.1%Alameda 2.48 31.0% 28.2% 14.7%Albany 2.59 22.4% 43.7% 18.3%Berkeley 2.27 36.8% 16.8% 9.4%Oakland 2.52 35.8% 25.2% 15.5%Piedmont 3.00 11.0% 44.6% 24.3%Alameda County 2.76 26.9% 31.3% 16.4%San Francisco 2.31 38.7% 16.7% 9.1%Bay Area 2.72 26.6% 30.4% 16.3%California 2.94 24.2% 32.7% 18.6%United States 2.63 27.5% 29.6% 17.8%
Source: U.S. Census Bureau, 2009‐2013 American Community Survey 5‐Year Average
City Council/Planning Commission Joint Study Session – May 2, 2015
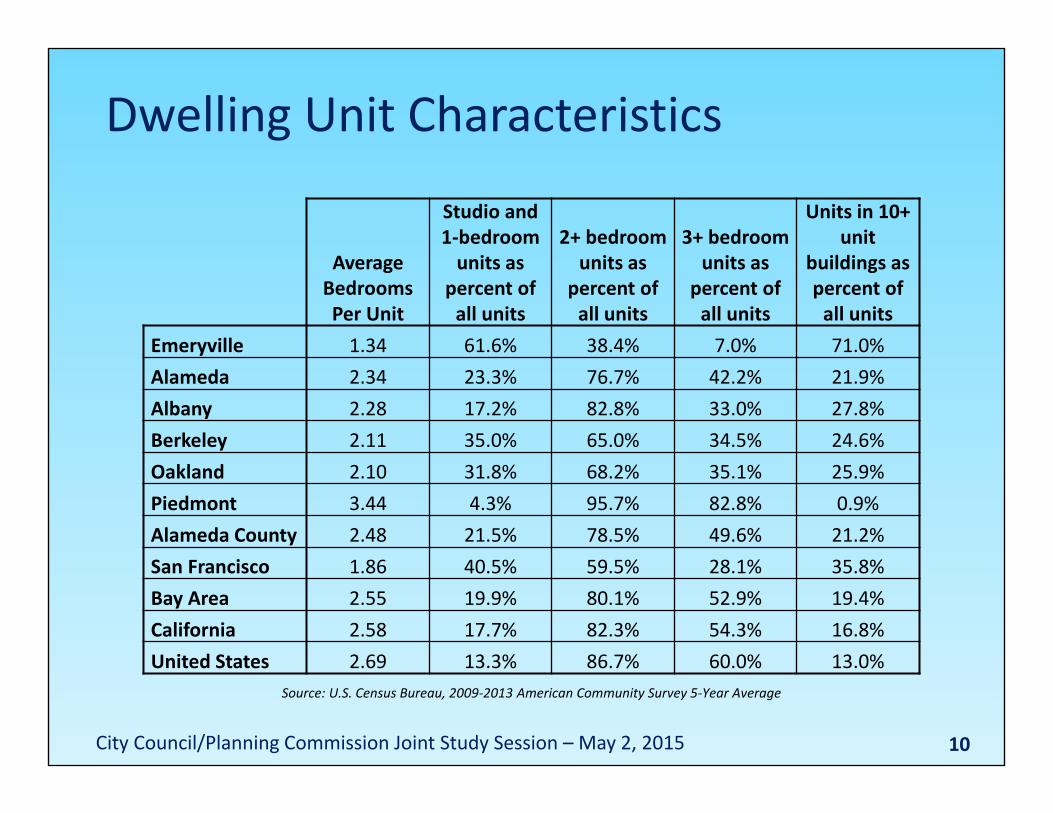
Dwelling Unit Characteristics
10
Average Bedrooms Per Unit
Studio and 1‐bedroom units as
percent of all units
2+ bedroom units as
percent of all units
3+ bedroom units as
percent of all units
Units in 10+ unit
buildings as percent of all units
Emeryville 1.34 61.6% 38.4% 7.0% 71.0%Alameda 2.34 23.3% 76.7% 42.2% 21.9%Albany 2.28 17.2% 82.8% 33.0% 27.8%Berkeley 2.11 35.0% 65.0% 34.5% 24.6%Oakland 2.10 31.8% 68.2% 35.1% 25.9%Piedmont 3.44 4.3% 95.7% 82.8% 0.9%Alameda County 2.48 21.5% 78.5% 49.6% 21.2%San Francisco 1.86 40.5% 59.5% 28.1% 35.8%Bay Area 2.55 19.9% 80.1% 52.9% 19.4%California 2.58 17.7% 82.3% 54.3% 16.8%United States 2.69 13.3% 86.7% 60.0% 13.0%
Source: U.S. Census Bureau, 2009‐2013 American Community Survey 5‐Year Average
City Council/Planning Commission Joint Study Session – May 2, 2015
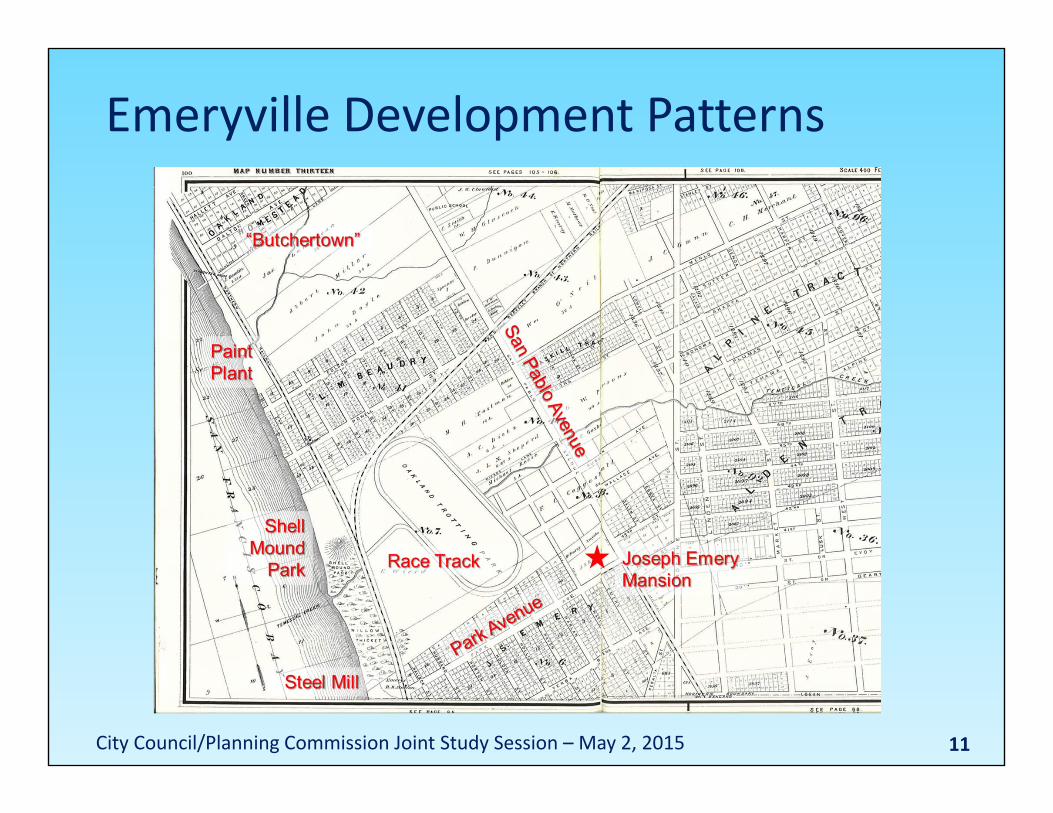
Emeryville Development Patterns
11City Council/Planning Commission Joint Study Session – May 2, 2015
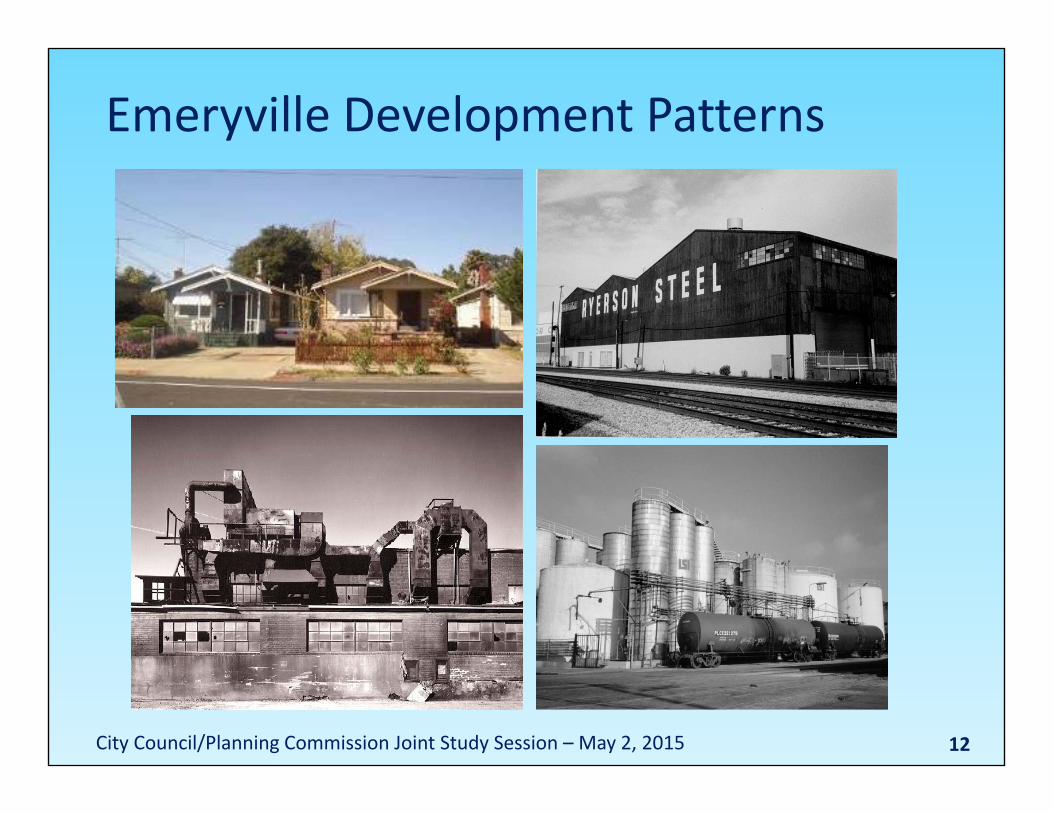
Emeryville Development Patterns
12City Council/Planning Commission Joint Study Session – May 2, 2015

Emeryville Development Patterns
13City Council/Planning Commission Joint Study Session – May 2, 2015

Emeryville Development Patterns
14City Council/Planning Commission Joint Study Session – May 2, 2015
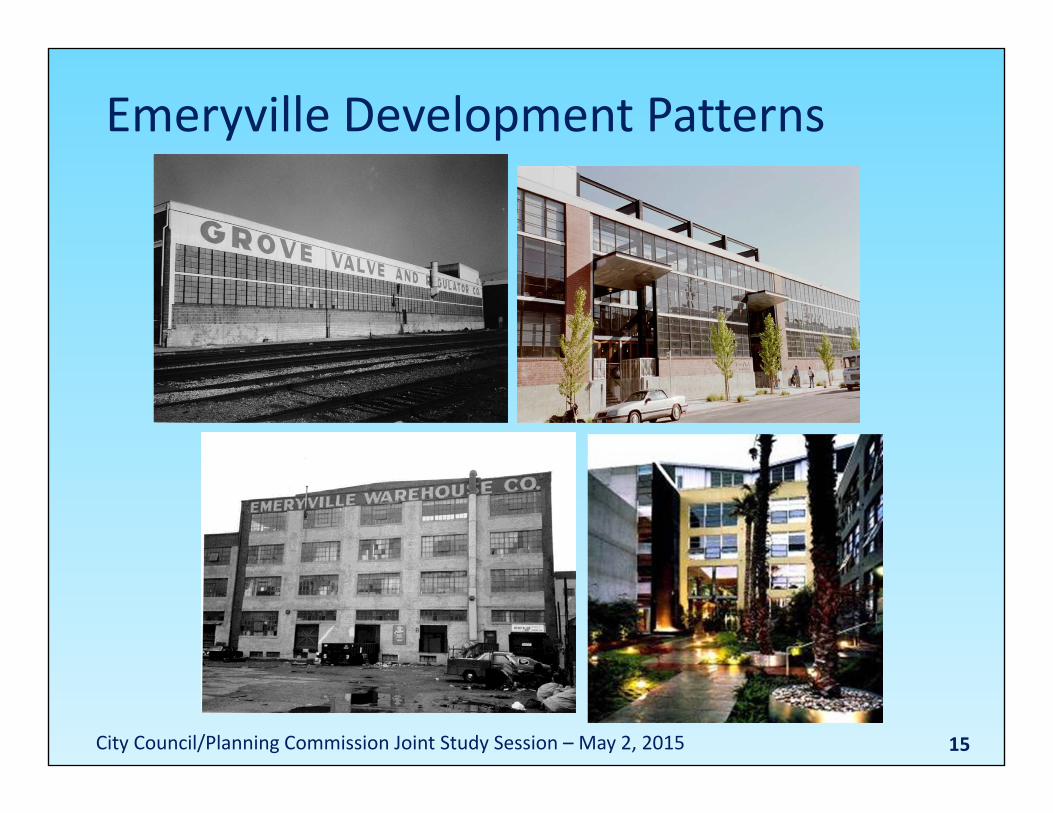
Emeryville Development Patterns
15City Council/Planning Commission Joint Study Session – May 2, 2015
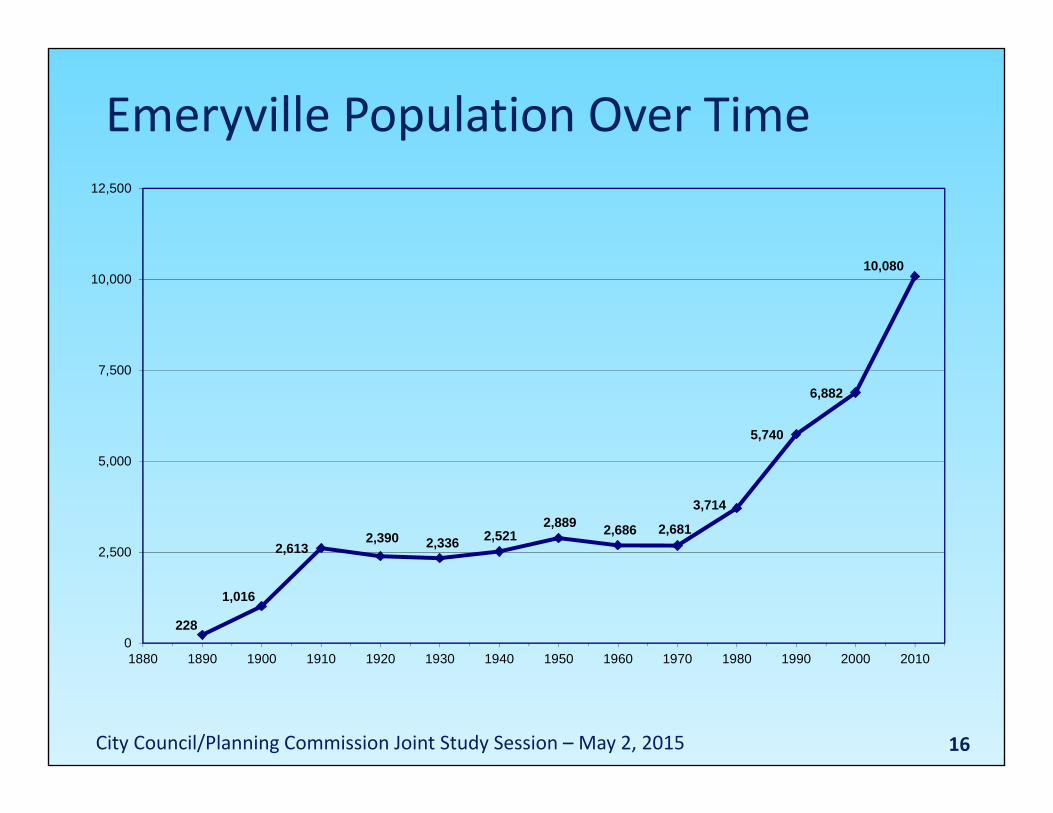
Emeryville Population Over Time
16
228
1,016
2,6132,390 2,336 2,521
2,889 2,686 2,681
3,714
5,740
6,882
10,080
0
2,500
5,000
7,500
10,000
12,500
1880 1890 1900 1910 1920 1930 1940 1950 1960 1970 1980 1990 2000 2010
City Council/Planning Commission Joint Study Session – May 2, 2015

3+ Bedroom Units in 10+ Unit Buildings
17
R² = ‐0.5344
City Council/Planning Commission Joint Study Session – May 2, 2015

Variables vs. 10+ Unit Buildings
18
Variable Correlation coefficient
Predicted value
Actual value
Average Household Size ‐0.2387 2.02 1.73Percent single person households +0.4288 47.5% 53.5%Families with children as percent of all households ‐0.1844 17.9% 12.5%Residents enrolled in grades K‐12 ‐0.2484 8.5% 6.1%Average bedrooms per unit ‐0.5918 1.30 1.34Studio and 1‐bedroom units as percent of all units +0.7303 58.0% 61.6%2+ bedroom units as percent of all units ‐0.7303 42.0% 38.4%3+ bedroom units as percent of all units ‐0.5311 6.5% 7.0%
Source: U.S. Census Bureau, 2009‐2013 American Community Survey 5‐Year Average
City Council/Planning Commission Joint Study Session – May 2, 2015

Families with Children in 10+ Unit Bldgs
19
R² = ‐0.1844
City Council/Planning Commission Joint Study Session – May 2, 2015
20
• Emeryville’s household and dwelling unit characteristics can be explained by its historical development patterns.
• Specifically, these characteristics are largely due to the very high percentage of units in large apartment and condominium buildings of 10+ units.
• The high percentage of large residential buildings should not be a deterrent to attracting more families with children.
Conclusions
City Council/Planning Commission Joint Study Session – May 2, 2015
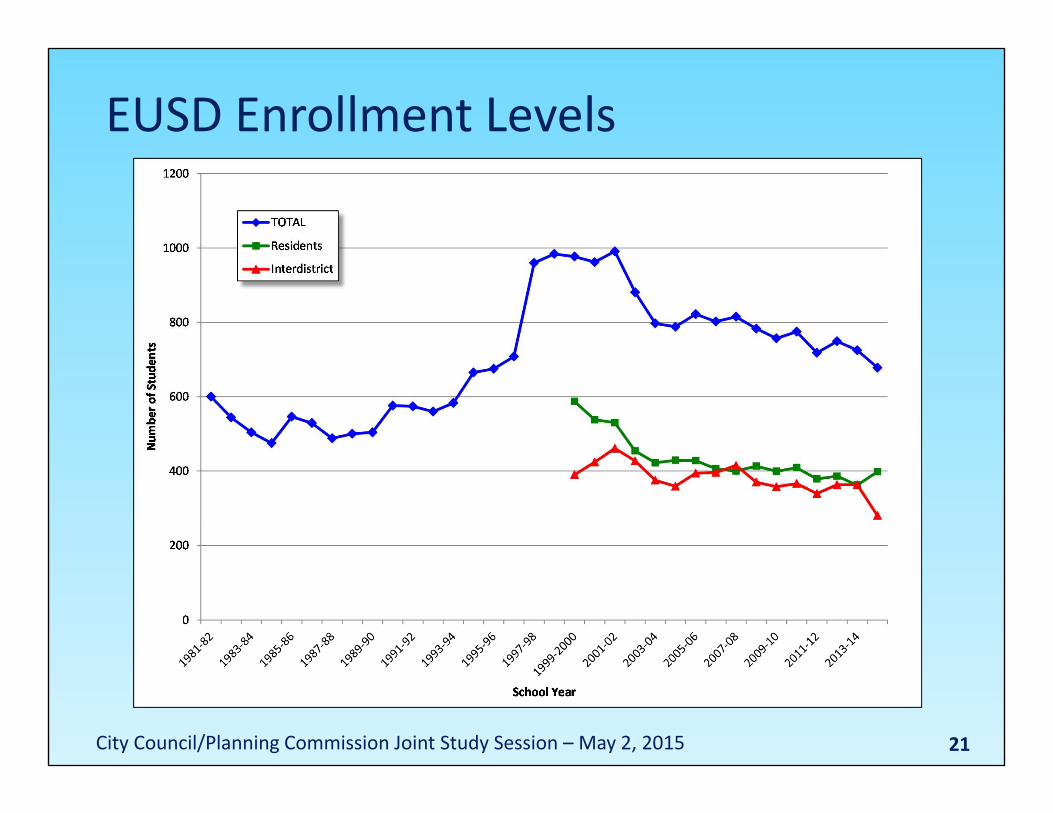
EUSD Enrollment Levels
21City Council/Planning Commission Joint Study Session – May 2, 2015

EUSD Enrollment Levels
22City Council/Planning Commission Joint Study Session – May 2, 2015

EUSD Enrollment Forecasts
23
Actual
City Council/Planning Commission Joint Study Session – May 2, 2015

API Test Scores, Alameda County
24
500
550
600
650
700
750
800
850
900
950
1000
2002 2003 2004 2005 2006 2007 2008 2009 2010 2011 2012 2013
Sunol Glen Unified
Piedmont City Unified
Pleasanton Unified
Fremont Unified
Castro Valley Unified
Alameda City Unified
Livermore Valley Joint Unified
Berkeley Unified
Newark Unified
New Haven Unified
San Lorenzo Unified
Oakland Unified
Hayward Unified
San Leandro Unified
Emery Unified
City Council/Planning Commission Joint Study Session – May 2, 2015

Family and School Trends 1990‐2013
25
0
100
200
300
400
500
600
700
800
900
1000
1990 2000 2013
EUSD K‐12 Enrollment
Families with Children
Residents Enrolled in K‐12 School
3+ Bedroom Units
City Council/Planning Commission Joint Study Session – May 2, 2015

Where Emeryville Children go to School
26City Council/Planning Commission Joint Study Session – May 2, 2015
27
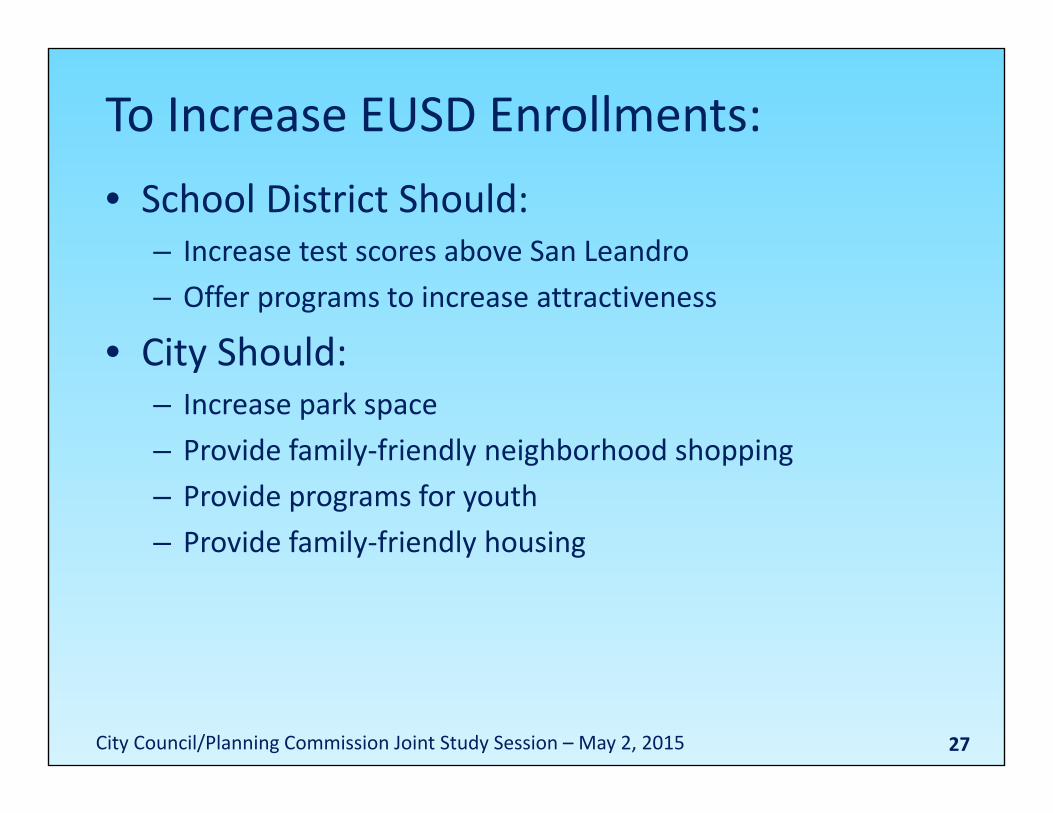
To Increase EUSD Enrollments:• School District Should:
– Increase test scores above San Leandro– Offer programs to increase attractiveness
• City Should:– Increase park space– Provide family‐friendly neighborhood shopping– Provide programs for youth– Provide family‐friendly housing
City Council/Planning Commission Joint Study Session – May 2, 2015
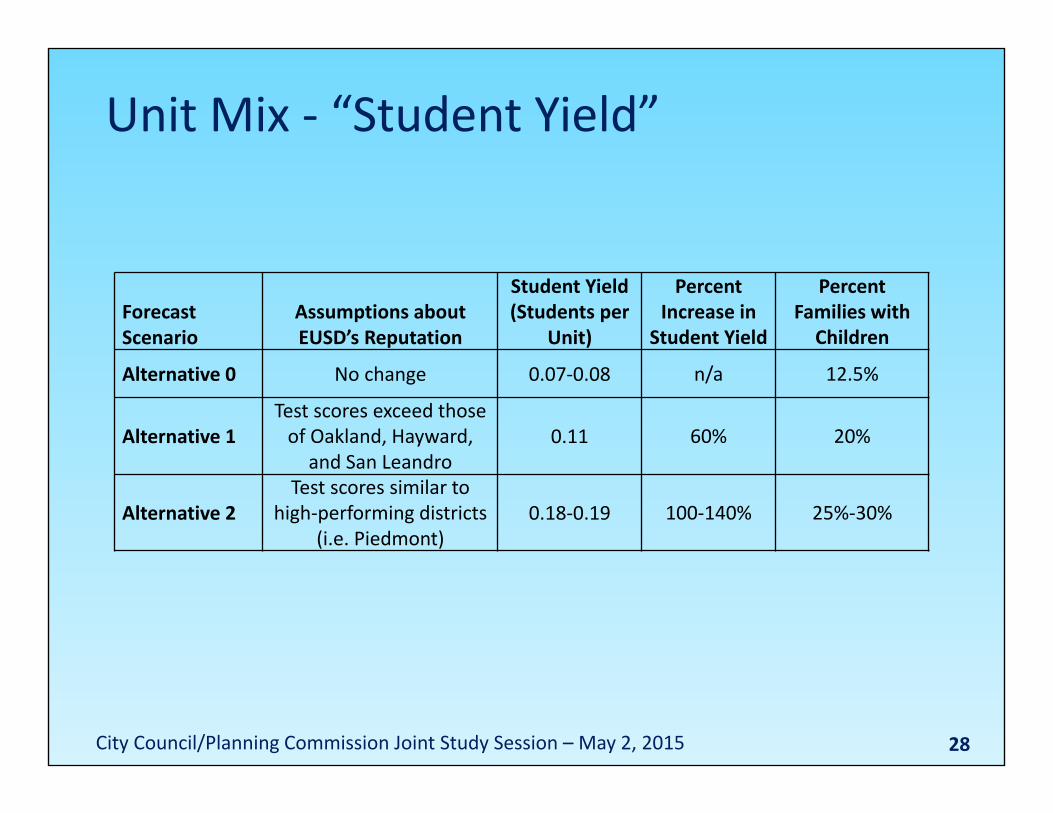
Unit Mix ‐ “Student Yield”
28
Forecast Scenario
Assumptions aboutEUSD’s Reputation
Student Yield (Students per
Unit)
Percent Increase in
Student Yield
Percent Families with Children
Alternative 0 No change 0.07‐0.08 n/a 12.5%
Alternative 1Test scores exceed those of Oakland, Hayward, and San Leandro
0.11 60% 20%
Alternative 2Test scores similar to
high‐performing districts (i.e. Piedmont)
0.18‐0.19 100‐140% 25%‐30%
City Council/Planning Commission Joint Study Session – May 2, 2015
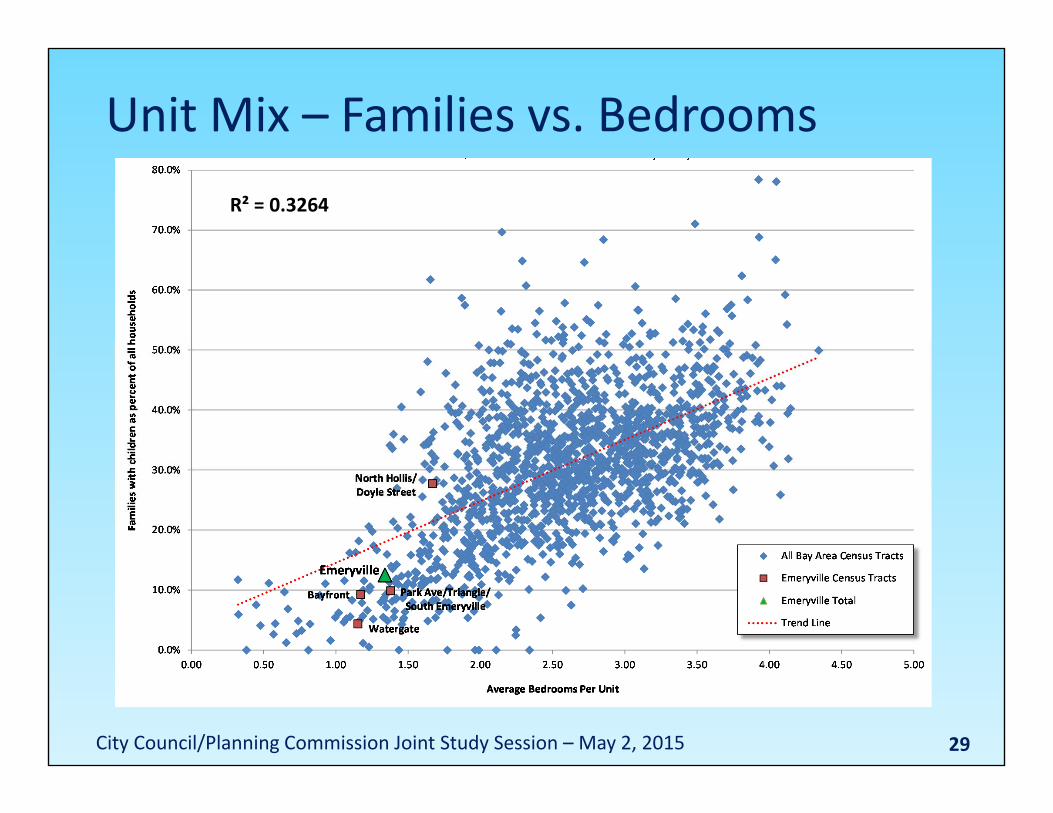
Unit Mix – Families vs. Bedrooms
29
R² = 0.3264
City Council/Planning Commission Joint Study Session – May 2, 2015

Unit Mix – Families vs. 2+ Bedrooms
30
R² = 0.3380
20%
50%
City Council/Planning Commission Joint Study Session – May 2, 2015
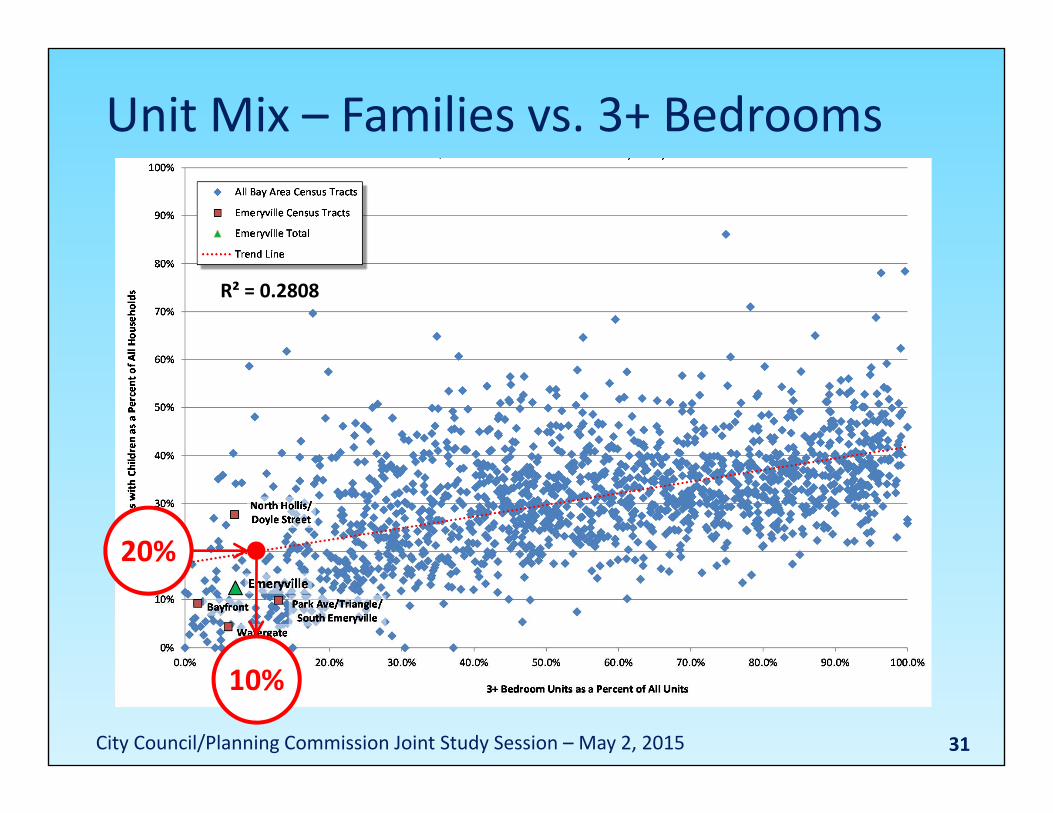
Unit Mix – Families vs. 3+ Bedrooms
31
R² = 0.2808
20%
10%
City Council/Planning Commission Joint Study Session – May 2, 2015

Unit Mix Needed to Meet Various Families with Children Targets
32
Families with Children as Percent of All Households 2+ Bedroom Units* 3+ Bedroom Units12.5% (existing) 38.4% 7.0%20% (60% increase) 50% 10%25% (100% increase) 65% 30%30% (140% increase) 80% 50%
* Inclusive of 3+ bedroom units.
City Council/Planning Commission Joint Study Session – May 2, 2015
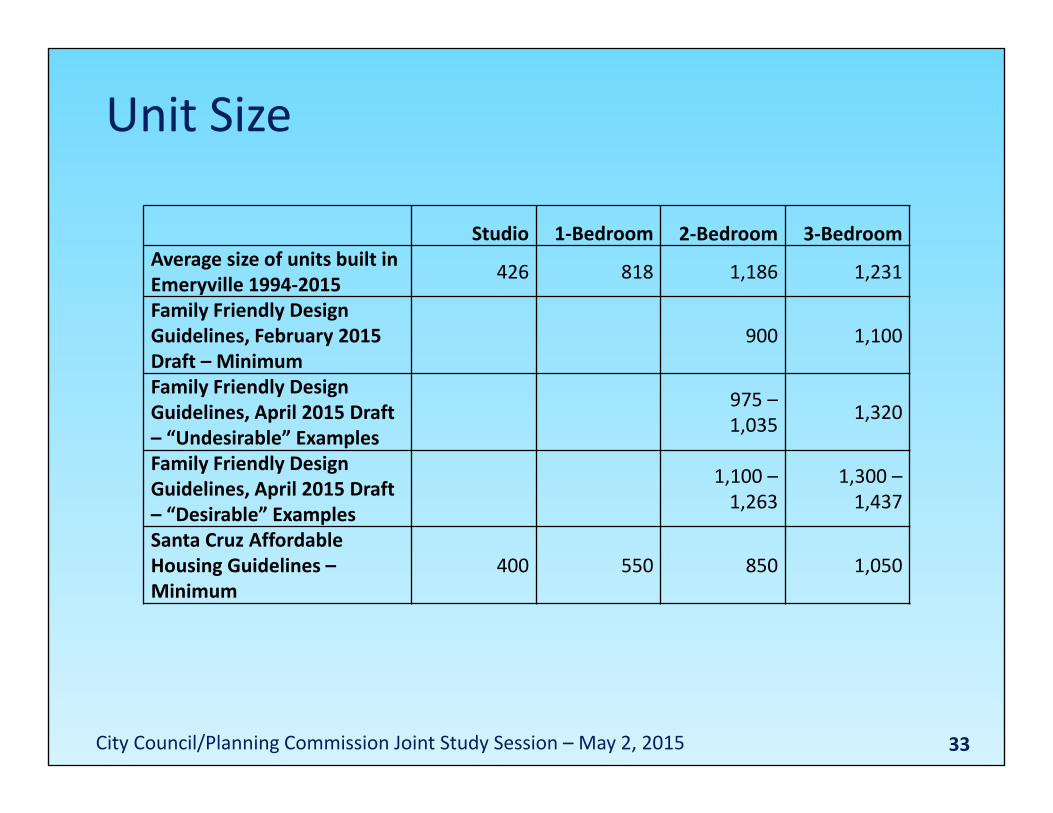
Unit Size
33
Studio 1‐Bedroom 2‐Bedroom 3‐BedroomAverage size of units built in Emeryville 1994‐2015 426 818 1,186 1,231
Family Friendly Design Guidelines, February 2015 Draft – Minimum
900 1,100
Family Friendly Design Guidelines, April 2015 Draft – “Undesirable” Examples
975 –1,035 1,320
Family Friendly Design Guidelines, April 2015 Draft – “Desirable” Examples
1,100 –1,263
1,300 –1,437
Santa Cruz Affordable Housing Guidelines –Minimum
400 550 850 1,050
City Council/Planning Commission Joint Study Session – May 2, 2015
34
• Emeryville Design Guidelines adopted in December 2010 have a general policy, with some specific points.
• Amendment to Guidelines to address Family Friendly Housing reviewed by Planning Commission in June 2013 and February 2015, and approved on April 23, 2015.
• Amendment scheduled to be considered by City Council on May 19, 2015.
Family Friendly Design Guidelines
City Council/Planning Commission Joint Study Session – May 2, 2015

35
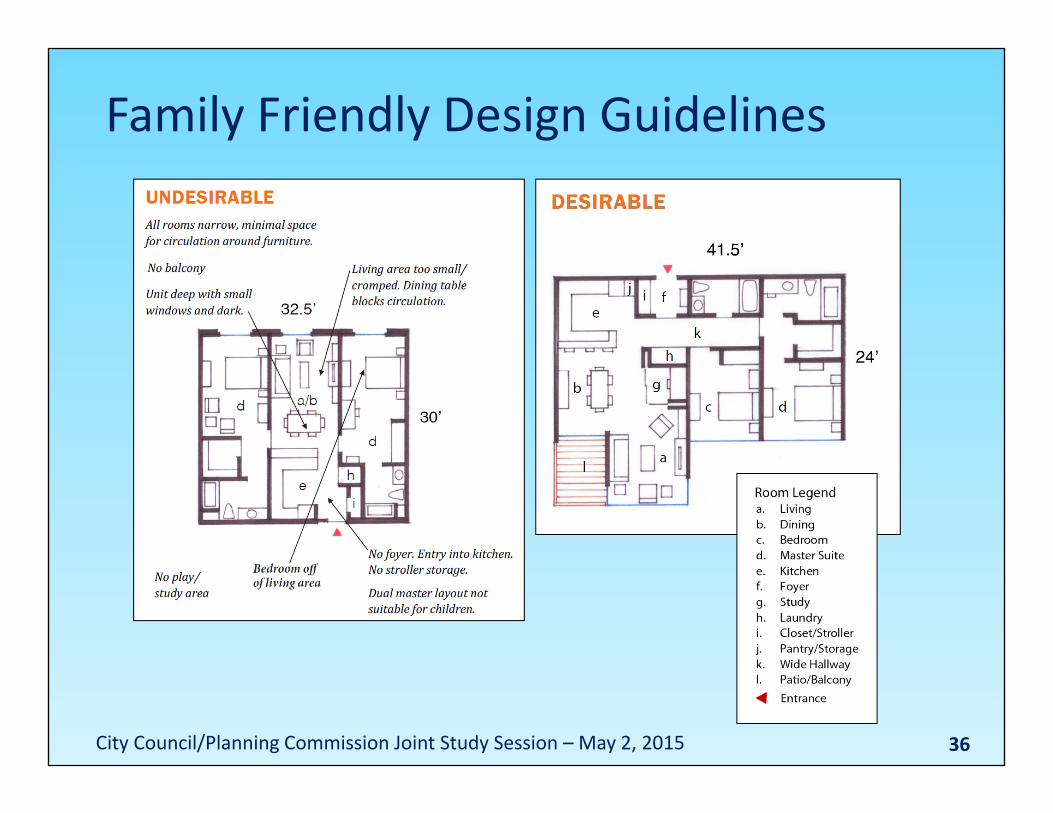
Family Friendly Design Guidelines• Site & Building Design (examples)
– Provide units with two, three or more bedrooms.– Provide ample exterior play areas visible from units.– Provide in‐unit laundries or common laundry areas.
• Unit Design (examples)– Provide only one master suite.– Separate sleeping areas from living areas.– Dining and living areas should have ample room for all household members to gather.
– Hallways should be wide enough for children to play.
City Council/Planning Commission Joint Study Session – May 2, 2015
36
Family Friendly Design Guidelines
City Council/Planning Commission Joint Study Session – May 2, 2015
37
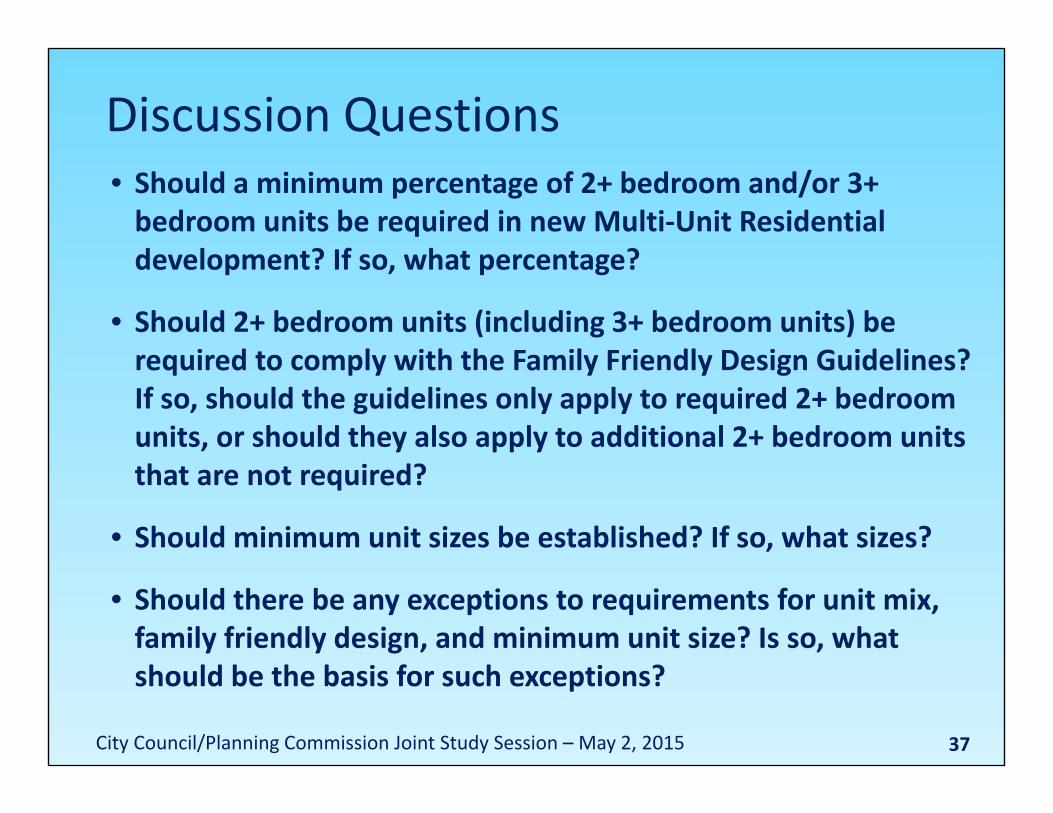
• Should a minimum percentage of 2+ bedroom and/or 3+ bedroom units be required in new Multi‐Unit Residential development? If so, what percentage?
• Should 2+ bedroom units (including 3+ bedroom units) be required to comply with the Family Friendly Design Guidelines? If so, should the guidelines only apply to required 2+ bedroom units, or should they also apply to additional 2+ bedroom units that are not required?
• Should minimum unit sizes be established? If so, what sizes?
• Should there be any exceptions to requirements for unit mix, family friendly design, and minimum unit size? Is so, what should be the basis for such exceptions?
Discussion Questions
City Council/Planning Commission Joint Study Session – May 2, 2015

38
Break
City Council/Planning Commission Joint Study Session – May 2, 2015
Affordable Housing/Ownership Housing
• Affordable Housing• Ownership Housing• Proposed Incentives and Development
Bonus System• Discussion Questions
39City Council/Planning Commission Joint Study Session – May 2, 2015

Average Monthly Rents 2000 ‐ 2013
40
$1,000
$1,500
$2,000
$2,500
$3,000
$3,500
2010 2011 2012 2013
3 bedroom
2 bedroom
1 bedroom
Studio
31% increase 2010‐2013
12% increase 2010‐2013
26% increase 2010‐2013
26% increase 2010‐2013
City Council/Planning Commission Joint Study Session – May 2, 2015
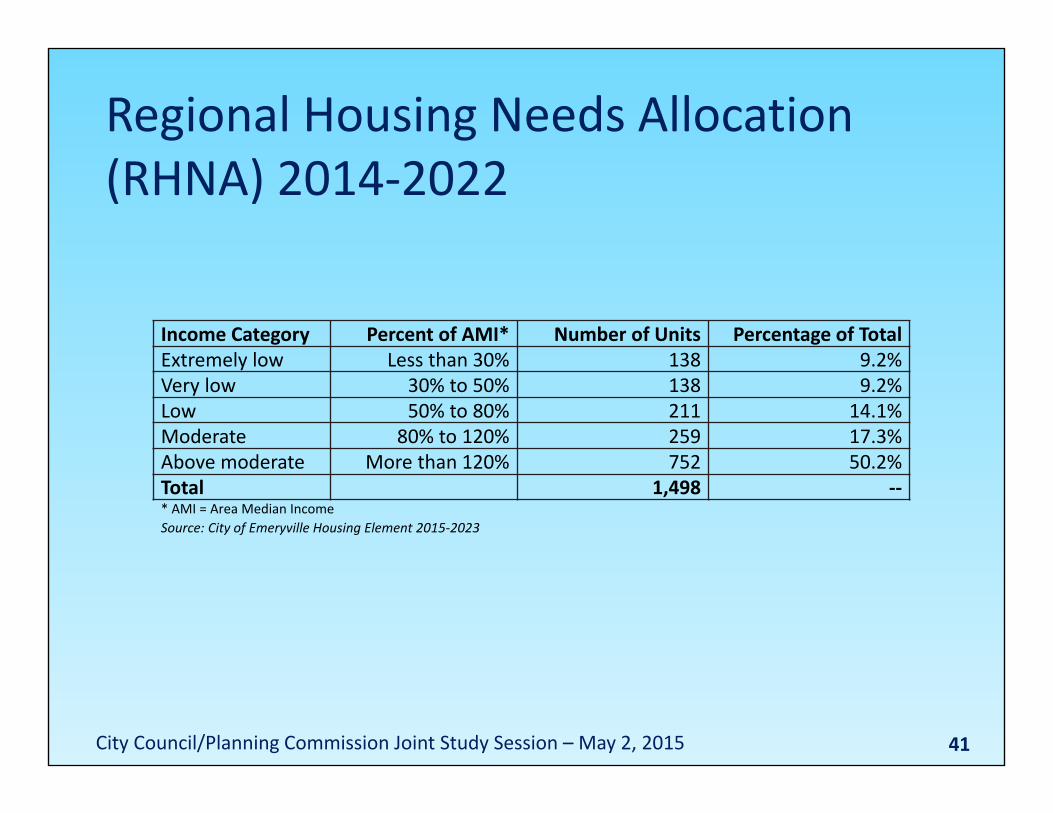
Regional Housing Needs Allocation (RHNA) 2014‐2022
41
Income Category Percent of AMI* Number of Units Percentage of TotalExtremely low Less than 30% 138 9.2%Very low 30% to 50% 138 9.2%Low 50% to 80% 211 14.1%Moderate 80% to 120% 259 17.3%Above moderate More than 120% 752 50.2%Total 1,498 ‐‐* AMI = Area Median IncomeSource: City of Emeryville Housing Element 2015‐2023
City Council/Planning Commission Joint Study Session – May 2, 2015
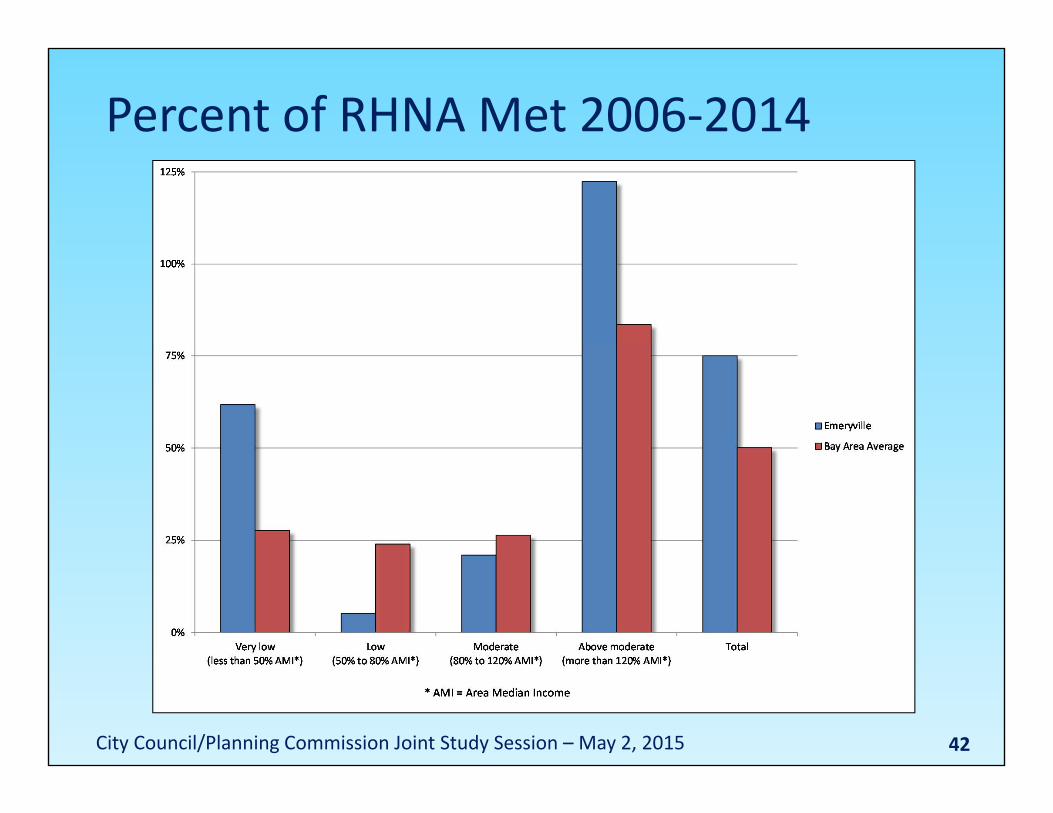
Percent of RHNA Met 2006‐2014
42City Council/Planning Commission Joint Study Session – May 2, 2015
43
• Previous Affordable Housing Set‐Aside Program (inclusionary zoning) required 9% moderate income and 6% very low income units for rental housing.
• Palmer decision means this is no longer legal for rental. (There is still a 20% moderate inclusionary zoning requirement for condominiums.)
• Elimination of Redevelopment results in less affordable housing money for cities.
• Affordable Housing Impact Fee established in 2014 is $20,000 per unit or 6.9% low income units.
• Staff proposes “voluntary inclusionary zoning”, where developer gets development bonus for providing affordable units.
Affordable Housing Tools
City Council/Planning Commission Joint Study Session – May 2, 2015
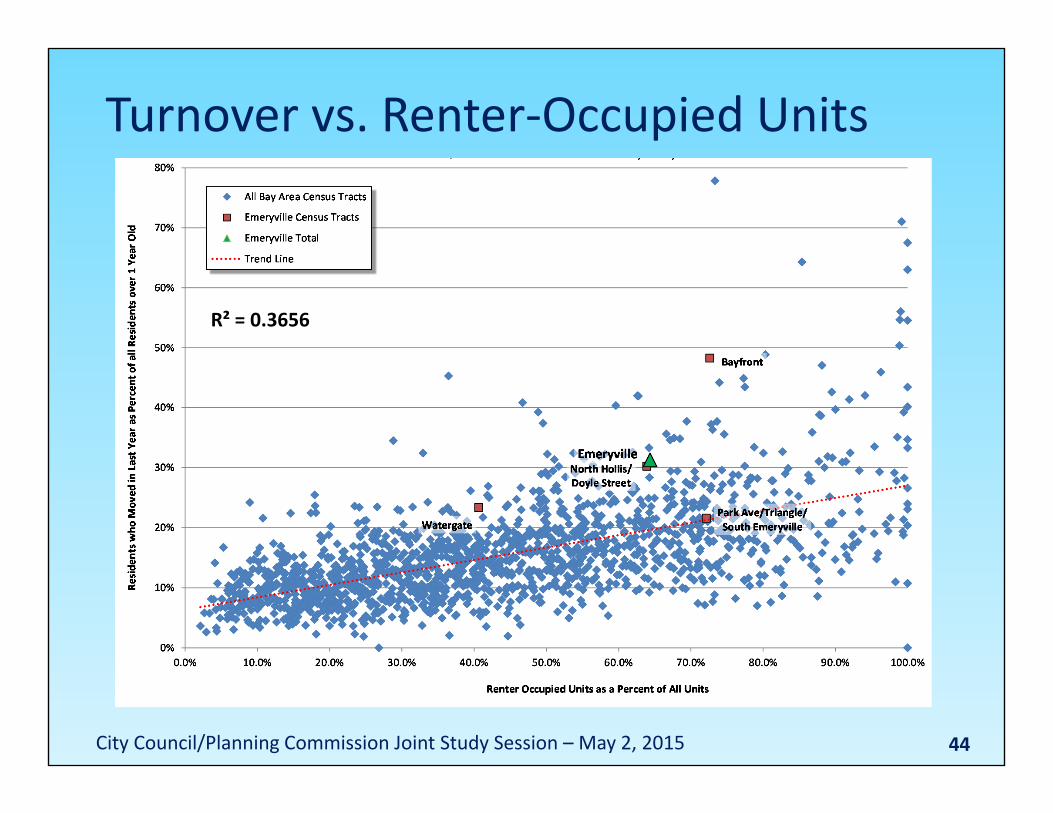
Turnover vs. Renter‐Occupied Units
44
R² = 0.3656
City Council/Planning Commission Joint Study Session – May 2, 2015
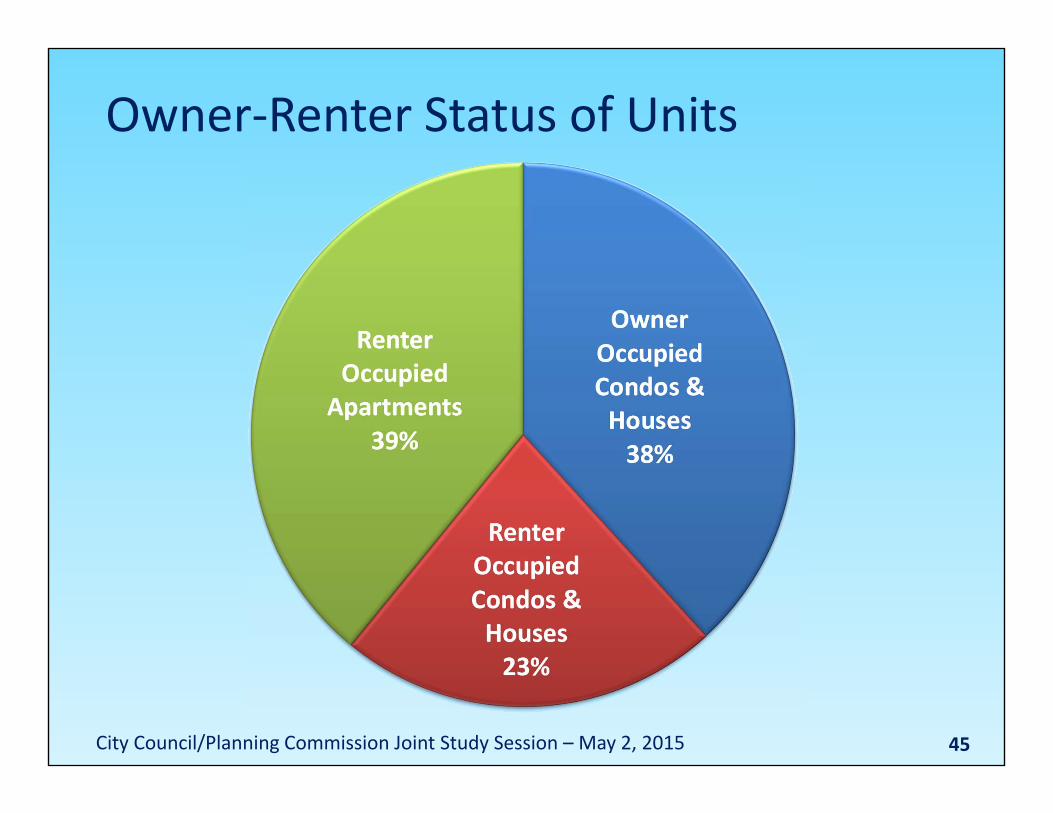
Owner‐Renter Status of Units
45City Council/Planning Commission Joint Study Session – May 2, 2015
46
• Many households cannot afford to own, and are vulnerable to rent increases that may cause them to have to move.
• Low‐ and very‐low income ownership units are prone to financial distress due to HOA dues, utility costs, etc.
• EUSD study found that families with school age children are attracted to rental housing, as they often cannot afford to buy.
• Building more ownership housing does not necessarily result in owner‐occupancy.
• What is the appropriate mix between owner and rental housing?
Issues with Ownership Housing
City Council/Planning Commission Joint Study Session – May 2, 2015
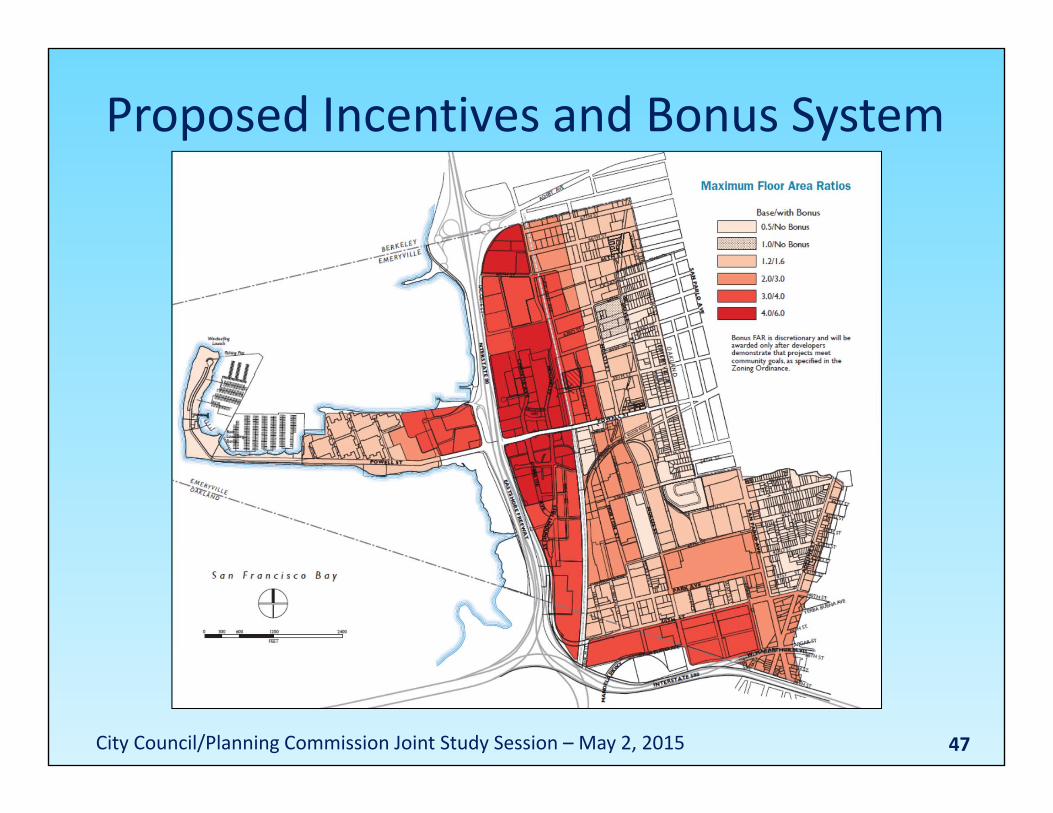
47
Proposed Incentives and Bonus System
City Council/Planning Commission Joint Study Session – May 2, 2015

48
Proposed Incentives and Bonus System
City Council/Planning Commission Joint Study Session – May 2, 2015
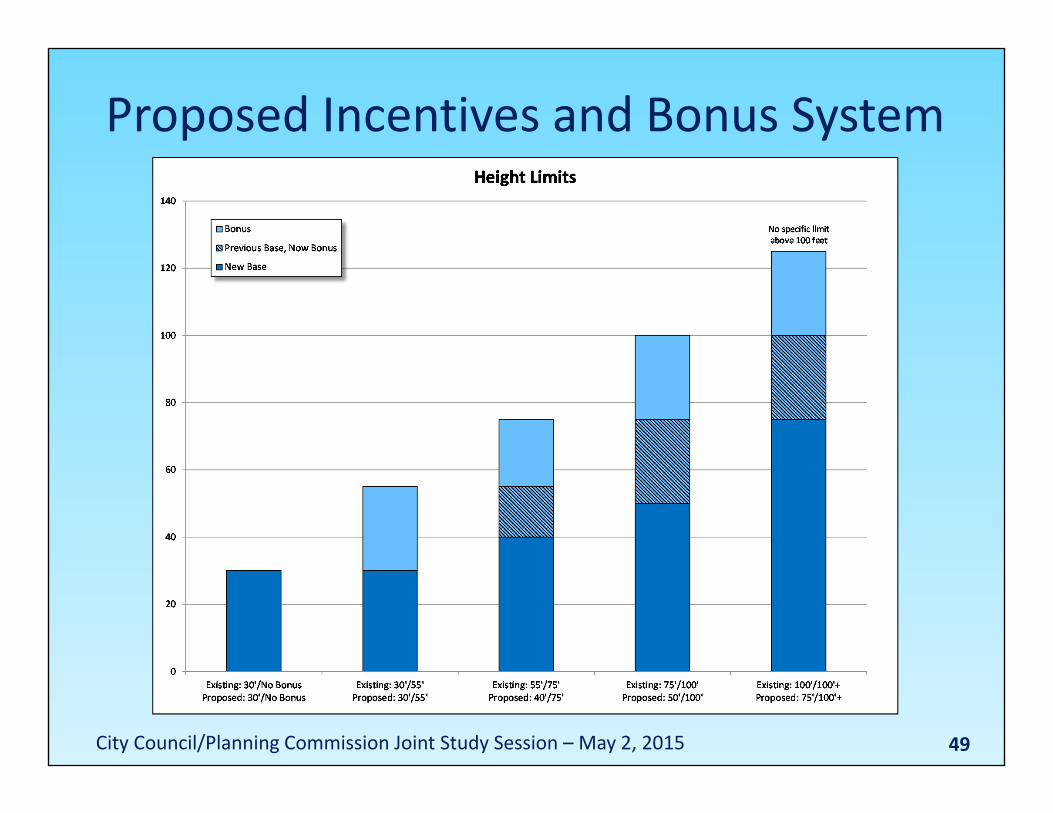
49
Proposed Incentives and Bonus System
City Council/Planning Commission Joint Study Session – May 2, 2015

50
Proposed Incentives and Bonus System
City Council/Planning Commission Joint Study Session – May 2, 2015
51
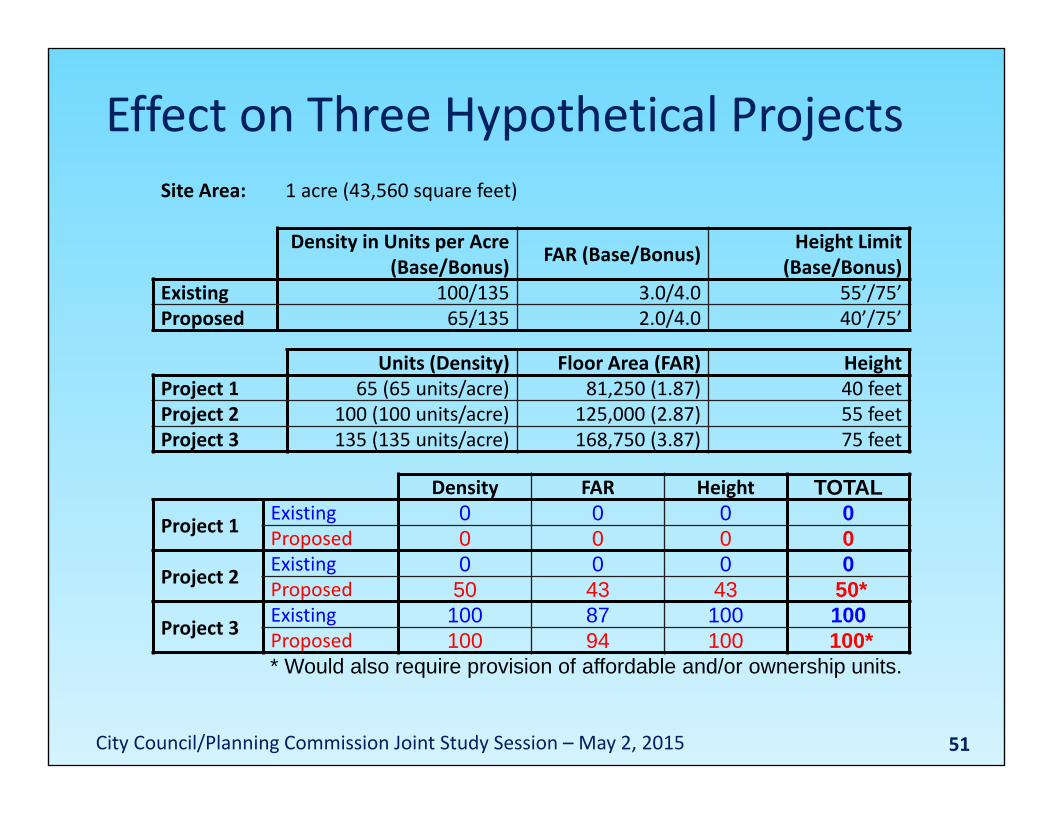
Units (Density) Floor Area (FAR) HeightProject 1 65 (65 units/acre) 81,250 (1.87) 40 feetProject 2 100 (100 units/acre) 125,000 (2.87) 55 feetProject 3 135 (135 units/acre) 168,750 (3.87) 75 feet
Effect on Three Hypothetical ProjectsSite Area: 1 acre (43,560 square feet)
Density in Units per Acre (Base/Bonus) FAR (Base/Bonus) Height Limit
(Base/Bonus)Existing 100/135 3.0/4.0 55’/75’Proposed 65/135 2.0/4.0 40’/75’
Density FAR Height TOTAL
Project 1 Existing 0 0 0 0Proposed 0 0 0 0
Project 2 Existing 0 0 0 0Proposed 50 43 43 50*
Project 3 Existing 100 87 100 100Proposed 100 94 100 100** Would also require provision of affordable and/or ownership units.
City Council/Planning Commission Joint Study Session – May 2, 2015

52
Public Benefits and Bonus Points
Public BenefitMaximum Points Public Benefit
Maximum Points
(1) Public Open Space 50 (10) Neighborhood Centers 35(2) Sustainable Design 35 (11) Small Businesses 35(3) Alternative Energy 50 (12) Public Art 20(4) Water Efficiency 35 (13) Public Parking 35(5) Energy Efficiency 35 (14) Bike Station 35(6) Public Improvements 50 (15) Significant Structures 35(7) Utility Undergrounding 50 (16) Electric Vehicle (EV) Charging
Stations35
(8) Transportation DemandManagement (TDM)
35 (17) Mechanical Equipment Concealed inPenthouse or Inside Building
20
(9) Family Friendly Housing 50 (18) Universal Design 50(19) Flexible Public Benefit N/A*
* As deemed appropriate by Planning Commission or City Council.
City Council/Planning Commission Joint Study Session – May 2, 2015
53
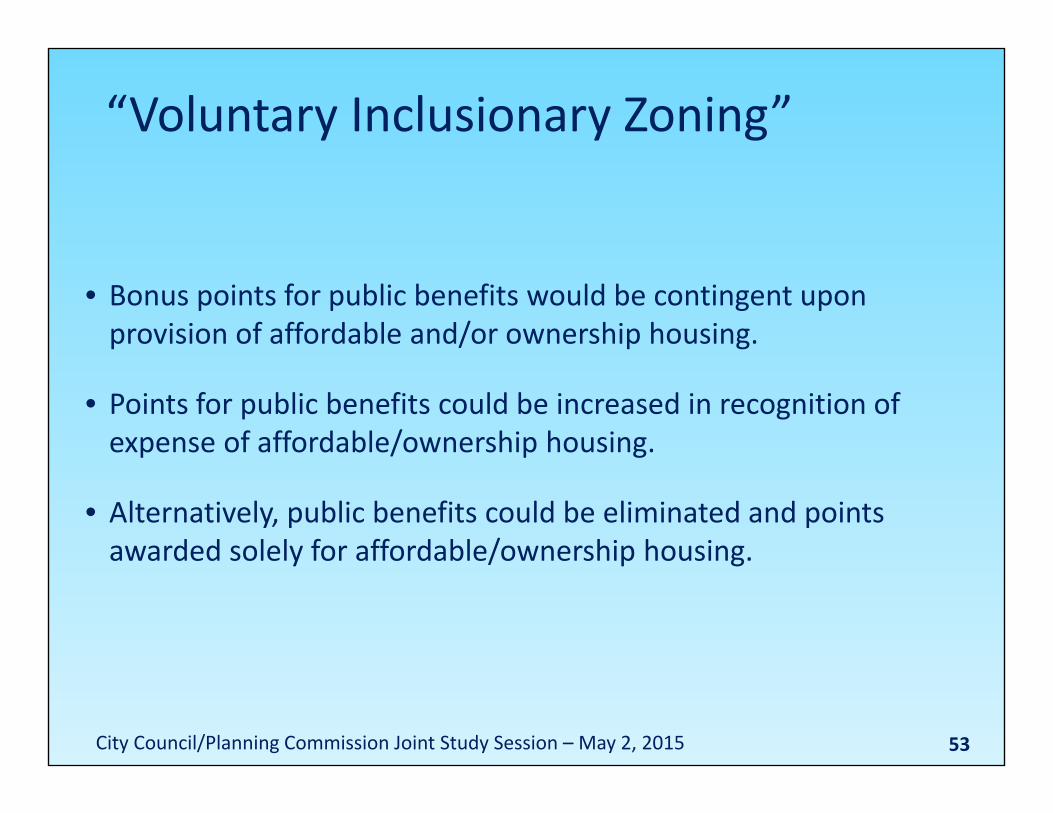
• Bonus points for public benefits would be contingent upon provision of affordable and/or ownership housing.
• Points for public benefits could be increased in recognition of expense of affordable/ownership housing.
• Alternatively, public benefits could be eliminated and points awarded solely for affordable/ownership housing.
“Voluntary Inclusionary Zoning”
City Council/Planning Commission Joint Study Session – May 2, 2015
54
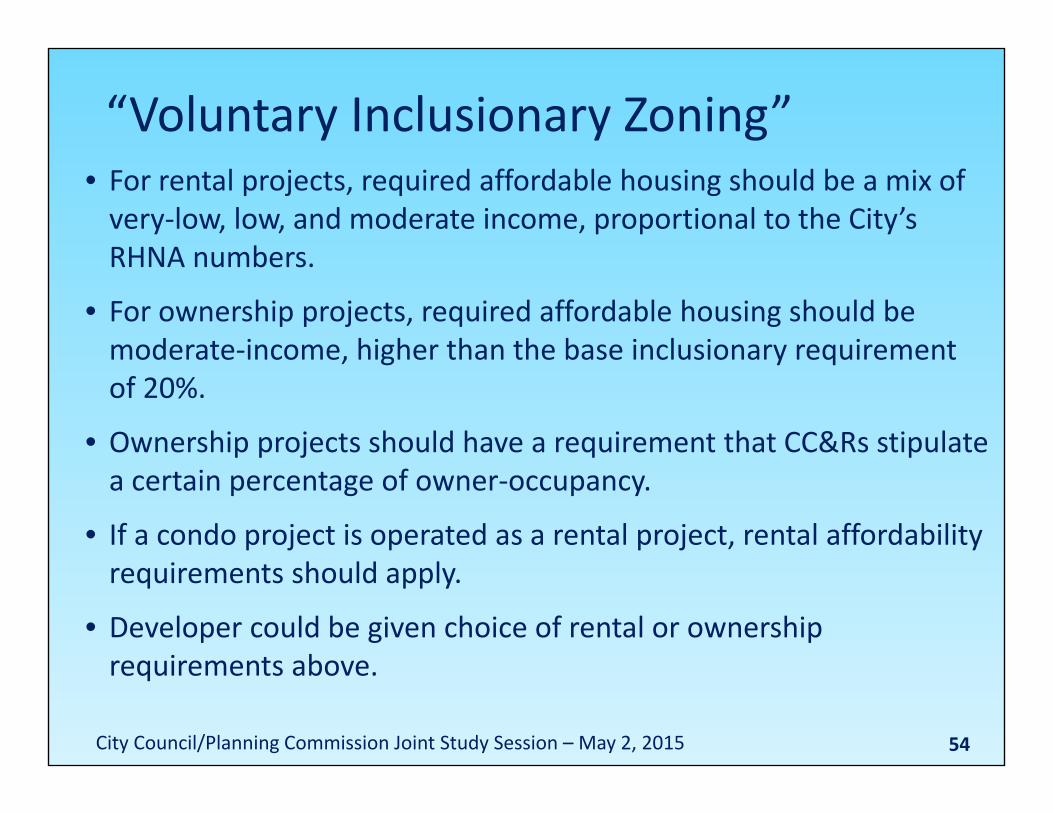
• For rental projects, required affordable housing should be a mix of very‐low, low, and moderate income, proportional to the City’s RHNA numbers.
• For ownership projects, required affordable housing should be moderate‐income, higher than the base inclusionary requirement of 20%.
• Ownership projects should have a requirement that CC&Rs stipulate a certain percentage of owner‐occupancy.
• If a condo project is operated as a rental project, rental affordability requirements should apply.
• Developer could be given choice of rental or ownership requirements above.
“Voluntary Inclusionary Zoning”
City Council/Planning Commission Joint Study Session – May 2, 2015

55
• Mandated by State; included in Planning Regulations; rarely used.
• Density bonuses for at least 5% very low income, 10% low income, or 10% moderate income in common interest development.
• Maximum bonus of 35% for 11% very low income, 20% low income, or 40% moderate income.
• City must provide one, two, or three unspecified “incentives or concessions”, depending on percent of affordable units.
• Staff suggests developer should have choice of State Density Bonus Law or City bonus system, but not both.
State Density Bonus Law
City Council/Planning Commission Joint Study Session – May 2, 2015

56
• Should affordable housing and/or ownership housing be made a prerequisite for earning a development bonus?
• Should the base FAR, height, and residential density be lowered to require more projects to earn development bonuses?
• What is the appropriate mix of rental and ownership housing? Should all future projects be required to be ownership in order to earn development bonuses?
• What percent of units at various levels of affordability should be required for rental and ownership projects? Should this be proportional to the level of bonus being requested?
• What other changes to the development bonus point system are desired?
Discussion Questions
City Council/Planning Commission Joint Study Session – May 2, 2015
57
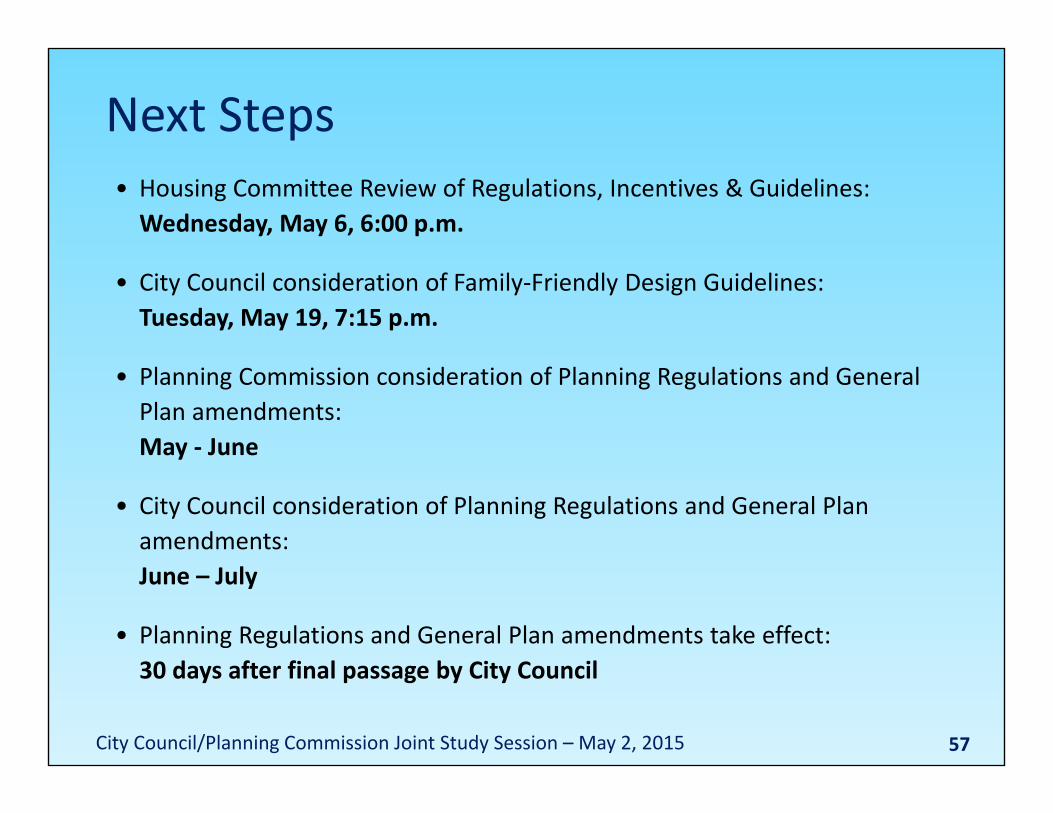
• Housing Committee Review of Regulations, Incentives & Guidelines:Wednesday, May 6, 6:00 p.m.
• City Council consideration of Family‐Friendly Design Guidelines:Tuesday, May 19, 7:15 p.m.
• Planning Commission consideration of Planning Regulations and General Plan amendments:May ‐ June
• City Council consideration of Planning Regulations and General Plan amendments:June – July
• Planning Regulations and General Plan amendments take effect:30 days after final passage by City Council
Next Steps
City Council/Planning Commission Joint Study Session – May 2, 2015

58
Thank You
City Council/Planning Commission Joint Study Session – May 2, 2015
Top Related
