


Languages
Pages
Legal

BRE Bank Securities
16 March 2011
PKN Orlen
BRE Bank Securities
Update 16 March 2011
PKN Orlen Sell PKNA.WA; PKN PW (Downgraded)
Fuels
Poland
Avg daily trading volume (3M)
Free float
Market cap
Target price
Current price PLN 50.00
PLN 41.60
PLN 21.4bn
PLN 15.5bn
PLN 117.2m
Market Optimism in a Weak Environment
Since we issued our negative rating for Orlen, the stock price has risen by 7% despite a clear turn for the worse in the macroeconomic environment. The market seems to be ignoring the very unfavorable crack spreads, the rising cost of petroleum use for internal needs and the announcement of maintenance downtimes at the Płock refinery, which will depress the profits for H1’11. Investor optimism may soon be cooled down, however, by the publication of LIFO earnings for Q1, which are expected to be weak, also because of the decline in the “inland margin” due to intensifying domestic competition. A high gain on inventory revaluation will hardly compensate for this, all the more so that without another sale of mandatory reserves it will be charged against operating cash flows in full. Note also that the clear reduction in net debt attained at the end of 2010 thanks to working-capital changes is not sustainable in the medium term and is equivalent to the reclassification of loans as another category of liabilities. We are downgrading our rating to sell while increasing our target price slightly to PLN 41.6 per share (the impact of Polkomtel valuation).
Very disadvantageous macroeconomic trends, downtimes The current optimism in the petroleum market is not paired with positive trends in the refining segment. Product margins are considerably lower than last year, which is not offset by the higher Urals/Brent pricing differential stemming from a short-term disequilibrium in the market for light crude caused by downtimes on Shell's rigs and lack of supplies from Libya. In the two initial months of the year, Orlen’s integrated benchmark margin was 7% lower than in the same period of 2010 and a whooping 25% lower than the average for 2010. These calculations are even more worrying if we remember that they ignore the rising cost of petroleum use for own energy use, the very low crack spreads on asphalts and the weakening inland premium (estimated at PLN 990m in 2010). In addition, the Management’s maintenance plans for 2011 cannot be ignored, as they are more extensive than last year’s (additional 100 “maintenance days”, plus the fact that the work will be carried on key refining installations, which may be particularly painful at the time of high negative crack spreads on HSFO).
True impact of the new mandatory reserve law As work on the new mandatory reserve law is nearing its end, expectations that the frozen cash will be freed have been rekindled. However, what government’s proposals really mean for Orlen is that instead of maintaining the property required for operations on its own balance sheet it will become a "lessee”; instead of maintaining and financing the property, it will pay a "lease". Therefore, from the point of DCF valuation the impact of the new law is close to the current stock ticket contract, and it is not possible to simply add the discounted stocks (taking into account the fact that they will be gradually bought out) to the Company's valuation.
Shareholder Structure
Sector Outlook
Refining margins have returned to their pre-crisis levels, however, OECD demand remains week while refiners across the world are about to launch new capacities, making for grim prospects for oil refiners in the next few years. Speculative hikes in oil prices are putting an additional squeeze on refining margins.
Company Profile
PKN Orlen is the largest refinery in the CEE region, with 28 million tons of annual capacity. In addition to crude refining, PKN Orlen is also active in the chemicals industry via its subsidiary Anwil, and in petrochemicals through BOP. In 2005, PKN Orlen took over the Czech “Unipetrol” group, followed by the acquisition of Lithuania’s Mazeikiu Nafta in 2006.
Kamil Kliszcz
(48 22) 697 47 06
www.dibre.com.pl
BRE Bank Securities does not rule out offering brokerage services to an issuer of securities being the subject of a recommendation. Information concerning a conflict of interest arising in connection with issuing a recommendation (should such a conflict exist) is located on the final page of this report.
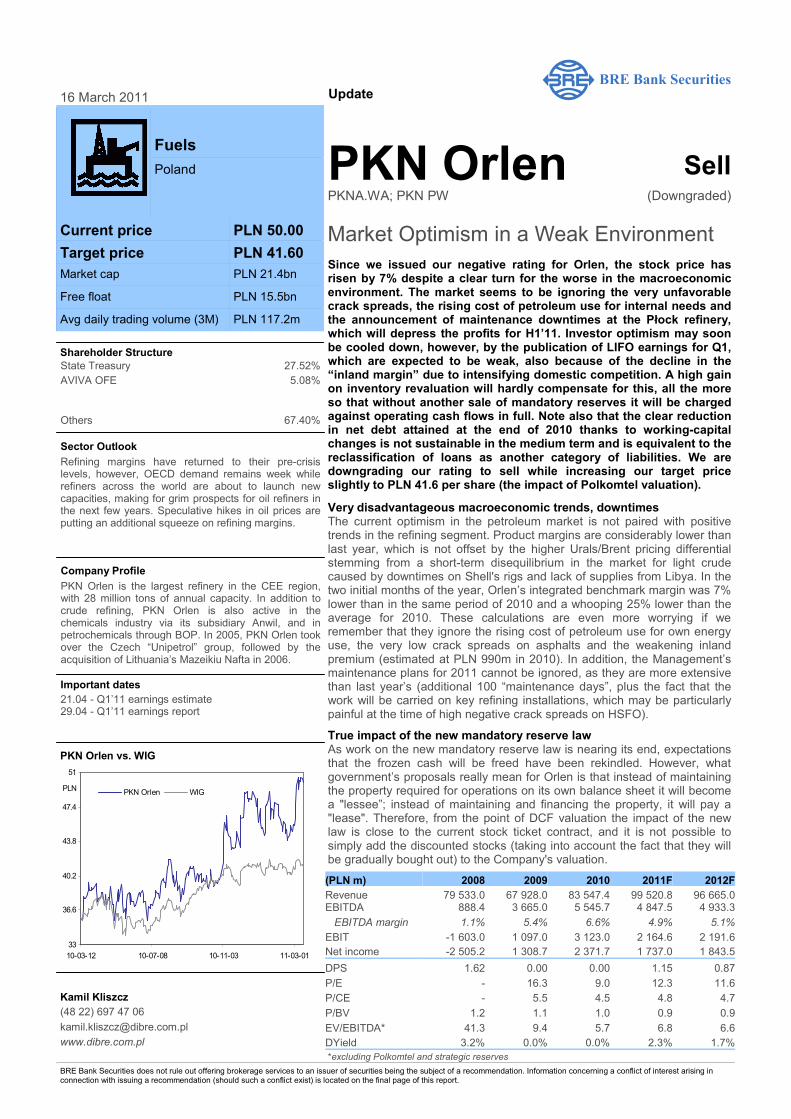
PKN Orlen vs. WIG
State Treasury 27.52%
AVIVA OFE 5.08%
Others 67.40%
(PLN m) 2008 2009 2010 2011F 2012F
Revenue 79 533.0 67 928.0 83 547.4 99 520.8 96 665.0 EBITDA 888.4 3 665.0 5 545.7 4 847.5 4 933.3
EBITDA margin 1.1% 5.4% 6.6% 4.9% 5.1%
EBIT -1 603.0 1 097.0 3 123.0 2 164.6 2 191.6
Net income -2 505.2 1 308.7 2 371.7 1 737.0 1 843.5
DPS 1.62 0.00 0.00 1.15 0.87
P/E - 16.3 9.0 12.3 11.6
P/CE - 5.5 4.5 4.8 4.7
P/BV 1.2 1.1 1.0 0.9 0.9
EV/EBITDA* 41.3 9.4 5.7 6.8 6.6
DYield 3.2% 0.0% 0.0% 2.3% 1.7%
*excluding Polkomtel and strategic reserves
Important dates
21.04 - Q1’11 earnings estimate 29.04 - Q1’11 earnings report
33
36.6
40.2
43.8
47.4
51
10-03-12 10-07-08 10-11-03 11-03-01
PLNPKN Orlen WIG

PKN Orlen
16 March 2011 2
BRE Bank Securities
Q4 2010 Results and 2011 Outlook
PKN Orlen’s Q4 2010 consolidated operating profit of PLN 747m added to the full-year EBIT figure of PLN 3.1 billion. Before discussing segmental contributions, we want to point out that this result was owed largely to LIFO effects which amounted to PLN 1.4bn for the full year and PLN 499m in the fourth quarter. PKN’s financial operations in the fourth quarter (including PLN 37m dividends from Polkomtel) generated a PLN 49m loss which included net interest expenses in the amount of PLN 70m and negative F/X differences (related to euro loans and other balance-sheet items). The full-year financial losses resulted in a small, PLN 53m charge against pre-tax profit as interest expenses (PLN 325m net) were offset by positive F/X differences (PLN 34m) and the profits of Polkomtel consolidated using the equity method (PLN 252m). After tax paid at an effective rate of 20% and PLN 84m minority interests, the full-year consolidated bottom-line profit amounted to PLN 2.37bn, implying a P/E ratio of 9.1 estimated based on the current market cap (after adjustment for inventory revaluations, the ratio is 17.6).
Consolidated historical quarterly results 1Q 08 2Q 08 3Q 08 4Q 08 1Q 09 2Q 09 3Q 09 4Q 09 1Q 10 2Q 10 3Q 10 4Q 10
Revenue 17 938 22 093 23 057 16 445 14 702 16 770 18 649 17 807 17 442 21 068 22 106 22 931
EBIT 565 1 646 512 -1 965 -320 661 423 334 464 1 123 789 747
Refineries 330 1 407 184 -1 778 -116 770 137 333 426 983 462 610 LIFO effect for
refineries 355 845 -316 -2 713 -292 890 271 160 375 453 60 469
Retail 70 109 247 165 87 223 363 207 75 216 309 224
Petrochemicals 187 35 104 -97 -162 -180 32 17 85 84 132 175
LIFO effect for petchem -17 9 1 -112 46 38 36 3 40 -12 -7 30
Chemicals 91 73 87 33 90 8 34 -34 20 38 10 -58
Other 0 74 29 33 0 0 0 0 0 0 0 0
Unattributed -113 -52 -139 -321 -219 -160 -142 -189 -142 -198 -124 -204
LIFO EBIT 227 792 827 860 -74 -267 116 171 49 682 736 248
D&A 587 607 607 690 651 656 627 633 601 612 614 596
EBITDA 1 152 2 253 1 119 -1 275 331 1 317 1 050 967 1 065 1 735 1 403 1 343
Financial operations 225 491 -388 -1641 -951 674 685 -65 327 -1005 675 -49
Pre-tax profit 790 2 137 124 -5 968 -1 271 1 335 1 108 269 791 118 1 463 698
Net profit 626 1 740 21 -4 893 -1 095 1 171 931 302 593 -5 1 242 541 Source: PKN Orlen, estimates by BRE Bank Securities
As mentioned, forex volatility had little impact on PKN Orlen’s financial income in 2010. This does not mean, however, that the refiner’s earnings are not sensitive to USD/PLN and EUR/PLN trends. The euro exposures are mainly loans which, at 31 December 2010, approximated EUR 1 billion. A 10 groszy change in any direction in the Polish currency’s value relative to the euro implies negative or positive exchange differences totaling PLN 100m. As for dollar exposures, on dollar debt incurred toward investment in Orlen Lietuva, P&L impacts come mainly from working-capital adjustments, specifically accounts receivable and payable. Since PKN’s crude oil payables are much higher than current trade credits extended to customers, any increase in the USD/PLN exchange rate entails negative FX differences. In its 2009 financial statements, PKN estimated that a change by 10 groszys in the zloty’s value relative to the dollar results in exchange differences to the tune of PLN 121m. This sensitivity may be even greater in 2011 because of payment extensions which drove the excess of payables over receivables from PLN 6.1bn at December 2009 to PLN 7.3bn at December 2010. If we apply these considerations to the current situation in forex markets, we can say that the impact of FX differences on PKN’s profits in the first quarter of 2011 will be slightly positive as any losses on FCY loan translations should be offset by gains on working capital.

PKN Orlen
16 March 2011 3
BRE Bank Securities
FX differences vs. exchange-rate trends
-785
351 376148
319
-468
224
-12
-57
268 350
-148
23
-573
470
-15%
-10%
-5%
0%
5%
10%
15%
20%
25%
-1 200
-1 000
-800
-600
-400
-200
0
200
400
600
800
1 000
1Q 09 2Q 09 3Q 09 4Q 09 1Q 10 2Q 10 3Q 10 4Q 10
Other F/X differences Loan revaluations
USD/PLN change EUR/PLN change
3.5
3.6
3.7
3.8
3.9
4.0
4.1
4.2
4.3
2.5
2.7
2.9
3.1
3.3
3.5
Jan
-10
Ma
r-1
0
Ma
y-1
0
Jul-
10
Se
p-1
0
No
v-1
0
Jan
-11
Ma
r-1
1
EUR/USD EUR/PLN Source: PKN Orlen, estimates by BRE Bank Securities
Refinery PKN Orlen’s refining business generated a LIFO EBIT of a whopping PLN 1.1bn in 2010 compared to just PLN 95m posted in 2009, and the figure would have been even higher if it had not been for a PLN 180m impairment loss recognized on the assets of Orlen Lietuva. Such impressive year-on-year growth was achieved thanks to a wider Urals/Brent differential (a PLN 347m increase) and higher crack spreads on the different products (a PLN 637m increase). Looking at the operations making up the Refinery segment, as always, the biggest contributions came from the refinery in Płock which generated a PLN 1.3bn LIFO EBIT (marking an increase by PLN 921m from 2009), but better-than-a-year-ago performance was also achieved by Unipetrol (with an EBIT loss of PLN 85m vs. PLN 374m a year earlier) and Orlen Lietuva (which posted an adjusted EBIT loss of PLN 122m vs. PLN 390m in 2009). Other refining operations (including Orlen Asfalt and Rafineria Trzebinia) reported deteriorated profitability, with LIFO EBIT down to PLN 191m from PLN 460m a year earlier, caused by high oil prices which depressed asphalt margins (which had peaked in 2009), and by a structural oversupply of biofuels on the CEE market combined with much higher rapeseed prices.
PKN Orlen’s oil output and refinery CUR, basic fuel wholesale volumes (millions of tons)*
6.5 7.3 7.4 7.1 6.8 6.6 7.3 6.6 6.2 6.9 7.4 7.560%
65%
70%
75%
80%
85%
90%
95%
100%
105%
6.0
6.2
6.4
6.6
6.8
7.0
7.2
7.4
7.6
7.8
1Q 0
8
2Q 0
8
3Q 0
8
4Q 0
8
1Q 0
9
2Q 0
9
3Q 0
9
4Q 0
9
1Q 1
0
2Q 1
0
3Q 1
0
4Q 1
0
Oil output CUR Płock CUR Mazeikiai CUR Unipetrol
1.72.2 2.0 1.9 1.9 1.9 2.0 1.9 1.6 1.9 2.0 1.9
2.6
3.1 3.22.8 2.9 2.9 3.0 2.9
2.6
3.2 3.4 3.2
0.0
1.0
2.0
3.0
4.0
5.0
6.0
1Q 0
8
2Q 0
8
3Q 0
8
4Q 0
8
1Q 0
9
2Q 0
9
3Q 0
9
4Q 0
9
1Q 1
0
2Q 1
0
3Q 1
0
4Q 1
0
Diesel Gasoline
Source: Source: PKN Orlen, BRE Bank Securities; *including external wholesale and sales to PKN Orlen fuel stations
LIFO inventory adjustments provided a huge, PLN 1.4bn boost to PKN’s 2010 EBIT, thus creating a high comparable base for 2011. If oil prices were to continue rallying throughout the year, 2011 LIFO effects could match those achieved last year. However, we do not think it likely that the current high prices of Brent crude are sustainable. According to our estimates, a high positive LIFO effect reported in Q1 2011 (which may reach PLN 1.2-1.4bn) will be largely offset by charges incurred in the following quarters, resulting in a full-year effect of about PLN 500m (assuming that oil prices drop to US $95/Bbl by December).
Urals crude prices (PLN/Bbl)
190210230250270290310330350
Jan-
10
Feb-
10
Mar
-10
Apr
-10
May
-10
Jun-
10
Jul-1
0
Aug
-10
Sep
-10
Oct
-10
Nov
-10
Dec
-10
Jan-
11
Feb-
11
Mar
-11
1Q'20114Q'2010
Source: BRE Bank Securities based on Bloomberg data

PKN Orlen
16 March 2011 4
BRE Bank Securities
As for LIFO EBIT, we expect it to decrease to PLN 0.8bn in 2011 from PLN 1.1bn in 2011, due to factors including a narrower geographic premium which is under pressure from growing domestic competition and high costs of extended maintenance downtime at the Płock refinery scheduled for Q1 and Q2 (hydrogen, hydrocracking and residue desulfurization units) – contrary to earlier predictions, the downtime will cause a year-on-year decline in the refinery’s output. Refining margins are set to rebuild in the course of the year assuming a downward shift in oil prices, though from levels which are a far cry from the 2010 averages at the moment, and which are not fully offset by the Urals/Brent differential. Other factors affecting this year’s profits of the Refining segment will include decreasing asphalt margins, possible downward pressure on biofuel margins, and growing costs of internal oil usage.
PKN Orlen's refining margins, Ural/Brent spread (US D/Bbl)
-1
5
10
15
20
25
30
35
40
Jan-
06
Apr
-06
Jul-0
6
Oct
-06
Jan-
07
Apr
-07
Jul-0
7
Oct
-07
Jan-
08
Apr
-08
Jul-0
8
Oct
-08
Jan-
09
Apr
-09
Jul-0
9
Oct
-09
Jan-
10
Apr
-10
Jul-1
0
Oct
-10
Jan-
11
Apr
-11
PKN's aggregate margins (cracks+heavy-crude spread+ 12% internal usage)
-1
1
2
3
4
5
6
Jan
-06
Ap
r-0
6
Jul-
06
Oct
-06
Jan
-07
Ap
r-0
7
Jul-
07
Oct
-07
Jan
-08
Ap
r-0
8
Jul-
08
Oct
-08
Jan
-09
Ap
r-0
9
Jul-
09
Oct
-09
Jan
-10
Ap
r-1
0
Jul-
10
Oct
-10
Jan
-11
Ap
r-1
1
Urals/Brent spread Source: Bloomberg, estimates by BRE Bank Securities
Retail PKN Orlen’s 2010 retail fuel sales achieved record volumes after 4.6% year-on-year expansion, led by Polish and German service stations. In the Czech Republic, a rise in black market sales led to volume losses last year (ranging between 6% and 16% depending on the quarter and type of fuel). Unfortunately, expanded sales volumes went hand in hand with contracting margins caused by high retail prices (stemming from rallying crude and an increase in the diesel tax from PLN 98 to PLN 234 per cubic meter as of January 2010) and aggressive competition. As a consequence, the Retail segment’s earnings fell from PLN 880m to PLN 825m. PKN estimates that lower fuel margins alone drove the 2010 EBIT down by as much as PLN 215m versus the year before, confirming that rising wholesale prices cannot be immediately offset at the pump. The ultimate EBIT loss was reduced to PLN 55m thanks to lower costs (with D&A expenses down PLN 34m), a PLN 62m increase in other operating income (which amounted to PLN 24m vs. other operating expenses of PLN 38m reported a year earlier), and higher volumes. Retail EBIT vs. retail volumes by country, CAPEX
900
1100
1300
1500
1700
1900
2100
-50
0
50
100
150
200
250
300
350
400
1Q07
2Q07
3Q07
4Q07
1Q08
2Q08
3Q08
4Q08
1Q09
2Q09
3Q09
4Q09
1Q10
2Q10
3Q10
4Q10
Retail EBIT Lithuania Retail EBIT Czech Rep
Retail EBIT Germany Retail EBIT Poland
Retail volumes (right scale)
0
50
100
150
200
250
300
350
400
450
500
1Q07
2Q07
3Q07
4Q07
1Q08
2Q08
3Q08
4Q08
1Q09
2Q09
3Q09
4Q09
1Q10
2Q10
3Q10
4Q10
Retail CAPEX (PLN m)
Source: PKN Orlen
2011 is looking to be a year of continued profit erosion for PKN’s Retail business caused by record-high fuel prices which are depressing margins and affecting demand (January fuel sales volumes were reportedly 10% lower than in the same month a year ago). Added to this are the decreasing contributions of non-fuel sales generated by the PKN Orlen service stations which added just PLN 43m to the 2010 EBIT compared to a PLN 110m boost in 2009 and PLN 108m generated in 2008. This trend may be further exacerbated by the Polish government’s plans to ban alcohol sales at service stations. Note that alcohol sales were the main reason behind the structural improvement in the earnings of the Retail segment, and EBIT growth from PLN 439m in 2006 to over PLN 800m (the non-fuel sales margins generated between 2007 and 2010 were nearly PLN 300m higher than in 2006). Against this backdrop, we expect PKN’s Retail EBIT to decrease to PLN 783m in 2011, to again cross the PLN 800m mark in 2012 assuming a downward
PKN Orlen
16 March 2011 5
BRE Bank Securities
correction in petroleum prices. These estimates include the 56 German service stations bought in Q4 from OMV resulting in a PLN 58m addition to CAPEX.
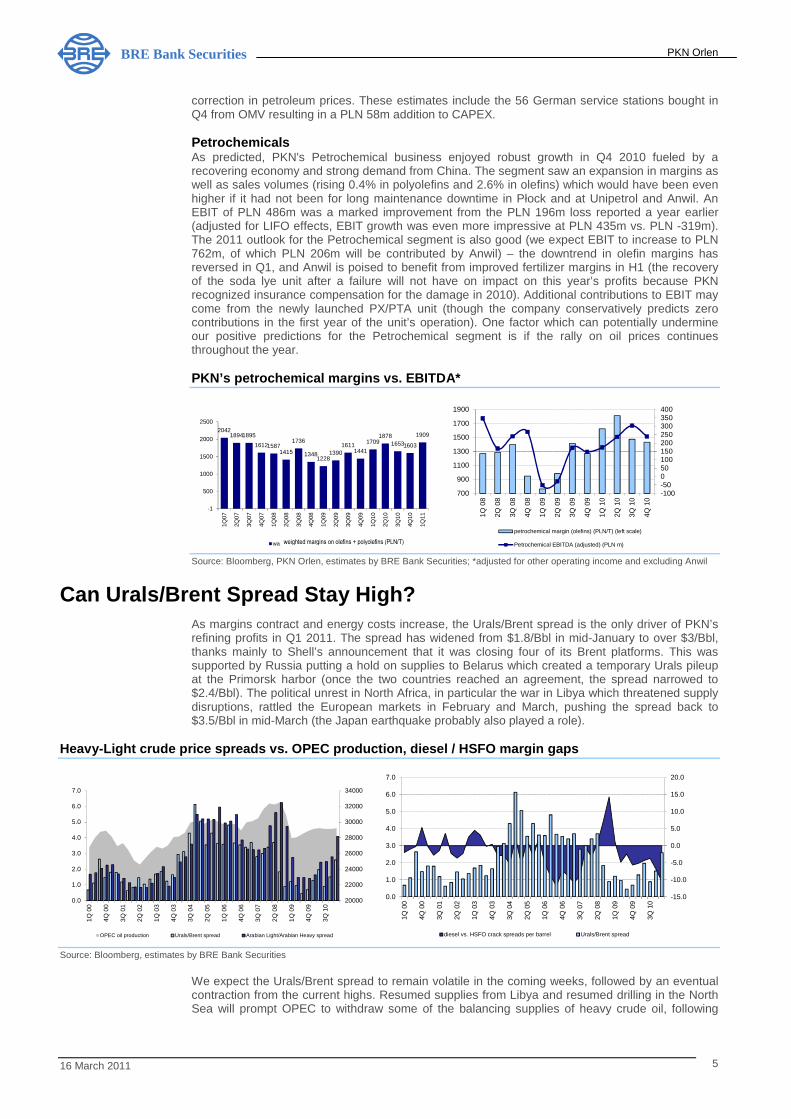
Petrochemicals As predicted, PKN's Petrochemical business enjoyed robust growth in Q4 2010 fueled by a recovering economy and strong demand from China. The segment saw an expansion in margins as well as sales volumes (rising 0.4% in polyolefins and 2.6% in olefins) which would have been even higher if it had not been for long maintenance downtime in Płock and at Unipetrol and Anwil. An EBIT of PLN 486m was a marked improvement from the PLN 196m loss reported a year earlier (adjusted for LIFO effects, EBIT growth was even more impressive at PLN 435m vs. PLN -319m). The 2011 outlook for the Petrochemical segment is also good (we expect EBIT to increase to PLN 762m, of which PLN 206m will be contributed by Anwil) – the downtrend in olefin margins has reversed in Q1, and Anwil is poised to benefit from improved fertilizer margins in H1 (the recovery of the soda lye unit after a failure will not have on impact on this year’s profits because PKN recognized insurance compensation for the damage in 2010). Additional contributions to EBIT may come from the newly launched PX/PTA unit (though the company conservatively predicts zero contributions in the first year of the unit’s operation). One factor which can potentially undermine our positive predictions for the Petrochemical segment is if the rally on oil prices continues throughout the year.
PKN’s petrochemical margins vs. EBITDA*
204218941895
161215871415
1736
13481228
13901611
1441
17091878
16531603
1909
-1
500
1000
1500
2000
2500
1Q07
2Q07
3Q07
4Q07
1Q08
2Q08
3Q08
4Q08
1Q09
2Q09
3Q09
4Q09
1Q10
2Q10
3Q10
4Q10
1Q11
waŜona marŜa olefiny+poliolefiny w PLN/t
-100-50050100150200250300350400
700
900
1100
1300
1500
1700
1900
1Q 0
8
2Q 0
8
3Q 0
8
4Q 0
8
1Q 0
9
2Q 0
9
3Q 0
9
4Q 0
9
1Q 1
0
2Q 1
0
3Q 1
0
4Q 1
0
petrochemical margin (olefins) (PLN/T) (left scale)
Petrochemical EBITDA (adjusted) (PLN m) Source: Bloomberg, PKN Orlen, estimates by BRE Bank Securities; *adjusted for other operating income and excluding Anwil
Can Urals/Brent Spread Stay High? As margins contract and energy costs increase, the Urals/Brent spread is the only driver of PKN’s refining profits in Q1 2011. The spread has widened from $1.8/Bbl in mid-January to over $3/Bbl, thanks mainly to Shell’s announcement that it was closing four of its Brent platforms. This was supported by Russia putting a hold on supplies to Belarus which created a temporary Urals pileup at the Primorsk harbor (once the two countries reached an agreement, the spread narrowed to $2.4/Bbl). The political unrest in North Africa, in particular the war in Libya which threatened supply disruptions, rattled the European markets in February and March, pushing the spread back to $3.5/Bbl in mid-March (the Japan earthquake probably also played a role).
Heavy-Light crude price spreads vs. OPEC production , diesel / HSFO margin gaps
20000
22000
24000
26000
28000
30000
32000
34000
0.0
1.0
2.0
3.0
4.0
5.0
6.0
7.0
1Q 0
0
4Q 0
0
3Q 0
1
2Q 0
2
1Q 0
3
4Q 0
3
3Q 0
4
2Q 0
5
1Q 0
6
4Q 0
6
3Q 0
7
2Q 0
8
1Q 0
9
4Q 0
9
3Q 1
0
OPEC oil production Urals/Brent spread Arabian Light/Arabian Heavy spread
-15.0
-10.0
-5.0
0.0
5.0
10.0
15.0
20.0
0.0
1.0
2.0
3.0
4.0
5.0
6.0
7.0
1Q 0
0
4Q 0
0
3Q 0
1
2Q 0
2
1Q 0
3
4Q 0
3
3Q 0
4
2Q 0
5
1Q 0
6
4Q 0
6
3Q 0
7
2Q 0
8
1Q 0
9
4Q 0
9
3Q 1
0
diesel vs. HSFO crack spreads per barrel Urals/Brent spread
Source: Bloomberg, estimates by BRE Bank Securities
We expect the Urals/Brent spread to remain volatile in the coming weeks, followed by an eventual contraction from the current highs. Resumed supplies from Libya and resumed drilling in the North Sea will prompt OPEC to withdraw some of the balancing supplies of heavy crude oil, following
weighted margins on olefins + polyolefins (PLN/T)

PKN Orlen
16 March 2011 6
BRE Bank Securities
which the only source of discount in Urals quotes will be the unfavorable HSFO crack spread, not offset by diesel margins. Based on these predictions, we are raising our 2011 Urals/Brent spread estimate by $0.7 to $2/Bbl. In the long term, the spread will be kept low by new refineries in Asia focused on production of heavy crude.
Declining Margins, Rising Costs Refining margins in Europe have been on a decline since the beginning of 2011, suppressed by soaring oil prices which are increasingly harder to offset against wholesale prices, especially given the pressure on volumes. Competition from cheaper natural gas, combined with more stringent sulfur content restrictions, have had particularly severe consequences for the crack spreads on heavy fuel oil, bringing them to acute negative territory of $-240/T vs. an average $-142/T in 2010. With gasoline margins also on a decline, only middle distillates provide somewhat of a cushion against deteriorating refining margins. In the long run, however, demand for diesel, which is currently being fueled by Chinese manufacturers who are bypassing new energy consumption limits by generating their own energy from light fuel oil, is bound to slow down amid rallying crude prices. PKN’s aggregate refining margins (PLN/Bbl) (cracks+ heavy-light spread)
22
28
1416
11
18
13
18
15
6
3
6
11
57
2
-1
5
10
15
20
25
30
1Q
07
2Q
07
3Q
07
4Q
07
1Q
08
2Q
08
3Q
08
4Q
08
1Q
09
2Q
09
3Q
09
4Q
09
1Q
10
2Q
10
3Q
10
4Q
10
1Q
11
MarŜa zagregowana PKN w PLN
Source: Bloomberg, estimates by BRE Bank Securities
In addition to exchange-traded oil products, PKN Orlen’s profit margins also come from asphalts (read on for more details) and are influenced by internal oil-fueled energy-generating assets. In 2010, internal oil consumption was 13.3%, which gives an idea of the severity of the cash impact of high crude prices on the company’s profits. Since internal consumption is not taken into account in the calculations of benchmark margins, this may result in a misleading assessment of the current refining industry fundamentals. The diagrams below show our calculations of PKN Orlen’s aggregate zloty margins (cracks+heavy-light spread+internal consumption) which confirm that current market conditions are much less favorable than in Q1 2010 or during last year as a whole, in spite of higher Urals/Brent spreads. This conclusion is consistent with PKN’s own assessments as published on its Website (which, however, show benchmark margin calculations assuming internal oil consumption of just 6.5%). Oil costs as percentage of GDP in USA and EU
0.0%
1.0%
2.0%
3.0%
4.0%
5.0%
6.0%
7.0%
USA
0.0%
0.5%
1.0%
1.5%
2.0%
2.5%
3.0%
3.5%
4.0%
EU 27
Source: Eurostat, EIA, Bloomberg, IEA, forecasts by BRE Bank Securities Looking at the global oil market, we must note that current margin levels (which have clearly rebounded from their H2 2009 lows), though lower than the record highs seen in 2006-2008, are hovering close to their long-term averages. The same goes for capacity utilization rates which are a key medium-term profitability driver for the oil industry. Between 2000 and 2008, global fuel demand increased 11.1% while the refining capacity increased 7.5%, and the lag supported refinery margins and encouraged capacity expansion. According to predictions by the IEA, by 2015,
PKN’s aggregate margins (PLN)

PKN Orlen
16 March 2011 7
BRE Bank Securities
the world will have additional refining capacity of 7.5 million barrels per day. To match this increased supply, demand between 2011 and 2015 should grow at an annual rate of 1.7%. Meanwhile, at current crude prices, it seems that demand is more likely to decline than rise going forward. The diagrams below show that gasoline prices in Europe and the USA are approaching their 2008 highs, affecting especially the European economy (due to a strong dollar and Brent price premium). The impact of oil on GDP growth may be even stronger in case of China (which, according to IEA’s 2011 forecast, will consume 6% more of oil this year than last compared to a 3.7% increase expected in developing countries). Summing up, high prices of crude oil can slow down economic growth by generating additional costs for countries which subsidize energy (India, China) and for consumers who are paying dearly at the pump.
Retail prices of gasoline in EU and USA
800
900
1000
1100
1200
1300
1400
1500
1600
Jan-
06
Apr
-06
Jul-0
6
Oct
-06
Jan-
07
Apr
-07
Jul-0
7
Oct
-07
Jan-
08
Apr
-08
Jul-0
8
Oct
-08
Jan-
09
Apr
-09
Jul-0
9
Oct
-09
Jan-
10
Apr
-10
Jul-1
0
Oct
-10
Jan-
11
retail gasoline prices in EU (EUR/100 liters)
1.0
1.5
2.0
2.5
3.0
3.5
4.0
4.5
Jan
-06
Apr-
06
Jul-0
6
Oct
-06
Jan
-07
Apr-
07
Jul-0
7
Oct
-07
Jan
-08
Apr-
08
Jul-0
8
Oct
-08
Jan
-09
Apr-
09
Jul-0
9
Oct
-09
Jan
-10
Apr-
10
Jul-1
0
Oct
-10
Jan
-11
retail gasoline prices in USA (USD/gallon) Source: Eurostat, Bloomberg
Strategic Reserve Laws The Polish Ministry of the Economy has been working on amendments to our country's strategic petroleum reserve policy since early 2009. With public and industry consultations now over, it seems that the bill is on track to come under parliamentary debate. Under EU laws, the amended law must come into force by 1 January 2013 (though we can imagine that it could be implemented earlier, in 2012). The new policy provides that maintenance of strategic reserves will eventually be taken over by the Material Reserves Agency (ARM) in exchange for a fee charged from oil companies. The fee (which will be subject to quarterly adjustments) will include costs of storage and inventory turnover, insurance, and service of the debt incurred on petroleum purchases. The takeover process is expected to take 10 years during which the ARM will be gradually buying up the reserves currently kept by oil companies. These purchases are to be executed in such a way as not to increase national debt.
As the legislative process moves ahead, it is worth considering how the new policy will influence PKN Orlen which, at 31 December 2010, had PLN 5bn-worth of strategic reserves sitting on its balance sheet (PLN 4.6bn in Poland and PLN 0.4bn in Lithuania), plus a further PLN 2bn-worth in off-balance sheet liabilities (under ticketed option contracts). Some analysts have been saying recently that strategic reserves (after appropriate discounting) should be added to PKN’s value. We tended to agree with this during earlier stages of the legislative process, but we changed our mind after analyzing all the aspects of the proposed changes. Today, we argue that the new rules will be neutral to PKN’s valuation, based on the following rationale:
• The unloading of strategic reserves means lower debt and interest expenses, but on the other hand it will generate additional operating expenses stemming from the ARM fees which cannot be ignored when performing a DCF analysis – to consider just the discounted value of the reserves in the analysis would be a mistake;
• Since maintenance of strategic reserves is mandatory for all companies marketing fuel in Poland, it seems obvious that the costs incurred to comply with this requirement are reflected in the retail sales prices (analyses by the Economy Ministry indicate that this is indeed the case);
• It follows that the costs offset against the sales prices are the full costs of mandatory reserve maintenance, that is costs of financing as well as storage and logistics. Consequently, PKN Orlen's earnings as owner of the storage infrastructure (salt caverns with ca. 4.4MT storage capacity) include the full margins returned by those assets, that is the returns on the leased space as well as the space used for internal purposes (3.4MT);
• If storage costs decrease under the new policy for Polish market players across the board, in a fiercely competitive market, we think we can safely assume that all of these players will use this as an opportunity to lower their retail prices – which means that lower costs do not automatically mean higher margins for PKN;

PKN Orlen
16 March 2011 8
BRE Bank Securities
• The lower debt recognized on PKN’s balance sheet will only be an apparent improvement – the actual effect of the changes will be similar to the effect now seen under the ticketed option contracts which result in debt hidden off-balance sheet that still needs to be serviced (bank and ARM charges).
To put it another way, the impact of the new strategic reserve policy on PKN Orlen can be compared to a transition from ownership to leasing of a business-critical property where maintenance and financing costs are replaced by rental costs. From the point of view of the end consumer, the change is that the heretofore hidden ‘tax’ included in fuel prices to protect Poland’s energy security will be replaced by an official tax.
Inland Premium: Downside Risk Materializing The unprecedented competition between Orlen and Lotos for new wholesale contracts in late 2010 and early 2011 has confirmed that the risk of a decline in the “inland” (geographic) premium that we signaled in our last research report may materialize. To be sure, supplies ended up divided between the two concerns in similar proportions as in 2010 (with a slight decline in Orlen's share), but more intense competition did lead to more aggressive bidding, one example of which was Lotos’s taking over of Orlen’s contract with Shell Poland back in December, an event which must have made Orlen nervous as it was sitting down at the negotiating table with its other customers. Note that in order to secure exclusivity of supplies to Shell, Lotos must have outbid Orlen on the financial terms of the contract, because it has no logistic or geographical advantage. Although Lotos must sell some 2Mt of additional products from its new “10+” installation this year, we expected that it would export this surplus rather than engage in price wars. Still, with the inland premium at a record-high level, an attempt to maximize domestic market share is sensible even if it entails a reduction in average margins to a certain level. It should be remembered that prices obtainable in seaborne trade are much lower than domestic prices, and that exports entail additional selling costs. One could argue at this point that the strength of the demand for diesel in Poland and the degree to which this market depends on imports should limit the impact of additional volumes on margins, all the more so that in 2011 Lotos will mostly increase gasoline and aircraft fuel sales (new diesel output will replace imports and production based on unfinished derivatives), while maintenance work at the Płock refinery will prevent Orlen from supplying the promised additional 1Mt of diesel. While this is true to a certain extent, note that Lotos will not yet be able to sell aircraft fuel in Poland (the liberalization of supplies to the Warsaw airport is a process which has begun only recently), which may induce it to change its product mix towards diesel (the technology used in middle distillate manufacturing is flexible enough to allow for this). In addition, recall that Orlen and Lotos control over 90% of the Polish diesel market at this time, i.e. most of its imports as well. Therefore, in order to replace imports with domestic output, they would have to squeeze the competing volumes out of the market (volumes which also provide the attractive “inland premium”). All this is not just theoretical speculation: at the post-earnings conference call, the Management of Orlen admitted that margins were under pressure.
Orlen’s and Lotos’s shares in the Polish market for diesel and in imports (PLN m)
Source: Polish Organization of Oil Industry and Trade, estimates by BRE Bank Securities: *Orlen’s and Lotos’s shares include imports controlled by them.
The discussion on the inland premium is an important one, because the additional revenue it provides has a material impact on the earnings of Polish refineries. Of course, we do not know the value, but an estimate is possible based on fuel price quotes in Bloomberg, PKN Orlen's wholesale prices and its inland premium from 2004-2005 (the Company used to report this value in PLN million until 2005). Our calculations, presented on the chart below, suggest that the impact of the inland premium on the Company's earnings in 2009-2010 may have approached PLN 800-900m, representing a considerable increase vs. the preceding years, a development which we attribute to the economic crisis, which weakened the importers’ position and made it possible for Polish concerns to increase their shares. Deteriorating macroeconomic conditions led industry players to
0 2 4 6 8
10 12 14
2006 2007 2008 2009 2010
Diesel supplies
Orlen Lotos Others 0 1 1 2 2 3 3 4 4 5
2007 2008 2009 2010
Diesel imports
Orlen Lotos Others

PKN Orlen
16 March 2011 9
BRE Bank Securities
concentrate on their home markets, as a result of which arbitrage failed to work as expected. Since the start of 2011, we have been observing a decline in the inland premium calculated this way, which is all the more significant given the rising prices of crude oil, which affect transportation costs, i.e. one of the factors underlying the difference between wholesale prices in Poland and international benchmarks. In our opinion, this factor should be taken into account when forecasts are constructed on the basis on benchmark margins estimated from data provided by Bloomberg and similar agencies. Inland premium on diesel, PKN Orlen’s estimated inl and premium*
120
170
220
270
320
370
1Q 0
6
3Q 0
6
1Q 0
7
3Q 0
7
1Q 0
8
3Q 0
8
1Q 0
9
3Q 0
9
1Q 1
0
3Q 1
0
1Q 1
1
Inland premium on diesel**
100200
300400500600700800900
1000
2003
2004
2005
2006
2007
2008
2009
2010
PKN Orlen's inland premium, PLN m Source: Orlen, estimates by BRE Bank Securities; *data for 2003-2005 as reported by PKN Orlen, for the following years as estimated by BRE Bank Securities; **the theoretical inland premium is estimated from prices reported by Bloomberg and PKN Orlen's wholesale prices for smaller buyers. These estimates seem to be confirmed by an analysis of the standalone EBITDA of the Płock refinery and the benchmark margins calculated for its product slate (crack spreads plus Urals/Brent spread), which have converged significantly since Q3 2008. Moreover, in some quarters, PKN has reported better earnings than would have been implied by benchmark margins. One thing worth noting is the major discrepancy in quarterly earnings between the Płock refinery and Orlen's other refineries (Mazeikiu Nafta, Unipetrol), which are unable to secure such a high “inland premiums” in their own domestic markets.
PKN Orlen: LIFO EBIT by refinery, divergence vs. be nchmarks at the Płock refinery
-400
-300
-200
-100
0
100
200
300
400
500
600
1Q 09 2Q 09 3Q 09 4Q 09 1Q 10 2Q 10 3Q 10 4Q 10
Other Mazeikiu Nafta Unipetrol PKN Orlen
-1.0
-0.8
-0.6
-0.4
-0.2
0.0
0.2
0.4
0.6
1Q 0
7
3Q 0
7
1Q 0
8
3Q 0
8
1Q 0
9
3Q 0
9
1Q 1
0
3Q 1
0
Divergence from benchmark in USD/Bbl* Source: PKN Orlen, estimates by BRE Bank Securities
Asphalts: Margins Could Plunge in Poland Last year was not as good for asphalt production as 2009, when the rapid growth of road construction in Poland combined with relatively low crude oil prices allowed for a significant improvement in the profitability of this product. The average cracks spreads vs. the price of Brent crude (ignoring sales in Q1 due to strong seasonal patterns) have fallen from -PLN 53/t to -PLN 183/t (compared to the 2004-2008 average of -PLN 447m), which, with sales volumes at 1Mt, translates into a PLN 150m y/y reduction in the consolidated gross margin, a development that is consistent with the 2010 decline in the earnings of Orlen's "other" operations by a whooping -PLN 269m. A deterioration in this area is of course a consequence of the fact that there is no mechanism linking end-product prices to crude oil prices, which makes it more difficult to transfer the rising expenses onto customers. This was particularly clear towards the end of the year, as illustrated by the chart below. The early months of 2011 have also given little ground for optimism, because, while asphalt prices have practically not budged since September 2010, the price of petroleum has been rising fast, with the average crack spread exceeding -PLN 500/t in Q1'11. This is not yet a high sales season for asphalts and Orlen Asfalt might still decide to implement price hikes in the spring, but just as in 2008 we should expect weak margins. If crude oil does not depreciate significantly, Orlen's earnings on asphalts might resemble its 2008 performance. We do

PKN Orlen
16 March 2011 10
BRE Bank Securities
not have access to the income statement of Orlen’s asphalt maker subsidiary, but we believe that the integrated margin in this area could decline by over PLN 100-150m this year, a possibility worth remembering, all the more so that asphalts are not taken into account in the calculation of the benchmark refining margin. Asphalt margins, asphalt shares in Lotos’s and PKN’ s refinery slates
-1200-1000-800-600-400-2000200400600800
0200400600800
100012001400160018002000
Jan-
06
Jul-0
6
Jan-
07
Jul-0
7
Jan-
08
Jul-0
8
Jan-
09
Jul-0
9
Jan-
10
Jul-1
0
Jan-
11
Asphalt-Brent crude crack spread (right scale)Average asphalt price
5% 5% 5%5% 4% 4% 4%
8%
11%
13%15%
14%15%
10%
0%2%4%6%8%
10%12%14%16%
2004 2005 2006 2007 2008 2009 2010
Share of asphalts in throughput
Orlen Lotos
Source: PKN Orlen, Lotos, estimates by BRE Bank Securities
Fixed Costs: Overview of 2010, Outlook for 2011 In our previous research report, we paid more attention than usual to fixed expenses, whose reduction was one of the drivers of the major y/y improvement in Orlen's earnings in Q1-Q3 2010. Now that we know the full-year earnings, it is worth looking at the individual areas, because we believe a correct interpretation of these savings and an assessment of how lasting they are going to be are a prerequisite for more precise forecasts of 2011 earnings. To be sure, the consolidated G&A expenses fell by PLN 141m y/y, unattributed expenses declined by PLN 42m, and, according to a simplified calculation, overall fixed costs have diminished by close to PLN 153m. The question is, however, to what extent these reductions were owed to streamlining, and to what extent they were achieved thanks to one-time events and external factors.
Consolidated fixed costs* and other operating incom e/expenses**
1 9642 057
2 210
2 707
2 216 2 247 2 2022 027 1 996
2 193 2 142 2 209
800
1 300
1 800
2 300
2 800
1Q
08
2Q
08
3Q
08
4Q
08
1Q
09
2Q
09
3Q
09
4Q
09
1Q
10
2Q
10
3Q
10
4Q
10
Fixed costs*
8
88
-23
-247
-34
55
-34
44 34 4418
-194
-300
-250
-200
-150
-100
-50
0
50
100
150
1Q 0
8
2Q 0
8
3Q 0
8
4Q 0
8
1Q 0
9
2Q 0
9
3Q 0
9
4Q 0
9
1Q 1
0
2Q 1
0
3Q 1
0
4Q 1
0
Other net operating income/expenses Source: PKN Orlen, analysis by BRE Bank Securities; *the category includes depreciation and amortization, payroll and outsourcing expenses and taxes and fees; **data for Q4 2008 adjusted for a write-down on Mazeikiu Nafta in the amount of PLN 2.2bn.
PKN's other operating income, which can be said to be the main source of one-time impacts on earnings, figured to -PLN 98m in 2010 vs. +PLN 31m one year before. The main driver of the y/y deterioration were write-downs on the assets of Mazeikiu Nafta and the Czech Spolana, which were only partially offset through claims paid (including for the failure of the lye-making installation and subsidies on account of NOx emission reduction in the amount of +PLN 100m y/y). In addition, Orlen created PLN 40m worth of provisions more (including provisions for employee benefits), but reduced write-downs on receivables by PLN 38m. Needless to say, it is difficult to forecast the individual components of other net operating income, but it seems that the Company should no longer generate negative surprises in its asset write-downs (and should post lower costs of post-maintenance clean-up, although this will coincide with lower claim payments and lower gains on asset divestment, which amounted to a total of PLN 115m last year), which is why we expect that income and costs will balance each other out in this position, leading to a ca. PLN 100m improvement in EBIT. In terms of individual cost categories in the three initial quarters of last year, the biggest drop (-PLN 151m) was observed for outsourced services, but, as we have pointed out before, most of this cut applied to Q1’10 and must have been caused by tough weather conditions and a decline in

PKN Orlen
16 March 2011 11
BRE Bank Securities
maintenance work. These savings from the early months of the year were fully offset by higher expenses in Q4 (PLN 965m vs. PLN 802m one year earlier), when we saw accumulation of maintenance downtimes (28 days off on the reforming facility at Mazeikiu Nafta, and a 15-day downtime for Unipetrol's hydrocracking installation coupled with a 10-day downtime in the petrochemical division). As a reminder, in Q4’09 Orlen did not conduct any major maintenance work, which explains why the y/y change is big. The outlook for the key cost categories in 2011 gives little ground for optimism, because even more maintenance work has been planned for this year, including on key refining installations. This is difficult to quantify, but one exercise that might illustrate the increase in expenses in this area is a calculation of the total number of maintenance days (ca. 445 days vs. 316 days in 2010, excluding Anwil's nearly six-month downtime on the soda lye installation, whose length was not caused by actual maintenance work but delayed supplies of requisite spare parts). Give the abovementioned increase in outsourcing costs in Q4, the decline in FY10 fixed expenses was primarily a consequence of a PLN 145m reduction in D&A charges, however, this decrease was partly owed to a stronger zloty which influenced translations of the euro-nominated D&A charges incurred by the German fuel stations and Orlen Lietuva (the Lithuanian lita is pegged to the euro). The FX market is currently much more volatile than in the third quarter, making it hard to predict whether the D&A charges can be kept lower in the periods ahead. Note also that depreciation of the new PX/PTA unit is scheduled to start next year.
Key fixed-cost components
822 810
1 050
1 267
945 956 997
802 816968 962 965
0
200
400
600
800
1 000
1 200
1 400
1Q08
2Q08
3Q08
4Q08
1Q09
2Q09
3Q09
4Q09
1Q10
2Q10
3Q10
4Q10
Outsourced services
587607 608
690651
656 627633
601 612 614596
3.153.353.553.753.954.154.354.554.75
500
540
580
620
660
700
1Q08
2Q08
3Q08
4Q08
1Q09
2Q09
3Q09
4Q09
1Q10
2Q10
3Q10
4Q10
Depreciation EUR/PLN
431
549
435
633
502527
481 495471
511473
537
300
350
400
450
500
550
600
650
1Q08
2Q08
3Q08
4Q08
1Q09
2Q09
3Q09
4Q09
1Q10
2Q10
3Q10
4Q10
Salaries Source: PKN Orlen, BRE Bank Securities
With regard to payroll expenses in FY11, Orlen was unable to keep its savings at the Q1-Q3 level (-PLN 54m y/y), and posted a nominal reduction in costs (-PLN 13m). We do not know detailed employment data as of the end of the year, but it seems that restructuring efforts undertaken so far (layoffs at Mazeikiu Nafta, voluntary redundancy program) have been offset by higher severance payments, annual bonuses and additional costs for the employees working on the new PX/PTA installation (the pay of these 220 people will not be shown in its full amount until this year, estimated at PLN 19m). We are taking a cautious approach to predicting future payroll expenses (on top of the reasons described above, the Company may be pressured for raises by its employees next year after a 2009 salary freeze and the minimum raises awarded in 2010). According to recent newspaper reports, trade unions are demanding 10% salary growth across the Group. It is hard to imagine the Management acceding to this, but were it approve a 5% hike, consolidated expenses would increase by PLN 100m.
Net debt: Changes in working capital
Last year brought about a further contraction in Orlen’s net debt, which amounted to just PLN 7.85bn at the end of December. Most of this reduction happened in the preceding quarter, when operating cash flows amounted to a staggering PLN 2.8bn, which, in addition to EBITDA, were drive by strong working capital (+PLN 1.44bn), which comprised a decline in receivables (PLN 592m) and an increase in payables (PLN 832m), with no impact from inventories (the rise in prices was offset by the sale of PLN 910m worth of mandatory reserves). For quite a while, the Company has been managing these positions in a very apt way, but if we look at these working capital changes more closely, we will see that not all of them are likely to be lasting and some merely entail shifting some of the debt to other categories of liabilities. As far as inventories are concerned, the main reason why their cash impact at the time of rising prices was limited were the sales of mandatory reserves (which we discuss at more depth elsewhere in this report; here let us only stress that the economic sense of these transactions lies in shifting interest expenses to operating expenses stemming from the ticket agreement). If Orlen does not sign further agreements of this type in 2011 (so far, it has sold 1Mt of its mandatory reserves out of the 3.4Mt total), and it seems that in the current economic environment this solution is becoming much less attractive due to the rising hedging costs, we can expect the forecasted high Q1'11 LIFO effect to be offset at the working-capital level.
PKN Orlen
16 March 2011 12
BRE Bank Securities
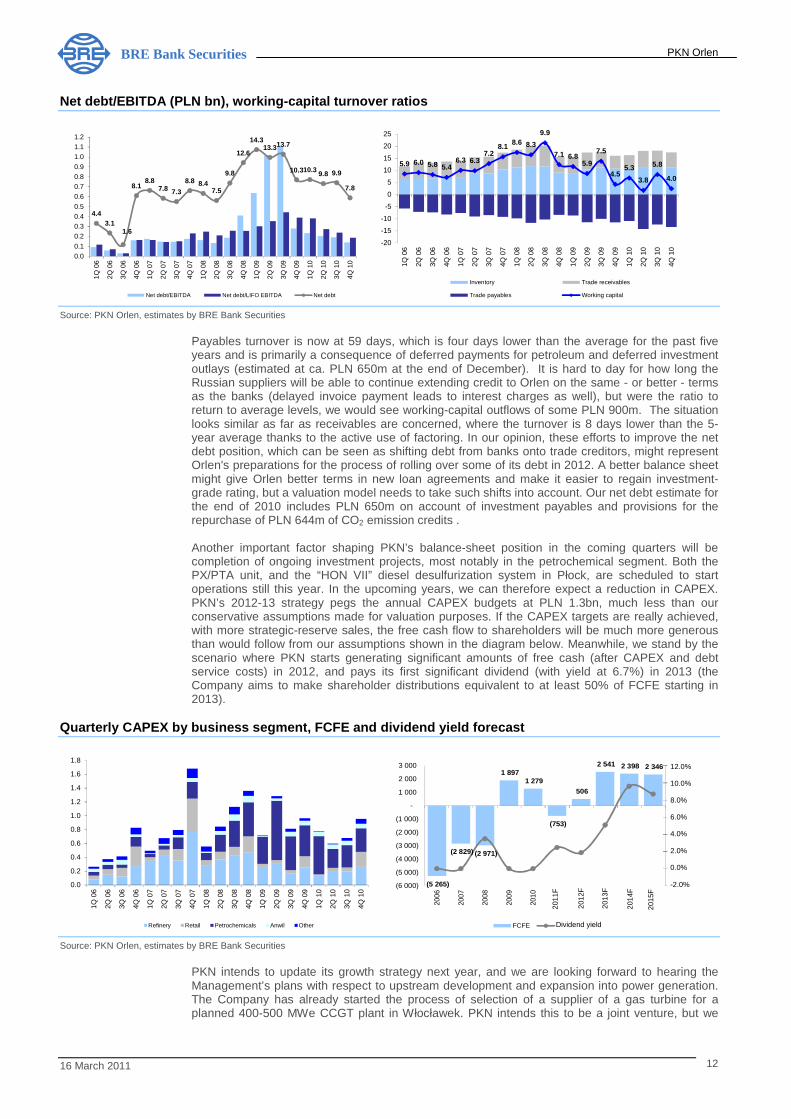
Net debt/EBITDA (PLN bn), working-capital turnover ratios
4.43.1
1.6
8.18.8
7.8 7.3
8.8 8.47.5
9.8
12.6
14.313.313.7
10.310.3 9.8 9.9
7.8
0.00.1
0.20.30.40.5
0.60.70.80.9
1.01.11.2
1Q 0
6
2Q 0
6
3Q 0
6
4Q 0
6
1Q 0
7
2Q 0
7
3Q 0
7
4Q 0
7
1Q 0
8
2Q 0
8
3Q 0
8
4Q 0
8
1Q 0
9
2Q 0
9
3Q 0
9
4Q 0
9
1Q 1
0
2Q 1
0
3Q 1
0
4Q 1
0
Net debt/EBITDA Net debt/LIFO EBITDA Net debt
5.9 6.0 5.8 5.46.3 6.3
7.28.1
8.6 8.3
9.9
7.1 6.85.9
7.5
4.55.3
3.8
5.8
4.0
-20
-15
-10
-5
0
5
10
15
20
25
1Q 0
6
2Q 0
6
3Q 0
6
4Q 0
6
1Q 0
7
2Q 0
7
3Q 0
7
4Q 0
7
1Q 0
8
2Q 0
8
3Q 0
8
4Q 0
8
1Q 0
9
2Q 0
9
3Q 0
9
4Q 0
9
1Q 1
0
2Q 1
0
3Q 1
0
4Q 1
0
Inventory Trade receivables
Trade payables Working capital Source: PKN Orlen, estimates by BRE Bank Securities
Payables turnover is now at 59 days, which is four days lower than the average for the past five years and is primarily a consequence of deferred payments for petroleum and deferred investment outlays (estimated at ca. PLN 650m at the end of December). It is hard to day for how long the Russian suppliers will be able to continue extending credit to Orlen on the same - or better - terms as the banks (delayed invoice payment leads to interest charges as well), but were the ratio to return to average levels, we would see working-capital outflows of some PLN 900m. The situation looks similar as far as receivables are concerned, where the turnover is 8 days lower than the 5-year average thanks to the active use of factoring. In our opinion, these efforts to improve the net debt position, which can be seen as shifting debt from banks onto trade creditors, might represent Orlen's preparations for the process of rolling over some of its debt in 2012. A better balance sheet might give Orlen better terms in new loan agreements and make it easier to regain investment-grade rating, but a valuation model needs to take such shifts into account. Our net debt estimate for the end of 2010 includes PLN 650m on account of investment payables and provisions for the repurchase of PLN 644m of CO2 emission credits . Another important factor shaping PKN’s balance-sheet position in the coming quarters will be completion of ongoing investment projects, most notably in the petrochemical segment. Both the PX/PTA unit, and the “HON VII” diesel desulfurization system in Płock, are scheduled to start operations still this year. In the upcoming years, we can therefore expect a reduction in CAPEX. PKN’s 2012-13 strategy pegs the annual CAPEX budgets at PLN 1.3bn, much less than our conservative assumptions made for valuation purposes. If the CAPEX targets are really achieved, with more strategic-reserve sales, the free cash flow to shareholders will be much more generous than would follow from our assumptions shown in the diagram below. Meanwhile, we stand by the scenario where PKN starts generating significant amounts of free cash (after CAPEX and debt service costs) in 2012, and pays its first significant dividend (with yield at 6.7%) in 2013 (the Company aims to make shareholder distributions equivalent to at least 50% of FCFE starting in 2013).
Quarterly CAPEX by business segment, FCFE and divid end yield forecast
0.0
0.2
0.4
0.6
0.8
1.0
1.2
1.4
1.6
1.8
1Q 0
6
2Q 0
6
3Q 0
6
4Q 0
6
1Q 0
7
2Q 0
7
3Q 0
7
4Q 0
7
1Q 0
8
2Q 0
8
3Q 0
8
4Q 0
8
1Q 0
9
2Q 0
9
3Q 0
9
4Q 0
9
1Q 1
0
2Q 1
0
3Q 1
0
4Q 1
0
Refinery Retail Petrochemicals Anwil Other
(5 265)
(2 829) (2 971)
1 897 1 279
(753)
506
2 541 2 398 2 346
-2,0%
0,0%
2,0%
4,0%
6,0%
8,0%
10,0%
12,0%
(6 000)
(5 000)
(4 000)
(3 000)
(2 000)
(1 000)
-
1 000
2 000
3 000
2006
2007
2008
2009
2010
2011
P
2012
P
2013
P
2014
P
2015
P
FCFE stopa dywidendy Source: PKN Orlen, estimates by BRE Bank Securities
PKN intends to update its growth strategy next year, and we are looking forward to hearing the Management’s plans with respect to upstream development and expansion into power generation. The Company has already started the process of selection of a supplier of a gas turbine for a planned 400-500 MWe CCGT plant in Włocławek. PKN intends this to be a joint venture, but we
Dividend yield
2015
F
2012
F
2011
F
2014
F
2013
F
12.0% 10.0% 8.0% 6.0% 4.0% 2.0% 0.0% -2.0%

PKN Orlen
16 March 2011 13
BRE Bank Securities
can assume that it is going to participate to some extent in the costs of this project, which can be estimated at PLN 1.4-1.7bn in total. The power plant is tentatively scheduled for a launch in early 2014, so the bulk of the expenses would be incurred in 2012 and 2013. In addition to the new project, PKN may have to incur replacement expenditure on existing power-generating assets to bring them up to more stringent emission standards (the replacements will include a new boiler for the combined-cycle plant in Płock, and flue-gas desulfurization and denitrogenation units, including at Mazeikiu Nafta). As for upstream development, PKN has suggested that, in the initial stages, it would like to acquire drilling projects in politically stable locations. On the basis of the experience gained there, the company will take the next step of prospecting. While safer and more reasonable, in the near term this approach means that PKN’s upstream purchases will have zero positive impact on its value, while reducing its dividend-paying potential. In the strategy plan announced in 2008, PKN stated that it would not spend more than PLN 700m on upstream building until 2013, however, the divestment of Polkomtel (PLN 3.8bn) and the cash freed through mandatory reserve sales may give it potential to fast-track the development of upstream.
Macroeconomic Assumptions
The table below outlines the macroeconomic assumptions underlying DCF valuation.
USD/Bbl 2008 2009 2010 2011F 2012F 2013F 2014F 2015F 2016F 2017F 2018F 2019F
Brent crude 98.0 62.0 79.7 98.5 95.0 95.0 95.0 95.0 95.0 95.0 95.0 95.0
Urals crude 95.1 61.2 78.3 96.5 93.0 93.0 93.0 93.0 93.0 93.0 93.0 93.0
Urals-Brent spread 2.9 0.8 1.4 2.0 2.0 2.0 2.0 2.0 2.0 2.0 2.0 2.0
PKN’s product margins 4.9 2.8 3.6 3.7 4.1 4.2 4.3 4.4 4.5 4.9 4.9 4.9
Orlen Lietuva’s product margins 2.7 2.2 2.1 2.2 2.3 2.5 2.6 2.8 2.9 3.1 3.1 3.1
Unipetrol’s product margins 9.7 4.4 5.1 5.2 5.3 5.4 5.5 5.7 5.8 5.9 5.9 5.9
Oil throughput (Mt)
Orlen 14.2 14.5 14.5 14.5 15.7 15.7 15.7 15.7 15.7 15.7 15.7 15.7
Unipetrol 4.5 4.1 4.4 4.7 4.7 4.7 4.7 4.7 4.7 4.7 4.7 4.7
Mazeikiu Nafta 9.2 8.4 9.0 9.0 9.0 9.0 9.0 9.0 9.0 9.0 9.0 9.0
Petrochemicals output (kt) 2956 2927 2962 3362 3562 3562 3562 3562 3562 3562 3562 3562
Chemicals output (kt) 1759 1892 1771 1867 1947 1947 1947 1947 1947 1947 1947 1947
Chemicals & Petrochemicals Margin on chemicals (EUR/t) 619 545 533 569 518 518 525 525 525 525 525 525
Margin on petrochemicals (USD/t) 553 389 548 638 543 543 525 525 525 525 525 525
Margin on HDPE+LDPE (USD/t) 653 477 605 701 590 590 568 568 568 568 568 568
Margin on PP (USD/t) 738 423 470 539 443 443 423 423 423 423 423 423
Margin on PTA (USD/t) 192 379 380 387 356 356 340 340 340 340 340 340
Other macro assumptions 2008 2009 2010 2011F 2012F 2013F 2014F 2015F 2016F 2017F 2018F 2019F
USD/PLN 2.42 3.12 3.02 3.00 2.90 2.80 2.70 2.70 2.70 2.70 2.70 2.70
EUR/PLN 3.48 4.33 3.99 4.00 3.80 3.70 3.50 3.50 3.50 3.50 3.50 3.50 Source: Bloomberg, PKN, BRE Bank Securities

PKN Orlen
16 March 2011 14
BRE Bank Securities
Earnings Forecast and Valuation Our DCF model (which factors in PKN’s interests in Polkomtel) produced a nine-month per-share target price of PLN 41.6.
DCF Valuation
DCF Model Assumptions
1. Cash flows are discounted to their present value as at 31 March 2011. When calculating enterprise value, we used the net debt amount as at 31 December 2009 increased by a PLN 644m provision for a repurchase of carbon emission credits sold in Q4 2009.
2. The model relies on macroeconomic assumptions as laid out above, taking into account the impact of the new mandatory reserve law which is currently under preparation (their purchase by a state agency, which will then charge a special fee).
3. We increase enterprise value by the net after-tax value of the stake in Polkomtel, which we estimate at PLN 3.8bn.
4. The amortization and depreciation expense projected for 2020 is higher than CAPEX, which is unsustainable over the long term, prompting us to revise the D&A expense to PLN 2.0 billion for terminal value calculation purposes.
5. When calculating FCFTV, we based the terminal value calculations on the sales growth rate and EBITDA margins projected for 2020.
6. We assume that FCF will grow at a rate of 1% after 2019. The risk-free rate is 6.3%, and beta is 1.0.

PKN Orlen
16 March 2011 15
BRE Bank Securities
DCF Valuation Model (PLN m) 2011F 2012F 2013F 2014F 2015F 2016F 2017F 2018F 2019F 2020F 2020+
Revenues 99 521 96 665 94 172 91 470 92 206 92 957 93 785 94 488 95 207 95 940 96 678
Change 19.1% -2.9% -2.6% -2.9% 0.8% 0.8% 0.9% 0.7% 0.8% 0.8% 0.8%
EBITDA 4 847.5 4 933.3 5 112.0 4 702.1 4 721.9 4 802.5 4 961.0 4 939.7 4 933.5 4 934.5 4 972.4
EBITDA margin 4.9% 5.1% 5.4% 5.1% 5.1% 5.2% 5.3% 5.2% 5.2% 5.1% 5.1%
D&A expenses 2 682.9 2 741.7 2 784.3 2 581.5 2 465.9 2 417.0 2 353.3 2 366.4 2 396.4 2 345.4 2 032.4
EBIT 2 164.6 2 191.6 2 327.6 2 120.7 2 256.0 2 385.5 2 607.7 2 573.3 2 537.1 2 589.1 2 940.1
EBIT margin 2.2% 2.3% 2.5% 2.3% 2.4% 2.6% 2.8% 2.7% 2.7% 2.7% 3.0%
Tax on EBIT 411.3 416.4 442.2 402.9 428.6 453.2 495.5 488.9 482.0 491.9 558.6
NOPLAT 1 753.3 1 775.2 1 885.4 1 717.7 1 827.3 1 932.3 2 112.2 2 084.4 2 055.0 2 097.2 2 381.5
CAPEX -2 914 -2 627 -2 382 -2 032 -2 032 -2 032 -2 032 -2 032 -2 032 -2 033 -2 032
Working capital -2 006 -930 602 444 370 368 359 374 372 370 370
Capital investment 0.0 0.0 0.0 0.0 0.0 0.0 0.0 0.0 0.0 0.0 0.0
FCF -484 960 2 889 2 711 2 631 2 685 2 792 2 792 2 791 2 779 2 752
WACC 9.8% 9.9% 10.2% 10.3% 10.4% 10.5% 10.5% 10.5% 10.5% 10.5% 10.5%
discount factor 93.2% 84.9% 77.0% 69.9% 63.3% 57.3% 51.9% 46.9% 42.5% 38.4% 38.4%
PV FCF -451 815 2 225 1 894 1 665 1 538 1 448 1 311 1 186 1 069
WACC 9.8% 9.9% 10.2% 10.3% 10.4% 10.5% 10.5% 10.5% 10.5% 10.5% 10.5%
Cost of debt 7.30% 7.30% 7.30% 7.30% 7.30% 7.30% 7.30% 7.30% 7.30% 7.30% 7.30%
Risk-free rate 6.30% 6.30% 6.30% 6.30% 6.30% 6.30% 6.30% 6.30% 6.30% 6.30% 6.30%
Risk premium 1.0% 1.0% 1.0% 1.0% 1.0% 1.0% 1.0% 1.0% 1.0% 1.0% 1.0%
Effective tax rate 19.0% 19.0% 19.0% 19.0% 19.0% 19.0% 19.0% 19.0% 19.0% 19.0% 19.0%
Net debt / EV 28.4% 26.2% 21.3% 19.5% 17.4% 15.0% 15.0% 15.0% 15.0% 15.0% 15.0%
Cost of equity 11.3% 11.3% 11.3% 11.3% 11.3% 11.3% 11.3% 11.3% 11.3% 11.3% 11.3%
Risk premium 5.0% 5.0% 5.0% 5.0% 5.0% 5.0% 5.0% 5.0% 5.0% 5.0% 5.0%
Beta 1.0 1.0 1.0 1.0 1.0 1.0 1.0 1.0 1.0 1.0 1.0
FCF growth after the forecast horizon 1.0% Sensitivity Analysis Terminal value 28 995 FCF growth in perpetuity
Present value of terminal value (PV TV) 11 148 0.0% 1.0% 2.0% 3.0% 4.0%
Present value of FCF in the forecast horizon 12 700 WACC +1.0pp 36.7 38.9 41.6 44.9 49.1
Net debt 8 491 WACC +0.5pp 37.7 40.2 43.2 46.9 51.7
Minority interests 2 612 WACC 38.9 41.6 44.9 49.1 54.6
Provisions for Agrofert claims -164 WACC -0.5pp 40.2 43.2 46.9 51.7 58.1
Equity value 12 581 WACC -.1.0pp 41.6 44.9 49.1 54.6 62.2
Number of shares (millions) 427.7
Value per share (PLN) 29.4
Per-share value of investment in Polkomtel 9.0
Equity value per share (PLN) 38.4
9M cost of equity 8.4%
Target Price 41.6
EV/EBITDA for the target price 6.0
P/E for the target price 10.2
TV to EV 39%

PKN Orlen
16 March 2011 16
BRE Bank Securities
Relative Valuation P/E EV/EBITDA
Price 2010 2011F 2012F 2013F 2010 2011F 2012F 2013F
MOL 22620 13.4 10.0 8.8 7.8 6.9 5.9 5.3 4.9
OMV 28.6 7.2 5.9 5.6 5.3 3.6 3.0 2.9 2.9
Lotos* 41.2 8.2 10.6 5.7 8.0 10.3 6.3 5.1 6.0
Tupras 41.7 12.3 10.7 10.1 11.0 7.0 6.6 5.9 5.9
Hellenic 7.6 13.0 10.4 6.8 6.5 9.5 8.6 6.4 6.5
Unipetrol (CZK) 173.0 21.3 29.3 21.7 25.0 6.0 5.7 5.0 4.6
SNP Petrom 0.4 10.0 7.8 6.7 7.3 4.6 4.0 3.6 3.3
ERG 9.5 -116.3 22.2 12.8 13.2 9.4 6.6 5.5 6.0
Neste 12.1 25.7 11.8 8.5 7.5 11.8 7.7 6.4 6.0
Motor Oil 8.7 10.1 7.7 7.1 6.1 8.3 6.5 6.1 6.1
INA 3955.1 27.7 12.1 9.2 9.8 11.5 8.2 6.2 6.6
Maximum 27.7 29.3 21.7 25.0 11.8 8.6 6.4 6.6
Minimum -116.3 5.9 5.6 5.3 3.6 3.0 2.9 2.9
Median 12.3 10.6 8.5 7.8 8.3 6.5 5.5 6.0
PKN 50.0 9.0 12.3 11.6 11.0 5.3 6.1 6.0 5.7
(Premium / discount) -26.6% 16.3% 36.3% 40.5% -36.1% -6.9% 7.7% -3.9%
Implied value
Median 12.3 10.6 8.5 7.8 8.3 6.5 5.5 6.0
Multiple weight 50.0% 50.0%
Year weight 0.0% 33.3% 33.3% 33.3% 0.0% 33.3% 33.3% 33.3%
Value per share (PLN) 44.7
EV/EBITDA based on net debt at year-end 2010(for PKN, net debt is adjusted for temporary changes working capital and the sale of carbon emission credits)
PKN’s net debt adjusted for the value of its stake in Polkomtel
Lotos’s multiples calculated for net debt from 2010-2013, respectively.
PKN Orlen
16 March 2011 17
BRE Bank Securities
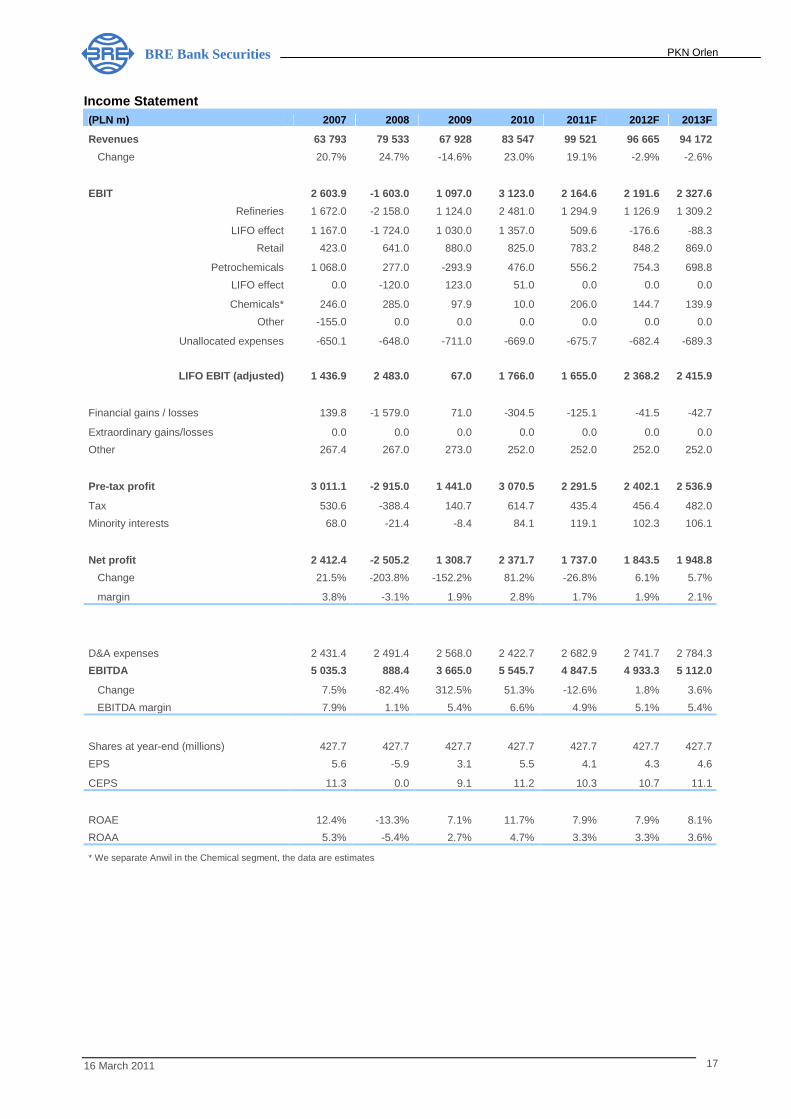
Income Statement (PLN m) 2007 2008 2009 2010 2011F 2012F 2013F
Revenues 63 793 79 533 67 928 83 547 99 521 96 665 94 172
Change 20.7% 24.7% -14.6% 23.0% 19.1% -2.9% -2.6%
EBIT 2 603.9 -1 603.0 1 097.0 3 123.0 2 164.6 2 191.6 2 327.6
Refineries 1 672.0 -2 158.0 1 124.0 2 481.0 1 294.9 1 126.9 1 309.2
LIFO effect 1 167.0 -1 724.0 1 030.0 1 357.0 509.6 -176.6 -88.3
Retail 423.0 641.0 880.0 825.0 783.2 848.2 869.0
Petrochemicals 1 068.0 277.0 -293.9 476.0 556.2 754.3 698.8
LIFO effect 0.0 -120.0 123.0 51.0 0.0 0.0 0.0
Chemicals* 246.0 285.0 97.9 10.0 206.0 144.7 139.9
Other -155.0 0.0 0.0 0.0 0.0 0.0 0.0
Unallocated expenses -650.1 -648.0 -711.0 -669.0 -675.7 -682.4 -689.3
LIFO EBIT (adjusted) 1 436.9 2 483.0 67.0 1 766.0 1 655.0 2 368.2 2 415.9
Financial gains / losses 139.8 -1 579.0 71.0 -304.5 -125.1 -41.5 -42.7
Extraordinary gains/losses 0.0 0.0 0.0 0.0 0.0 0.0 0.0
Other 267.4 267.0 273.0 252.0 252.0 252.0 252.0
Pre-tax profit 3 011.1 -2 915.0 1 441.0 3 070.5 2 291.5 2 402.1 2 536.9
Tax 530.6 -388.4 140.7 614.7 435.4 456.4 482.0
Minority interests 68.0 -21.4 -8.4 84.1 119.1 102.3 106.1
Net profit 2 412.4 -2 505.2 1 308.7 2 371.7 1 737.0 1 843.5 1 948.8
Change 21.5% -203.8% -152.2% 81.2% -26.8% 6.1% 5.7%
margin 3.8% -3.1% 1.9% 2.8% 1.7% 1.9% 2.1%
D&A expenses 2 431.4 2 491.4 2 568.0 2 422.7 2 682.9 2 741.7 2 784.3
EBITDA 5 035.3 888.4 3 665.0 5 545.7 4 847.5 4 933.3 5 112.0
Change 7.5% -82.4% 312.5% 51.3% -12.6% 1.8% 3.6%
EBITDA margin 7.9% 1.1% 5.4% 6.6% 4.9% 5.1% 5.4%
Shares at year-end (millions) 427.7 427.7 427.7 427.7 427.7 427.7 427.7
EPS 5.6 -5.9 3.1 5.5 4.1 4.3 4.6
CEPS 11.3 0.0 9.1 11.2 10.3 10.7 11.1
ROAE 12.4% -13.3% 7.1% 11.7% 7.9% 7.9% 8.1%
ROAA 5.3% -5.4% 2.7% 4.7% 3.3% 3.3% 3.6%
* We separate Anwil in the Chemical segment, the data are estimates

PKN Orlen
16 March 2011 18
BRE Bank Securities
Balance Sheet (PLN m) 2007 2008 2009 2010 2011F 2012F 2013F
ASSETS 46 103.3 46 975.8 49 088.1 51 149.8 54 903.6 55 225.6 53 691.0
Fixed assets 26 736.4 29 280.9 29 655.0 30 430.9 30 661.9 30 547.1 30 145.1
Property, plant and equipment 24 833.5 26 268.8 26 998.1 27 403.0 27 632.0 27 534.2 27 141.4
Intangible assets 531.0 557.0 690.4 1 102.7 1 104.7 1 087.7 1 078.5
Equity interests 700.3 1 561.1 1 401.6 1 501.0 1 501.0 1 501.0 1 501.0
Other fixed assets 671.5 893.9 564.9 424.1 424.1 424.1 424.1
Current assets 19 367.0 17 694.9 19 433.0 20 718.9 24 241.7 24 678.5 23 545.9
Inventories 10 365.4 9 089.0 10 619.9 11 294.9 13 484.8 12 395.5 11 567.0
Short-term receivables 6 884.5 6 356.2 5 417.5 6 108.8 7 276.7 8 888.4 8 659.2
Other current assets 618.9 905.4 454.7 494.5 494.5 494.5 494.5
Cash and cash equivalents 1 498.2 1 344.2 2 941.0 2 820.7 2 985.6 2 899.9 2 825.1
(PLN m) 2007 2008 2009 2010 2011F 2012F 2013F
EQUITY AND LIABILITIES 46 103.3 46 975.8 49 088.1 51 149.8 54 903.6 55 225.6 53 691.0
Equity 19 935.3 17 813.1 19 037.9 21 627.9 22 621.8 23 842.0 24 566.0
Share capital 1 057.6 1 057.6 1 057.6 1 057.6 1 057.6 1 057.6 1 057.6
Other equity 18 877.6 16 755.5 17 980.3 20 570.3 21 564.2 22 784.4 23 508.4
Minority interests 2 638.0 2 718.6 2 669.3 2 612.0 2 731.2 2 833.4 2 939.5
Long-term liabilities 11 091.4 4 634.2 13 206.5 10 667.9 12 057.3 11 535.9 9 857.8
Loans 8 602.7 2 610.7 11 610.5 9 124.0 10 513.4 9 992.0 8 313.9
Other 2 488.7 2 023.5 1 596.0 1 543.9 1 543.9 1 543.9 1 543.9
Short-term liabilities 12 438.7 21 809.9 14 174.4 16 242.0 17 493.4 17 014.2 16 327.7
Loans 1 719.2 11 282.1 1 593.7 1 543.7 1 443.1 1 371.5 1 141.2
Trade creditors 9 181.2 8 377.0 11 494.5 13 436.0 14 788.0 14 380.4 13 924.3
Other 1 538.2 2 150.8 1 086.1 1 262.2 1 262.2 1 262.2 1 262.2
Debt 10 321.9 13 892.8 13 204.2 10 667.7 11 956.5 11 363.6 9 455.1
Net debt 8 823.7 12 548.5 10 263.2 7 847.0 8 970.9 8 463.6 6 630.0
(Net debt / Equity) 44.3% 70.4% 53.9% 36.3% 39.7% 35.5% 27.0%
(Net debt / EBITDA) 1.8 14.1 2.8 1.4 1.9 1.7 1.3
BVPS 46.6 41.6 44.5 50.6 52.9 55.7 57.4
PKN Orlen
16 March 2011 19
BRE Bank Securities
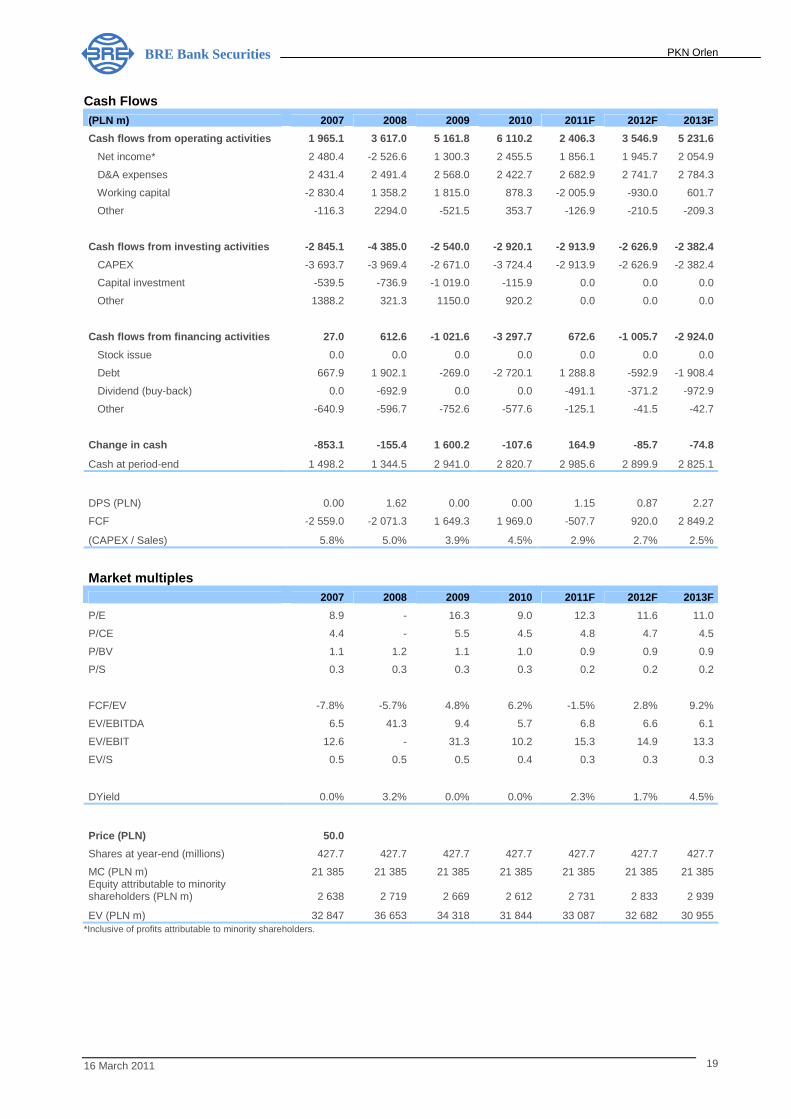
Cash Flows (PLN m) 2007 2008 2009 2010 2011F 2012F 2013F
Cash flows from operating activities 1 965.1 3 617.0 5 161.8 6 110.2 2 406.3 3 546.9 5 231.6
Net income* 2 480.4 -2 526.6 1 300.3 2 455.5 1 856.1 1 945.7 2 054.9
D&A expenses 2 431.4 2 491.4 2 568.0 2 422.7 2 682.9 2 741.7 2 784.3
Working capital -2 830.4 1 358.2 1 815.0 878.3 -2 005.9 -930.0 601.7
Other -116.3 2294.0 -521.5 353.7 -126.9 -210.5 -209.3
Cash flows from investing activities -2 845.1 -4 385.0 -2 540.0 -2 920.1 -2 913.9 -2 626.9 -2 382.4
CAPEX -3 693.7 -3 969.4 -2 671.0 -3 724.4 -2 913.9 -2 626.9 -2 382.4
Capital investment -539.5 -736.9 -1 019.0 -115.9 0.0 0.0 0.0
Other 1388.2 321.3 1150.0 920.2 0.0 0.0 0.0
Cash flows from financing activities 27.0 612.6 -1 021.6 -3 297.7 672.6 -1 005.7 -2 924.0
Stock issue 0.0 0.0 0.0 0.0 0.0 0.0 0.0
Debt 667.9 1 902.1 -269.0 -2 720.1 1 288.8 -592.9 -1 908.4
Dividend (buy-back) 0.0 -692.9 0.0 0.0 -491.1 -371.2 -972.9
Other -640.9 -596.7 -752.6 -577.6 -125.1 -41.5 -42.7
Change in cash -853.1 -155.4 1 600.2 -107.6 164.9 -85.7 -74.8
Cash at period-end 1 498.2 1 344.5 2 941.0 2 820.7 2 985.6 2 899.9 2 825.1
DPS (PLN) 0.00 1.62 0.00 0.00 1.15 0.87 2.27
FCF -2 559.0 -2 071.3 1 649.3 1 969.0 -507.7 920.0 2 849.2
(CAPEX / Sales) 5.8% 5.0% 3.9% 4.5% 2.9% 2.7% 2.5%
Market multiples
2007 2008 2009 2010 2011F 2012F 2013F
P/E 8.9 - 16.3 9.0 12.3 11.6 11.0
P/CE 4.4 - 5.5 4.5 4.8 4.7 4.5
P/BV 1.1 1.2 1.1 1.0 0.9 0.9 0.9
P/S 0.3 0.3 0.3 0.3 0.2 0.2 0.2
FCF/EV -7.8% -5.7% 4.8% 6.2% -1.5% 2.8% 9.2%
EV/EBITDA 6.5 41.3 9.4 5.7 6.8 6.6 6.1
EV/EBIT 12.6 - 31.3 10.2 15.3 14.9 13.3
EV/S 0.5 0.5 0.5 0.4 0.3 0.3 0.3
DYield 0.0% 3.2% 0.0% 0.0% 2.3% 1.7% 4.5%
Price (PLN) 50.0
Shares at year-end (millions) 427.7 427.7 427.7 427.7 427.7 427.7 427.7
MC (PLN m) 21 385 21 385 21 385 21 385 21 385 21 385 21 385 Equity attributable to minority shareholders (PLN m) 2 638 2 719 2 669 2 612 2 731 2 833 2 939
EV (PLN m) 32 847 36 653 34 318 31 844 33 087 32 682 30 955 *Inclusive of profits attributable to minority shareholders.

PKN Orlen
16 March 2011 20
BRE Bank Securities
BRE Bank Securities
Michał Marczak tel. (+48 22) 697 47 38 Managing Director
Head of Research [email protected] Strategy, Telco, Mining, Metals Research Department: Kamil Kliszcz tel. (+48 22) 697 47 06 [email protected] Fuels, Chemicals, Energy Piotr Grzybowski tel. (+48 22) 697 47 17 [email protected] IT, Media
Maciej Stokłosa tel. (+48 22) 697 47 41 [email protected] Construction, Real-Estate Developers
Jakub Szkopek tel. (+48 22) 697 47 40 [email protected] Manufacturers Iza Rokicka tel. (+48 22) 697 47 37 [email protected]
Banks Gabriela Borowska tel. (+48 22) 697 47 36 [email protected] Retail
Sales and Trading :
Piotr Dudziński tel. (+48 22) 697 48 22 Director [email protected] Marzena Łempicka-Wilim tel. (+48 22) 697 48 95 Deputy Director [email protected] Traders: Emil Onyszczuk tel. (+48 22) 697 49 63 [email protected] Grzegorz Stępien tel. (+48 22) 697 48 62 [email protected] Michał Jakubowski tel. (+48 22) 697 47 44 [email protected] Tomasz Jakubiec tel. (+48 22) 697 47 31 [email protected] Grzegorz Strublewski tel. (+48 22) 697 48 76 [email protected] Michał Stępkowski tel. (+48 22) 697 48 25 [email protected] Foreign Markets Unit: Adam Prokop tel. (+48 22) 697 48 46 Foreign Markets Manager [email protected] Michał RoŜmiej tel. (+48 22) 697 48 64 [email protected] Jakub Słotkowicz tel. (+48 22) 697 48 64 [email protected] Jacek Wrześniewski tel. (+48 22) 697 49 85 [email protected] "Private Broker"
Jarosław Banasiak tel. (+48 22) 697 48 70 Director, Active Sales [email protected]
Jacek Szczepański tel. (+48 22) 697 48 26 Director of Sales [email protected] Dom Inwestycyjny BRE Banku S.A. ul. Wspólna 47/49 00-950 Warszawa www.dibre.com.pl
PKN Orlen
16 March 2011 21
BRE Bank Securities
BRE Bank Securities
Previous ratings issued for PKN Orlen Rating Hold Reduce
Date issued 2010-11-02 2010-12-03
Price on rating day 40.21 46.49
WIG on rating day 46229.60 46481.15
List of abbreviations and ratios contained in the report: EV – net debt + market value EBIT – Earnings Before Interest and Taxes EBITDA – EBIT + Depreciation and Amortisation P/CE – price to earnings with amortisation MC/S – market capitalisation to sales EBIT/EV – operating profit to economic value P/E – (Price/Earnings) – price divided by annual net profit per share ROE – (Return on Equity) – annual net profit divided by average equity P/BV – (Price/Book Value) – price divided by book value per share Net debt – credits + debt papers + interest bearing loans – cash and cash equivalents EBITDA margin – EBITDA/Sales
Recommendations of BRE Bank Securities A recommendation is valid for a period of 6-9 months, unless a subsequent recommendation is issued within this period. Expected returns from individual recommendations are as follows: BUY – we expect that the rate of return from an investment will be at least 15% ACCUMULATE – we expect that the rate of return from an investment will range from 5% to 15% HOLD – we expect that the rate of return from an investment will range from –5% to +5% REDUCE – we expect that the rate of return from an investment will range from -5% to -15% SELL – we expect that an investment will bear a loss greater than 15% Recommendations are updated at least once every nine months.
This document has been created and published by BRE Bank Securities S.A. The present report expresses the knowledge as well as opinions of the authors on day the report was prepared. The opinions and estimates contained herein constitute our best judgement at this date and time, and are subject to change without notice. The present report was prepared with due care and attention, observing principles of methodological correctness and objectivity, on the basis of sources available to the public, which BRE Bank Securities S.A. considers reliable, including information published by issuers, shares of which are subject to recommendations. However, BRE Bank Securities S.A., in no case, guarantees the accuracy and completeness of the report, in particular should sources on the basis of which the report was prepared prove to be inaccurate, incomplete or not fully consistent with the facts. BRE Bank Securities S.A. bears no responsibility for investment decisions taken on the basis of the present report or for any damages incurred as a result of investment decisions taken on the basis of the present report.
This document does not constitute an offer or invitation to subscribe for or purchase any financial instruments and neither this document nor anything contained herein shall form the basis of any contract or commitment whatsoever. It is being furnished to you solely for your information and may not be reproduced or redistributed to any other person. This document nor any copy hereof is not to be distributed directly or indirectly in the United States, Australia, Canada or Japan.
Recommendations are based on essential data from the entire history of a company being the subject of a recommendation, with particular emphasis on the period since the previous recommendation. Investing in shares is connected with a number of risks including, but not limited to, the macroeconomic situation of the country, changes in legal regulations as well as changes on commodity markets. Full elimination of these risks is virtually impossible.
It is possible that BRE Bank Securities S.A. renders, will render or in the past has rendered services for companies and other entities mentioned in the present report.
The present report was not transferred to the issuer prior to its publication. BRE Bank Securities S.A. acts as market animator for PKN Orlen.
BRE Bank Securities S.A., its shareholders and employees may hold long or short positions in the issuer's shares or other financial instruments related to the issuer's shares. BRE Bank Securities S.A., its affiliates and/or clients may conduct or may have conducted transactions for their own account or for account of another with respect to the financial instruments mentioned in this report or related investments before the recipient has received this report.
Copying or publishing the present report, in full or in part, or disseminating in any way information contained in the present report requires the prior written agreement of BRE Bank Securities S.A.
Recommendations are addressed to all Clients of BRE Bank Securities S.A. This report is not for distribution to third parties. The activity of BRE Bank Securities S.A. is subject to the supervision of the Polish Financial Supervision Commission.
Individuals who did not participate in the preparation of this recommendation, but had or could have had access to the recommendation prior to its publication, are employees of BRE Bank Securities S.A. authorised to access the premises in which recommendations are prepared, other than the analysts mentioned as the authors of the present recommendation.
Strong and weak points of valuation methods used in recommendations: DCF – acknowledged as the most methodologically correct method of valuation; it is based in discounting financial flows generated by a company; its weak point is the significant susceptibility to a change of forecast assumptions in the model. Comparative – based on a comparison of valuation multipliers of companies from a given sector; simple in construction, reflects the current state of the market; weak points include substantial variability (fluctuations together with market indices) as well as difficulty in the selection of the group of comparable companies.
Top Related