


Languages
Pages
Legal


PJM Cost of New Entry Combustion Turbines and Combined-Cycle Plants
with June 1, 2022 Online Date
PREPARED FOR
PJM Interconnection, L.L.C.
PREPARED BY
Samuel A. Newell
J. Michael Hagerty
Johannes P. Pfeifenberger
Bin Zhou
Emily Shorin
Perry Fitz
The Brattle Group
Sang H. Gang
Patrick S. Daou
John Wroble
Sargent & Lundy
April 19, 2018

This report was prepared for PJM Interconnection, L.L.C. All results and any errors are the
responsibility of the authors and do not represent the opinion of The Brattle Group, Inc. or
Sargent & Lundy, or their clients.
The authors would like to thank PJM staff for their cooperation and responsiveness to our many
questions and requests. We would also like to thank the PJM Independent Market Monitor for
helpful discussions.
Copyright © 2018 The Brattle Group, Inc.

i|brattle.com
Table of Contents
Executive Summary ....................................................................................................................... iii
I. Introduction .............................................................................................................................. 1
A. Background .......................................................................................................................... 1
B. Study Objective and Scope .................................................................................................. 2
C. Analytical Approach ............................................................................................................ 2
II. Observations about Recent Entry in PJM’s Capacity Market ................................................... 4
A. Summary of Recent New Entry in PJM .............................................................................. 4
B. Drivers of Low-Cost Entry by Natural Gas Plants ............................................................. 6
III. Reference Resource Technical Specifications ......................................................................... 10
A. Locational Screen ............................................................................................................... 10
B. Summary of Reference Resource Specifications .............................................................. 13
C. Plant Size, Configuration and Turbine Model ................................................................. 14
1. Combined-Cycle Turbine Model, Configuration, and Duct Firing ........................ 14
2. Combustion Turbine Model and Configuration ...................................................... 16
D. Detailed Technical Specifications ..................................................................................... 18
1. Emissions Controls .................................................................................................... 18
2. Fuel Supply Specifications ........................................................................................ 20
IV. Plant Capital Cost Estimates ................................................................................................... 21
A. Plant Capital Cost Summary.............................................................................................. 21
B. Plant Proper Capital Costs ................................................................................................. 24
1. Plant Developer and Contractor Arrangements ...................................................... 24
2. Equipment and Sales Tax .......................................................................................... 24
3. Labor and Materials ................................................................................................... 24
4. EPC Contractor Fee and Contingency ..................................................................... 25
C. Owner’s Capital Costs ........................................................................................................ 25
1. Project Development and Mobilization and Startup ............................................... 26
2. Net Startup Fuel Costs ............................................................................................... 26
3. Emission Reduction Credits ...................................................................................... 26
4. Gas and Electric Interconnection ............................................................................. 27
5. Land ............................................................................................................................ 27
6. Fuel and Non-Fuel Inventories ................................................................................. 28
7. Owner’s Contingency................................................................................................ 28
8. Financing Fees ........................................................................................................... 28
D. Escalation to 2022 Installed Costs ..................................................................................... 28
V. Operation and Maintenance Costs .......................................................................................... 30
A. Summary of O&M Costs .................................................................................................... 30
B. Annual Fixed Operations and Maintenance Costs ........................................................... 31
1. Plant Operation and Maintenance ........................................................................... 31

ii|brattle.com
2. Insurance and Asset Management Costs .................................................................. 32
3. Property Tax .............................................................................................................. 32
4. Working Capital ........................................................................................................ 33
5. Firm Transportation Service Contract in SWMAAC .............................................. 34
C. Variable Operation and Maintenance Costs ..................................................................... 34
D. Escalation to 2022 Costs .................................................................................................... 34
VI. Financial Assumptions ............................................................................................................ 35
A. Cost of Capital .................................................................................................................... 35
B. Other Financial Assumptions ............................................................................................ 46
VII. CONE Estimates ...................................................................................................................... 48
A. Levelization Approach ....................................................................................................... 48
B. Summary of CONE Estimates ............................................................................................ 50
VIII. Annual CONE Updates ......................................................................................................... 54
List of Acronyms ............................................................................................................................ 55
Appendix A: Detailed Technical Specification Analysis ................................................................ 57
A. Combined Cycle Cooling System ...................................................................................... 57
B. Power Augmentation ......................................................................................................... 58
C. Black Start Capability ........................................................................................................ 58
D. Electrical Interconnection ................................................................................................. 58
E. Gas Compression ................................................................................................................ 58
Appendix B: Detailed Cost Estimate Assumptions ......................................................................... 59
A. Construction Labor Costs .................................................................................................. 59
B. Net Startup Fuel Costs ....................................................................................................... 60
C. Gas and Electric Interconnection Costs ............................................................................ 60
D. Land Costs .......................................................................................................................... 62
E. Property Taxes ................................................................................................................... 62
F. Firm Gas Contracts ............................................................................................................ 63
G. Operational Startup Parameters ........................................................................................ 64
Appendix C: CONE Results with LTSA Costs in Variable O&M ................................................... 65 13

iii|brattle.com
Executive Summary
PJM Interconnection, L.L.C (PJM) retained The Brattle Group (Brattle) and Sargent & Lundy
(S&L) to review key elements of the Reliability Pricing Model (RPM), as required periodically
under PJM’s tariff.1 This report presents our estimates of the Cost of New Entry (CONE). A
separate, concurrently-released report presents our review of PJM’s methodology for estimating
the net energy and ancillary service (E&AS) revenue offset and the Variable Resource
Requirement (VRR) curve.2
CONE represents the total annual net revenue (net of variable operating costs) that a new
generation resource would need to recover its capital investment and fixed costs, given
reasonable expectations about future cost recovery over its economic life. CONE is the starting
point for estimating the Net Cost of New Entry (Net CONE). Net CONE represents the first-year
revenues that a new resource would need to earn in the capacity market, after netting out E&AS
margins from CONE. CONE and Net CONE of the simple-cycle combustion turbine (CT)
reference resource are used to set the prices on PJM’s VRR curve.3 CT and combined-cycle (CC)
Net CONE are used to establish offer price thresholds below which new gas-fired generation
offers are reviewed under the Minimum Offer Price Rule (MOPR).4
We estimate CONE for CTs and CCs in each of the four CONE Areas specified in the PJM Tariff,
with an assumed online date of June 1, 2022.5 Our estimates are based on complete plant designs
reflecting the locations, technology choices, and plant configurations that developers are likely to
choose, as indicated by actual projects and current environmental requirements. For both the CT
and CC plants, we specify GE 7HA turbines—one for the CT, and two for the CC in combination
with a single heat recovery steam generator and steam turbine (“2×1 configuration”). Most plants
have selective catalytic reduction (SCR), except CTs in the Rest of RTO Area. Most plants also
have dual-fuel capability, except CCs in the SWMAAC Area, which obtain firm gas
transportation service instead.
For each plant type and location, we conduct a comprehensive, bottom-up analysis of the capital
costs to build the plant: the engineering, procurement, and construction (EPC) costs, including
equipment, materials, labor, and EPC contracting; and non-EPC owner’s costs, including project
1 PJM Interconnection, L.L.C. (2017). PJM Open Access Transmission Tariff. Effective October 1, 2017,
(“PJM 2017 OATT”), accessed 2/7/2018 from http://www.pjm.com/directory/merged-tariffs/oatt.pdf,
Section 5.10 a.
2 “Fourth Quadrennial Review of PJM’s Variable Resource Requirement Curve” or “2018 VRR Report”.
3 See 2018 VRR Report for how CONE and Net CONE values are used to set the VRR curve.
4 PJM 2017 OATT, Section 5.14 h.
5 Previous CONE studies had five CONE Areas, but the Dominion CONE Area was removed in recent
tariff changes and is now included in the Rest of RTO CONE Area.
iv|brattle.com
development, financing fees, gas and electric interconnection costs, and inventories. We
separately estimate annual fixed operation and maintenance (O&M) costs, including labor,
materials, property taxes, and insurance.
Finally, we translate the estimated costs into the annualized average net revenues the resource
owner would have to earn over an assumed 20-year economic life to achieve its required return
on and return of capital. We assume an after-tax weighted-average cost of capital (ATWACC) of
7.5% for a merchant generation investment, which we estimated based on various reference
points. An ATWACC of 7.5% is equivalent to a return on equity of 12.8%, a 6.5% cost of debt,
and a 65/35 debt-to-equity capital structure with an effective combined state and federal tax rate
of 29.25%. For some states with higher state income tax rates of 10%, the ATWACC is 7.4%.
We adopt the “level-nominal” approach for calculating the first-year annualized costs of the
plants.
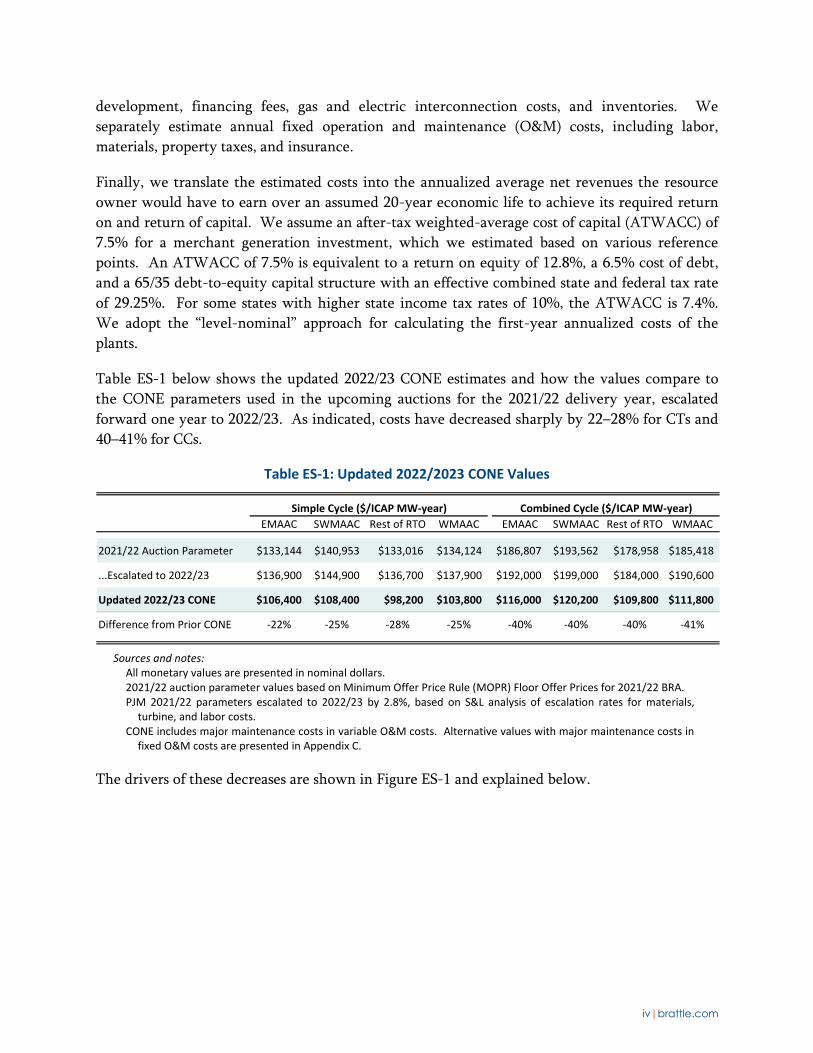
Table ES-1 below shows the updated 2022/23 CONE estimates and how the values compare to
the CONE parameters used in the upcoming auctions for the 2021/22 delivery year, escalated
forward one year to 2022/23. As indicated, costs have decreased sharply by 22–28% for CTs and
40–41% for CCs.
Table ES-1: Updated 2022/2023 CONE Values
Sources and notes:
All monetary values are presented in nominal dollars. 2021/22 auction parameter values based on Minimum Offer Price Rule (MOPR) Floor Offer Prices for 2021/22 BRA. PJM 2021/22 parameters escalated to 2022/23 by 2.8%, based on S&L analysis of escalation rates for materials,
turbine, and labor costs. CONE includes major maintenance costs in variable O&M costs. Alternative values with major maintenance costs in
fixed O&M costs are presented in Appendix C.
The drivers of these decreases are shown in Figure ES-1 and explained below.
Simple Cycle ($/ICAP MW-year) Combined Cycle ($/ICAP MW-year)
EMAAC SWMAAC Rest of RTO WMAAC EMAAC SWMAAC Rest of RTO WMAAC
2021/22 Auction Parameter $133,144 $140,953 $133,016 $134,124 $186,807 $193,562 $178,958 $185,418
...Escalated to 2022/23 $136,900 $144,900 $136,700 $137,900 $192,000 $199,000 $184,000 $190,600
Updated 2022/23 CONE $106,400 $108,400 $98,200 $103,800 $116,000 $120,200 $109,800 $111,800
Difference from Prior CONE -22% -25% -28% -25% -40% -40% -40% -41%

v|brattle.com
Figure ES-1: Drivers of Lower CT and CC 2022/2023 CONE Estimates (EMAAC) (a) Simple Cycle Combustion Turbine (CT)
(b) Combined Cycle (CC)
Notes:
“FOM” stands for fixed O&M costs. CONE includes major maintenance in variable O&M costs.
Three factors drive most of this decrease in CONE:
Economies of scale on larger combustion turbines. Selection of GE 7HA.02
turbines instead of the 7FA.05 turbines used in the 2014 PJM CONE study reflects
a recent trend in actual project developments and future orders toward larger
turbines. The GE H-class turbines are sized at 320 MW per turbine compared to
190 MW for F-class turbines in 2014; the capacity of a 2×1 CC plant nearly
doubles from 650 to 1,140 MW.6 This lowers both construction labor and
equipment costs on a per-kW basis. As a result, the current overnight capital
costs for a CT are only $799/kW to $898/kW (depending on location), 2–10%
lower than the 2014 estimates of $890/kW to $927/kW escalated forward to 2022.7
6 The max summer capacity is based on the estimated values for the Rest of RTO CONE Area.
7 We compare the current capital cost estimates to those filed by PJM in the 2014 CONE update. We
escalated the 2018 capital costs to 2022 by first applying the location-specific escalation rates PJM used
for the 2019/20, 2020/21, and 2021/22 CONE updates for the first three years and then escalating the
costs an additional year by 2.8%/year based on cost trends in labor, equipment, and materials inputs.

vi|brattle.com
CC capital costs range from $772/kW to $873/kW, about 25% lower than the 2014
estimates of $1,054/kW to $1,127/kW escalated to 2022.
Reduced federal taxes. The tax law passed in December 2017 reduced the
corporate tax rate to 21% and temporarily increased bonus depreciation to 100%,
although it eliminated the state income tax deduction.8 These changes decrease
the CT CONE by about $21,000/MW-year (17% lower) and the CC CONE by
about $25,000/MW-year (18% lower), before accounting for the higher cost of
capital due to the lower tax rate.
Lower cost of capital. We estimate an ATWACC of 7.5% for merchant generation
based on current and projected capital market conditions and the change in the
corporate tax rate. Compared to an ATWACC of 8.0% in the 2014 study, the
lower ATWACC reduces the annual CONE value by 3.7% for CTs and 3.8% CCs.
The updated CONE values shown above assume that major maintenance costs are treated as
variable O&M costs, as in past CONE studies. We separately report in Appendix C alternative
CONE values to reflect changes in the PJM cost guidelines since the 2014 CONE Study in which
major maintenance costs are classified as fixed O&M costs instead of variable O&M costs.9
Classifying these costs as fixed instead of variable increases CONE by $19,000/MW-year for CTs
(a 19% increase) and $10,000/MW-year for CCs (a 9% increase). However, removing these costs
from variable O&M increases Net E&AS revenues and offsets the increased CONE value in the
calculation of Net CONE.
Table ES-2 shows additional details on the CONE estimates for CT plants in each CONE Area.
The higher CONE in SWMAAC relative to other areas reflects higher property taxes in Maryland
that are based on all property, including equipment, not just land and buildings. EMAAC’s
relatively high costs reflect higher labor costs there. The Rest of RTO Area has the lowest CONE
value due to lower labor costs and the assumption that an SCR is not needed to reduce NOx
emissions in attainment areas.
8 “Bonus depreciation” refers to the allowance by tax law of highly accelerated tax depreciation
immediately upon in-service of a depreciable asset. In recent years, bonus depreciation has been
enabled by legislation in varying percentages of the overall tax basis in an asset, with the remainder
deducted over the asset life as otherwise allowed. Per the 2017 tax law, bonus depreciation is allowed
for companies not classified as public utilities up to 100% of tax basis.
9 An ongoing stakeholder process within the Markets Implementation Committee is addressing whether
the PJM cost guidelines should be modified to again allow major maintenance costs to be included in
variable O&M costs.

vii|brattle.com
Table ES-2: Estimated CT CONE for 2022/2023
Notes: CONE values expressed in 2022 dollars and Installed Capacity (ICAP) terms.
Table ES-3 shows the recommended CONE estimates for CC plants in each CONE Area.
SWMAAC has the highest CONE estimate due to higher property taxes and the higher costs of
firm gas transportation service compared to dual-fuel capabilities (which is specified in the other
Areas). EMAAC has the next highest CONE estimate due to higher labor costs than the rest of
PJM. WMAAC and Rest of RTO have the lowest CC CONE estimates due to the lower labor
costs in those areas.
Table ES-3: Estimated CC CONE for 2022/2023
Notes: CONE values expressed in 2022 dollars and ICAP terms.
The updated CONE estimates for CCs have decreased significantly more than CTs over the prior
estimates, leading to a CC premium of $8,000–11,800/MW-year compared to $46,000–
54,000/MW-year in the 2020/21 Base Residual Auction (BRA) parameters. The most significant
driver narrowing the difference between CT and CC CONE is economies of scale of the larger CC
based on the 7HA. While the capacity of the CCs plants has almost doubled compared to that in
the 2014 CONE Study, the cost of the gas turbines increased by 50%, and the cost of the steam
section of the CC (including the heat recovery steam generator and steam turbine) increased by
only 30%. CT plants share the same economies of scale on the combustion turbine itself, but not
the greater economies of scale that CCs enjoy on their steam section or other plant costs.
Simple Cycle Combined Cycle
EMAAC SWMAAC Rest of RTO WMAAC
Net Summer ICAP MW 352 355 321 344
Overnight Costs $/kW $898 $836 $799 $886
Effective Charge Rate % 10.1% 10.1% 10.0% 10.0%
Plant Costs $/MW-yr $90,300 $84,300 $80,300 $88,900
Fixed O&M $/MW-yr $16,100 $24,100 $17,900 $14,900
Levelized CONE $/MW-yr $106,400 $108,400 $98,200 $103,800
Levelized CONE $/MW-day $292 $297 $269 $284
Combined Cycle
EMAAC SWMAAC Rest of RTO WMAAC
Net Summer ICAP MW 1,152 1,160 1,138 1,126
Overnight Costs $/kW $873 $772 $815 $853
Effective Charge Rate % 10.6% 10.6% 10.5% 10.5%
Plant Costs $/MW-yr $92,200 $81,800 $85,900 $89,900
Fixed O&M $/MW-yr $23,800 $38,400 $23,900 $21,900
Levelized CONE $/MW-yr $116,000 $120,200 $109,800 $111,800
Levelized CONE $/MW-day $318 $329 $301 $306

viii|brattle.com
Looking beyond the 2022/23 delivery year, we recommend that PJM update the above CONE
estimates prior to each subsequent auction using its existing annual updating approach based on a
composite of cost indices, but with slight adjustments to the weightings. Consistent with the
updated capital cost estimates, we recommend that PJM weight the components in the CT
composite index based on 20% labor, 55% materials (increased from 50%), and 25% turbine
(decreased from 30%). We recommend that PJM weight the CC components based on 30% labor
(increased from 25%), 50% materials (decreased from 60%), and 20% turbine (increased from
15%). PJM will need to account for bonus depreciation declining by 20% in subsequent years
starting in 2023. Consequently, after PJM has escalated CONE by the composite cost index, we
recommend that PJM apply an additional gross-up of 1.022 for CT and 1.025 for CCs each year to
account for the declining tax advantages as bonus depreciation phases out.

1|brattle.com
I. Introduction
A. BACKGROUND
PJM’s capacity market, the Reliability Pricing Model (RPM), features a three-year forward
auction and subsequent incremental auctions in which the Variable Resource Requirement
(VRR) curve sets the “demand.” The VRR curve is determined administratively based on a
design objective to procure sufficient capacity for maintaining resource adequacy in all locations
while mitigating price volatility and susceptibility to market power abuse. As such, the VRR
curves are centered approximately on a target point with a price given by the estimated Net Cost
of New Entry (Net CONE) and a quantity corresponding to PJM’s resource adequacy
requirement. The curve’s slope mitigates price volatility, and a slight right shift (relative to the
target point) avoids low reliability outcomes.
In order for the VRR curve to procure sufficient capacity, the Net CONE parameter must
accurately reflect the price at which developers would actually be willing to enter the market.
Estimated Net CONE should reflect the first-year capacity revenue an economically-efficient
new generation resource would need (in combination with expected energy and ancillary
services (E&AS) margins) to recover its capital and fixed costs, given reasonable expectations
about future cost recovery under continued equilibrium conditions. PJM estimates Net CONE
for a defined “reference resource” by subtracting its estimated one-year E&AS margins from its
estimated Cost of New Entry (CONE).
CONE values are determined through quadrennial CONE studies such as this one, with
escalation rates applied in the intervening years.10 PJM separately estimates Net E&AS revenue
offsets annually for setting the zone-specific Net CONE values in each auction. Just prior to each
three-year forward auction, PJM determines Net CONE values for each of four CONE Areas,
which are used to establish VRR curves for the system and for all Locational Deliverability Areas
(LDAs).11
PJM has traditionally estimated CONE and Net CONE based on a gas-fired simple-cycle
combustion turbine (CT) as the reference resource. In addition to anchoring the VRR curve,
PJM uses CONE estimates for CT and combined-cycle (CC) plants for calculating offer price
screens under the Minimum Offer Price Rule (MOPR) for new generation offering capacity into
RPM.12
10 PJM 2017 OATT, Section 5.10 a.
11 The four CONE Areas are: CONE Area 1 (EMAAC), CONE Area 2 (SWMAAC), CONE Area 3 (Rest of
RTO), and CONE Area 4 (WMAAC). PJM reduced the CONE Areas from five to four following the
2014 triennial review and incorporated Dominion (formerly CONE Area 5) into the Rest of RTO
region.
12 PJM 2017 OATT, Section 5.14 h.

2|brattle.com
B. STUDY OBJECTIVE AND SCOPE
We were asked to assist PJM and stakeholders in this quadrennial review by developing CONE
estimates for new CT and CC plants in each of the four CONE Areas for the 2022/23 Base
Residual Auction (BRA) and proposing a process to update these estimates for the following three
BRAs.
Our objective in estimating CONE is to reflect the technology, location, and costs that a
competitive developer of new generation facilities will be able to achieve at generic sites, not
unique sites with unusual characteristics. We estimate costs by specifying the reference resource
and site characteristics, conducting a bottom-up analysis of costs, and translating the costs to a
first-year CONE.
We provide relevant research and empirical analysis to inform our recommendations, but
recognize where judgments have to be made in specifying the reference resource characteristics
and translating its estimated costs into levelized revenue requirements. In such cases, we discuss
the tradeoffs and provide our own recommendations for best meeting RPM’s objectives to inform
PJM’s decisions in setting future VRR curves.
We review PJM’s methodology for estimating the Net E&AS revenue offsets for each reference
resource and the criteria for selecting the reference resource in the parallel 2018 VRR Curve
Report.
C. ANALYTICAL APPROACH
Our starting point for estimating CONE is a characterization of the CC and CT plants in each
CONE Area to reflect the technologies, plant configurations, detailed specifications, and locations
where developers are most likely to build. While the turbine technology and other specifications
for the reference resource are detailed in PJM’s tariff, we review the most recent gas-fired
generation projects in PJM and the U.S. to determine whether these assumptions remain relevant
to the PJM market.13 The key configuration variables we define for each plant include the
number of gas and steam turbines, duct firing and power augmentation, cooling systems,
emissions controls, and dual-fuel capability.
We identified specific plant characteristics based on: (1) our analysis of the predominant
practices of recently-developed plants; (2) our analysis of technologies, regulations, and
infrastructure; and (3) our experience from previous CONE analyses. We selected key site
characteristics, which include proximity to high voltage transmission infrastructure and
interstate gas pipelines, siting attractiveness as indicated by units recently built or currently
under construction, and availability of vacant industrial land. Our analysis for selecting plant
characteristics and locations for each CONE Area is presented in Section III of this report.
13 PJM 2017 OATT.

3|brattle.com
We developed comprehensive, bottom-up estimates of the costs of building and maintaining the
candidate references resources in each of the four CONE Areas. Sargent & Lundy (S&L)
estimated plant proper capital costs—equipment, materials, labor, and the engineering,
procurement, and construction (EPC) contracting costs—based on a complete plant design and
S&L’s proprietary database on actual projects. S&L and Brattle then estimated the owner’s capital
costs, including owner furnished equipment, gas and electric interconnection, development and
startup costs, land, inventories, and financing fees using S&L’s proprietary data and additional
analysis of each component. The results of this analysis are presented in Section IV.
We further estimated annual fixed and variable O&M costs, including labor, materials, property
tax, insurance, asset management costs, and working capital. The results of this analysis are
presented in Section V.
Next, we translated the total up-front capital costs and other fixed-cost recovery of the plant into
an annualized estimate of fixed plant costs, which is the Cost of New Entry, or CONE. CONE
depends on the estimated capital investment and fixed going-forward costs of the plant as well as
the estimated financing costs (cost of capital, consistent with the project’s risk) and the assumed
economic life of the asset. The annual CONE value for the first delivery year depends on
developers’ long-term market view and how this long-term market view impacts the expected
cost recovery path for the plant—specifically whether a plant built today can be expected to earn
as much in later years as in earlier years. We present our financial assumptions for converting
the costs of building and operating the plant into an annualized CONE estimate in Section VI and
a summary of the CONE estimates in Section VII.
The Brattle and Sargent & Lundy authors collaborated on completing this study and report. The
specification of plant characteristics was jointly developed by both teams, with S&L taking
primary responsibility for developing the plant proper capital, plant O&M and major
maintenance costs, and the Brattle authors taking responsibility for various owner’s costs and
fixed O&M costs, and for translating the cost estimates into the CONE values.

4|brattle.com
II. Observations about Recent Entry in PJM’s Capacity Market
As a starting point for our analysis of the Net Cost of New Entry, we reviewed the recent market
activity to better understand the underlying dynamics in the PJM Base Residual Auctions and
identify areas of focus for the current Net CONE study.
A. SUMMARY OF RECENT NEW ENTRY IN PJM
Over 31,000 ICAP MW of new generation resources cleared the market in the six auctions since
the 2015/16 Base Residual Auction (BRA) despite the auctions clearing well below the
administratively-determined Net CONE parameter. Figure 1 below shows that, on average, these
auctions have cleared at prices 60% below the Net CONE parameter during this period of
significant entry of new generation resources.14 As the clearing prices reflect the offer price of
the marginal unit clearing the market, new generation resources must have on average been
submitting offers into the auction at even lower prices.
Figure 1: Base Residual Auction Clearing Prices and Cleared New Generation Capacity
Sources and notes:
PJM Annual Base Residual Auction Results, accessed September 2017, http://www.pjm.com/markets-and-operations/rpm.aspx
14 Some new generation capacity has cleared in sub-zones at higher prices than shown in Figure 1.
However, most of the new capacity that has cleared during this time period did so at the prices shown
here.

5|brattle.com
About half of new generation capacity since the 2015/16 BRA cleared in MAAC and the other
half cleared in the rest of the PJM system.15 A third of the new plants are CCs located close to
shale gas production regions in Pennsylvania and Ohio to take advantage of pipeline constraints
that result in lower local gas prices relative to the rest of PJM.16 The remaining plants are located
throughout the PJM market with significant additions in Virginia, New Jersey, and the western
portions of PJM.
Nearly all new generating units entering the BRAs are natural-gas-fired. Most of these new
natural gas plants consist of CC plants, as shown in Figure 2 below, while the Net CONE
parameter is currently set based on a CT. There were significant additions of new CTs in PJM
prior to 2005, but limited merchant entry since then.17 While CCs went through a similar lull in
new additions between 2005 and 2014—when the PJM capacity market attracted other resource
types, such as uprates to existing plants, deferred retirement, imports, and demand response—a
total of 27,000 MW of new CC plants have cleared since the 2015/16 BRA.
Figure 2: CC and CT Generation Capacity Cleared in Past BRAs
Sources and notes:
PJM Base Residual Auction Results for 2020/21, published on 5/23/2017.
15 Based on the PJM Annual Base Residual Auction Results, there has been 12,800 Unforced Capacity
(UCAP) MW of new capacity in MAAC since the 2015/16 BRA and 13,000 UCAP MW of new
capacity in the rest of the PJM system. PJM Annual Base Residual Auction Results, accessed
September 2017, http://www.pjm.com/markets-and-operations/rpm.aspx
16 We identified plants with access to lower-cost natural gas based on the gas hub listed for each plant in
ABB Inc.’s Energy Velocity Suite. We considered plants with access to gas priced based on the
Dominion South, Dominion North, Leidy Hub, Transco Leidy Receipts, or Tennessee Gas Pipeline
Zone 4 as within shale production regions.
17 There has been entry of just two merchant CTs since 2014 (340 MW Doswell Peaking Unit and 141
MW Perryman Unit 6).

6|brattle.com
B. DRIVERS OF LOW-COST ENTRY BY NATURAL GAS PLANTS
Several factors have led to the significant investment in new gas-fired CC plants at capacity
market prices that have been on average 60% below PJM’s Net CONE value during the past six
BRAs. Coal and nuclear retirements and the exit of some demand response resources created the
need for new entry. We believe that the entry by CC plants was possible at the observed low
prices in large part due to improved combustion turbine performance, lower plant cost on a
$/kW basis, low-cost investment capital, and low natural gas prices (allowing for large spark
spreads) in some locations.
Generation Retirements: There has been a surge of generation retirements in PJM since 2011
with 32,800 MW of existing resourcing deactivating or requesting deactivations over the ten-
year period from 2011 to 2020 (compared to just 6,600 MW from 2002 to 2010).18 The majority
of these retirements have been coal plants (26,000 MW) while several nuclear plants (3,200 MW)
have announced retirements by 2020.19 Even during a period of limited load growth, the
retirements provided an opportunity for new generation resources to enter the market.20 The
retirements help explain the scale of recent new entry, but not the low prices at which entry has
occurred. We next examine several factors that contribute to new gas CCs entering the capacity
auctions at prices below the estimated Net CONE.
Turbine Performance: The efficiency and net plant capacity of gas turbines has risen significantly
since 2010. As shown in Figure 3 below, CC plants with GE 7FA turbines in a 2×1 configuration
(2 gas turbines, 1 steam turbine) have increased their net plant capacity since 2008 by 220 MW (a
42% increase), while reducing their net plant heat rate (HHV) by 440 Btu/kWh from 6,780 to
6,340 Btu/kWh (a 6% decrease).21 This trend in performance is significant even before
accounting for the introduction of the larger, more efficient H-class turbines that are now
beginning to enter the market (see Section III.B below). The H-class turbines provide a step
change in terms of the economies of scale: a 2×1 CC configuration with H-class turbines achieves
a net plant output of about 1,100 MW and a net heat rate (HHV) of nearly 6,100 Btu/kWh.22 The
larger turbines result in significant cost savings on a per-kW basis due to the economies of scale
for developing such large plants. The improved efficiency of these turbines increases the Net
18 PJM. Generator Deactivation Summary Sheets, accessed December 2017,
http://www.pjm.com/planning/generation-deactivation/gd-summaries.aspx
19 ABB Inc.’s Energy Velocity Suite December 2017.
20 The Reliability Requirement (adjusted for FRR) grew by just 6,000 MW (4%) from the 2014/15 BRA
(148,323 MW) to the 2020/21 BRA (154,355 MW). Annual BRA parameters available here:
http://www.pjm.com/markets-and-operations/rpm.aspx
21 Gas Turbine World, “2016–17 GTW Handbook,” Volume 32.
22 The net heat rate reported here is lower than estimated for each CONE Area due to the conditions
under which the heat rate is estimated (ISO conditions of 59°F, 60% Relative Humidity and 0 feet
above mean sea level).

7|brattle.com
E&AS revenue offset for the new gas plants by reducing their dispatch costs and increasing the
frequency with which they operate. Both trends result in reduced offers into the PJM capacity
auctions.
Figure 3: Historical Performance of GE 7FA and GE 7HA in a 2×1 Combined-Cycle Configuration (a) Net Plant Output (b) Net Plant Heat Rate, HHV
Sources and notes:
Gas Turbine World, “2016–17 GTW Handbook,” Volume 32.
Turbine Costs: The increase in net plant capacity since 2008 for CTs has occurred during a
period of relatively limited cost increases for the turbines and the overall plants. The result is a
significantly lower cost for gas-fired combustion turbines on a per-kW basis, whether in simple-
cycle or combined-cycle configurations. The per-kW costs for combustion turbines have
declined by nearly 40% since they peaked in 2010 and by 11% since 2014 (see Section VII.A for a
further discussion of these trends). Similarly, the composite index that PJM uses to annually
adjust the CT CONE value based on the Department of Commerce’s Bureau of Labor Statistics
(BLS) indices has decreased by 17% since 2010 when adjusted for the increased capacity of new
CTs over this time period.23 The declining cost for new turbines and plants on a per-kW basis
result in a decline in the CONE for new gas plants.
Financing Cost: Financial drivers have contributed to reducing the price at which offers are
placed into the PJM capacity auctions. The financing cost (cost of capital) for merchant
generators has declined in recent years with the estimated after-tax weighted-average cost of
capital (ATWACC) for publicly-traded merchant developers declining from 8.0% in 2014 to the
current value of 7.5% as estimated in this study. Additional cost of capital reference points we
identified based on analyst reports of recent acquisitions (as explained in detail in Section VI.A
below) show the cost of capital may have been even lower in recent years.24 A reduction in the
cost of capital from 8.0% to 7.5% reduces CONE by about 3.8%. In addition, bonus depreciation
23 The composite gas plant index that PJM uses blends BLS indices for turbine cost (30%), material costs
(50%), and labor costs (20%). We discuss PJM’s approach to annual updates to CONE based on these
indices in Section VIII. below.
24 For example, the June 2017 fairness opinion for the Calpine acquisition by Energy Capital Partners
assumed 5.75% to 6.25% for Calpine’s weighted-average cost of capital.

8|brattle.com
was available for the most recent new plants at the time of the auctions they cleared—with
plants online by the end of 2017 able to depreciate 50% of their costs in the first year, 40% for
plants online in 2018, and 30% for plants online in 2019.25 We estimate that 30% bonus
depreciation reduces CONE by about 3.5%.
Natural Gas Prices: The coal and nuclear plant retirements and entry of new gas CCs has been
triggered by sustained low prices for natural gas. Shale gas production from the Marcellus and
Utica formations that lie within the PJM market footprint increased significantly since 2010,
resulting in lower gas prices across PJM and the U.S. as shown in Figure 4.26 Gas prices in shale
production regions, as represented below by the Dominion South hub (light blue line), have sold
at a discount of $1–2/MMBtu to Henry Hub since 2014. Lower gas prices have extended to the
eastern portions of PJM, as represented by the Transco Zone 6 Non-NY hub (red line), during
three of the past four summers as well. Based on traded natural gas futures, Dominion South gas
prices are expected to remain on average around $2.50/MMBtu through 2022, nearly
$0.50/MMBtu lower than Henry Hub (dark blue line), based on current gas futures.
Figure 4: Gas Prices at Representative Gas Hubs in PJM
Sources and notes:
Historical prices downloaded from ABB Inc.’s Energy Velocity Suite and futures prices from SNL in December 2017.
25 Bonus depreciation was re-introduced as a part of the changes to federal taxes in December 2017,
starting at 100% for plants online by January 1, 2023 and then phasing out over the following five
years. We discuss the implications of the bonus depreciation for new resources in Section VI.B below.
26 U.S. Energy Information Administration, 2010–2015. “U.S. Shale Gas Production”, accessed December
2017 at https://www.eia.gov/dnav/ng/ng_prod_shalegas_s1_a.htm.

9|brattle.com
Lower gas prices reduce the fuel costs for new gas CCs relative to other fossil-fuel-fired plants
that may determine PJM wholesale energy market prices—primarily coal plants—and result in
higher annual output from these plants.27 Lower gas prices will reduce average energy market
prices and net revenues across all generation resources. Whether lower gas prices result in
higher or lower net revenues for the new CCs will depend on the relative heat rate of the new
gas plants compared to the market heat rate as set by generating units that tend to be on the
margin for most of the year. Plants that enjoy a unique advantage in shale-gas locations are
likely to earn higher net revenues as electricity market prices will be set by resources that must
pay a higher price for delivered fuel, increasing the spread between revenues and costs for the
CCs located in these shale-gas-regions.
We reviewed these recent market trends to understand what is driving the significant
development of new gas-fired units at prices well below those projected in previous CONE
studies and incorporated these trends into our analysis in the remainder of this report.
27 Coal has been on the margin in PJM for 45–60% of hours since 2012. PJM, 2012–2016 CO2, SO2 and
NOX Emission Rates, March 17, 2017, p. 3. Available at:
https://www.pjm.com/~/media/library/reports-notices/special-reports/20170317-2016-emissions-
report.ashx

10|brattle.com
III. Reference Resource Technical Specifications
Similar to the 2014 PJM CONE Study, we determined the characteristics of the reference
resources primarily based on a “revealed preferences” approach that relies on our review of the
choices that actual developers found to be most feasible and economic. However, because
technologies and environmental regulations continue to evolve, we supplement our analysis with
additional consideration of the underlying economics, regulations, infrastructure, and S&L’s
experience.
For selecting the reference resource location within each CONE Area, we relied on a similar
analysis for the 2014 PJM CONE Study that considers a broad view of potential sites that can be
considered feasible and favorable for new plant development. For determining most of the
reference resource specifications, we updated our analysis from the 2014 study by examining CT
and CC plants built in PJM and the U.S. since 2014, including plants currently under
construction. We characterized these plants by size, plant configuration, turbine type, duct
firing, environmental controls, dual-fuel capability, and cooling system.
A. LOCATIONAL SCREEN
The PJM Open Access Transmission Tariff (OATT) requires a separate CONE parameter in each
of four CONE Areas as summarized in Table 1.28
Table 1: PJM CONE Areas
We conducted a locational screening analysis to identify feasible and favorable locations for each
of the four CONE Areas. Our approach for identifying the representative locations within each
CONE Area included three steps:
1. We identified candidate locations based on the revealed preference of actual plants built
since 2014 or under construction to identify the areas of primary development, putting
more weight on recent projects.
2. We sharpened the definition of likely areas for future development, depending on the
extent of information available from the first step. For CONE Areas where recent
28 PJM 2017 OATT, Section 5.10 a.
CONE Area Transmission Zone States
1 EMAAC AECO, DPL, JCPL, PECO, PSEG, RECO NJ, MD, PA, DE
2 SWMAAC BGE, PEPCO MD, DC
3 Rest of RTO AEP, APS, ATSI, ComEd, DAY, DEOK, DQL, DOM WV, VA, NC, OH, IN, IL, KY, TN, MI, PA, MD
4 WMAAC MetEd, Penelec, PPL PA

11|brattle.com
projects provide a clear signal of favored locations, we excluded only counties that would
appear to be less attractive going forward, based on environmental constraints or
economic costs (absent special offsetting factors we would not know about). For CONE
Areas where the revealed preference data is weak or scattered, we identified promising
locations from a developer perspective based on proximity to gas and electric
interconnections and key economic factors such as labor rates and energy prices.
3. This approach results in identifying a specified area that spans several counties. For this
reason, we developed cost estimates for each CONE Area by taking the average of cost
inputs (e.g., labor rates) across the specified locations.
The locations chosen for each CONE Area are shown in Figure 5. To provide a more detailed
description of the specified locations, we show in Table 2 the cities used for estimating labor
rates.
Our review of recent development in CONE Area 1 Eastern MAAC (EMAAC) resulted in
identifying southern New Jersey and portions of northern Delaware, northeast Maryland, and
southeast Pennsylvania as the reference resource location. We identified significant
development in this region and northern New Jersey. Northern New Jersey projects are either
located on brownfield sites or at existing sites, which are not widely available to future
developers. Moreover, recent developments were more heavily concentrated in the southern
portion of EMAAC. The economics are more favorable in this area with lower labor costs and
higher energy market prices.
In CONE Area 2 Southwest MAAC (SWMAAC), we maintained the same location as the 2014
CONE Study in southern Maryland, including portions of Charles, Prince George’s, and Anne
Arundel counties. There have been two new CC units developed in this region recently
compared to a single CT in northern Maryland.
For the larger CONE Area 3 Rest of RTO CONE Area, the revealed preferences approach
indicated two candidate regions based on our review of recently built or in-development plants:
the region along the Pennsylvania-Ohio border and Virginia.29 Although there have been more
resources recently developed in Virginia, the majority of them are regulated and the
development is over a larger area. The region along the Pennsylvania-Ohio border currently has
three CCs under construction, has attractive energy market net revenues, and is in attainment for
8-hour ozone.
In CONE Area 4 Western MAAC (WMAAC), developers have continued to demonstrate a
willingness to build primarily in northeastern Pennsylvania, including areas around Allentown,
29 Since the 2014 PJM CONE Study, the Dominion transmission zone has been added to the Rest of RTO
CONE Area 3.

12|brattle.com
Scranton, and Wilkes-Barre. There have been several new units in this region, including two
CCs that recently began operation and three more under construction.
Figure 5: Results of Locational Screening for each CONE Area
Sources and notes:
Data on operating and planned projects downloaded from SNL in August 2017.
Table 2: CONE Area Labor Pools
We calculate the plant operating characteristics (e.g., net capacity and heat rate) of the reference
resources using turbine vendors’ performance estimation software for the combustion turbines’
output and GateCycle software for the remainder of the CC plants.30 For the specified locations
within each CONE Area, we estimate the performance characteristics at a representative
30 GateCycle is a PC-based software application used for design and performance evaluation of thermal
power plant systems at both design and off-design points. The GateCycle application allows for
detailed analytical models for the thermodynamic, heat transfer, and fluid-mechanical processes
within power plants.
EMAAC SWMAAC Rest of RTO WMAAC
Harrisburg, PA Annapolis, MD New Castle, PA Wilkes-Barre, PA
Baltimore, MD Youngstown, OH Scranton, PA
Vineland, NJ Columbus, OH Williamsport, PA
Philadelphia, PA Erie, PA
Dover, DE

13|brattle.com
elevation and at a temperature and humidity that reflects peak conditions in the median year.31
The assumed ambient conditions for each location are shown in Table 3.
Table 3: Assumed PJM CONE Area Ambient Conditions
Sources and notes:
Elevation estimated by S&L based on geography of specified area. Summer conditions developed by S&L based on data from the National Climatic Data
Center’s Engineering Weather dataset.
B. SUMMARY OF REFERENCE RESOURCE SPECIFICATIONS
Based on the assumptions discussed later in this section, the technical specifications for the CT
and CC reference resources are shown in Table 4 and Table 5. Net plant capacity and heat rate
are calculated at the ambient air conditions listed above in Table 3.
Table 4: CT Reference Resource Technical Specifications
Sources and notes:
See Table 3 for ambient conditions assumed for calculating net summer installed capacity (ICAP) and net heat rate.
* For EMAAC, SWMAAC, Rest of RTO, and WMAAC, respectively.
31 The 50/50 summer peak day ambient condition data developed from National Climatic Data Center,
Engineering Weather 2000 Interactive Edition, Asheville, NC, 2000. Adjustments were made for
adapting the values to representative site elevation using J.V. Iribarne, and W.L. Godson, Atmospheric Thermodynamics, Second Edition (Dordrecht, Holland: D. Reidel Publishing Company, 1981).
CONE Area Elevation
Max. Summer
Temperature
Relative
Humidity
(ft) (°F) (%RH)
1 EMAAC 330 92.0 55.5
2 SWMAAC 150 96.0 44.6
3 Rest of RTO 990 89.8 49.7
4 WMAAC 1,200 91.2 49.2
Plant Characteristic Specification
Turbine Model GE 7HA.02
Configuration 1 x 0
Cooling System n/a
Power Augmentation Evaporative Cooling; no inlet chillers
Net Summer ICAP (MW) 352 / 355 / 321 / 344 *
Net Heat Rate (HHV in Btu/kWh) 9,274 / 9,270 / 9,221 / 9,263 *
Environmental Controls
CO Catalyst Yes, except for Rest of RTO
Selective Catalytic Reduction Yes, except for Rest of RTO
Dual Fuel Capability Yes
Firm Gas Contract No
Special Structural Req. No
Blackstart Capability None
On-Site Gas Compression None

14|brattle.com
Table 5: CC Reference Resource Technical Specifications
Sources and notes:
See Table 3 for ambient conditions assumed for calculating net summer ICAP and net heat rate. * For EMAAC, SWMAAC, Rest of RTO, and WMAAC, respectively.
C. PLANT SIZE, CONFIGURATION AND TURBINE MODEL
While the turbine technology for each plant is specified in the tariff (i.e., GE 7FA as the turbine
model), we reviewed the most recent gas-fired generation projects and trends in turbine
technology in PJM and the U.S. to consider whether to adjust this assumption.32 We reviewed
CT and CC projects recently built or under construction in PJM and across the U.S. to determine
the configuration, size, and turbine types for the reference resources.
1. Combined-Cycle Turbine Model, Configuration, and Duct Firing
Due to the almost exclusive development of CC plants in PJM in recent years, we focused our
analysis of turbine models trends on the CCs. We found that the market is shifting away from
the F-class and G-class frame type turbines that have been the dominant turbines over the past
several decades and toward the larger H-class and J-class turbines. The larger H-class machine is
an incremental evolution of the F-class machine with similar firing technologies. This presents
low risk in terms of the maturity of the technology.
As shown in Table 6, over half of the CC plants installed or under construction in PJM since 2014
have installed H/J-class turbines. All of the CCs that cleared in the 2019/20 and 2020/21 BRAs
are installing H/J-class turbines. In addition, we reviewed recent orders for GE turbines and
32 PJM 2017 OATT, Part 1 - Common Services Provisions, Section 1 - Definitions.
Plant Characteristic Specification
Turbine Model GE 7HA.02
Configuration 2 x 1
Cooling System Mechanical Draft Cooling Tower
Power Augmentation Evaporative Cooling; no inlet chillers
Net Summer ICAP (MW)
w/o Duct Firing 1,023 / 1,031 / 1,012 / 1,001 *
with Duct Firing 1,152 / 1,160 / 1,138 / 1,126 *
Net Heat Rate (HHV in Btu/kWh)
w/o Duct Firing 6,312 / 6,306 / 6,295 / 6,300 *
with Duct Firing 6,553 / 6,545 / 6,532 / 6,537 *
Environmental Controls
CO Catalyst Yes
Selective Catalytic Reduction Yes
Dual Fuel Capability Yes, except for SWMAAC
Firm Gas Contract SWMAAC only
Special Structural Req. No
Blackstart Capability None
On-Site Gas Compression None

15|brattle.com
found that future CCs are almost exclusively using the H-class turbines.33 This shows a clear
trend toward the H/J-class turbine relative to past studies.34 We selected the GE 7HA due to its
slightly higher installed capacity. Other equivalent machines to the GE H-class machine such as
the Siemens 9000HL or the Mitsubishi M501JAC have seen low market penetration in the U.S. at
the time of this report. In addition, compared to equivalent models, the GE 7HA has been
proven with more operating experience in the industry than other H-class equivalent gas turbine
models.
Table 6: Turbine Model of Combined-Cycle Plants Built or Under Construction in PJM since 2014
Sources and notes:
Data downloaded from ABB Inc.’s Energy Velocity Suite, August 2017.
Reflecting the shifts in turbine models, the size of recently developed CC plants is increasing.
Although the most common range remains 700–900 MW as shown in Table 7, there has been
6,000 MW of capacity of new units in the 900–1,100 MW range (compared to 1,300 MW in the
2014 study) and 5,700 MW of units with capacity greater than 1,000 MW. In addition, the most
common configuration remains the 2×1 (two gas combustion turbines, one steam turbine).35 For
this reason, we have maintained our assumption that the reference CC is a 2×1 plant.
33 We reviewed GE Power & Water’s H-Class Gas Turbine Experience List from November 2016 and the
7F.05 Gas Turbine Experience List from June 2016.
34 In the 2014 CONE Study, there was just 1,500 MW of H/J-class turbines.
35 The CCs that most recently cleared the market are primarily 2x1 units with an average capacity of
around 1,000 MW.
PJM U.S.
Turbine Model Installed Capacity Installed Capacity
(MW) (MW)
General Electric 7HA 4,469 7,678
General Electric 7FA 4,436 11,422
Siemens SGT6-8000H 4,228 6,717
Siemens SGT6-5000F 4,140 8,306
Mitsubishi M501J 3,936 4,452
Mitsubishi M501G 2,775 6,310
General Electric 6B 251 251
Siemens SGT6-500 0 642
General Electric LM6000 0 331
Siemens V84.2 0 243
Siemens SGT6-800 0 127
Total 24,235 46,480
F/G Class Total 11,351 26,039
H/J Class Total 12,633 18,847

16|brattle.com
Table 7: Capacity and Configuration of CC Plants Built or Under Construction in PJM since 2014
Sources and notes:
Data downloaded from ABB Inc.’s Energy Velocity Suite August 2017.
Based on the local ambient condition assumptions in Table 3, we specify the 2×1 CC reference
resource’s summer capacity to range from 1,001 MW to 1,031 MW prior to considering
supplemental duct firing.
For the reference CC plant, supplemental firing of the steam generator, known as “duct firing,”
increases steam production and hence increases the output of the steam turbine.36 Duct firing is
common, although there is no standard optimized design. The decision to incorporate
supplemental firing with the plant configuration and the amount of firing depends on the
owner’s preference and perceived economic value. We assumed the reference CC plant would
add duct firing sufficient to increase the net plant capacity by 125–129 MW, or 13%, close to the
average of CC plants constructed since 2007 or in development in PJM of 12%.37 With duct
firing, the max summer net capacity of the CC increases to 1,126–1,160 MW across CONE
Areas.38
2. Combustion Turbine Model and Configuration
For the CT reference plant, there has been very limited development of frame-type CTs in PJM
since 2007, as shown in Table 8. The GE 7FA continues to be the turbine with the most capacity
added in PJM since 2007.39
36 Including duct firing increases the net capacity of the plant but reduces efficiency due to the higher
incremental heat rate of the supplemental firing (when operating in duct firing mode) and the
reduced efficiency of steam turbine (when not operating at full output). The estimated heat rates and
capacities take account for this effect.
37 The average incremental capacity provided by including duct firing capabilities for CC plants
constructed since 2007 and in development is 12% for plants in PJM and 15% for plants across the US.
Data downloaded from ABB Inc.’s Energy Velocity Suite in August 2017.
38 The CC is based on a flexible CC design that has become an industry standard due to its ability to
accommodate cycle.
39 The three 7FA turbines were added at Dominion’s Ladysmith plant in 2008 and 2009.
Plant Summer Capacity Range (MW)
< 300 300 - 500 500 - 700 700 - 900 900 - 1,100 1,100 -1,300 > 1,300 Total
CT x ST (GW) (GW) (GW) (GW) (GW) (GW) (GW) (GW)
1 x 1 0.0 1.2 0.0 0.7 0.0 0.0 0.0 1.9
2 x 1 0.0 0.0 2.0 6.3 3.9 0.0 0.0 12.2
3 x 1 0.0 0.0 0.0 0.0 1.1 0.0 5.7 6.8
2 x 2 0.0 0.0 0.6 1.5 1.0 0.0 0.0 3.1
Total 0.0 1.2 2.6 8.6 6.0 0.0 5.7 24.0

17|brattle.com
Table 8: Turbine Model of CT Plants Built or Under Construction in PJM and the U.S. since 2007
Sources and notes:
Data downloaded from ABB Inc.’s Energy Velocity Suite August 2017.
While the GE 7FA remains the most common frame-type turbine to be built since 2007, we
reviewed additional sources due to the growing prevalence of the H-class turbines for use in a
combined-cycle configuration, including recently proposed CTs in merchant markets, the
performance characteristics of the turbines, the projected turbine costs, and PJM’s Independent
Market Monitor’s (IMM’s) assumptions for new entrants in the State of the Market report. We
found that, although there are limited new frame-type turbines proposed to be built in the U.S.
in simple-cycle configuration, both the GE 7FA and GE 7HA are currently being considered for
CT development. The 7HA specifically is proposed for the Canal 3 plant in ISO-NE and for the
Puente Power Project in CAISO.40 In addition, the 7HA heat rate and costs on a per-kW basis
are more attractive, and PJM’s IMM has used the H-class turbine as the basis for its evaluation of
Net Revenues in the annual State of the Market report since 2014.
For these reasons, the frame-type GE 7HA turbine is a reasonable choice for the CT reference
resource in PJM. Due to the larger size of the 7HA turbine, we assume that the reference CT
plant includes only a single turbine (“1×0” configuration), reflecting the configuration recently
proposed for the CTs with GE 7HA turbines in Massachusetts and California.41 We specify the
40 The Puente Power Project was cancelled following the recommendation of commissioners of the
California Energy Commission to reject the plant following significant intervenor push back.
41 The 2014 PJM CONE study assumed the CT plant included two 7FA turbines (“2×0” configuration).
Turbine Model Turbine Class PJM U.S.
(count) (MW) (count) (MW)
General Electric 7FA Frame 3 481 26 4,289
Pratt & Whitney FT8 N.A. 6 339 31 1,664
General Electric LM6000 Aeroderivative 7 317 96 4,360
General Electric LMS100 Aeroderivative 3 273 43 4,050
Rolls Royce Corp Trent 60 Aeroderivative 2 124 4 230
Pratt & Whitney FT4000 N.A. 2 120 2 120
Siemens SGT6-5000F Frame 0 0 14 2,597
General Electric 7EA Small Frame 0 0 21 1,492
General Electric 7FB Frame 0 0 3 699
General Electric 7HA Frame 0 0 2 612
Rolls Royce Corp Unknown N.A. 0 0 8 480
Pratt & Whitney Unknown N.A. 0 0 6 332
Westinghouse 501D5 N.A. 0 0 1 121
General Electric LM2500 Aeroderivative 0 0 4 65
Siemens Unknown N.A. 0 0 2 29
Total 23 1,654 263 21,140

18|brattle.com
CT reference resource capacity and heat rate in the CONE Areas based on the local conditions
assumptions in Table 3, with the CT capacities ranging from 321 to 355 MW.42
D. DETAILED TECHNICAL SPECIFICATIONS
The majority of the specifications have remained the same as the 2014 CONE Study. In this
section, we discuss the fuel supply assumptions and environmental controls. We discuss other
technical specifications that are consistent with the 2014 CONE study in Appendix A.
1. Emissions Controls
Emissions control technology requirements for new major stationary sources are determined
through the New Source Review (NSR) pre-construction permitting program. The NSR
permitting program evaluates the quantity of regulated air pollutants the proposed facility has
the “potential to emit” and determines the appropriate emissions control technology/practice
required for each air pollutant. The regulated air pollutants that will have the most impact on
emissions control technology requirements for new CTs and CCs are nitrogen oxides (NOx) and
carbon monoxide (CO).
NOx and CO emissions from proposed gas-fired facilities located in PJM are evaluated through
two different types of NSR permitting requirements:
Non-attainment NSR (NNSR) for NOx emissions (applies to all site locations within the
Ozone Transport Region, or OTR); and
Prevention of Significant Deterioration (PSD) for CO emissions (entire PJM territory) and
NOx emissions (eastern Ohio portion of Rest of RTO).
For new facilities located within the OTR, NOx emissions are evaluated through the NNSR
permitting program if potential NOx emissions exceed the applicable annual emissions threshold.
The OTR includes Delaware, the District of Columbia, Maryland, New Jersey, New York,
Pennsylvania, and portions of Virginia. Except for portions of the Rest of RTO, all of the CONE
Areas in PJM are within the OTR, and thus emissions of NOx from proposed facilities are treated
as a non-attainment air pollutant and evaluated through NNSR. The portion of the Rest of RTO
CONE Area identified through the locational analysis in eastern Ohio is currently classified as
42 Note that we account for the lack of a Selective Catalytic Reduction (SCR) package installed on the CT
in the Rest of RTO (CONE Area 3) in setting the max summer capacity of the unit. We describe the
basis for not including the SCR in this area in the next section. Without the SCR, the unit is likely to
be tuned to reduce NOx emissions, which reduces the max output. We have confirmed that this
approach is more economical than installing the SCR and gaining the additional capacity. The
developer will have to accept a federally-enforceable annual run-hour limitation.

19|brattle.com
“attainment,” “unclassified,” or “maintenance” for 8-hour ozone; therefore, PSD permitting
applies to new facilities in the eastern Ohio region if NOx emissions exceed the annual threshold.
New CTs and CCs with no federally enforceable restrictions on operating hours are typically
deemed a major source of NOx emissions, and therefore, trigger a Lowest Achievable Emissions
Rate (LAER) or Best Available Control Technology (BACT) analysis to evaluate NOx emission
control technologies. The NOx emission control technology required by the LAER or BACT
analysis is likely to be a selective catalytic reduction (SCR) system. SCR systems are widely
recognized as viable technology on aeroderivative and smaller E-class frame combustion turbines
and have more recently been demonstrated on F-class frame turbines.43 In addition, we assume
dry low NOx burners are necessary to achieve the required emissions reductions.
CO emissions are evaluated through the PSD permitting requirements, because the PJM region is
designated as an attainment area for CO. New combustion turbine facilities with no operating
hour restrictions typically have the potential to emit CO in a quantity that exceeds the
significant emissions threshold for CO, and therefore, trigger a BACT analysis to evaluate CO
emissions control technologies. The CO emissions control technology required as a result of a
BACT analysis is likely to be an oxidation catalyst (CO catalyst) system.
Based on our review of the applicable environmental regulations pertinent to new units located
in each CONE Area and the emissions rates of the reference resources, we assume an SCR and a
CO Catalyst system as the likely requirements resulting from the NSR permitting program for
new gas-fired facilities proposed in all CONE Areas, except a new CT in the Rest of RTO area.
For the Rest of RTO region, a new CT unit that primarily fires natural gas is likely to avoid SCR
and CO catalyst by installing combustors capable of achieving 9 ppm NOx and 9 ppm CO and
accepting a federally-enforced annual run limit that will be set in the range of 20–40%. In
western PA, a new CT would likely need to limit annual operation to approximately 20% to keep
NOx emissions below the threshold of 50 tons per year. In eastern Ohio region, a new CT would
face an annual run limit of approximately 30–40% driven by EPA’s greenhouse gas performance
standards for new combustion turbines.44
The addition of the SCR and CO Catalyst system on the CTs in the non-Rest of RTO regions adds
$24 million (in 2017 dollars) to the capital costs.45 All CCs are equipped with the SCR and CO
catalyst at an incremental cost of $50 million (in 2017 dollars).
43 CCs with H-class turbines will use an SCR design similar to the F-class turbines. While the exhaust
temperature is similar (the 7HA.02 is a bit higher by about 10oF), the exhaust flow of the 7HA.02 is
about 35% more than the 7FA.02 and requires a larger tempering air system.
44 See 40 CFR Part 60 Subpart TTTT.
45 Including an SCR on the Rest of RTO CT increases the installed costs to $886/kW and CONE to
$103,000/MW-year.

20|brattle.com
2. Fuel Supply Specifications
Natural gas-fired plants can be designed to operate solely on gas or with “dual-fuel” capability to
burn both gas and diesel fuel. Dual-fuel plants allow the turbines to switch between the lower
cost fuel sources depending on market conditions and fuel availability. An alternative approach
for securing fuel supply for gas plants is to procure firm transportation service on the gas
pipelines, although in most cases including dual-fuel capabilities is the lower cost approach.46 In
our review of recent generation projects, we found that developers have been choosing in some
cases to install dual-fuel capability or obtain firm gas contracts, although several new units have
chosen neither option. Adding secure fuel supply capabilities has increased since the 2014 PJM
CONE Study following the adoption of the Capacity Performance market design in which units
are exposed to incentive payments during shortage conditions.
To reflect the changes in the market rules since the 2014 study, we updated our assumption from
the 2014 PJM CONE Study such that the reference CT and CC plants would either install dual-
fuel capability or procure firm transportation service in all CONE Areas.47 Specifically, we
assume all units add dual-fuel capabilities, except the SWMAAC CC, which procures firm
transportation service.
We assume the dual-fuel plants are equipped with enough liquid fuel storage and infrastructure
on-site for three days of continuous operation. Dual-fuel capability requires the combustion
turbines to have water injection nozzles to reduce NOx emissions while firing liquid fuel. These
modifications as well as the costs associated with fuel oil testing, commissioning, inventory, and
the capital carrying charges on the additional capital costs contribute to the overall costs for
dual-fuel capability. The incremental cost is approximately $14 million for the CT and
$16 million for the CC (in 2017 dollars), including equipment, labor, and materials, indirect
costs, and fuel inventory, which contributes approximately $7,000/MW-year to the CONE for
the CT and $2,500/MW-year for the CC (in 2022 dollars).
We maintained our assumption that CCs in SWMAAC will obtain firm gas contractions based on
the recent experience of new CCs in this area.48 Both of the CCs recently developed in
SWMAAC have entered into long-term firm transportation service contracts to obtain gas on the
46 Eastern Interconnection Planning Collaborative, “Fuel Assurance: Dual Fuel Capability and Firm
Transportation Alternatives,” accessed September, 2017,
http://nebula.wsimg.com/ef3ad4a531dd905b97af83ad78fd8ba7?AccessKeyId=E28DFA42F06A3AC213
03&disposition=0&alloworigin=1
47 We recommended in the 2014 PJM CONE Study dual-fuel capabilities in all CONE Areas except Rest
of RTO. PJM chose to adopt CONE values that incorporated dual-fuel capabilities.
48 We do not assume firm transportation for the reference CT plant since firm gas is unlikely to be
economic for a plant that operates at a low capacity factor. We assume the CT will have dual-fuel
capability.

21|brattle.com
Dominion Cove Point (DCP) pipeline.49 The costs of firm transportation service are incurred
annually so we include these costs as fixed operations and maintenance costs in the following
section. Firm transportation itself costs about twice as much as installing dual-fuel capability.
IV. Plant Capital Cost Estimates
Plant capital costs are those costs incurred when constructing the power plant before the
commercial online date. Power plant developers typically hire an engineering, procurement, and
construction (EPC) company to complete construction and to ensure the plant operates properly.
EPC costs include major equipment, labor, and materials, and non-EPC or owner’s costs include
development costs, startup costs, interconnection costs, and inventories.
All equipment and material costs are initially estimated by S&L in 2017 dollars using S&L
proprietary data, vendor catalogs, or publications. Both labor rates and materials costs have been
estimated for the specific counties chosen as representative of each CONE Area. Estimates for
the number of labor hours and quantities of material and equipment needed to construct simple-
and combined-cycle plants are based on S&L experience on similarly sized and configured
facilities and are explained in further detail in Appendix B.
Based on the monthly construction drawdown schedule, we estimate the overnight capital cost
in 2022 dollars by escalating the 2017 cost data using reasonable escalation rates. The 2022
“installed cost” is the present value of the construction period cash flows as of the end of the
construction period and is calculated using the monthly drawdown schedule and the cost of
capital for the project.
A. PLANT CAPITAL COST SUMMARY
Based on the technical specifications for the reference CT and CC described above, the total
capital costs for plants with an online date of June 1, 2022 are shown in Table 9 and Table 10
below. The methodology and assumptions for developing the capital cost line items are
described further below.
49 153 F.E.R.C. ¶ 61,074 (Issued October 20, 2015).

22|brattle.com
Table 9: Plant Capital Costs for CT Reference Resource in Nominal $ for 2022 Online Date
CONE Area CONE Area1 2 3 4
EMAAC SWMAAC Rest of RTO WMAAC
Capital Costs (in $millions) 352 MW 355 MW 321 MW 344 MW
Owner Furnished Equipment
Gas Turbines $74.4 $74.4 $74.4 $74.4
SCR $26.6 $26.6 $0.0 $26.6
Sales Tax $6.7 $6.1 $4.7 $6.4
Total Owner Furnished Equipment $107.7 $107.1 $79.1 $107.4
EPC Costs
Equipment
Other Equipment $25.7 $25.6 $28.5 $25.7
Construction Labor $43.5 $31.8 $31.0 $37.6
Other Labor $16.5 $15.3 $12.9 $16.0
Materials $6.6 $6.5 $6.5 $6.6
Sales Tax $2.1 $1.9 $2.2 $2.0
EPC Contractor Fee $20.2 $18.8 $16.0 $19.5
EPC Contingency $22.2 $20.7 $17.6 $21.5
Total EPC Costs $136.8 $120.5 $114.8 $128.9
Non-EPC Costs
Project Development $12.2 $11.4 $9.7 $11.8
Mobilization and Start-Up $2.4 $2.3 $1.9 $2.4
Net Start-Up Fuel Costs $2.6 $1.7 $0.2 $0.6
Electrical Interconnection $7.8 $7.8 $7.1 $7.6
Gas Interconnection $29.1 $29.1 $29.1 $29.1
Land $0.4 $0.7 $0.3 $0.5
Fuel Inventories $3.0 $3.0 $2.7 $2.9
Non-Fuel Inventories $1.2 $1.1 $1.0 $1.2
Owner's Contingency $4.7 $4.6 $4.2 $4.5
Financing Fees $8.0 $7.5 $6.5 $7.7
Total Non-EPC Costs $71.4 $69.2 $62.6 $68.3
Total Capital Costs $316.0 $296.8 $256.5 $304.7
Overnight Capital Costs ($million) $316 $297 $257 $305
Overnight Capital Costs ($/kW) $898 $836 $799 $886
Installed Cost ($/kW) $938 $874 $835 $925

23|brattle.com
Table 10: Plant Capital Costs for CC Reference Resource in Nominal $ for 2022 Online Date
CONE Area1 2 3 4
EMAAC SWMAAC Rest of RTO WMAAC
Capital Costs (in $millions) 1152 MW 1160 MW 1138 MW 1126 MW
Owner Furnished Equipment
Gas Turbines $173.2 $167.5 $173.2 $173.2
HRSG / SCR $55.4 $53.6 $55.4 $55.4
Sales Tax $15.1 $13.3 $14.5 $14.5
Total Owner Furnished Equipment $243.8 $234.4 $243.1 $243.1
EPC Costs
Equipment
Condenser $5.8 $5.8 $5.8 $5.8
Steam Turbines $47.1 $45.5 $47.1 $47.1
Other Equipment $74.7 $72.1 $74.7 $74.7
Construction Labor $211.1 $159.3 $167.4 $187.2
Other Labor $56.5 $50.6 $52.5 $54.3
Materials $51.5 $51.2 $51.5 $51.5
Sales Tax $11.9 $10.5 $11.4 $11.4
EPC Contractor Fee $70.2 $62.9 $65.3 $67.5
EPC Contingency $77.3 $69.2 $71.9 $74.3
Total EPC Costs $606.1 $527.3 $547.6 $573.7
Non-EPC Costs
Project Development $42.5 $38.1 $39.5 $40.8
Mobilization and Start-Up $8.5 $7.6 $7.9 $8.2
Net Start-Up Fuel Costs $0.8 -$5.5 -$10.5 -$7.2
Electrical Interconnection $25.5 $25.6 $25.2 $24.9
Gas Interconnection $29.1 $29.1 $29.1 $29.1
Land $1.5 $2.7 $1.0 $2.0
Fuel Inventories $6.9 $0.0 $6.8 $6.7
Non-Fuel Inventories $4.2 $3.8 $4.0 $4.1
Owner's Contingency $9.5 $8.1 $8.2 $8.7
Emission Reduction Credit $2.2 $2.2 $2.2 $2.2
Financing Fees $25.5 $22.7 $23.5 $24.3
Total Non-EPC Costs $156.1 $134.4 $136.9 $143.9
Total Capital Costs $1,006.0 $896.1 $927.6 $960.7
Overnight Capital Costs ($million) $1,006 $896 $928 $961
Overnight Capital Costs ($/kW) $873 $772 $815 $853
Installed Cost ($/kW) $951 $841 $887 $929

24|brattle.com
B. PLANT PROPER CAPITAL COSTS
1. Plant Developer and Contractor Arrangements
Costs that are typically within the scope of an EPC contract include the major equipment (gas
turbines, heat recovery steam generator (HRSG), condenser, and steam turbine), other
equipment, construction and other labor, materials, sales tax, contractor’s fee, and contractor’s
contingency.
The contracting scheme for procuring professional EPC services in the U.S. is typically
implemented with a single contractor at a single, fixed, lump-sum price. A single contract
reduces the owner’s responsibility with construction coordination and reduces the potential for
missed or duplicated scope compared to multiple contract schemes. The estimates and contractor
fees herein reflect this contracting scheme.
2. Equipment and Sales Tax
“Major equipment” includes costs associated with the gas turbines, HRSG, SCR, condenser, and
steam turbines, where applicable. Note that the gas turbines for the CC cost more per turbine
than for the CT because the manufacturer includes additional valves, gas pre-treatment, and
other components that are required for CC operation.
The major equipment includes “owner-furnished equipment” (OFE) purchased by the owner
through the EPC. OFE costs include EPC handling costs contingency on logistics, installation,
delivery, etc., with no EPC profit markup on the major equipment cost itself. “Other equipment”
includes inside-the-fence equipment required for interconnection and other miscellaneous
equipment and associated freight costs. Equipment costs, including the combustion turbine
costs, are based on S&L’s proprietary database and continuous interaction with clients and
vendors regarding equipment costs and budget estimates. A sales tax rate specific to each CONE
Area is applied to the sum of major equipment and other equipment to account for the sales tax
on all equipment.50
3. Labor and Materials
Labor consists of “construction labor” associated with the EPC scope of work and “other labor,”
which includes engineering, procurement, project services, construction management, field
engineering, start-up, and commissioning services. “Materials” include all construction materials
associated with the EPC scope of work, material freight costs, and consumables during
construction.
50 See the sales tax listed in Table 21 below.

25|brattle.com
Similar to the 2014 PJM CONE Study, the labor rates in this analysis do not reflect a specific
assumption of whether union or non-union labor is utilized. Instead, the labor rates have been
developed by S&L through a survey of the prevalent wages in each region in 2017, including
both union and non-union labor. The labor costs are based on average labor rates weighted by
the combination of trades required for each plant type. We provide a more detailed discussion of
the inputs into the labor cost estimates in Appendix B.
The balance of plant EPC equipment and material costs were estimated using S&L proprietary
data, vendor catalogs, and publications. The balance of plant equipment consists of all pumps,
fans, tanks, skids, and commodities required for operation of the plant. Estimates for the
quantity of material and equipment needed to construct simple- and combined-cycle plants are
based on S&L experience on similarly sized and configured facilities.
4. EPC Contractor Fee and Contingency
The “EPC Contractor’s fee” is added compensation and profit paid to an EPC contractor for
coordination of engineering, procurement, project services, construction management, field
engineering, and startup and commissioning. This fee is applied to the Owner Furnished
Equipment to account for the EPC costs associated with the tasks listed above once the
equipment is turned over by the Owner to the EPC contractor. Capital cost estimates include an
EPC contractor fee of 10% of total EPC and OFE costs for CT and CC facilities based on S&L’s
proprietary project cost database. This value is lower than the 12% assumed in the 2014 PJM
CONE Study for the CC facilities based on recent project history and current market trends.
“Contingency” covers undefined variables in both scope definition and pricing that are
encountered during project implementation. Examples include nominal adjustments to material
quantities in accordance with the final design; items clearly required by the initial design
parameters that were overlooked in the original estimate detail; and pricing fluctuations for
materials and equipment. Our capital cost estimates include an EPC contingency of 10% of total
EPC and OFE costs, similar to the EPC contractor fee.
The overall contingency rate in this analysis (including the Owner’s Contingency presented in
the next section) is 9.3% to 9.5% of the pre-contingency overnight capital costs, slightly lower
than the 9.6% in the 2014 Study due to lower Owner’s Contingency, as explained below.
C. OWNER’S CAPITAL COSTS
“Owner’s capital costs” include all other capital costs not expected to be included in the EPC
contract, including development costs, legal fees, gas and electric interconnections, and
inventories.

26|brattle.com
1. Project Development and Mobilization and Startup
Project development costs include items such as development costs, oversight, and legal fees that
are required prior to and generally through the early stages of plant construction. We assume
project development costs are 5% of the total EPC costs, based on S&L’s review of similar projects
for which it has detailed information on actual owner’s costs.
Mobilization and startup costs include those costs incurred by the owner of the plant towards the
completion of the plant and during the initial operation and testing prior to operation, including
the training, commissioning, and testing by the staff that will operate the plant going forward.
We assume mobilization and startup costs are 1% of the total EPC costs, based on S&L’s review of
similar projects for which it has detailed information on actual owner’s costs.
2. Net Startup Fuel Costs
Before commencing full commercial operations, new generation plants must undergo testing to
ensure the plant is functioning and producing power correctly. This occurs in the months before
the online date and involves testing the turbine generators on natural gas and ultra-lower sulfur
diesel (ULSD) if dual-fuel capability is specified. S&L estimated the fuel consumption and energy
production during testing for each plant type based on typical schedule durations and testing
protocols for plant startup and commissioning, as observed for actual projects. A plant will pay
for the natural gas and fuel oil consumption, and will receive revenues for its energy production.
We provide additional detail on the calculation of the net startup fuel costs in Appendix B.
3. Emission Reduction Credits
Emission Reduction Credits (ERCs) must be obtained for new facilities located in non-attainment
areas. ERCs may be required for projects located in the ozone transport region even if the
specific location is in an area classified as attainment. ERCs must be obtained prior to the start of
operation of the unit and are typically valid for the life of the project; thus, ERC costs are
considered to be a one-time expense. ERCs are determined based on the annual NOx and
volatile organic compounds (VOC) emissions of the facility and offset ratio which is dependent
on the specific plant location. In the 2014 PJM CONE Study the cost was small enough to be
absorbed by the project development costs. Due to the large capacity of the units in the current
study this assumption is no longer valid and the ERCs are included as a separate capital cost.
ERCs are priced on a dollar per ton basis and are dependent on market conditions. Based on our
research we have assumed a cost of $5,000/ton and an offset ratio of 1.15 for NOx and VOC
emissions, resulting in a one-time cost of $2 million (in 2017 dollars) prior to beginning
operation of the CC plants. CT plants are not required to purchase ERCs because they are not
projected to exceed the NSR threshold.

27|brattle.com
4. Gas and Electric Interconnection
We estimated gas interconnection costs based on cost data for gas lateral projects similar to the
interconnection of a greenfield plant. We assume the gas interconnection will require a
metering station and a five-mile lateral connection, similar to 2014 PJM CONE Study. From the
data summarized in Appendix B, we estimate that gas interconnection costs for both the CT and
CC will be $26.2 million (in 2017 dollars) based on $4.6 million/mile and $3.4 million for a
metering station. Similar to the 2011 and 2014 CONE studies, we found no relationship between
pipeline width and per-mile costs in the project cost data.
We estimated electric interconnection costs based on historic electric interconnection cost data
provided by PJM. Electric interconnection costs consist of two categories: direct connection
costs and network upgrade costs. Direct connection costs will be incurred by any new project
connecting to the network and includes all necessary interconnection equipment such as
generator lead and substation upgrades. Network upgrade costs may be incurred when
improvements, such as replacing substation transformers, are required. Using recent project data
provided by PJM with the online service year between 2014 and 2017, we selected 12 projects
(8,326 MW of total capacity) that are representative of interconnection costs for a new gas CT or
CC and calculated a capacity-weighted average electrical interconnection cost of $19.9/kW (in
2017 dollars) for these projects, 33% lower than the 2014 CONE Study. The estimated electric
interconnection costs are approximately $7 million for CTs and $23 million for CCs (in 2017
dollars). Appendix B presents additional details on the calculation of electric interconnection
costs.
5. Land
We estimated the cost of land by reviewing current asking prices for vacant industrial land
greater than 10 acres for sale in each selected county. A summary of the land costs are available
in Appendix B. Table 11 shows the resulting land prices we assumed for each CONE Area and
the final estimated cost for the land in each location. We assume that 10 acres of land are needed
for CT and 40 acres for CC.
Table 11: Cost of Land Purchased
Sources and notes:
We assume land is bought in 2018, i.e., 6 months to 1 year before the start of construction.
Land Plot Size Cost
CONE Area Price Gas CT Gas CC Gas CT Gas CC
($/acre) (acres) (acres) ($m) ($m)
1 EMAAC $36,300 10 40 $0.36 $1.45
2 SWMAAC $66,700 10 40 $0.67 $2.67
3 RTO $26,200 10 40 $0.26 $1.05
4 WMAAC $51,100 10 40 $0.51 $2.04

28|brattle.com
6. Fuel and Non-Fuel Inventories
Non-fuel inventories refer to the initial inventories of consumables and spare parts that are
normally capitalized. We assume non-fuel working capital is 0.5% of EPC costs based on S&L’s
review of similar projects for which it has detailed information on actual owner’s costs.
We calculated the cost of the fuel inventory in areas with dual-fuel capability assuming a three
day supply of ULSD fuel will be purchased prior to operation at a cost of $1.77/gallon, or
$12.63/MMBtu (in 2022 dollars), based on current futures prices.51
7. Owner’s Contingency
Owner’s contingencies are needed to account for various unknown costs that are expected to
arise due to a lack of complete project definition and engineering. Examples include permitting
complications, greater than expected startup duration, etc. We assumed an owner’s contingency
of 8% of Owner’s Costs, which is lower than we assumed in previous reports (9% in the 2014
CONE Study) based on S&L’s review of the most recent projects for which it has detailed
information on actual owner’s costs.
8. Financing Fees
Financing fees are the cost of acquiring the debt financing, including associated financial
advisory and legal fees. Financing fees are considered part of the plant overnight costs, whereas
interest costs and equity costs during construction are part of the total capital investment cost, or
“installed costs” but not part of the overnight costs. We assume financing costs are 4% of the
EPC and non-EPC costs financed by debt, which is typical of recent projects based on S&L’s
review of similar projects for which it has detailed information on actual owner’s costs.52 As
explained below, the project is assumed to be 65% debt financed and 35% equity financed, an
increase from 60% debt financed in the 2014 CONE Study.
D. ESCALATION TO 2022 INSTALLED COSTS
S&L developed monthly capital drawdown schedules over the project development period for
each technology: 36 months for CCs and 20 months for CTs.53 We escalated the 2017 estimates
51 Futures prices calculated using NY Harbor USLD and Brent Crude Oil futures. Data from Bloomberg,
representing trade dates 07/31/2017 to 10/31/2017.
52 As discussed in the Financial Assumptions section, we assume the plant is financed through a 60%
debt and 40% equity capital structure.
53 For CTs, the construction drawdown schedule occurs over 20 months with 80% of the costs incurred
in the final 11 months prior to commercial operation. For CCs, the construction drawdown schedule
occurs over 36 months with 80% of the costs incurred in the final 20 months prior to commercial
operation.

29|brattle.com
of overnight capital cost components forward to the construction period for a June 2022 online
date using cost escalation rates particular to each cost category.
We estimated real escalation rates based on long-term (approximately 20-year) historical trends
relative to the general inflation rate for equipment and materials and labor. The real escalation
rate for each cost category was then added to the assumed inflation rate of 2.2% (see Section
VI.A) to determine the nominal escalation rates, as shown in Table 12.
Table 12: Capital Cost Escalation Rates
Sources and notes:
Escalation rates on equipment and materials costs are derived from the BLS Producer Price Index.
To reflect the timing of the costs a developer accrues during the construction period, we
escalated most of the capital cost line items from 2017 overnight costs using the monthly capital
drawdown schedule developed by Sargent & Lundy for an online date in June 2022.
However, we escalated several cost items in a different manner:
Land: assume land will be purchased 6 months to 1 year prior to the beginning of
construction; for a June 2022 online date, the land is thus assumed to be
purchased in late 2018 such that current estimates are escalated 1 year using the
long-term inflation rate of 2.2%.
Net Start-Up Fuel and Fuel Inventories: no escalation was needed as we forecasted
fuel and electricity prices in 2022 dollars.
Electric and Gas Interconnection: assume the construction of electric
interconnection occurs 7 months prior to project completion while gas
interconnection occurs 8 months prior to completion, consistent with the 2014
CONE Study; the interconnection costs have been escalated specifically to these
months.
Emission Reduction Credits: escalated to the online start date of June 2022 using
the long-term inflation rate of 2.2%.
We used the drawdown schedule to calculate debt and equity costs during construction to arrive
at a complete “installed cost.” The installed cost for each technology is calculated by first
applying the monthly construction drawdown schedule for the project to the 2022 overnight
capital cost and then finding the present value of the cash flows as of the end of the construction
period using the assumed cost of capital as the discount rate. By using the ATWACC to calculate
the present value, the installed costs will include both the interest during construction from the
debt-financed portion of the project and the cost of equity for the equity-financed portion.
Capital Cost Component Real Escalation Rate Nominal Escalation Rate
Equipment and Materials 0.20% 2.40%
Labor 1.70% 3.90%

30|brattle.com
V. Operation and Maintenance Costs
Once the plant enters commercial operation, the plant owners incur fixed O&M costs each year,
including property tax, insurance, labor, minor maintenance, and asset management. Annual
fixed O&M costs increase the CONE. Separately, we calculated variable O&M costs (including
maintenance, consumables, and waste disposal costs) to inform PJM’s future E&AS margin
calculations.
A. SUMMARY OF O&M COSTS
Table 13 and Table 14 summarize the fixed and variable O&M for plants with an online date of
June 1, 2022. In Appendix C, we provide alternative O&M cost estimates in which we include
major maintenance costs as fixed O&M.
Table 13: O&M Costs for CT Reference Resource
CONE Area CONE Area1 2 3 4
O&M Costs EMAAC SWMAAC Rest of RTO WMAAC
352 MW 355 MW 321 MW 344 MW
Fixed O&M (2022$ million)
LTSA $0.3 $0.3 $0.3 $0.3
Labor $1.1 $1.2 $0.8 $0.9
Maintenance and Minor Repairs $0.5 $0.5 $0.5 $0.5
Administrative and General $0.2 $0.2 $0.2 $0.2
Asset Management $0.5 $0.6 $0.4 $0.4
Property Taxes $0.3 $4.1 $1.8 $0.3
Insurance $1.9 $1.8 $1.5 $1.8
Working Capital $0.04 $0.03 $0.03 $0.03
Total Fixed O&M (2022$ million) $4.8 $8.7 $5.6 $4.4
Levelized Fixed O&M (2022$/MW-yr) $13,600 $24,400 $17,300 $12,600
Variable O&M (2022$/MWh)
Consumables, Waste Disposal, Other VOM 1.10 1.10 0.95 1.10
Total Variable O&M (2022$/MWh) 1.10 1.10 0.95 1.10
Major Maintenance - Starts Based
($/factored start, per turbine) 23,464 23,464 23,464 23,464

31|brattle.com
Table 14: O&M Costs for CC Reference Resource
B. ANNUAL FIXED OPERATIONS AND MAINTENANCE COSTS
Fixed O&M costs include costs directly related to the turbine design (labor, materials, contract
services for routine O&M, and administrative and general costs) and other fixed operating costs
related to the location (site leasing costs, property taxes, and insurance).
1. Plant Operation and Maintenance
We estimated the labor, maintenance and minor repairs, and general and administrative costs
based on a variety of sources, including S&L’s proprietary database on actual projects, vendor
publications for equipment maintenance, and data from the Bureau of Labor Statistics.
Major maintenance is assumed to be completed through a long-term service agreement (LTSA)
with the original equipment manufacturer that specifies when to complete the maintenance
based on either fired-hours or starts. Each major maintenance cycle for a combustion turbine
typically includes regular combustion inspections, periodic hot gas path inspections, and one
major overhaul. We include the costs of long-term maintenance as variable O&M and monthly
LTSA payments as fixed O&M.
Consistent with past CONE studies, we assume major maintenance and overhaul costs often
specified in an LTSA are included as variable O&M costs. Separately, in Appendix C, we present
alternative O&M costs and CONE values corresponding to PJM’s current cost guidelines, which
CONE Area1 2 3 4
O&M Costs EMAAC SWMAAC Rest of RTO WMAAC
1152 MW 1160 MW 1138 MW 1126 MW
Fixed O&M (2022$ million)
LTSA $0.5 $0.5 $0.5 $0.5
Labor $5.8 $6.3 $4.4 $4.6
Maintenance and Minor Repairs $5.9 $6.1 $5.4 $5.5
Administrative and General $1.3 $1.4 $1.1 $1.2
Asset Management $1.6 $1.7 $1.2 $1.3
Property Taxes $2.0 $12.3 $7.1 $1.9
Insurance $6.0 $5.4 $5.6 $5.8
Firm Gas Contract $0.0 $9.7 $0.0 $0.0
Working Capital $0.1 $0.1 $0.1 $0.1
Total Fixed O&M (2022$ million) $23.3 $43.5 $25.4 $20.9
Levelized Fixed O&M (2022$/MW-yr) $20,200 $37,500 $22,300 $18,600
Variable O&M (2022$/MWh)
Major Maintenance - Hours Based 1.44 1.44 1.44 1.44
Consumables, Waste Disposal, Other VOM 0.67 0.67 0.67 0.67
Total Variable O&M (2022$/MWh) 2.11 2.11 2.11 2.11

32|brattle.com
specify that major maintenance costs cannot be considered to be variable costs in cost-based
energy offers.54 We include the alternative cost and CONE estimates in the appendix because it
differs from past CONE studies (so is harder to compare) and might not turn out to be
appropriate if PJM’s cost guidelines change. Indeed, PJM stakeholders’ Markets Implementation
Committee is addressing whether the PJM cost guidelines should be modified to allow major
maintenance costs to be included in variable O&M costs.
2. Insurance and Asset Management Costs
We calculated insurance costs as 0.6% of the overnight capital cost per year, based on a sample of
independent power projects recently under development in the Northeastern U.S. and
discussions with a project developer. This value is consistent with the 2014 PJM CONE Study.
We estimated the asset management costs from typical costs incurred for fuel procurement,
power marketing, energy management, and related services from a sample of CT and CC plants
in operation.
3. Property Tax
To estimate property tax, we researched tax regulations for the locations selected in each CONE
Area, averaging the tax rates in the areas that include multiple states. We estimated the property
taxes through bottom-up cost estimates that separately evaluated taxes on real property
(including land and structural improvements) and personal property (the remainder of the plant)
in each location. In this study, we did not incorporate any assumed Payment in Lieu of Taxes
(PILOT) agreements. Although PILOT agreements could be executed between an individual
plant developer and a county, these agreements are individually negotiated and may not be
available on a similar basis for all plants.
Real property is taxed in all states containing reference plant locations we selected for the CONE
Area. Personal property is taxed only in SWMAAC (Maryland) and Rest of RTO (Ohio). For
power plants, the value of personal property tends to be much higher than the value of real
property, since equipment costs make up the majority of the total capital cost. For this reason,
property taxes for plants located in states that impose taxes on personal property will be
significantly higher than plants located in states that do not.
To estimate real property taxes, we assumed the assessed value of land and structural
improvements is the initial capital cost of these specific components. We determined assessment
ratios and tax rates for each CONE Area by reviewing the publicly-posted tax rates for several
counties within the specified locations and by contacting county and state tax assessors. (The tax
rates assumed for each CONE Area are summarized in Table 15 with additional details in
Appendix B.) We multiply the assessment ratio by the tax rate to determine the overall effective
54 PJM, PJM Manual 15: Cost Development Guidelines, pp. 15–29.

33|brattle.com
tax rate, and apply that rate to our estimate of assessed value. We assume that assessed value of
real property will escalate in future years with inflation.
Table 15: Property Tax Rate Estimates for Each CONE Area
Sources and notes:
See Appendix B for additional detail on inputs and sources.
Personal property taxes in the states of Maryland, Ohio, and Pennsylvania were estimated using a
similar approach. As with real property, we multiply the local tax rate by the assessment ratio to
determine the effective tax rate on assessed value. We assume that the initial assessed value of
the property is the plant’s total capital cost (exclusive of real property). The assessed value of
personal property is subject to depreciation in future years. For example, in Maryland, personal
property is subject to straight-line depreciation of 3.3% per year.
4. Working Capital
We estimated the cost of maintaining working capital requirements for the reference CT and CC
by first estimating the working capital requirements (calculated as accounts receivable minus
accounts payable) as a percent of gross profit for 3 merchant generation companies: NRG,
Calpine, and Dynegy. The weighted-average working capital requirement among these
companies is 4.2% of gross profits.55 Translated to the plant level, we estimate that the working
capital requirement is approximately 0.8% of overnight costs in the first operating year
(increasing with inflation thereafter). In the capital cost estimates, we do not include the
working capital requirements but instead the cost of maintaining the working capital
requirement based on the borrowing rate for short-term debt for BB rated companies 2.2%.56
55 Gross profits are revenues minus cost of goods sold, including variable and fixed O&M costs.
56 15-day average 3-month bond yield as of October 27, 2017, BFV USD Composite (BB), from
Bloomberg.
Real Property Tax Personal Property Tax
Effective Tax Rate Effective Tax Rate Depreciation
(%) (%) (%/yr)
1 EMAAC
New Jersey 3.7% n/a n/a
2 SWMAAC
Maryland 1.1% 1.4% 3.3%
3 RTO
Ohio 2.0% 1.4% See "SchC-NewProd (NG)" schedule
Pennsylvania 2.5% n/a n/a
4 WMAAC
Pennsylvania 3.5% n/a n/a

34|brattle.com
5. Firm Transportation Service Contract in SWMAAC
The gas pipeline serving the part of SWMAAC we identified for the reference plants is the
Dominion Cove Point (DCP) pipeline. We understand from shippers that they have had trouble
obtaining gas on the DCP pipeline. Availability of interruptible service has been unreliable and
inflexible with the pipeline being fully subscribed and unable to absorb substantial swings in
usage within a day. To at least partially address this problem, we assume new CC plants will
contract for firm transportation service on DCP. We assume that the new CT will not acquire
firm service due to the relatively few hours such a plant is expected to operate.
To estimate the costs of acquiring firm transportation service on the DCP pipeline for a plant
coming online in 2022, we assume the same transportation reservation rate on DCP as that filed
for the St. Charles and Keys projects. The rates for St. Charles and Keys are $3.7417 and $5.4278
per dekatherm respectively for 2017 (St. Charles) and 2018 (Keys).57 We then escalate to 2022
dollars, resulting in rates of $4.21 and $5.97 per dekatherm,58 resulting in a $9.7 million annual
cost, adding $9,800/MW-year to the CONE for CCs in SWMAAC. We provide additional detail
on the cost calculation of acquiring firm transportation service in Appendix B.
C. VARIABLE OPERATION AND MAINTENANCE COSTS
Variable O&M costs are not used in calculating CONE, but they inform the E&AS revenue offset
calculations performed annually by PJM. Variable O&M costs are directly proportional to plant
generating output, such as SCR catalyst and ammonia, CO oxidation catalyst, water, and other
chemicals and consumables. As discussed above, we assume that the costs related to major
maintenance that are often specified in an LTSA are considered variable O&M costs, consistent
with past CONE studies. We provide alternative O&M costs and CONE estimates with these
costs considered to be fixed O&M costs in Appendix C.
D. ESCALATION TO 2022 COSTS
We escalated the components of the O&M cost estimates from 2017 to 2022 on the basis of cost
escalation indices particular to each cost category. The same real escalation rates used to escalate
the overnight capital costs in the previous section (see Table 12) have been used to escalate the
O&M costs. The assumed real escalation rate for labor is 1.7% per year, while those for other
O&M costs are 0.2% per year.
57 153 F.E.R.C. ¶ 61,074 (Issued October 20, 2015).
58 This does not include variable charges, which should not be included in CONE but should be
accounted for in estimating energy margins to calculate Net CONE.

35|brattle.com
VI. Financial Assumptions
A. COST OF CAPITAL
An appropriate discount rate is needed for translating uncertain future cash flows into present
values and deriving the CONE value that makes the project net present value (NPV) zero. It is
standard practice to discount future all-equity cash flows (i.e., without deducted interest
payments) using an after-tax weighted-average cost of capital (ATWACC).59 Consistent with our
approach in previous CONE studies, we developed our recommended cost of capital by an
independent estimation of the ATWACC for publicly-traded merchant generation companies or
independent power producers (IPPs), supplemented by additional market evidence from recent
merger and acquisition transactions, and a final adjustment for the recent changes in corporate
taxes.60 Based on the empirical analysis completed in November 2017 under the then 35%
federal tax rate,61 we would have recommended 7.0% as the appropriate ATWACC to set the
CONE price for a new merchant plant that will commence operation by 2022 (4.5 years from
now assuming a mid-year commercial operation). Consistent with this ATWACC determination
under the 35% federal tax rate regime, we would have recommended the following specific
components for a new merchant plant: a capital structure of 65/35 debt-equity ratio, cost of debt
6.5% and return on equity (ROE) of 12.8%.62
After we completed the initial analysis in early November of 2017 for the 35% corporate tax
rates, the U.S. Congress passed the Tax Cuts and Jobs Act. These changes in the tax system raise
an immediate question: what is the impact of the tax law changes on cost of capital? For
example, the cut in the federal corporate income tax rate reduces the tax advantage of debt
relative to equity, which could lead to a higher equity ratio and, combined with a higher after-
tax cost of debt, a higher ATWACC. But, the law changes are more fundamental and involve
59 The “after-tax weighted-average cost of capital” (ATWACC) is so-named because it accounts for both
the cost of equity and the cost of debt, net of the tax deductibility of interest payments on debt, with
the weights corresponding to the debt-equity ratio in the capital structure. Cash flows to which the
ATWACC is applied must include revenues, costs, and taxes on income net of depreciation (but not
accounting for interest payments or their deductibility, since that is incorporated into the ATWACC
itself).
60 Supplementing our ATWACC analysis with estimates from other financial analysts is valuable as
others’ methodologies may account for market risks and estimation uncertainties differently from
ours.
61 We choose November 2017 as the cutoff date so that we can obtain the latest quarterly financial
reports by the sample companies. Annual 2017 financial reports for SEC-registered companies will
not be filed until March 2018.
62 6.5% × 65% × (1 − 40.5%) + 12.8% × 35% = 7.0%. The tax rate of 40.5% is a combined federal-state tax
rate, where state taxes are deductible for federal taxes (= 8.5% + (1 − 8.5%) × 35%). Note that the
ATWACC applied to the four CONE Areas varies very slightly with applicable state income tax rates,
as discussed in the following section.

36|brattle.com
more than a cut in the federal corporate tax rate. Other major changes include the transition
from a worldwide tax system to a territorial tax system and immediate expensing of qualified
investments. Ultimately, estimating the cost of capital is an empirical matter to be based on the
market data. Because of the fundamental changes introduced in the new tax law and near-term
uncertainties around its interpretations and implementations, it will take time for companies and
individuals to adjust investment/consumption and financing decisions and for the impacts on the
cost of capital to be observable and estimable.
Since we need to recommend the CONE value for a reference resource before these uncertainties
are fully resolved, we have to predict the likely impact of the new tax law on merchant generator
cost of capital without a substantial body of empirical data. We thus focus our analysis on what
changes in the companies’ capital structure (equity and debt ratios), if any, would likely result
from the most prominent change in the new law—the reduction in federal corporate income tax
from 35% to 21%. This is a critical first step, as an investment’s cost of equity and cost of debt
depend on its capital structure.63 Our review of the recent economic literature, both theoretical
and empirical, regarding the tax impacts on capital structure suggest that the drop in federal
income tax rate is unlikely to have a material impact on the firms’ capital structure (see further
details below). Therefore, we recommend the same cost of capital components (cost of equity,
cost of debt (COD), and debt/equity ratios) that we have developed from the available empirical
information under the 35% federal tax rate. Under these assumptions, the reduction of the
federal tax rate to 21% reduces the debt tax shield and thus increases the ATWACC to 7.5%.64
As a point of reference, we summarize our two previous costs of capital recommendations under
the old 35% federal tax rate and the current 2018 recommendation in Table 16 under both the
35% and 21% tax rates. Historical comparison can be easily made in the first three rows of Table
16 (all under the same tax rate). In the 2014 PJM CONE Study, we recommended an ATWACC
of 8.0%.65 At a slightly higher equity ratio (60/40), the cost of debt and return on equity were set
at 7.0% and 13.8%, respectively. In 2011, we recommended a debt/equity ratio of 50/50, based
on the market-value capital structure at the time. In the last six years, the equity ratios have
declined, as the U.S. IPP industry continued its restructuring activities.
63 Conceptually, the ATWACC is relatively constant over a broad range of capital structure ratios. In
other words, tax deductibility of interest payments has a secondary if not negligent impact on cost of
capital.
64 Under the new tax law, state taxes are not deductible. The combined state and federal tax rate for
Maryland (SWMAAC) is then 21% + 8.25% = 29.25%. Thus, the ATWACC is estimated based on a
6.5% cost of debt, a 12.8% cost of equity, and a 35% equity ratio as follows: 6.5% × 65% × (1 − 29.25%)
+ 12.8% × 35% = 7.5%.
65 As discussed in our 2014 CONE report, our recommended 8.0% ATWACC was slightly above our
ATWACC estimate for individual IPPs (7.8% for Calpine and 6.1% for both Dynegy and NRG), but
within the range of cost of capital as suggested by the fairness opinions and analysts.

37|brattle.com
Table 16: Comparison of Cost of Capital Recommendations (2011–17 at 40.5% combined federal/state tax rate vs. 2018 at 29.5% combined tax rate)
The 2011–2018 reduction in ATWACC in our recommendations can be traced primarily to the
fall in the long-term risk-free interest rate between 2011 to November 2017, with a partially
offsetting increase from the lower tax rate.66 This can be seen in Figure 6, where the red circles
represent our ATWACC recommendations under the 35% federal tax rate, the red dot shows the
ATWACC recommendation as a result of the tax law change, and the teal line displays the
movement in risk-free rates. The risk premiums (ATWACC less risk-free rate) are shown in the
blue bars. Viewed from this perspective, the risk premium implied from our current ATWACC
recommendation is in line with the risk premiums implied in our 2011 and 2014
recommendations.67 The ATWACC recommended as a result of the tax law change uses the
same components (ROE, COD, and capital structure), except for the tax rate.
Figure 6: Comparison of Brattle Cost of Capital Recommendations for PJM
Sources and notes:
2011 and 2014 values based on previous PJM CONE studies.
66 20-year U.S. treasury yields increased slightly from November 2017 (about 2.6%) to mid-January 2018
(close to 2.8%).
67 In general, the fall in long-term risk-free rate caused ROE and Cost of Debt to fall, although the
reduction is not uniform: as the market-value debt ratio increases from 50% in 2011 to 60% in 2014,
our recommended ROE in 2014 increased relative to the 2011 recommendation.
Study
YearTax Rate Return on Equity Equity Ratio Cost of Debt Debt Ratio ATWACC
2011 40.5% 12.5% 50% 7.5% 50% 8.5%
2014 40.5% 13.8% 40% 7.0% 60% 8.0%
2018 40.5% 12.8% 35% 6.5% 65% 7.0%
2018 29.5% 12.8% 35% 6.5% 65% 7.5%

38|brattle.com
The rest of this discussion proceeds in four topics to further document our approach to
developing the recommended ATWACC. The first three are based on a 35% federal tax rate, as
the empirical data are all related to corporate behaviors under the prior tax regime. First, we
perform an independent cost of capital analysis for U.S.68 and Canadian IPPs.69 Second, we
present evidence on the discount rates disclosed in fairness opinions for two recent merger and
acquisition transactions involving U.S. IPPs.70 Third, we discuss how considerations of the
specific dynamics of PJM markets affect cost of capital recommendations. Finally, we discuss
how cost of capital is expected to change due to the reduction in federal tax rate.
ATWACC for Publicly Traded Companies: We calculated ATWACC estimates using the
following standard techniques with results summarized in Table 17 and charted with sensitivities
in Figure 7. While we primarily rely on the estimated ATWACC results for the U.S. IPPs, Table
17 shows that the ATWACC results for the Canadian IPPs are in the same range as for the U.S.
IPPs. For ease of presentation, Canadian IPP ATWACCs are not plotted in Figure 7.
Return on Equity: We estimate the required return on equity (ROE or cost of equity) using the
Capital Asset Pricing Model applied to samples of U.S. and Canadian merchant generation
companies. The ROE for each company is derived as the risk-free rate plus a risk premium given
by the expected risk premium of the overall market times the company’s “beta.”71 In Table 17,
we use a risk-free rate of 2.65%, a 15-day average of 20-year U.S. treasuries as of October 2017, as
our base case. We estimate the expected risk premium of the market to be 6.9% based on the
long-term average of values provided by Duff and Phelps.72 The “beta” describes each company
stock’s (five-year) historical correlation with the overall market, where the “market” is taken to
be the S&P 500 index. The resulting required return on equity ranges from 8.5 to 12.8% for the
sample companies included in the analysis. Because most of the sample companies will have
68 The financial characteristics of the sample companies vary on an individual basis. For example,
GenOn, a large subsidiary of NRG Energy filed for bankruptcy in June 2017 and will be restructured
as a standalone business. Calpine announced it will be acquired by a private investor consortium
while Dynegy will be acquired by Vistra Energy. We believe that these companies, each in differing
positions, still can provide useful reference points for estimating the cost of capital for a merchant
generator.
69 Since the U.S. IPP industry has been in the middle of restructuring and consolidation during the last
five years, we consider a sample of Canadian IPPs as additional comparable companies.
70 We do not include private equity investors in our sample because their cost of equity cannot be
observed in market data and private equity investment portfolios typically consist of investments in
many different projects in many different industries. Nor do we include electric utilities in cost-of-
service regulated businesses, as their businesses are mostly cost-of-service regulated with lower risks
and a lower cost of capital than merchant generation.
71 See, for example, Richard Brealey, Stewart C. Myers, and Franklin Allen (2011), Principles of Corporate Finance. New York: McGraw-Hill/Irwin (Chapter 8).
72 Duff and Phelps International Guide to Cost of Capital, 2017(arithmetic average of excess market
returns over 20-year risk-free rate from 1926 to 2016).

39|brattle.com
various proportion of their generation assets under long-term contracts (i.e., not operating on a
purely merchant basis), we look to the upper range of these results as a reasonable estimate for
the cost of equity of merchant generation investments in PJM.73
In addition to this baseline analysis under current market conditions, we consider the use of
forecasted risk-free rates applicable for three years to reflect the fact that the ATWACC will be
used to estimate offer prices of new merchant entrants that are supposed to start operation in
2022. The average 10-year Treasury yields of BlueChip’s 5 year forecast (2019 to 2023) is 3.5%.74
Adding a maturity premium (20-year bond yields over 10-year bond yields) of 0.54%, we
estimate the 20-year risk-free rate to be 4.04% and use this as a sensitivity to our baseline
ATWACC analysis, as shown in Figure 7 below (along with ATWACC benchmarks using fairness
opinions from recent transactions as discussed further below).
Cost of Debt: In our 2011 and 2014 analyses, we estimated the COD based on the average bond
yields corresponding to the unsecured senior credit ratings for each merchant generation
company (issuer ratings).75 The rating-based average yields, based on a sample of similarly-rated
long-term (10-plus years) corporate bonds, are generally more preferable than the company’s
actual COD, which could be more influenced by company- and issue-specific factors.76
However, company-specific CODs could carry real-time industry-wide credit information that
the typically static credit ratings for a broad swath of industries are slow to incorporate. This is
the case for the merchant generation corporations: the BB-based and B-based average yields for
the general corporate bonds have dropped by more than 1.5 percent since 2016 and U.S.-based
IPPs’ company-specific bond yields are consistently higher than the rating-based yields.
Therefore, in the current estimation (as shown in Table 17), we use the company-specific bond
yield as our baseline case. (The rating-based yields are shown as Sensitivities 1 and 3 in Figure
7.)
Debt/Equity Ratio: We estimated the five-year average debt/equity ratio for each merchant
generation company using data from Bloomberg as shown in Table 17.
73 Note that, because of the 3-year forward nature of the PJM capacity market and its sloping demand
curve, PJM merchant generation risks will be lower than the risk of merchant generation assets that
do not have the benefit of a PJM-style capacity market (e.g., as is the case in ERCOT and uncontracted
plants in CAISO).
74 Blue Chip Economic Indicators (2017), Blue Chip Economic Indicators, Top Analysts’ Forecasts of the U.S. Economic Outlook for the Year Ahead, New York: Aspen Publishers, October 2017.
75 In Standard and Poor’s (S&P) credit ratings, a company receives a higher rating based on its ability to
meet financial commitments.
76 These idiosyncratic factors include the issuers’ competitive positions within the industry, and the debt
issues’ seniority, callability, availability of collateral, etc. By construction, these factors tend to be
averaged out in the ratings-based CODs. For example, the sample companies’ credit ratings range
from “BBB,” with an associated COD of 3.5% to “B+,” with an associated 5.0% COD. Using company-
specific CODs, the range increases to 4.2–7.3%.

40|brattle.com
Table 17: Baseline ATWACC for the Publicly Traded Merchant Generation Companies (35% Federal Tax Rate)
Figure 7 reports the ATWACC for the U.S. merchant sample (NRG, Calpine, and Dynegy) under
alternative assumptions for the COD and risk-free rate, along with the discount rates used in
fairness opinions (discussed below) as additional reference points:
Baseline Case uses the inputs and results shown in Table 17 above.
Sensitivity 1 uses the ratings-based COD, as used in previous PJM CONE studies.
Sensitivity 2 uses the forecasted risk-free rate.
Sensitivity 3 uses both the ratings-based COD and the forecasted risk-free rate.
Fairness Opinions are from recent transactions (as discussed below).
As of November 2017, the federal tax rate was 35%. For the Base Case and each sensitivity (the
first columns in Table 17), the red marks represent each of three U.S. IPPs’ ATWACCs. For
example, under Sensitivity 1, the ATWACCs (red marks) range approximately from 4.9% to
5.9%. Under the other two scenarios when the forecasted risk-free rate is used, the upper end of
the ATWACC approached 7.0% (Sensitivity 2) and 6.3% (Sensitivity 3).
Company Firm Value
S&P Credit
Rating
Equity
Beta
Return on
Equity
Cost of
Debt
Debt/ Equity
Ratio
After Tax
WACC
[1] [2] [3] [4] [5] [6] [7]
NRG Energy Inc $23,278 BB- 1.17 10.7% 5.8% 73/27 5.4%
Calpine Corp $16,586 B+ 1.06 10.0% 5.6% 63/37 5.8%
Dynegy Inc $9,903 B+ 1.25 11.3% 6.7% 66/34 6.5%
TransAlta Corp $4,020 BBB- 1.47 12.8% 6.3% 66/34 6.8%
Algonquin Power & Utilities Corp $7,676 BBB 0.84 8.5% 5.1% 46/54 6.0%
Northland Power Inc $9,003 BBB 0.92 9.0% 5.1% 58/42 5.6%
Capital Power Corp $3,723 BBB- 0.95 9.2% 3.9% 47/53 6.0%
Sources and Notes:
[1]: Market value of equity + Book value of debt, Bloomberg as of 11/1/2017
[2]: S&P Research Insight, Algonquin and Capital Power from SNL
[3]: Company-specific, Bloomberg as of 11/1/2017
[4]: Assumed risk-free rate (2.65%) + assumed market risk premium (6.90%) × [3]
[5]: Bloomberg as of 11/1/2017
[6]: Capital Structure calculated by Brattle using company 10-Ks and Bloomberg data
[7]: (% Debt) × [5] × (40.5% Combined state and federal tax rate; assumes 8.5% state tax rate) + (% Equity) × [4]

41|brattle.com
Figure 7: ATWACCs of U.S. IPPs and Discount Rates from Fairness Opinions (35% Federal Tax Rate)
Cost of Capital Benchmarks from Recent Fairness Opinions: Additional cost of capital reference
points shown on the right side of Figure 7 above come from publicly-available values used by
financial advisors and analysts in valuations associated with mergers and divestitures. While
there are no details provided on how these ranges were developed, these values still provide
useful reference points for estimating the cost of capital. For the current analysis, we found two
additional reference points to inform the recommended ATWACC. The discount rate range
disclosed in the June 2017 fairness opinion for the pending Calpine acquisition by Energy Capital
Partners is 5.75% to 6.25%.77 Another relevant reference point is the disclosed range of discount
rate used in the acquisition of Talen Energy by Riverstone Holdings of 6.7% to 7.3%, released in
December 2015.78 We include these values in the figure above to compare the estimated
ATWACC for publicly-traded companies under alternative assumptions for the risk-free rate and
COD.
Estimated ATWACC for Merchant Generators in PJM Markets (before consideration of lower
corporate tax rate): The appropriate ATWACC for the CONE study should reflect the systematic
financial market risks of a merchant generating project’s future cash flows from participating in
the PJM wholesale power market. As a pure merchant project in PJM, the risks would be larger
77 Definitive Proxy Statement, Schedule 14A, filed by Calpine Corporation with the SEC on November
14, 2017.
78 Preliminary Proxy Statement, Schedule 14A, filed by Talen Energy Corporation with SEC on July 1,
2016. Since December 2015 (the as-of date of the Talen discount rates), the 20-year risk-free rate has
stayed about the same level. In December 2015 the 20-year risk-free yield was 2.61%, while as of
10/31/2017 it is 2.65% according to Bloomberg.

42|brattle.com
than for the average portfolio of independent power producers that have some long-term
contracts in place.79 As we have done in previous studies, we make an upward adjustment
towards the upper end of the range from the comparable company results to reflect the relatively
higher risk of merchant operations. Based on the set of reference points shown in Table 17 and
Figure 7 above and the recognition of PJM merchant generation risk that exceeds the average
risk of the publicly-traded generation companies, we believe that, under the 35% federal tax rate,
a 7.0% ATWACC is the most reasonable estimate for the purpose of estimating CONE.80 Our
recommended 7.0% is above our own cost of capital estimates for the merchant companies and is
at the high end of the range of discount rates disclosed in the fairness opinions.
Reduction in Federal Corporate Income Tax Rate and Cost of Capital: After we completed the
above ATWACC analysis in early November 2017, the Tax Cuts and Jobs Act was passed in the
U.S. Congress on December 22, 2017. More than three decades after the Tax Reform Act of 1986,
the new tax law brings fundamental changes to the U.S. tax system including a substantial
reduction in the federal income tax rate, a transition from worldwide tax to territorial tax, and
immediate expensing of qualified investments. It is inevitable that businesses and individuals
will adjust their investment, consumption, and financing decisions as a result of these changes in
the tax code.81 Given the complexity of the new tax law, the interpretation and implementation
will not happen immediately, but take time to be fully incorporated in personal and corporate
decisions. Moreover, the behaviors of economic agents will change over time. All of these imply
that the impact of the new tax law on PJM merchant generating plants’ cost of capital beyond
2022 is complex and will not be fully known until several years from now.
Nonetheless, we need to develop the PJM CONE values now, well ahead of the time when the
impacts of the tax changes on project cost of capital can be measured empirically. ATWACC is a
key input to the CONE calculation. Since the estimation of ATWACC depends on investment’s
capital structure, and a firm’s COE and COD depend on the capital structure, we focus our
investigation on how the impact of the tax rate reduction may affect the capital structure of
investments. Conceptually, a decrease in the federal corporate income tax rate reduces the tax
advantage of debt relative to equity. One would thus expect investors to choose a higher equity
ratio under the lower tax rate. Combined with a higher after-tax cost of debt, ATWACC will
thus increase. Empirically, is this prediction correct, and if so, how much will the capital
structure adjust? To answer this question, we turn to the economic literature examining capital
79 This is not to say that the reference merchant project would not arrange some medium-term financial
hedging tools.
80 The weighted average cost of capital (WACC) without considering the tax advantage of debt payments
is 8.0%. We report this value because it is comparable to values reported in other recently released
CONE studies in ISO-NE and NYISO.
81 The new tax law lowers tax rates and elimination exception at the individual level. These too can
have an impact on the capital structure.
43|brattle.com
structure decisions in response to prior changes in tax rates as “natural experiments,”82 such as
the federal corporate income tax rate reduction in the 1986 tax act (from 46% in 1986 to 34% in
1988), and numerous corporate income tax changes (both increases and decreases) at the state
level.83
Researchers have made progress, both theoretically and empirically, in isolating the impact of tax
rate changes on capital structure from U.S. historical experience.84 The earliest research focused
on the impact of a single event, the Tax Reform Act of 1986, on capital structure. According to
the static “trade-off model” of capital structure, as illustrated in Figure 8, the optimal debt level is
the point at which the marginal benefit of the interest tax shield (the flat line) equals the
marginal cost of financial distress (the upward-sloping line).85 Under this theory, the federal
corporate tax rate reduction in the 1986 act should have led to a noticeable reduction in financial
leverage, shown as a parallel shift downward of the marginal benefit line and a reduction in the
optimal debt (D′<D).86 However, as reported by Gordon and MacKie-Mason (1990), “the actual
change in debt-to-value ratios has been substantially smaller than the models predict.”87 More
recent papers examine tax law changes over a much longer period. For example, Graham, Leary,
and Roberts (2015) investigate determinants of the century-long capital structure of U.S.
publicly-traded companies, and conclude “corporate taxes underwent 30 revisions over the past
century and increased from 10% to 52% between 1920 and 1950. Yet we find no significant
time-series relation between taxes and the margin between debt usage and common equity.”88
Similarly, DeAngelo and Roll (2015) present time series evidence on the capital structure of 24
82 These legislative decisions are quasi-experimental because they are largely out of the firms’ control.
Under these circumstances, researchers can more reliably infer the causal, instead of purely statistical,
impact of tax rate changes on capital structure.
83 The basic premise behind our ATWACC approach that cost of capital is largely constant over a large
range of capital structure is based on far larger empirical papers examining whether interest deduction
affects capital structure using the cross-sectional evidence of firms’ capital structure decisions. Tax
rates are constant across firms and years in this literature.
84 There are also collaborations using international evidence. We limit our review to the U.S.
85 See, e.g., Richard Brealey, Stewart C. Myers, and Franklin Allen (2011), Principles of Corporate Finance. New York: McGraw-Hill/Irwin (Chapter 18).
86 A complete analysis should incorporate the changes in personal taxes. In the case of 1986 tax act, the
combined impact is to increase the tax advantage of debt. See Roger H. Gordon, and Jefrrey MacKie-
Mason, 1990, “Effects of the Tax Reform Act on Corporate Financial Policy and Organization Form,”
NBER Working Paper No. 3222, at p. 7.
87 Ibid., at p. 2. Their theoretical model suggests a 15.5% increase in debt/value ratio, but the observed
increase was only 4.1% (at p. 16).
88 John R. Graham, Mark T. Leary, and Michael R. Roberts, 2015, “A Century of Capital Structure: The
Leveraging of Corporate America,” Journal of Financial Economics (118), 658–683.

44|brattle.com
Dow Jones Industrial Average (DJIA) companies over the last century.89 None of the changes in
capital structure are related to the tax reform act of 1986, and around 1986, DJIA companies’
capital structure moved in different directions.
The empirical research above assumes a linear relationship between tax rates and debt ratios.
Recent development in dynamic trade-off models,90 however, predicts an asymmetric non-linear
relationship: the debt ratios respond positively to tax rate increases, but do not react to tax rate
reductions. Intuitively, a rise in the tax rate will increase the tax benefit of financial leverage,
and incentivize the shareholders to borrow more. With a decrease in the tax rate, however,
reducing borrowing will lower shareholders’ option to default: this will benefit bond holders at
shareholders’ expense. Thus, shareholders have no incentive to reduce debt in the case of a tax
rate reduction (D′=D in Figure 8b).91 Heider and Ljungqvist (2015) confirm such an asymmetric
relationship.92 In their paper, the authors compile a large sample of 121 state-level tax rate
increases or decreases between 1989 and 2011. The large sample of tax rate changes in multiple
states over a long period of time allows the authors to design multiple empirical tests to confirm
that their finding of an asymmetric impact of tax rates is robust and statistically significant.
89 Harry DeAngelo, and Richard Roll, 2015, “How stable are corporate capital structures?,” Journal of Finance (70), 373-418.
90 See, e.g., Anat R. Admati, Peter M. DeMarzo, Martin F. Hellwig, Paul Pfleiderer, 2017, “The Leverage
Ratchet Effect,” forthcoming in Journal of Finance; and Christopher A. Hennessy, Akitada Kasahara,
and Ilya A. Strebulaev, 2016, “Corporate Finance Responses to Exogenous Tax Changes: What Is the
Null and Where Did It Come From?,” Stanford University Working paper.
91 For example, Admati, et al., op cit., at p. 1 state “Once debt is in place, shareholders will resist any
form of leverage reduction no matter how much the leverage reduction may increase total firm value.
At the same time, shareholders would generally choose to increase leverage even if any new debt must
be junior to existing debt. The resistance to leverage reductions, together with the desire to increase
leverage, creates asymmetric forces in leverage adjustments that we call the leverage ratchet effect.”
92 Florian Heider, and Alexander Ljungqvist, 2015, “As Certain as Debt and Taxes: Estimating the Tax
Sensitivity of Leverage from State Tax Changes,” Journal of Financial Economics (118), 684–712.

45|brattle.com
Figure 8: Illustrate Dynamic Trade-off of Tax Benefit and Cost (a) Static Trade-Off (b) Dynamic Trade-Off
This research suggests that a decrease in the federal tax rate will not have a material impact on
capital structure. As a result, we recommend retaining the components of ATWACC, i.e., ROE,
COD, and debt and equity ratios, based on our November 2017 analysis.93 Figure 9 presents both
the ATWACCs under the 35% and 21% federal tax rates. The blue marks represent ATWACCs
of the U.S. IPPs under the 21% tax rate. The marginal impact of a lower federal tax rate increases
cost of capital between 0.4% and 0.6%, which makes us increase the recommended ATWACC
from 7.0% to 7.5% to reflect the impact of the reduced corporate tax rate as shown by the blue
line in Figure 9.
93 We have verified that the sample companies’ beta (based on five-year’s historical data) and cost of
debt stay more or less constant since November 2017.

46|brattle.com
Figure 9: ATWACCs of U.S. IPPs and Discount Rates from Fairness Opinions (35% and 21% Federal Tax Rate)
B. OTHER FINANCIAL ASSUMPTIONS
Calculating CONE requires several other financial assumptions about general inflation rates, tax
rates, depreciation, bonus depreciation, and interest during construction.
Inflation rates affect our CONE estimates by forming the basis for projected increases in various
fixed O&M cost components over time. We calculated the 20-year inflation rate for four years
from now implied by the Cleveland Federal Reserve’s estimates of inflation of 2.2%.94 The most
forward looking forecast in the Blue Chip Economic Indicators report is 2.3%.95 Based on these
sources, we assumed for the CONE calculations an average long-term inflation rate of 2.2%.
Income tax rates affect both the cost of capital and cash flows in the financial model used to
calculate CONE. We calculated income tax rates based on current federal tax rates. We use a
marginal federal corporate income tax rate of 21% as explained in the previous section due to the
94 As stated on the Cleveland Federal Reserve website, the Cleveland Fed’s “inflation expectations model
uses Treasury yields, inflation data, inflation swaps, and survey-based measures of inflation
expectations to calculate the expected inflation rate (CPI) over the next 30 years.” Federal Reserve
Bank of Cleveland (2017), Cleveland Fed Estimates of Inflation Expectations, accessed November 11,
2017. Available at https://www.clevelandfed.org/our-research/indicators-and-data/inflation-
expectations.aspx.
95 Blue Chip Economic Indicators (2017), Blue Chip Economic Indicators, Top Analysts’ Forecasts of the U.S. Economic Outlook for the Year Ahead, New York: Aspen Publishers, October 2017. We used
the consensus ten-year average consumer price index (CPI) for all urban consumers.

47|brattle.com
passing of the Tax Cuts and Jobs Act. The state tax rates assumed for each CONE Area are shown
in Table 18.
Table 18: State Corporate Income Tax Rates
Sources and notes:
State tax rates retrieved from www.taxfoundation.org
We calculated depreciation for the 2022/23 CONE parameter based on the bonus depreciation
provisions of the 2017 Tax Cuts and Jobs Act. New units put in service before January 1, 2023
can apply 100% bonus depreciation in the first year of service, which decreases CT CONE on
average by $11,700/MW-year and CC CONE on average by $14,400/MW-year. The bonus
depreciation then phases out over five years, decreasing by 20% in each subsequent year such
that plants in service before January 1, 2024 can utilize 80% bonus depreciation. For calculating
depreciation for the 2023/24 auctions and later auctions, we apply the Modified Accelerated Cost
Recovery System (MACRS) of 20 years for a CC plant and 15 years for a CT plant to the
remaining depreciable costs (i.e., 80% bonus depreciation, 20% MACRS in 2023/24).96
To calculate the annual value of depreciation, the “depreciable costs” (different from the
overnight and installed costs referred to earlier in the report) for a new resource are the sum of
the depreciable overnight capital costs and the accumulated interest during construction (IDC).
Several capital cost line items are non-depreciable, including fuel inventories and working
capital, and have not been included in the depreciable costs. IDC is calculated based on the
assumption that the construction capital structure is the same as the overall project, i.e., 60%
debt and 7.0% COD.
96 Internal Revenue Service (2013), Publication 946, How to Depreciate Property, February 15, 2013.
Available at http://www.irs.gov/pub/irs-pdf/p946.pdf.
CONE Area Representative
State
Corporate Income
Tax Rate
Sales Tax
Rate
1 Eastern MAAC New Jersey 9.00% 6.63%
2 Southwest MAAC Maryland 8.25% 6.00%
3 Rest of RTO Pennsylvania 9.99% 6.34%
4 Western MAAC Pennsylvania 9.99% 6.34%

48|brattle.com
VII. CONE Estimates
Translating investment costs into annualized costs for the purpose of setting annual capacity
prices requires an assumption about how net revenues are received over time to recover capital
and annual fixed costs. “Level-nominal” cost recovery assumes that net revenues will be constant
in nominal terms (i.e., decreasing in real, inflation-adjusted dollar terms) over the 20-year
economic life of the plant. A “level-real” cost recovery path starts lower in the first year (by
about 16%) then increases at the rate of inflation (i.e., is constant in real dollar terms).97
While there is no perfect way to capture developers’ expectations for their future cost recovery
paths, we previously reviewed long-term trends in plant costs and efficiency to understand the
likely long-term drivers of new entry offers and whether a developer would expect that market
revenues would lead to a more front-loaded or more back-loaded recovery of investment costs.
This section of our report first re-visits the analysis of whether a level-nominal or level-real
annualization approach is more consistent with market data and then presents the summary of
CONE estimates by CONE Area.
A. LEVELIZATION APPROACH
In the 2011 PJM VRR Report, we analyzed the historical trends of turbine costs and heat rates to
inform the potential of the cost recovery path for a new gas-fired generation resource. We found
that over the previous 20 years combustion turbine costs increased on average by 0.6% per year
faster than inflation and that the average heat rates of new gas-fired CTs decreased by
approximately 100 Btu/kWh a year.98 Based on this analysis, we found it likely that the net
revenues for the marginal resources in the PJM capacity market would tend to increase
approximately with inflation over time. We consequently recommended that PJM adopt a level-real cost recovery for calculating CONE to reflect these findings. We maintained this
recommendation in the 2014 VRR Report.
Updating this analysis based on the latest data available we come to superficially similar results:
over the most recent 20-year period, the turbine cost indices that we relied on in 2011 escalated
on average at 0.9% per year faster than inflation and the heat rate of CTs decreased by
approximately 100 Btu/kWh on average. However, the turbine cost indices do not properly
account for the significant increase in net plant output for F-class turbines (+42% since 2010 as
discussed in Section II.B above) that have been installed in PJM most recently. Based on S&L
cost estimates for over the past 20 years, the costs of GE 7FA turbines have declined by 37% on a
per-kW basis since 2010, as shown by the red line in Figure 10 below. By comparison, the
97 Both cost recovery paths (level-real and level-nominal) are calculated such that the NPV of the project
is zero over the 20-year economic life.
98 See The Brattle Group “Cost of New Entry Estimates for Combustion-Turbine and Combined-Cycle
Plants in PJM,” August 24, 2011.

49|brattle.com
Producer Price Index (PPI) turbine cost index increased by 3% since 2010 (as shown by the solid
teal line). While the PPI Turbine index shows a similar trend over the first thirteen years as the
S&L estimates, the cost trends diverge once the net output of the F-class turbine starts increasing
around 2010. To account for this recent change in turbine output, we adjusted the PPI Turbine
index for the increases in plant capacity (shown as the dotted teal line) and observe that the
adjusted index follows a similar trend to the GE 7FA costs over this period.99 Our analysis shows
that the assumption that costs per kW will continue to escalate slightly faster than inflation in
the long-term may no longer apply. In fact, both the S&L GE 7FA cost per kW trend and the
capacity-size adjusted PPI Turbine Index show that 2017 turbine costs are only slightly more
expensive on a nominal $/kW basis than 20 years ago.
Figure 10: Gas Combustion Turbine Cost Trends since 1997
Sources and notes:
S&L cost estimates; BLS PPI Turbine & Turbine Generator Sets; Gas Turbine World.
Looking forward, there is no perfect way to project how cost trends will unfold and how gas-
fired units expect to recover their costs.100 In addition to the considerations analyzed above,
developers of new generation resources must consider that the gas generation technologies are
likely to continue to see periodic incremental improvements over time, similar to the downward
99 We would not expect the GE 7FA index and adjusted PPI turbine index to perfectly align as the PPI
includes a much wider range of turbine types. The BLS methodology for developing the PPIs
mentions that in most cases the indices include a “quality adjustment” to account for such changes in
product quality as seen here. However, this does not appear to be the case for the PPI turbine index
based on our attempt at benchmarking the index against historical cost estimates for GE 7FA turbines.
100 As stated in our 2014 VRR Curve report, “one could make a case for attempting to determine
projections of net revenues representing actual developers’ likely views on energy prices, fuel prices,
and capacity prices over the 20-year investment life. The entirety of this information is what
ultimately determined the ‘true’ value of CONE.” See 2014 VRR Curve Report, p. 11.

50|brattle.com
cost trend since 2010. Investors in new generating resources have to consider the possibility that
their future net revenues may erode as technological innovation and environmental policies
favor different types of technologies, such as renewable generation combined with storage.
Due to the lower escalation rate of gas turbine plants in $/kW terms than previously estimated
and the potential for similar cost-reductions to arrive periodically over the 20-year economic life
of new natural gas-fired generating plants, we recommend adopting the level-nominal approach
for setting the 2022/23 CONE value.
B. SUMMARY OF CONE ESTIMATES
Table 19 and Table 20 show summaries of our plant capital costs, annual fixed costs, and levelized
CONE estimates for the CT and CC reference plants for the 2022/23 delivery year. For
comparison, the tables include the most recent 2021/22 PJM administrative CONE parameters
escalated to a 2022/23 delivery year at 2.8% per year.
For the CT, the level-nominal CONE estimates range from $98,200/MW-year in the Rest of RTO
to a high of $108,400/MW-year in SWMAAC. The updated estimates are lower than the
previous parameters escalated to 2022/23 by 22–28% due to a decrease in capital costs and a
lower ATWACC offset. Capital costs are lower primarily due to the lower tax rates, the change
in turbine to the larger H-class turbine, and the change to a 1×0 configuration (reducing labor
and equipment and materials costs. In addition, the reduction in ATWACC from 8.0% to 7.5%
reduces CONE values by an average of 3.8%.

51|brattle.com
Table 19: Recommended CONE for CT Plants in 2022/2023
Sources and notes:
PJM 2021/22 parameters escalated to 2022/23 at 2.8% annually, based on S&L analysis of escalation rates for materials, turbine and labor costs.
CONE values expressed in 2022 dollars and ICAP terms.
The CT CONE estimates vary by CONE Area primarily due to differences in emissions controls
technologies (no SCR in the Rest of RTO), labor rates (highest in EMAAC), and property taxes
(highest in SWMAAC). The Rest of RTO is at the low end due to the change in specification for
the CT in this CONE Area that no longer includes an SCR. EMAAC CONE ($106,400/MW-year)
is closer in value to SWMAAC at the high end of the range despite significantly higher capital
costs, but lower annual property taxes. The WMAAC CONE is lower than EMAAC primarily
due to slightly lower labor costs.
For the CC, the level-nominal CONE estimates range from $109,800/MW-year in the Rest of
RTO to $120,200/MW-year in SWMAAC. The updated estimates are 40–41% lower than the
previous estimates escalated to 2022/23 primarily due to the economies of scale of the larger H-
class turbines and the lower tax rates. Similar to the CT, the decrease in ATWACC further
reduces the CONE by an additional 3.8%.
Simple Cycle Combined Cycle
EMAAC SWMAAC Rest of RTO WMAAC
Gross Costs
[1] Overnight $m $316 $297 $257 $305
[2] Installed (inc. IDC) $m $330 $310 $268 $318
[3] First Year FOM $m/yr $5 $9 $6 $4
[4] Net Summer ICAP MW 352 355 321 344
Unitized Costs
[5] Overnight $/kW = [1] / [4] $898 $836 $799 $886
[6] Installed (inc. IDC) $/kW = [2] / [4] $938 $874 $835 $925
[7] Levelized FOM $/kW-yr = [3] / [4] $16 $24 $18 $15
[8] After-Tax WACC % 7.4% 7.5% 7.4% 7.4%
[9] Effective Charge Rate % 10.1% 10.1% 10.0% 10.0%
[10] Levelized CONE $/MW-yr = [5] x [9] + [7] $106,400 $108,400 $98,200 $103,800
Prior Auction CONE
[11] PJM 2021/22 CONE $/MW-yr $133,144 $140,953 $133,016 $134,124
[12] Escalated to 2022/23 $/MW-yr = [11] x 1.028 $136,900 $144,900 $136,700 $137,900
Difference between Updated CONE and Escalated Prior Auction CONE
[13] Escalated to 2022/23 $/MW-yr = [10] - [12] ($30,400) ($36,500) ($38,600) ($34,000)
[14] Escalated to 2022/23 % = [13] / [12] -22% -25% -28% -25%

52|brattle.com
Table 20: Recommended CONE for CC Plants in 2022/2023
Sources and notes:
PJM 2021/22 parameters escalated to 2022/23 at 2.8% annually, based on S&L analysis of escalation rates for materials, turbine and labor costs.
CONE values expressed in 2022 dollars and ICAP terms.
Differences in the CC CONE estimates across the CONE Areas are primarily due to differences in
labor with the highest labor costs in EMAAC and lowest in Rest of RTO. Despite similar labor
costs in SWMAAC compared to Rest of RTO, the SWMAAC CONE is greater than EMAAC due
to its higher fixed O&M costs, as a result of higher property taxes, and the higher costs of the
firm gas contracts (assumed necessary in SWMAAC) compared to the combination of non-firm
gas contracts and dual fuel capability (assumed to be sufficient in EMAAC).
The updated CC CONE values have decreased significantly more over the prior estimates than
the CT CONE values have, leading to a narrower cost premium for CCs of $8,000–11,800/MW-
year compared to the $46,000–54,000/MW-year premium in the 2020/21 BRA parameters. The
most significant driver narrowing the difference between CT and CC CONE is economies of scale
with the very large CC based on the 7HA. While the capacity of the CCs plants has almost
doubled compared to that in the 2014 CONE Study, the cost of the gas turbines increased by
50%, and the cost of the steam section of the CC (including the heat recovery steam generator
and steam turbine) increased by only 30%. CT plants share the same economies of scale on the
combustion turbine itself, but not the greater economies of scale the CCs enjoy on their steam
Combined Cycle
EMAAC SWMAAC Rest of RTO WMAAC
Gross Costs
[1] Overnight $m $1,006 $896 $928 $961
[2] Installed (inc. IDC) $m $1,095 $976 $1,009 $1,046
[3] First Year FOM $m/yr $23 $43 $25 $21
[4] Net Summer ICAP MW 1,152 1,160 1,138 1,126
Unitized Costs
[5] Overnight $/kW = [1] / [4] $873 $772 $815 $853
[6] Installed (inc. IDC) $/kW = [2] / [4] $951 $841 $887 $929
[7] Levelized FOM $/kW-yr = [3] / [4] $24 $38 $24 $22
[8] After-Tax WACC % 7.4% 7.5% 7.4% 7.4%
[9] Effective Charge Rate % 10.6% 10.6% 10.5% 10.5%
[10] Levelized CONE $/MW-yr = [5] x [9] + [7] $116,000 $120,200 $109,800 $111,800
Prior Auction CONE
[11] PJM 2021/22 CONE $/MW-yr $186,807 $193,562 $178,958 $185,418
[12] Escalated to 2022/23 $/MW-yr = [11] x 1.028 $192,000 $199,000 $184,000 $190,600
Difference between Updated CONE and Escalated Prior Auction CONE
[13] Escalated to 2022/23 $/MW-yr = [10] - [12] ($76,000) ($78,800) ($74,200) ($78,800)
[14] Escalated to 2022/23 % = [13] / [12] -40% -40% -40% -41%

53|brattle.com
section or other balance of plant costs. In the Rest of RTO CONE Area, the lack of the SCR on
the CT results in an increased CC premium.

54|brattle.com
VIII. Annual CONE Updates
PJM’s tariff specifies that CONE will be escalated annually for each year between the CONE
studies during the RPM Quadrennial Review. The updates will account for changes in plant
capital costs based on a composite of Department of Commerce’s Bureau of Labor Statistic indices
for labor, turbines, and materials.
We recommend that PJM continue to update the CONE value prior to each auction using this
approach with slight adjustments to the index weightings based on the updated capital cost
estimates. As shown in Table 21 below, we recommend that PJM weight the components in the
CT composite index based on 20% labor, 55% materials (increased from 50%), and 25% turbine
(decreased from 30%). We recommend that PJM weight the CC components based on 30% labor
(increased from 25%), 50% materials (decreased from 60%), and 20% turbine (increased from
15%).
Table 21: CONE Annual Update Composite Index
Sources and notes:
Values may not add up to 100% due to rounding.
PJM will need to account for bonus depreciation declining by 20% in subsequent years starting
in 2023. We calculate that a reduction in the bonus depreciation by 20% increases the CT CONE
by 2.2% and the CC CONE by 2.5% due to the decreasing depreciation tax shield. We
recommend that after PJM has escalated CONE by the composite index, as noted above, PJM
account for the declining tax advantages of decreased bonus depreciation by applying an
additional gross up of 1.022 for CT and 1.025 for CCs.
Simple Cycle Combined CyclePJM Tariff
Composite Index
CONE Study Capital
Cost Weightings
Recommended
Composite Index
PJM Tariff
Composite Index
CONE Study Capital
Cost Weightings
Recommended
Composite Index
Labor 20% 22% 20% 25% 30% 30%Materials 50% 53% 55% 60% 52% 50%Turbines 30% 26% 25% 15% 18% 20%

55|brattle.com
List of Acronyms
ATWACC After-Tax Weighted-Average Cost of Capital
BACT Best Available Control Technology
BLS Bureau of Labor Statistics
BRA Base Residual Auction
Btu British Thermal Units
CAISO California Independent System Operator
CC Combined Cycle
CO Carbon Monoxide
COD Cost of Debt
CONE Cost of New Entry
CPI Consumer Price Index
CT Combustion Turbine
DCP Dominion Cove Point
DJIA Dow Jones Industrial Average
E&AS Energy and Ancillary Services
EIA Energy Information Administration
EMAAC Eastern Mid-Atlantic Area Council
EPC Engineering, Procurement, and Construction
FERC Federal Energy Regulatory Commission
HRSG Heat Recovery Steam Generator
ICAP Installed Capacity
IDC Interest During Construction
ISO Independent System Operator
ISO-NE ISO New England
kW Kilowatt
kWh Kilowatt-Hours
LDA Locational Deliverability Area
LAER Lowest Achievable Emissions Rate
LTSA Long-Term Service Agreement
m Million

56|brattle.com
MAAC Mid-Atlantic Area Council
MACRS Modified Accelerated Cost Recovery System
MMBtu One Million British Thermal Units
MOPR Minimum Offer Price Rule
MW Megawatt(s)
MWh Megawatt-Hours
NNSR Non-Attainment New Source Review
NOx Nitrogen Oxides
NPV Net Present Value
NSR New Source Review
NYISO New York Independent System Operator
O&M Operation and Maintenance
OATT Open Access Transmission Tariff
OFE Owner-Furnished Equipment
OTR Ozone Transport Region
PILOT Payment in Lieu of Taxes
PJM PJM Interconnection, LLC
PPI Producer Price Index
PSD Prevention of Significant Deterioration
ROE Return on Equity
RPM Reliability Pricing Model
RTO Regional Transmission Organization
S&L Sargent & Lundy
SCR Selective Catalytic Reduction
SWMAAC Southwestern Mid-Atlantic Area Council
ULSD Ultra-Lower Sulfur Diesel
VOC Volatile Organic Compounds
VRR Variable Resource Requirement
WMAAC Western Mid-Atlantic Area Council
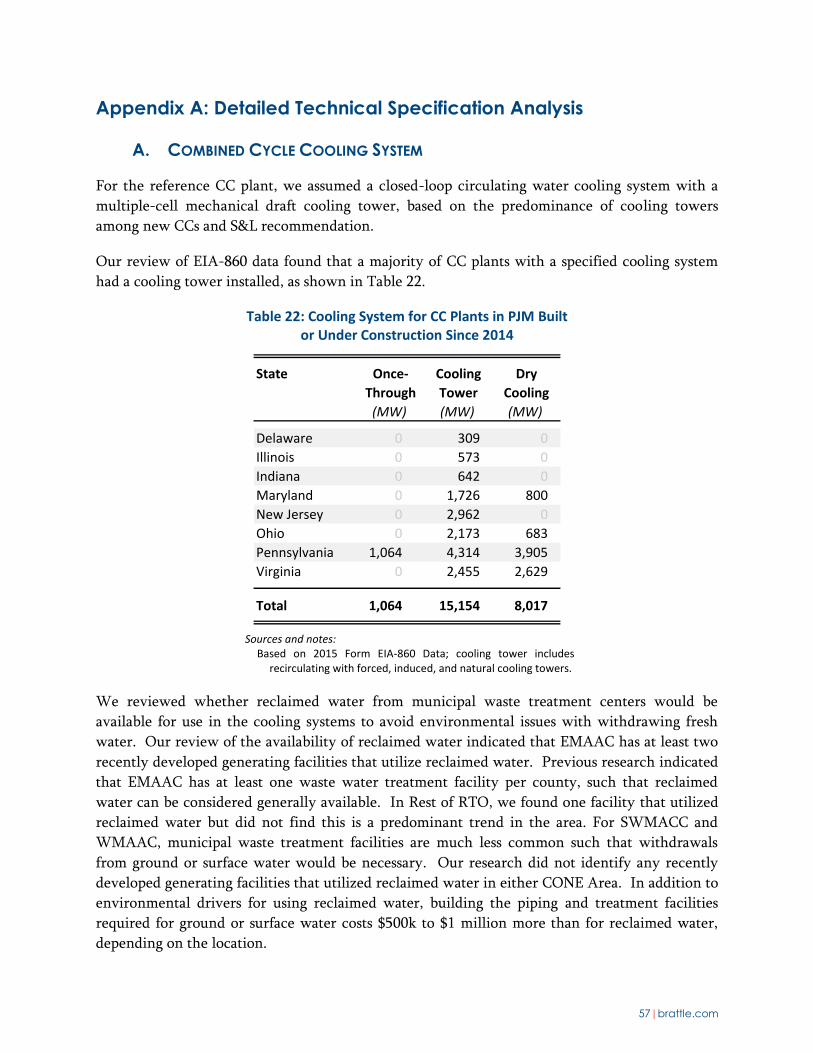
57|brattle.com
Appendix A: Detailed Technical Specification Analysis
A. COMBINED CYCLE COOLING SYSTEM
For the reference CC plant, we assumed a closed-loop circulating water cooling system with a
multiple-cell mechanical draft cooling tower, based on the predominance of cooling towers
among new CCs and S&L recommendation.
Our review of EIA-860 data found that a majority of CC plants with a specified cooling system
had a cooling tower installed, as shown in Table 22.
Table 22: Cooling System for CC Plants in PJM Built or Under Construction Since 2014
Sources and notes:
Based on 2015 Form EIA-860 Data; cooling tower includes recirculating with forced, induced, and natural cooling towers.
We reviewed whether reclaimed water from municipal waste treatment centers would be
available for use in the cooling systems to avoid environmental issues with withdrawing fresh
water. Our review of the availability of reclaimed water indicated that EMAAC has at least two
recently developed generating facilities that utilize reclaimed water. Previous research indicated
that EMAAC has at least one waste water treatment facility per county, such that reclaimed
water can be considered generally available. In Rest of RTO, we found one facility that utilized
reclaimed water but did not find this is a predominant trend in the area. For SWMACC and
WMAAC, municipal waste treatment facilities are much less common such that withdrawals
from ground or surface water would be necessary. Our research did not identify any recently
developed generating facilities that utilized reclaimed water in either CONE Area. In addition to
environmental drivers for using reclaimed water, building the piping and treatment facilities
required for ground or surface water costs $500k to $1 million more than for reclaimed water,
depending on the location.
State Once-
Through
Cooling
Tower
Dry
Cooling
(MW) (MW) (MW)
Delaware 0 309 0
Illinois 0 573 0
Indiana 0 642 0
Maryland 0 1,726 800
New Jersey 0 2,962 0
Ohio 0 2,173 683
Pennsylvania 1,064 4,314 3,905
Virginia 0 2,455 2,629
Total 1,064 15,154 8,017

58|brattle.com
B. POWER AUGMENTATION
Evaporative coolers are included downstream of the filtration system to lower the combustion
turbine inlet air temperature during warm weather operation. With a few exceptions the use of
evaporative coolers has become a standard in industry practice where water is available. The use
of evaporative coolers increases turbine output and efficiency for a small increase in capital cost.
In addition, the combustion turbines in both simple- and combined-cycle arrangements are
equipped with an inlet filtration system to protect from airborne dirt and particles. Evaporative
coolers and associated equipment add $3 million per combustion turbine to the capital costs.
C. BLACK START CAPABILITY
Based on our analysis in the 2011 PJM CONE Study, we did not include black start capability in
either the CC or CT reference units because few recently built gas units have this capability.
D. ELECTRICAL INTERCONNECTION
While all CONE Areas have a variety of transmission voltages, both lower and higher than
345 kV, we selected 345 kV as the typical voltage for new CT and CC plants to interconnect to
the transmission grid in PJM. The switchyard is assumed to be within the plant boundary and is
counted as an EPC cost under “Other Equipment,” including generator circuit breakers, main
power and auxiliary generator step-up transformers, and switchgear. All other electric
interconnection equipment, including generator lead and network upgrades, is included
separately under Owner’s Costs, as presented in Section IV.C.4.
E. GAS COMPRESSION
Similar to the 2014 PJM CONE Study, we assume gas compression would not be needed for new
gas plants with frame-type combustion turbines located near and/or along the major gas pipelines
selected in our study. The frame machines generally operate at lower gas pressures than the gas
pipelines.

59|brattle.com
Appendix B: Detailed Cost Estimate Assumptions
A. CONSTRUCTION LABOR COSTS
Labor costs are comprised of “construction labor” associated with the EPC scope of work and
“other labor” that includes engineering, procurement, project services, construction
management, field engineering, start-up, and commissioning services. The labor rates in this
analysis do not reflect a specific assumption of whether union or non-union labor is utilized.
Labor rates have been developed by S&L through a survey of prevalent wages in each region in
2017. The labor costs for a given task are based on trade rates weighted by the combination of
trades required. In areas where multiple labor pools can be drawn upon the trade rates used are
the average of the possible labor rates. The labor costs are based on a 5-day 10-hour work week
with per-diem included to attract skilled labor.
Labor rates have been updated since the 2014 CONE study to represent the current competitive
market. Additionally, site overheads are carried as indirect costs, which is consistent with
current industry practice whereas in 2014 site overheads were carried in the labor rates. As a
result, the labor rates in this CONE study are lower than those in the 2014 CONE study by
approximately 5% for CTs and 6% for CCs on average.
Engineering, procurement, and project services are taken as 5% of project direct costs.
Construction management and field engineering is taken as 2% of project direct costs. Start-up
and commissioning is taken as 1% of project direct costs. These values were used in the 2014
PJM CONE Study and are in-line with recent projects in which S&L has been involved.
A summary of construction labor cost assumptions is shown below in Table 23.
Table 23: Construction Labor Cost Assumptions
EMAAC SWMAAC Rest of RTO WMAAC
CT Plant
2017 Construction Labor Hours hours 260,918 238,253 225,598 258,762
2017 Weighted Average Crew Rates $ 119.54 91.59 96.46 102.89
2017 Productivity Factor -- 1.18 1.10 1.12 1.17
2017 Construction Labor Costs $ $36,729,452 $26,839,467 $26,229,993 $31,795,172
2017 Construction Labor Costs $/kW 104 76 82 92
CC Plant
2017 Construction Labor Hours hours 1,240,716 1,148,990 1,179,563 1,230,523
2017 Weighted Average Crew Rates $ 125.85 100.39 103.05 111.38
2017 Productivity Factor -- 1.18 1.10 1.12 1.17
2017 Construction Labor Costs $ $182,316,769 $137,591,371 $144,572,598 $161,654,881
2017 Construction Labor Costs $/kW 158 119 127 144

60|brattle.com
B. NET STARTUP FUEL COSTS
We made the following assumptions to calculate net start-up fuel costs:
Natural Gas: assume zone-specific gas prices, including Transco Zone 6 Non-New
York prices for EMAAC, Transco Zone 5 prices for SWMAAC, Columbia
Appalachia prices for Rest of RTO, and Transco Leidy Receipts for WMAAC. All
gas prices were calculated by using future/forward natural gas prices from OTC
Global Holdings as of 10/10/2017 to estimate 2022 gas prices.
Fuel Oil: rely on No. 2 fuel oil futures for New York harbor through January 2021;
escalate fuel oil prices between January 2021 and an assumed fuel delivery date of
May 2022 based on the escalation in Brent crude oil futures over the same date
range.
Electric Energy: estimate prices based on zone-specific energy prices for the
location of the reference resources in each CONE Area: AECO for EMAAC,
PEPCO for SWMAAC, AEP for Rest of RTO, and PPL for WMAAC;101 average
the resulting estimates for locational day-ahead on-peak and off-peak energy
prices to estimate the average revenues that would be received during testing.
Table 24: Startup Production and Fuel Consumption During Testing
Sources and notes:
Energy production and fuel consumption estimated by S&L. Energy prices estimated by Brattle based on approach discussed in Section II.B of VRR curve report. Gas prices from OTC Global Holdings as of 10/10/2017.
C. GAS AND ELECTRIC INTERCONNECTION COSTS
Similar to the 2014 PJM CONE Study, we identified representative gas pipeline lateral projects
from the EIA U.S. Natural Gas Pipeline Projects database and obtained project-specific costs from
each project’s FERC docket for calculating the average per-mile lateral cost and metering station
101 Electricity prices were estimated following the approach discussed in Section II.B of the concurrently
released VRR Curve report.
Energy Production Fuel Consumption
Energy
Produced
Energy
Price
Energy
Sales
Credit
Natural
Gas
Natural
Gas Price
Natural
Gas Cost
Fuel Oil
Use
Fuel Oil
Price
Fuel Oil
Cost
Total Cost
(MWh) ($/MWh) ($m) (MMBtu) ($/MMBtu) ($m) (MMBtu) ($/MMBtu) ($m) ($m)
Gas CT
1 Eastern MAAC 186,984 $22.51 $4.21 1,627,295 $3.57 $5.8 81,365 $12.63 $1.03 $2.6
2 Southwest MAAC 187,992 $27.89 $5.24 1,635,888 $3.60 $5.9 81,365 $12.63 $1.03 $1.7
3 Rest of RTO 165,816 $27.42 $4.55 1,439,915 $2.59 $3.7 81,365 $12.63 $1.03 $0.2
4 Western MAAC 180,936 $23.20 $4.20 1,575,694 $2.40 $3.8 81,365 $12.63 $1.03 $0.6
Gas CC
1 Eastern MAAC 1,081,584 $22.51 $24.34 6,458,602 $3.57 $23.0 162,730 $12.63 $2.06 $0.7
2 Southwest MAAC 1,036,800 $27.89 $28.92 6,499,699 $3.60 $23.4 -- $12.63 $0.00 -$5.5
3 Rest of RTO 1,056,384 $27.42 $28.96 6,306,109 $2.59 $16.4 162,730 $12.63 $2.06 -$10.5
4 Western MAAC 1,048,320 $23.20 $24.32 6,256,973 $2.40 $15.0 162,730 $12.63 $2.06 -$7.2

61|brattle.com
costs. We escalated the project-specific costs to 2017 dollars based on the assumed long-term
inflation rate of 2.4% (see Table 12 above). We then calculated the average per-mile costs of the
laterals ($4.6 million/mile) and the station costs ($3.4 million). The summary of project costs and
the average per-mile pipeline cost and metering station cost are shown in Table 25.102
Table 25: Gas Interconnection Costs
Sources and notes:
A list of recent gas lateral projects were identified based on an EIA dataset (http://www.eia.gov/naturalgas/data.cfm) and detailed cost information was obtained from the project’s application with FERC, which can be retrieved from the project’s FERC docket (available at http://elibrary.ferc.gov/idmws/docket_search.asp).
Table 26 below summarizes the average electrical interconnection costs of recently installed gas-
fired resources that we identified as representative of the CT and CC reference resources. The
costs are based on confidential, project-specific cost data provided by PJM for both the direct
connection facilities and all necessary network upgrades. In the case where plants chose to build
their own direct connection facilities and did not report their costs to PJM, we calculated the
capacity-weighted average of the units with direct connection costs and applied them to the
units without direct connection costs. We escalated the direct connection and network upgrade
costs from the online service dates to 2017 dollars based on the assumed long-term inflation rate
of 2.2% plus the additional real escalation rate for equipment of 0.2%. We then calculated the
capacity-weighted average costs. We used the capacity-weighted average across all
representative plants of $19.9/kW for setting the electrical interconnection of the CT and CC
reference resources.
102 The gas lateral projects were identified from the EIA’s “U.S. natural gas pipeline projects” database
available at http://www.eia.gov/naturalgas/data.cfm. The detailed costs are from each project’s FERC
application, which can be found by searching for the project’s docket at
http://elibrary.ferc.gov/idmws/docket_search.asp.
State In-Service
Year
Pipeline
Width
Pipeline
Length
Pipeline
Cost
Pipeline
Cost
Pipeline
Cost
Meter
Station
Station Cost Station Cost
Gas Lateral Project (inches) (miles) (service year $m) (2017$m) ($m/mile) (Y/N) (service year $m) (2017$m)
Delta Lateral Project PA 2010 16 3.4 $9 $11 $3 Y $3.3 $3.8
FGT Mobile Bay Lateral Expansion AL 2011 24 8.8 $27 $31 $4 Y $2.4 $2.8
Northeastern Tennessee Project VA 2011 24 28.1 $127 $147 $5 Y $2.8 $3.2
Hot Spring Lateral Project TX,AR 2011 16 8.4 $33 $38 $4 Y $3.6 $4.2
Bayonne Delivery Lateral Project NJ 2012 20 6.2 $13 $15 $2 Y $3.8 $4.3
North Seattle Delivery Lateral Expansion WA 2012 20 2.2 $11 $13 $6 Y $1.4 $1.6
South Seattle Delivery Lateral Expansion WA 2013 16 4.0 $14 $15 $4 N n.a. n.a.
Carty Lateral Project OR 2015 20 24.3 $52 $55 $2 Y $2.3 $2.4
Woodbridge lateral NJ 2015 20 2.4 $29 $30 $13 Y $3.5 $3.6
Western Kentucky Lateral Project KY 2016 24 22.5 $71 $73 $3 Y $4.8 $4.9
Rock Springs Expansion PA,MD 2016 20 11.17 $41 $42 $4 Y $3.3 $3.3
Average $4.6 $3.4

62|brattle.com
Table 26: Electric Interconnection Costs in PJM
Source and notes:
Confidential project-specific cost data provided by PJM.
D. LAND COSTS
We estimated the cost of land by reviewing current asking prices for vacant industrial land
greater than 10 acres for sale in each selected county. We collected all publicly-available land
listings for counties within each CONE area. We then calculated the acre-weighted average land
price for each CONE area and escalated 1 year using the long-term inflation rate of 2.2%. There
is a wide range of prices within the same CONE Area as shown in Table 27.
Table 27: Current Land Asking Prices
Sources and notes:
We researched land listing prices on LoopNet’s Commercial Real Estate Listings (www.loopnet.com) and on LandAndFarm (www.landandfarm.com).
E. PROPERTY TAXES
Table 28 summarizes the calculations for the effective tax rates of each CONE area. We collected
nominal tax rates, assessment ratios, and depreciation rates for counties of each CONE area.
Using the nominal tax rates and assessment ratios, the effective tax rate for each CONE area was
calculated by multiplying the average nominal tax rate and assessment ratio for counties within
each CONE area state.
Electrical Interconnection Cost
Plant Size Observations Capacity Weighted Average
(count) (2017$m) (2017$/kW)
< 500 MW 3 $4.5 $16.6
500-750 MW 4 $9.8 $14.5
> 750 MW 5 $29.7 $23.4
Capacity Weighted Average 12 $21.1 $19.9
CONE Area Current Asking Prices
Observations Range Land Price
(count) (2018$/acre) (2018$/acre)
1 EMAAC 6 $21,500 - $49,000 $36,300
2 SWMAAC 3 $58,400 - $95,100 $66,700
3 RTO 7 $6,100 - $60,300 $26,200
4 WMAAC 2 $25,000 - $63,600 $51,100

63|brattle.com
Table 28: Property Tax Rate Estimates for Each CONE Area
F. FIRM GAS CONTRACTS
To estimate the costs of acquiring firm transportation service for SWMAAC CCs coming online
in 2022, we calculated the average costs of firm gas capacity on a per-kW basis for two recent
SWMAAC CCs (St. Charles and Keys Energy Center) based on rates approved by FERC in 2015.
We account for the 2022 online date by escalating the reservation rates of $3.7417 per dekatherm
for St. Charles and $5.4278 per dekatherm for Keys by 2.4% per year from the online plant years
of 2017 (St. Charles) and 2018 (Keys) to 2022. We then calculate the total costs by multiplying
the reservation rates by the amount of gas reserved by each facility per month. Next, we
calculate the per-kW costs by dividing the total cost of firm gas by the net plant capacity. We
calculate the total cost of firm gas reservations for the new reference resource by multiplying the
average $/kW value by the net plant capacity for the SWMAAC CC reference resource. Table 29
summarizes the escalated rates and reservation for procuring firm gas service on the DCP
pipeline.
Real Property Tax Personal Property Tax
Nominal Tax
Rate
Assessment
Ratio
Effective Tax
Rate
Nominal Tax
Rate
Assessment
Ratio
Effective Tax
RateDepreciation
[a] [b] [a] X [b] [c] [d] [c] X [d] [e]
(%) (%) (%) (%) (%) (%)
1 EMAAC
New Jersey [1] 3.8% 97.8% 3.7% n/a n/a n/a n/a
2 SWMAAC
Maryland [2] 1.1% 100.0% 1.1% 2.8% 50.0% 1.4% 3.3%
3 RTO
Ohio [3] 5.8% 35.0% 2.0% 5.8% 24.0% 1.4% Follow annual report "SchC-NewProd (NG)"
Pennsylvania [4] 2.5% 100.0% 2.5% n/a n/a n/a n/a
4 WMAAC
Pennsylvania [5] 3.6% 99.0% 3.5% n/a n/a n/a n/a
Sources and Notes:
[1a],[1b] New Jersey rates estimated based on the average effective tax rates from Gloucester and Camden counties. For Gloucester County see:http://www.state.nj.us/treasury/taxation/pdf/lpt/chap123/2017/gloucester.pdf &
http://www.gloucestercountynj.gov/depts/b/botcounty/trb.asp for Camden county see:
http://www.camdencounty.com/service/board-of-taxation/
[1c],[1d] No personal property tax assessed on power plants in New Jersey; NJ Rev Stat § 54:4-1 (2016).
Department of Assessments & Taxation website:
http://dat.maryland.gov/Documents/statistics/Taxrate_July2017.pdf
[2d] MD Tax-Prop Code § 7-237 (2016)
[2e] Phone conversation with representative at Charles County Treasury Department.
[3a], [3c] Ohio rates estimated based on the average effective tax rates from Trumbull and Carroll counties. For Trumbull county see:
http://auditor.co.trumbull.oh.us/pdfs/2016%20Tax%20Rate%20Card.pdf for Carroll county see:
http://www.carrollcountyauditor.us/auditorsadvisory/Rates%20of%20Taxation%202017.pdf
[3b],[3d] Assessment ratios for real property and personal property taxes found on pages 129 and 124:
http://www.tax.ohio.gov/Portals/0/communications/publications/annual_reports/2016AnnualReport/2016AnnualReport.pdf
[3e] Depreciation schedules for utility assets found in Form U-El by Ohio Department of Taxation:
http://www.tax.ohio.gov/portals/0/forms/public_utility_excise/2017/PUE_UEL.xls
[4a] Pennsylvania county tax rates for RTO based on the county of Lawrence, available at:
http://co.lawrence.pa.us/wp-content/uploads/2014/10/2017-Sheet-for-Millage-.pdf
[4b] Pennsylvania assessment ratios available at:
http://www.revenue.pa.gov/FormsandPublications/FormsforIndividuals/Documents/Realty%20Transfer%20Tax/clr_factor_current.pdf
Note: Assessment ratio for calculations is capped at 100%
[4c]-[4e] According to Pennsylvania Legislator's Municipal Deskbook (taxation & finance) , only real estate tax assessed by local governments
[5a] Pennsylvania county tax rates for WMAAC based on average effective tax rate between Luzerne, Lycoming, and Bradford counties:
http://www.luzernecounty.org/uploads/images/assets/county/departments_agencies/2017/2017%20Millages.pdf
http://www.lyco.org/Portals/1/TaxClaimBureau/Documents/2017%20Millage%20Rates-JULY%202017.pdf
http://www.bradfordcountypa.org/application/files/1314/9970/7556/2017_Mill_Rates.pdf
[5b] Pennsylvania assessment ratios available at:
http://www.revenue.pa.gov/FormsandPublications/FormsforIndividuals/Documents/Realty%20Transfer%20Tax/clr_factor_current.pdf
[5c]-[5e] According to Pennsylvania Legislator's Municipal Deskbook (taxation & finance) , only real estate tax assessed by local governments
[2a],[2c] Maryland tax rates estimated based on average county tax rates in Charles county and Prince George's county in 2017-2018. Data obtained from Maryland

64|brattle.com
Table 29: Estimated Cost of Procuring Firm Gas Service on DCP Pipeline
Sources and notes:
153 F.E.R.C. ¶ 61,074 (Issued October 20, 2015). 1 dekatherm (Dth) is equivalent to 1 MMBtu.
G. OPERATIONAL STARTUP PARAMETERS
Sargent & Lundy reviewed the operational characteristics of starting up each reference resource
and updated the parameters PJM includes in its historical simulations for setting the Net E&AS
revenue offset in Table 30.
Table 30: Recommended Startup Parameters for Reference Resources
Component Units St. Charles Keys
Reference
Resource
Net Plant Capacity - Max Summer (MW) 726 800 1,031
Cost of Firm Gas Capacity per Month (2022$ per Dth/d) $4.21 $5.97 $4.96
Total Firm Gas Capacity Reservation (Dth/d per year) 1,584,000 1,284,000 1,952,105
Total Cost of Firm Gas Reservations (2022$/kW) $9.19 $9.58 $9.39
Total Cost of Firm Gas Reservations (2022$) 6,673,000 7,663,000 $9,676,000
CT CC
Parameter Unit Current New Current New
ICAP_NOSCR MW 392 321 n.a. n.a.
ICAP_SCR MW 390 348 656 1,012
NOX_RATE_NOSCR lb/MMBtu 0.0332 0.0332 n.a. n.a.
NOX_RATE_SCR lb/MMBtu 0.0074 0.0093 0.0074 0.0074
SO2_RATE lb/MMBtu 0 0.001 0 0.001
START_MMBTU MMBtu 146.5 508.5 3,310.8 8,241.4
START_CONSUMED_MWH MWh 0.4 0.9 10.1 12.6
START_PRODUCED_MWH MWh n.a. n.a. 292.3 1074.7
START_NOX Lb/Start 28 55 332.71 160
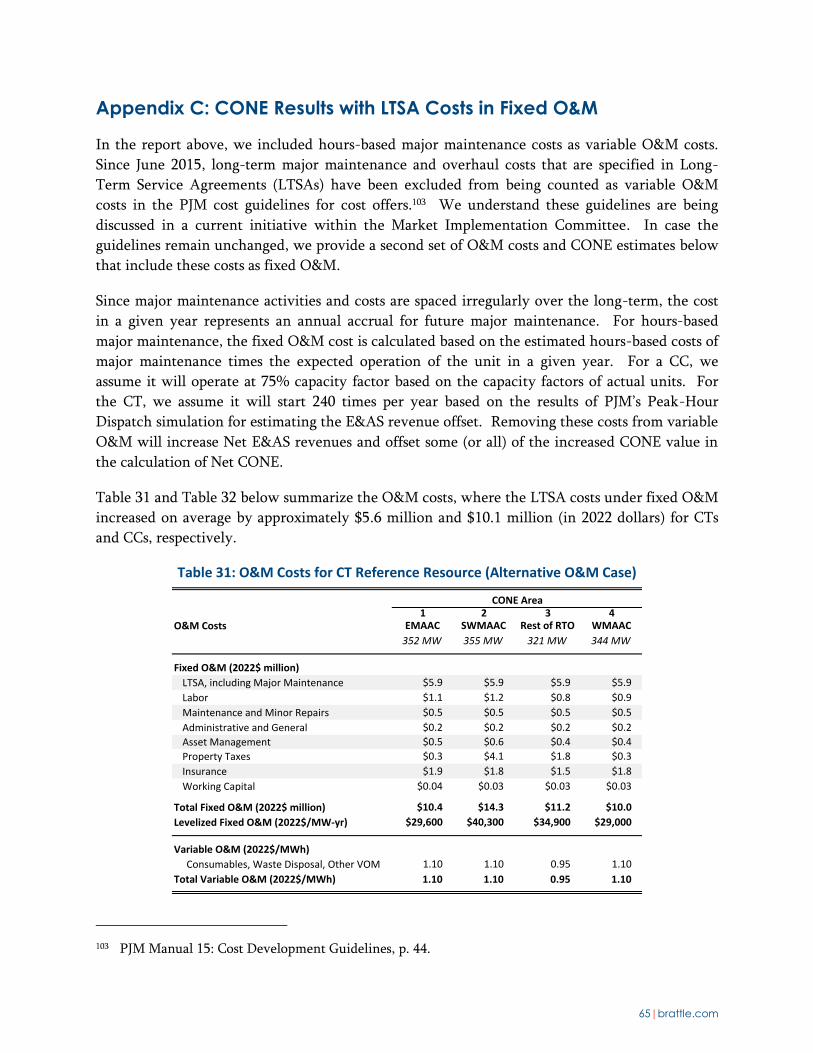
65|brattle.com
Appendix C: CONE Results with LTSA Costs in Fixed O&M
In the report above, we included hours-based major maintenance costs as variable O&M costs.
Since June 2015, long-term major maintenance and overhaul costs that are specified in Long-
Term Service Agreements (LTSAs) have been excluded from being counted as variable O&M
costs in the PJM cost guidelines for cost offers.103 We understand these guidelines are being
discussed in a current initiative within the Market Implementation Committee. In case the
guidelines remain unchanged, we provide a second set of O&M costs and CONE estimates below
that include these costs as fixed O&M.
Since major maintenance activities and costs are spaced irregularly over the long-term, the cost
in a given year represents an annual accrual for future major maintenance. For hours-based
major maintenance, the fixed O&M cost is calculated based on the estimated hours-based costs of
major maintenance times the expected operation of the unit in a given year. For a CC, we
assume it will operate at 75% capacity factor based on the capacity factors of actual units. For
the CT, we assume it will start 240 times per year based on the results of PJM’s Peak-Hour
Dispatch simulation for estimating the E&AS revenue offset. Removing these costs from variable
O&M will increase Net E&AS revenues and offset some (or all) of the increased CONE value in
the calculation of Net CONE.
Table 31 and Table 32 below summarize the O&M costs, where the LTSA costs under fixed O&M
increased on average by approximately $5.6 million and $10.1 million (in 2022 dollars) for CTs
and CCs, respectively.
Table 31: O&M Costs for CT Reference Resource (Alternative O&M Case)
103 PJM Manual 15: Cost Development Guidelines, p. 44.
CONE Area CONE Area1 2 3 4
O&M Costs EMAAC SWMAAC Rest of RTO WMAAC
352 MW 355 MW 321 MW 344 MW
Fixed O&M (2022$ million)
LTSA, including Major Maintenance $5.9 $5.9 $5.9 $5.9
Labor $1.1 $1.2 $0.8 $0.9
Maintenance and Minor Repairs $0.5 $0.5 $0.5 $0.5
Administrative and General $0.2 $0.2 $0.2 $0.2
Asset Management $0.5 $0.6 $0.4 $0.4
Property Taxes $0.3 $4.1 $1.8 $0.3
Insurance $1.9 $1.8 $1.5 $1.8
Working Capital $0.04 $0.03 $0.03 $0.03
Total Fixed O&M (2022$ million) $10.4 $14.3 $11.2 $10.0
Levelized Fixed O&M (2022$/MW-yr) $29,600 $40,300 $34,900 $29,000
Variable O&M (2022$/MWh)
Consumables, Waste Disposal, Other VOM 1.10 1.10 0.95 1.10
Total Variable O&M (2022$/MWh) 1.10 1.10 0.95 1.10

66|brattle.com
Table 32: O&M Costs for CC Reference Resource (Alternative O&M Case)
Table 33 and Table 34 summarize the CONE estimates where the change in LTSA costs increase
CONE on average by $19,000/MW-year for CTs and $10,000/MW-year for CCs due to including
the LTSA-related major maintenance costs as fixed O&M. The increase in CONE is greater than
the increase in first-year fixed O&M costs (about $16,000/MW-year for CTs and $9,000/MW-
year for CCs) due to the “level-nominal” levelization approach described in Section VII.A.104 The
higher CONE is likely to be offset somewhat by increases in Net E&AS revenues in the
calculation of Net CONE.
104 Fixed O&M costs generally escalate year-by-year near the assumed inflation rate. The level-nominal
approach for calculating CONE converts the rising costs into an annual value that remains constant in
nominal terms (does not increase with inflation).
CONE Area1 2 3 4
O&M Costs EMAAC SWMAAC Rest of RTO WMAAC
1152 MW 1160 MW 1138 MW 1126 MW
Fixed O&M (2022$ million)
LTSA, including Major Maintenance $10.7 $10.8 $10.5 $10.4
Labor $5.8 $6.3 $4.4 $4.6
Maintenance and Minor Repairs $5.9 $6.1 $5.4 $5.5
Administrative and General $1.3 $1.4 $1.1 $1.2
Asset Management $1.6 $1.7 $1.2 $1.3
Property Taxes $2.0 $12.3 $7.1 $1.9
Insurance $6.0 $5.4 $5.6 $5.8
Firm Gas Contract $0.0 $9.7 $0.0 $0.0
Working Capital $0.1 $0.1 $0.1 $0.1
Total Fixed O&M (2022$ million) $33.4 $53.8 $35.4 $30.8
Levelized Fixed O&M (2022$/MW-yr) $29,000 $46,400 $31,100 $27,300
Variable O&M (2022$/MWh)
Consumables, Waste Disposal, Other VOM 0.67 0.67 0.67 0.67
Total Variable O&M (2022$/MWh) 0.67 0.67 0.67 0.67

67|brattle.com
Table 33: Recommended CONE for CTs (Alternative O&M Case)
Sources and notes:
PJM 2021/22 parameters escalated to 2022/23 by 2.8%, based on escalation rates for individual cost components. CONE values expressed in 2022 dollars and ICAP terms.
Simple Cycle Combined Cycle
EMAAC SWMAAC Rest of RTO WMAAC
Gross Costs
[1] Overnight $m $316 $297 $257 $305
[2] Installed (inc. IDC) $m $330 $310 $268 $318
[3] First Year FOM $m/yr $10 $14 $11 $10
[4] Net Summer ICAP MW 352 355 321 344
Unitized Costs
[5] Overnight $/kW = [1] / [4] $898 $836 $799 $886
[6] Installed (inc. IDC) $/kW = [2] / [4] $938 $874 $835 $925
[7] Levelized FOM $/kW-yr = [3] / [4] $35 $43 $39 $34
[8] After-Tax WACC % 7.4% 7.5% 7.4% 7.4%
[9] Effective Charge Rate % 10.1% 10.1% 10.0% 10.0%
[10] Levelized CONE $/MW-yr = [5] x [9] + [7] $125,300 $127,100 $118,800 $123,100
Prior Auction CONE
[11] PJM 2021/22 CONE $/MW-yr $133,144 $140,953 $133,016 $134,124
[12] Escalated to 2022/23 $/MW-yr = [11] x 1.028 $136,900 $144,900 $136,700 $137,900
Difference between Updated CONE and Escalated Prior Auction CONE
[13] Escalated to 2022/23 $/MW-yr = [10] - [12] ($11,600) ($17,800) ($17,900) ($14,800)
[14] Escalated to 2022/23 % = [13] / [12] -8% -12% -13% -11%

68|brattle.com
Table 34: Recommended CONE for CCs (Alternative O&M Case)
Sources and notes:
PJM 2021/22 parameters escalated to 2022/23 by 2.8%, based on escalation rates for individual cost components. CONE values expressed in 2022 dollars and ICAP terms.
Combined Cycle
EMAAC SWMAAC Rest of RTO WMAAC
Gross Costs
[1] Overnight $m $1,006 $896 $928 $961
[2] Installed (inc. IDC) $m $1,095 $976 $1,009 $1,046
[3] First Year FOM $m/yr $33 $54 $35 $31
[4] Net Summer ICAP MW 1,152 1,160 1,138 1,126
Unitized Costs
[5] Overnight $/kW = [1] / [4] $873 $772 $815 $853
[6] Installed (inc. IDC) $/kW = [2] / [4] $951 $841 $887 $929
[7] Levelized FOM $/kW-yr = [3] / [4] $34 $49 $34 $32
[8] After-Tax WACC % 7.4% 7.5% 7.4% 7.4%
[9] Effective Charge Rate % 10.6% 10.6% 10.5% 10.5%
[10] Levelized CONE $/MW-yr = [5] x [9] + [7] $126,400 $130,600 $120,000 $122,100
Prior Auction CONE
[11] PJM 2021/22 CONE $/MW-yr $186,807 $193,562 $178,958 $185,418
[12] Escalated to 2022/23 $/MW-yr = [11] x 1.028 $192,000 $199,000 $184,000 $190,600
Difference between Updated CONE and Escalated Prior Auction CONE
[13] Escalated to 2022/23 $/MW-yr = [10] - [12] ($65,600) ($68,400) ($63,900) ($68,500)
[14] Escalated to 2022/23 % = [13] / [12] -34% -34% -35% -36%

Top Related