


Languages
Pages
Legal


Picking Winners: Market Outcomes of Public Venture Capital
By Grant H. Lewis
Through the Small Business Innovation Research (SBIR) program, the U.S. government provides grants and sole-source contracts to small businesses demonstrating potential for productive innovation. The program is designed to correct market failures associated with research and development inappropriability and information asymmetries in startup financing. I use linked datasets combining SBIR award data with the National Establishment Time Series to reexamine previous case-study- and survey-based investigations that found positive effects of the program on firm performance. Empirical matching models compare program participants to control groups of similar firms and reveal significant underperformance of program participants in both employment and sales growth over a six-year period. (JEL H21, H32, O38)
The idea of market failure is common in the economic theory of research and development:
firms do not invest in innovation at a socially optimal level due to technological spillover and the
inappropriability of investment returns. With social returns to innovation exceeding private
returns, there may be a role for public support of private research and development (Arrow 1962,
Griliches 1992, Jones and Williams 1998). Other inefficiencies arise from the nature of new
ideas and the people working to commercialize them. Moral hazard and information asymmetry
between entrepreneurs and venture capitalists may prevent viable projects from finding the
necessary financing. Structure of the venture capital industry itself and the regulations governing
it may favor large, established firms at the expense of more innovative but less capitalized
competitors (Hall 2002). Such concerns led to the Small Business Innovation Development Act
of 1982 (P.L. 97-219), which established the Small Business Innovation Research (SBIR)
program to be overseen by the Small Business Administration.
Founded on the idea that innovative small businesses are the engine of U.S. economic
growth, the act directs federal agencies engaging in high levels of research and development to

LEWIS: PICKING WINNERS 2
set aside a portion of their funding for small businesses. The SBIR program office states on its
website, “SBIR targets the entrepreneurial sector because that is where most innovation and
innovators thrive. However, the risk and expense of conducting serious R&D efforts are often
beyond the means of many small businesses.” Through a competitive, multi-phased sequence of
investments, agencies select projects with high potential and attempt to bring them from concept
development to commercialization through a series of grants and sole-source contracts. Phase I
of the program provides limited funding to demonstrate commercial potential. Successful Phase
I firms then progress to Phase II in which products are further developed for introduction to the
marketplace. The program currently disburses about $2 billion per year to small businesses (see
Figure 1).
The literature on the potential for R&D market failure presents a strong theoretical case
for the need to support R&D efforts in small businesses (Romer 1986, 1990; Jones and Williams
1998). However, public choice theory suggests that, whatever the market failures, public
solutions must first provide evidence that government organizations are equipped to produce
desired outcomes. In the case of the SBIR program, can federal agencies identify and
successfully invest in undercapitalized firms with potential for high impact on the economic
performance of the United States? Anecdotal evidence would seem to answer this question in
the affirmative. Proponents cite success stories such as Apple, Compaq and Intel, all of whom
were recipients of government startup funding in their early days (Audretsch 2003). However,
broader evidence supporting the conclusion that the SBIR program has been a success arises
primarily from interviews, surveys and case studies of participating firms, and is therefore
susceptible to the challenge that it comes from those most likely to overstate the program’s
impact (Lerner and Kegler 2000). Objectively derived datasets are largely absent in the

LEWIS: PICKING WINNERS 3
literature, and the paucity of rich data on the subject allows notable (and by definition, outlying)
cases to drive the debate.
This study provides a counterpoint to common case-study analyses of government R&D
intervention with a dataset larger than any previously used, and comes to sharply different
conclusions. Since interest in evaluating the SBIR program peaked a number of years ago, large
quantities of publicly available data on SBIR awards have been collected by the program office.
The challenge has been pairing these awards with data on firm performance since most SBIR
program recipients are not publicly traded firms. The only significant study to undertake such a
pairing was Lerner (1999), who manually combined survey data with information from a variety
of public sources to conduct the only econometric analysis of the program to date with a sample
size large enough to be convincing. The study found support for the program’s beneficial
effects.
I use a similar approach, linking SBIR awardee firms with employment and sales data
through DUNS numbers also reported in the National Establishment Time Series (NETS).
Although consistent DUNS number matches are only possible beginning in approximately 2007
(government procurement data quality greatly improved following the Federal Funding
Accountability and Transparency Act of 2006), the following six years are adequate to discern
program effects. I first replicate previous studies such as Lerner (1999), generating treatment
and control groups by matching participating firms to non-participants by limited sets of firm
characteristics. I obtain similar results, suggesting that SBIR firms grow faster than similar firms
not benefiting from financing.
I then modify the matching procedure to account for additional data not available at the
time of the early study. A critical problem in identifying the SBIR program’s effect on firm

LEWIS: PICKING WINNERS 4
performance is disentangling the economic effects of the targeted innovation from those of the
funding itself. A firm whose business model focuses on capturing non-competitive government
contracts may indeed grow larger, but the goal of stimulating broader economic development and
innovation will not be met. Examination of a larger panel of award data suggests that this is
likely a problem: the same firms consistently win repeated SBIR awards over the span of many
years (see Table 1). Case studies examining follow-on effects from single awards do not account
for this serial correlation. A common finding that individual award recipients consistently
outperform non-recipients in subsequent years may reflect the simple fact that initially successful
firms continue to win SBIR awards. However, the skill set required to win federal contracts is
likely different from that required to create value through innovation. By matching awardee
firms with control firms based on a more robust set of variables, the models presented here
control for both the serial correlation problem and other issues identified in previous studies such
as localized availability of private venture capital and other critical inputs (Audretsch and
Feldman 1996).
I begin with a limited sample created by matching Phase II award recipients with firms
who won Phase I funding but failed to move to Phase II and examine employment and sales of
the resulting treatment and control groups. The positive effect found here, as reported in Lerner
(1999) and many other case-study-type analyses, disappears when firms are more carefully
matched in subsequent model specifications. Matching treatment and control firms on location
or total federal funding in addition to industry and size eliminates or even reverses the effects
found in previous studies. Rather than matching Phase II firms with Phase I firms, I next match
them with non-SBIR firms which held other R&D contracts with the federal government. The
larger sample size allows for more careful matching procedures, and the effect of SBIR

LEWIS: PICKING WINNERS 5
participation is strongly negative, with participants underperforming in employment and sales
growth relative to their peers. Alternative specifications confirm the robustness of this finding.
Analysis of the effects of SBIR funding on individual firm performance does not address
larger questions of beneficial knowledge spillovers and stimulation of private venture capital
funding for research and development (Gans and Stern 2000). Most existing studies, however,
are based on the premise that public venture capital programs indeed improve performance of the
target firms (Audretsch 2003; Wessner 2000). They then explore how these salubrious effects
spill over to the broader economy and whether the benefits are greater than the costs. Audretsch,
Link and Scott (2002) go so far as to state, “We do not debate the appropriateness of the
government’s support of [the SBIR program] but take that as a historical given and turn directly
to evaluating the program’s results.” The following analysis suggests that a fruitful avenue of
research is the assumed private beneficial effect itself. If government contracting officers are
unable to “pick the winners” and succeed only in sustaining underperforming firms, then the
proper question is not how much of the technology spills over, but rather whether a more
effective mechanism should be used to allocate national R&D resources.
Underperformance of SBIR awardees is not the end of the story. As Wallsten (2000)
points out, optimal government support for entrepreneurs should be targeted to marginal firms,
not the high performers who could obtain financing through private-sector means. While private
venture capitalists attempt to fund firms generating positive private benefits, public venture
capital targets firms with positive social benefits. In the presence of knowledge spillovers, the
social benefit is greater than the private benefit, leading private venture capital to require a
higher net expected return. Venture capitalists of all types, however, cannot determine in
advance which projects will be profitable. Empirical research suggests that they err significantly

LEWIS: PICKING WINNERS 6
on the side of funding many negative-net-return projects, relying on a few star performers to
make up the difference.
The margin of private funding thus falls below the margin of private benefit on a
continuum of possible net project returns (see Figure 2). If the private-funding margin is below
the social-benefit margin, then the marginal socially beneficial project would be funded by the
private sector in the absence of public support. In the presence of deadweight costs of taxation,
it will be not only difficult for public venture capital to produce a net social benefit; it will be
impossible. The study to follow does not attempt to identify the locations of these critical
margins. It is important to note, however, that any innate inability of the public sector to identify
productive investments will make it even more difficult to target firms in the possibly narrow
gap between negative social returns and availability of private funding. And of course, program
administrators give no indication that selecting subpar performers is deliberate or that their low
level of performance is monitored to correspond with the margin between privately funded and
unfunded projects. Publicly stated selection criteria include technical merit of proposed research
subjects, firm qualifications, and potential for commercial success and benefit to society
(www.SBIR.gov).
The SBIR program has objectives other than creating successful new firms, such as
helping disadvantaged business owners and equitably sharing revenue among different
constituencies. It is therefore possible that we can expect some level of underperformance. The
results here are important nonetheless; they are at odds with common perceptions of the
program’s results and align more closely with traditional theories of regulatory capture (Stigler
1971, Becker 1983). The amount of funding provided to protected groups is also very small: of
the nearly $40B disbursed through the program since its inception, only about 0.5% has gone to

LEWIS: PICKING WINNERS 7
historically underutilized business zones, 1.3% to minority-owned businesses, and 3.1% to
women-owned businesses.
The remainder of the paper is organized as follows. Section II examines the history of
the SBIR program and provides a brief survey of the literature on subsidized R&D, as well as
alternative research bearing on the subject such as confounding factors and the pitfalls of
government intervention in the small business R&D environment. I describe the dataset and
empirical approach in Section III and present results in Section IV. Section V concludes.
Section II: Background and Theory
The 1982 act of Congress establishing the SBIR program identified four broad goals:
“(1) stimulate technological innovation; (2) use small business to meet Federal research and
development needs; (3) foster and encourage participation by minority and disadvantaged
persons in technological innovation; and (4) increase private sector commercialization of
innovations derived from federal research and development.” Participating businesses must be
for-profit organizations with less than 500 employees and more than 50% ownership by United
States citizens. Following precursor programs in the 1950’s and 1960’s, an early pilot program
in the 1970’s, and congressional action in 1982, SBIR was subsequently strengthened and
expanded over a number of years. The Small Business Technology Transfer (STTR) program
was added ten years later, which is similar to SBIR but requires small businesses to partner with
universities, federally funded research and development centers (FFRDC) and other non-profit
institutions to encourage the transfer of technologies developed there into the private sector. The
programs were reauthorized through 2008 by the Small Business Reauthorization Act of 2000

LEWIS: PICKING WINNERS 8
(P.L. 106-554) and have since been further extended and expanded, the most recent of which
directs continuation through 2017.
The current law mandates that federal agencies with research and development budgets
exceeding $100 million set aside a percentage of this budget for small businesses. Under the
SBIR/STTR Reauthorization Act of 2011, this percentage is set to rise each year, from 2.5% in
Fiscal Year 2012 to 3.2% in 2017. The STTR program is smaller than SBIR, with funding of
0.35% in 2012 and similar incremental increases through 2016. Figure 3 shows funding totals by
agency, with a large majority provided through the Departments of Defense (DoD) and Health
and Human Services (HHS). Federal departments participating in the program also include
Agriculture, Commerce, Education, Energy, Homeland Security, Transportation, the
Environmental Protection Agency, National Aeronautics and Space Administration and National
Science Foundation.
Each participating agency periodically publishes a list of designated R&D topics and
selects awardees based on a competitive proposal process. The program has three phases (Small
Business Administration 2014). Phase I is the proof of concept stage in which participating
agencies award up to $150,000 over 6-12 months to establish the feasibility and commercial
merit of the winning project proposals. Small businesses awarded Phase I contracts continue to
Phase II at the discretion of the awarding agency and may be non-competitively awarded up to
$1 million in additional funding to continue the R&D effort for up to two years. Agencies may
exceed these caps by 50% at their own discretion, so effective limits in Phase I and Phase II are
$225,000 and $1.5 million, respectively. The Small Business Administration can waive the
limits, and awards frequently exceed these amounts, particularly for HHS medical R&D awards
(see Figure 4 and Figure 5). Phase III is the commercialization phase; prior awardees do not

LEWIS: PICKING WINNERS 9
receive any further SBIR/STTR funding, but work to obtain private funding and may sell the
products, processes or services developed in Phases I and II to the government through non-
competitive, sole-source contracts.
A. Early Theory on the Inappropriability of R&D Returns
Not long after inception of the SBIR/STTR program, new economic models built support
for the general consensus that government plays an important role in private sector R&D that had
grown since formalization by Arrow (1962). Romer (1986) incorporated technological change
into macroeconomic growth models and showed how innovation is critical to explaining the
ability of high-capital regions to consistently outperform poorer areas. Later works by Romer
(1990) and Grossman and Helpman (1991) highlighted the non-rival and only partially
excludable nature of technology and intellectual property. Given the importance of human
capital to long-run growth and the inability of innovators to capture the full returns, too few
resources are devoted to research in equilibrium.
Griliches (1958) built empirical support for the large externalities involved in research
and development. As early as 1979, however, Griliches pointed out problems with case studies
in assessing the contribution of research and development to economic growth. He noted that
econometric estimates of the production function may perform better than case studies by
ignoring the detail of outlying events to focus on total output or total factor productivity as a
function of past investments in innovation. But even these broader studies are questionable
given the challenge of differentiating price changes driven by product improvements from those
caused by changes in monetary factors or ordinary shifts in supply and demand. Even if such
price measurement difficulties can be sorted out, new ideas influence other research in addition
to having direct product effects. While some allocation of property rights is possible through the

LEWIS: PICKING WINNERS 10
patent system, resulting prices are non-linear and cannot be used to measure social returns
(Griliches 1992).
The more practical problem of data availability arises when studying small SBIR/STTR
firms that are not publicly listed; the absence of firm-level data on inputs, outputs, capital stocks
and other key variables makes productivity calculations difficult. Whatever the measurement
challenges, consensus has built that R&D generates a large social rate of return beyond any
private benefits. Jones and Williams (1998) find that common empirical estimates represent a
lower bound, and that optimal R&D as a percentage of GDP is two to four times actual
investment.
B. Support for the SBIR/STTR Program
A growing body of work specifically investigates the SBIR/STTR program and its
performance as a vehicle for public venture capital provision to small businesses. Audretsch,
Link and Scott (2002) conclude from their analysis of SBIR/STTR participant survey data and
case studies that the program indeed stimulates innovation and the commercialization of
technologies developed using federal resources. Case studies also suggest that award recipients
would not have carried out the funded research without government support and that their efforts
resulted in substantial spillover effects with broad benefit to society. A later similar study uses
survey data from the US National Academies’ division on Science, Technology, and Economic
Policy, which gathered information from founders, owners and employees of SBIR/STTR firms
(Audretsch 2003). Evidence from the survey supports the position that SBIR/STTR helps create
high-technology companies and strengthens the competitiveness of the US economy. Gans and
Stern (2000) take a different approach, using survey data from 100 SBIR/STTR projects to
examine the relationship between the appropriability of technology across various industries and

LEWIS: PICKING WINNERS 11
the activity of private venture capital. Their findings suggest that policy makers can play a role
in addressing challenging appropriability regimes facing small firms, such as intellectual
property or antitrust rules which restrict access to assets required for successful
commercialization. Lerner (1999) uses GAO survey data to construct treatment and control
groups of SBIR participants and non-participants, using a variety of sources to determine sales
and employment of awardees and matched firms. Phase II awardees performed significantly
better over the approximately seven year period than non-awardees in each control group.
Lerner and Kegler (2000) and Lerner (2002) examine the role of administrators of R&D
subsidy programs like SBIR/STTR and methods of assessing their performance. The authors
point out that “survey methods interview those with interest in continuing the project” and that
owners of SBIR/STTR firms have even formed a lobbying organization to advocate the program
to lawmakers. The program may nevertheless provide net benefits. Due to financing challenges
and information asymmetries, venture capital firms may be too big for small projects to be worth
their time, and agency conflict may lead to Akerlof’s (1970) lemons problem in the venture
capital market. Technological spillovers may be particularly acute for small businesses ill-
equipped to defend intellectual property or leverage market power to extract rents from the
products they develop. Public venture capital may then play a valuable role in certifying the
viability of small businesses to investors and incentivizing innovators to produce social gains
that cannot be privately captured (Meuleman and De Maeseneire 2012; Soderblom, et al., 2015).
Private sector investors maintain rigorous methods to select and protect their investments.
They thoroughly scrutinize business plans, less than 1% of which are accepted. They require
partners to certify the attractiveness of the investment as well as conferral of preferred stock with
restrictive covenants and representation on the board of directors. Funds are provided in stages,

LEWIS: PICKING WINNERS 12
each of which includes close monitoring. Lerner and Kegler (2000) describe these functions and
ask why SBIR/STTR administrators should perform them better than private agents. The paper
notes a number of reasons why they may not. Political connections may become more important
than technical promise. Past recipients may develop experience navigating red tape or
relationships with administrators that facilitate future selection processes. Project technical
proposals may not address many factors important to a firm’s success that would be evaluated by
a private venture capitalist, such as an entrepreneur’s experience, legal troubles, or side projects
that may distract from core areas of expertise.
C. International Evidence
Early empirical support for the importance of R&D to growth, and its under-provision by
the market, led to widespread government subsidies for innovative activities around the world.
In examinations of international programs the results are mixed, and point to several problems
with practical application of R&D support. One study of 2,000 Spanish manufacturing firms
receiving subsidies found that while some of these firms would cease their R&D activities in the
absence of government support, most of the funding goes to firms that would continue without it
(Gonzalez, Jaumandreau and Pazo 2005). Other evidence from Finland suggests that, while
social returns to subsidized research projects are as high as 30-50%, technological spillovers
from these projects are smaller than their effects on the profits of the targeted firms (Takalo,
Tanayama and Toivannen 2013). Bronzini and Iachini (2014) look at Italian investment
subsidies and find differential effects by firm size, with small businesses increasing their own
investment by approximately the amount of the subsidy while spending at larger businesses is
not affected. Montmartin and Herrera (2015) account for the strong spatial dependence of R&D

LEWIS: PICKING WINNERS 13
support programs across 25 OECD nations between 1990 and 2009 and find that, while tax
incentives increase business-funded R&D, subsidies are more likely to substitute for it.
D. Geographical Effects of R&D Subsidies
Krugman (1991), following Marshall (1920), models patterns of development based upon
transportation costs, economies of scale and manufacturing as a share of national income, and
emphasizes spillovers and increasing returns that drive localized growth. Building on this
theory, Jaffe, Trajtenberg and Henderson (1993) use patent citations to identify patterns of
related research and development activity. Patent citations are more likely to come from the
same state and metropolitan statistical area as the cited patents, suggesting that local synergies in
innovation are important. Regional effects are also found in industry-specific knowledge
spillovers: the degree to which an industry is geographically concentrated is directly related to
the importance to the industry of new economic knowledge (Audretsch and Feldman 1996).
Most SBIR/STTR firms reside in either California or Massachusetts (see Figure 6), with highly
concentrated funding in such places as Los Angeles, Boston and Washington, DC (Figure 7).
Localized synergies can be a blessing and a curse for subsidy programs. They may magnify
beneficial effects by providing a network of support for new business owners within their local
community (Huggins and Thompson 2015), but they also create political challenges for
programs funded by tax dollars at the federal level, which generate pressure to fund less
innovative businesses in other districts.
E. Firm Age, Size, and the Contribution of Small Businesses to Growth
A key assumption of lawmakers developing the SBIR/STTR program was that
externalities in the market for innovative products are particularly acute for small businesses, and
that these externalities hurt a portion of the economy that is especially important to economic

LEWIS: PICKING WINNERS 14
development and growth. A growing body of research, however, calls into question early
assumptions about the economic role of small businesses. Several confounding factors are often
cited. Davis, Haltiwanger and Schuh (1996) point out that while gross rates of job creation are
significantly higher for small businesses, survival rates are poor, resulting in a net level of job
creation that is far lower. Studies find a vital role in overall job growth played by a few very
small firms (Anvadike-Danes, et al. 2015), but these studies are challenged by others which note
that age, not size, is the operative characteristic.
Covariance between age and size makes the issue a difficult one to resolve. Decker, et al.
(2014), finds that startups currently generate 20% of new jobs, but most exit within 10 years. A
small fraction of young firms grow strongly and make up for most of the job losses created by
those that don’t survive. This highly skewed distribution is important to understanding the
challenge of subsidy programs illustrated in Figure 2. While the diagram depicts a continuous
range of potential project returns, empirical evidence suggests that the underlying distribution
displays strong positive skew. In addition to the locations of the social-benefit and private-
funding margins, the location of the modal return may increase or decrease the number of firms
falling target range for optimal public subsidies.
If age is indeed the key factor, and is correlated with size, then the focus of the
SBIR/STTR program on small firms may be justifiable: targeting small firms will incidentally
have disproportionate effects on young firms, a few of which are likely to become star
performers. Of 6,967 businesses receiving SBIR/STTR awards between 2007 and 2012 and
matched to the NETS database, approximately 25% were established prior to 1997. These older
firms received 42% of the total funding. More than 40% of 2007-2012 awardees started prior to
2002; these firms received 63% of the funding. Small businesses that have remained small (and

LEWIS: PICKING WINNERS 15
hence eligible for the SBIR/STTR program) for more than five to ten years are likely not the star
performers ostensibly targeted by the program, but they receive a majority of the subsidies.
A criticism that underlies many of those discussed so far is that public solutions to
inefficiencies in private markets face challenges of their own. Program administrators are likely
no more skilled than private venture capitalists at selecting productive firms and viable projects,
and have weaker incentives to do so. Stigler (1971), Peltzman (1976) and Becker (1983)
examine the nature of competition for government subsidies, asking whether market failures in
the provision of R&D financing to small businesses can be corrected by government action. The
presence of externalities does not by itself justify intervention. I now turn to this question.
Section III: Dataset and Empirical Approach
The SBIR/STTR program office publishes all past awards. I use firm names and DUNS
numbers to match awardees with detailed firm information in the NETS. The procedure
generates a list of 6,967 matched firms that received awards between 2007 and 2012. Matching
SBIR/STTR awards with NETS firm performance data by DUNS number is a challenge due to
reporting practices of federal agencies. Awards are reported directly by the SBIR/STTR
program office, but DUNS number/firm name pairs are reported separately from funding data,
and inconsistent firm name structures make it difficult to automatically pair DUNS numbers with
funding lines. I paired firm DUNS numbers with SBIR/STTR-reported award data by manually
matching similar firm names across the 34,553 distinct names reported by the program office.
(For example, a firm name reported in one funding line may differ from another by an omitted
comma or period.) DUNS numbers then provided the means to match SBIR/STTR funding to
firm performance data in the NETS.

LEWIS: PICKING WINNERS 16
A. Obstacles to Unbiased Analysis
Analysis of the program presents a number of other challenges. First, we would expect
the effects of regulatory capture to vary over time as firms learn to manipulate administrative
processes. Second, only a small number of the many relevant differences between firms are
observable, potentially leading to omitted variable bias. Third, the effects of funding on firms in
different categories, such as industry or geographic location, are likely to operate with different
lags. Fourth, awards are correlated over time, with recipient firms far more likely to continue to
win awards than their unsuccessful peers. Fifth, firms must be measured consistently: more
accurate data are likely available for older and larger firms, leading to bias in datasets derived
from heterogeneous sources. I address each of these concerns in turn.
Early examinations of SBIR were limited by the recent establishment of the program.
Firms were unlikely in the first few years to have been able to capture regulators to a degree
sufficient to generate rents. If regulatory capture is indeed a problem, we would expect early
positive results to reverse in later years as firms paid less attention to market success and more
attention to government subsidy. Indeed, the statutory size limit of 500 employees required to
keep receiving subsidies incentivizes firms to remain small as their competitors grow, although
the precise effects of this threshold are difficult to quantify given the heavily skewed distribution
of firm sizes. The dataset here begins 25 years after the program started, which accounts for
potentially delayed effects of regulatory capture. Figure 1 illustrates that the program achieved a
relatively steady state in overall funding levels over the past 10 to 15 years.
Another problem is missing data and the infeasibility of using fixed effects to account for
it. Simple regression analysis fails ignores significant unspecified differences between regions,
industries, and firms, while heterogeneous lag structures associated with industry-unique

LEWIS: PICKING WINNERS 17
varieties of innovation limit the usefulness of panel data (as do substantial data entry errors,
which create amplified attenuation bias in fixed-effects analysis). Problems associated with data
unavailability are described in more detail in Griliches (1992) and Zuniga-Vicente, et al. (2014).
This analysis confronts these challenges by aggregating awards across a six-year period to
address heterogeneous lag structures, and applying various firm matching techniques to generate
treatment and control groups addressing non-temporal heterogeneities across observations.
Aggregation also overcomes lags in data reporting procedures used in compilation of the NETS
database. The drawback to examining the six-year period in aggregate is that it underestimates
the effect: awards received in the last month of the period are treated the same as those received
in the first month, though program participation has clearly had insufficient time to take effect.
Advantages are the model’s parsimony and tendency to underestimate rather than overestimate
the effect of SBIR/STTR participation on firm performance.
Aggregation of awards over the six-year period also addresses what is perhaps the most
significant challenge to program assessment: the tendency of the same firms to consistently win
SBIR/STTR awards over many years. Serial correlation of awards makes it difficult to
distinguish growth due to innovation from growth due to regulatory capture. Accounting for this
correlation is a challenge across potential specifications. Limiting the analysis to only those
firms that won no further awards after the period in question cuts the sample size to an
unworkably small number of firms. A snapshot in time with a follow-up many years later
ignores the intervening period over which growth may have been achieved through product
innovation or through further subsidies: the two cases are not distinguished, and which is driving
firm growth is left undetermined. The analysis here lengthens the interval over which
independent variables are captured to correspond with a period of time long enough to observe

LEWIS: PICKING WINNERS 18
their effects. As mentioned before, this leads to underestimation by treating early awards the
same as later awards, but it solves the problem of serial correlation that leads to confounding of
innovation and regulatory capture effects. Funding levels are matched across treatment and
control groups, eliminating unspecified government intervention as a possible source of positive
bias in estimates of firm growth due to innovation and market success.
Consistent measurement of firm performance across the full range of data is also critical
to eliminating bias in the estimation. Distinct data sources provide more or less accurate data on
different categories of firms. For example, larger, listed firms are well represented in SEC
filings while data on smaller, independent firms are often gathered from surveys or newspaper
accounts of noteworthy events like bankruptcies. Discrete data sources contain unique biases
that will be applied non-uniformly across the dataset, potentially resulting in biased estimates.
As discussed above, surveys present particular challenges given the incentive of participants to
bias answers in ways that encourage continuation of program funding. Structural or cultural
variation between industries may also lead to inconsistent reporting practices between subgroups
of firms with correlated performance measures. Data collection for this investigation was
uniform across firms, relying upon NETS employment and sales data gathered outside the
context of the SBIR/STTR program. While the NETS dataset is more uniform and objective, it
suffers from problems of lagged and incremental reporting. It may take up to two years for
changes in firm size to be reported in the data, and firms tend to report employment and sales
levels in round numbers that jump sharply at arbitrary thresholds (such as 100 employees).
Again, aggregation across a lengthy period of time helps to ensure important medium-term
effects are captured and short-run variability adequately smoothed.

LEWIS: PICKING WINNERS 19
B. Dataset and Analytical Approach
The sample generated in this manner allows for more robust analysis than previously
possible. The large dataset makes it possible to construct closely matched control groups based
on detailed firm data. I examine three general model specifications. The first compares firms
that only received Phase I awards (the control) to those that progressed to Phase II (the
treatment). The second allows for an improved matching procedure by expanding the set of
potential controls to the 37,465 non-SBIR/STTR firms that had active R&D contracts with the
federal government between 2007 and 2012 (as reported in the Federal Procurement Data
System); of these, complete data are available for 35,172 firms. I examine Phase I firms in more
detail by comparing SBIR/STTR firms that received only Phase I awards during the 2007 to
2012 period (the treatment) with non-participating firms (the control). The third specification
again uses the expanded control candidate set and improved matching procedure, but compares
control firms to successful SBIR/STTR participants who won Phase II awards. Two additional
variations examine the robustness of the findings by duplicating the second and third
specifications while removing the requirement for a geographic match. This modification
expands the sample size and develops the picture of program effects and sources of bias.
Specification 1 replicates previous studies that compare firms progressing normally
through public venture capital programs with those that begin but do not continue on to
subsequent program phases (Lerner 1999; Soderblom, et al. 2015). Eliminating firms with
missing data reduces the original 6,967 SBIR/STTR firms to 6,794. Of these, 3,138 received
only Phase I funding and failed to progress to Phase II; 3,656 of the firms received Phase II
funding. I do not apply propensity score matching in this specification due to the limited size of
the population of potential control firms; rather, I trim the dataset to Phase II treatment firms that
LEWIS: PICKING WINNERS 20
have precise matches with Phase-I-only firms. I match Phase II awardees to firms of the same 8-
digit Standard Industrial Classification (SIC) code with the closest level of employment (required
to be within 10 employees) and annual sales (required to be within $500,000). The annual sales
requirement combined with similar employment levels proxies for firm labor productivity in
addition to serving as another measure of overall size. The large size of the full sample allows
firms with insufficiently precise matches to be dropped, resulting in a final sample size of 3,098
firms (1,555 in the treatment group and 1,543 in the control group).
Table 2 displays summary statistics for each group. Treatment firms received positive
SBIR/STTR Phase II awards, while control firms received Phase I awards only. By construction,
mean employment levels match at approximately 3.5 employees and annual sales at
approximately $350,000. Using only this limited number of matching variables, firms in the
treatment group received significantly more Phase I award funding over the seven-year period.
This makes sense: firms progressing to Phase II performed better than their counterparts who
did not advance and went on to win more future Phase I awards as well. The propensity of
initially successful firms to win more Phase I contracts in future years makes them systematically
different from matched control firms leading to the biased results described below.
I build on this procedure in Specifications 2 and 3 making use of the larger data set that
includes non-participating federal R&D contractors. To improve the quality of the matches
without reducing the sample to an unacceptable size, I match treatment firms to similar firms that
did not participate in the SBIR/STTR program, but did have government R&D contract vehicles
active in the Federal Procurement Data System (FPDS). Research and development contracts are
defined by an FPDS Product/Service Code prefix of A or particular M-prefix codes associated
with operation of government-owned, contractor-operated R&D facilities (see General Services

LEWIS: PICKING WINNERS 21
Administration 2011). The universe of firms included as candidates for the control group
contains 35,172 private-sector firms with active federal R&D contract vehicles in FPDS between
2007 and 2012 that could be matched to NETS entries by DUNS number and do not have
significant missing data. The research discussed in Section II suggests that SBIR/STTR
participation may serve a certification function for firms seeking private sector venture capital
financing; receipt of non-SBIR/STTR R&D funding would serve a similar function, making
other federal R&D contractors plausible matches for SBIR/STTR treatment firms along this
dimension.
In Specifications 2 and 3, I include additional criteria in matching treated SBIR/STTR
recipient firms to control firms. In the models requiring precise characteristic matches, control
firms must be in the same industry as the corresponding treatment firm (defined by 8-digit SIC
code), within 10 employees in size and within $500,000 in annual sales, as in Specification 1. In
addition, they must be located in the same core-based statistical area (CBSA) as the treatment
firm. Geographic matching is important for the reasons discussed in Section II such as network
externalities and supply chain synergies in addition to the hypothesis in Lerner (1999) that
venture capital tends to disproportionately affect local firms. The treatment and control groups
thus contain similar numbers of firms by SIC and CBSA, with similar levels of employment and
annual sales. All firms come from the general pool of federal R&D contractors.
I also apply propensity score matching to the samples in Specifications 2 and 3, which
allows inclusion of more matching variables without imposing unacceptable limits on sample
size. The expanded set of explanatory variables is included in the probit model estimating
probability of treatment. The model uses the number of firms in the same 4-digit SIC and CBSA
rather than requiring firms to be in the same city and industry. Employment and the logarithm of

LEWIS: PICKING WINNERS 22
annual sales are included along with firm age and total federal funding (SBIR/STTR funding or
otherwise for non-participating firms). Non-SBIR/STTR federal funding by firm was extracted
from FPDS. These additional variables are not included in the precise-match models since they
would unacceptably reduce the sample size. Summary statistics for the full population of Phase I
and Phase II firms and the population of potential control firms are provided in Table 3.
SBIR/STTR firms employ an average of 8 to 12 people and have annual sales of $1.2M to
$2.0M. They are 10-13 years old on average. Phase II firms tend to be larger and older. Non-
participating federal R&D contractors are also included in Table 3; as expected, they tend to be
significantly older and larger than SBIR/STTR firms, with averages of 115 employees, $17.1M
in annual sales, and 23 years of age. I match treatment firms in each specification with their
three nearest neighbors by propensity scores estimated in the probit model to form the control
group (in contrast to the precise-match model, no caliper restrictions are included).
I then compare treatment and control groups by growth in employment and growth in
annual sales over the six-year period using two distinct methods. A difference-in-difference
model uses raw reported values of employment and sales at the beginning and end of the period
to estimate the treatment group change relative to that experienced by the control group. In the
second method, estimation of the average treatment effect on the treated (ATT) combines the
beginning and ending values into an overall growth variable, calculated as (Value2012 –
Value2007) / Value2007. I adjust sample variances of propensity score matching estimators of
the ATT for the first-stage estimation procedure using distributions derived by Abadie and
Imbens (2012). Firms that are not in business in either 2007 or 2012 have values of employment
and sales coded to zero in that year, with firms coming into existence showing growth of 100%

LEWIS: PICKING WINNERS 23
and firms going out of business showing growth of -100%. A model specification that drops
these entering and exiting firms from the dataset (not presented here) produces similar results.
Table 4 displays treatment and control group summary statistics for the second
specification. Treated firms in Specification 2 received an average of $244,037 in Phase I
awards between 2007 and 2012. Their average 2007 employment level of 2.32 employees
matches that of the control group as does their mean 2007 sales of $221,497. A total of 1,902
firms met the precise matching criteria and are included in the model (885 treatment firms and
1,017 control firms). The probit regression estimating treatment propensities is presented in
column 1 of Table 5.
The theory presented above does not provide a clear prediction for how these firms will
perform. Winning a Phase I award may indicate that the firm was judged highly innovative by
competent panels of experts in their field and can therefore be expected to perform well. It may
also serve as a certification function to outside investors, allowing the firm greater access to
private-sector financing. On the other hand, failing to progress to Phase II may suggest that
these firms have trouble translating innovative ideas into practical applications and are therefore
likely to perform poorly relative to non-participant firms.
Specification 3 matches full participants in the SBIR/STTR program – recipients of both
Phase I and Phase II funding – to firms that did not participate. I use the same matching criteria
as Specification 2 along all other dimensions. As Table 6 shows, these firms tend to be slightly
larger than Phase-I-only firms in Specification 2. The treatment group averages 4.36 employees
and $454,356 in annual sales, versus 4.01 employees and $418,065 in sales for the control group.
Treated firms received an average of $462,057 in total Phase I awards and $1,826,980 in Phase II
awards between 2007 and 2012. The sample includes 828 firms in the control group and 963

LEWIS: PICKING WINNERS 24
firms in the treatment group. The probit regression estimating treatment probabilities is included
column 3 of Table 5.
For Specification 3 firms that participated successfully in the SBIR/STTR program from
beginning to end, predictions of the conventional analysis and those of the regulatory capture
hypothesis are sharply different. The conventional analysis suggests that public venture capital
provides the startup funding required to turn innovative ideas into salable goods, and that
government subsidies will stimulate growth as participating businesses commercialize the
products developed during the program. How much of this benefit is captured by the awardee
and how much spills over to other firms, thus producing larger social benefits, is an open
question, but we should nevertheless see some degree of above-average growth at the firm level.
Regulatory capture, on the other hand, implies that participating firms will specialize not in
innovation, but in obtaining subsidies. The program may even attract losers in the competition
for private venture capital, further decreasing the quality of the talent pool and lowering growth
levels below the overall average.
C. Robustness of Estimated Effects
Two additional specifications test the robustness of the analysis by changing the
matching criteria and expanding the sample size. In Specifications 4 and 5, I remove the
requirement that firms must match to a similar firm in the same CBSA. Table 7 and Table 8,
respectively, display the summary statistics. Specification 4 uses a control group that is not
matched by CBSA to test the effect on treatment firms of receiving positive Phase-I-only
funding. Firms are of similar size, with about 3.5 employees and $370,000 in annual sales at the
beginning of the period in 2007. The sample size of precise-match firms is 1,955 in the
treatment group and 2,448 in the control group. Specification 5 also uses non-CBSA matching,

LEWIS: PICKING WINNERS 25
but compares control firms to full program participants receiving Phase II funds. The firms are
slightly larger on average than Specification 4 firms, with about 6 employees and $700,000 in
annual sales. The sample includes 1,933 treatment firms and 2,390 control firms. The
propensity score matching models are similar to those in Specifications 2 and 3, but remove the
geography variable from the probit estimation of propensity scores, which instead includes the
total number of firms in the same 4-digit SIC code across the United States rather that in the
same CBSA. This probit estimation is included in columns 2 and 4 of Table 5.
Theory reviewed in Section II suggests that any bias introduced to the model by
removing geography from the matching procedure is likely to be positive. SBIR/STTR funding
is highly concentrated geographically (see Figure 7), and firms residing within industry clusters
are likely to affect one another through knowledge spillovers, shared supply chains, concentrated
customer bases, and other such agglomeration effects. Matched treatment and control firms from
the same CBSA will experience similar geographic synergies, making the difference in their
performance levels smaller. Control group firms from other cities, however, will not share
industry cluster characteristics. We would expect the difference in performance between these
control firms and SBIR/STTR participants to be larger.
D. Model Specification
I first use a difference-in-difference model to compare the employment and sales growth
of treatment firms with those of control firms between 2007 and 2012. This model is applied to
both the limited precise-match samples as well as the broader treatment and control groups
matched using propensity scores. With the matching procedure designed to account for non-
orthogonal differences between groups, I use ordinary least squares to estimate
𝑦𝑦𝑖𝑖𝑖𝑖 = 𝛼𝛼 + 𝛽𝛽𝑡𝑡𝑖𝑖 + 𝛾𝛾𝑎𝑎𝑖𝑖 + 𝛿𝛿𝑡𝑡𝑖𝑖𝑎𝑎𝑖𝑖 + 𝜀𝜀𝑖𝑖𝑖𝑖

LEWIS: PICKING WINNERS 26
where 𝑦𝑦𝑖𝑖𝑖𝑖 is the level of sales or employment for firm i in period 𝜏𝜏, 𝑡𝑡𝑖𝑖 is a dummy variable
indicating treatment status of firm i, 𝑎𝑎𝑖𝑖 is a dummy variable indicating either 2007 or 2012
values of the dependent variable, and 𝜀𝜀𝑖𝑖𝑖𝑖 is an error term that is assumed orthogonal. The
coefficient of interest is 𝛿𝛿, which is the difference-in-difference estimator:
𝛿𝛿 = �𝑦𝑦�(𝑡𝑡𝑡𝑡𝑡𝑡𝑡𝑡𝑡𝑡)(𝑡𝑡𝑎𝑎𝑡𝑡𝑡𝑡𝑡𝑡) − 𝑦𝑦�(𝑡𝑡𝑡𝑡𝑡𝑡𝑡𝑡𝑡𝑡)(𝑏𝑏𝑡𝑡𝑎𝑎𝑏𝑏𝑡𝑡𝑡𝑡)� − �𝑦𝑦�(𝑐𝑐𝑏𝑏𝑐𝑐𝑡𝑡𝑡𝑡𝑏𝑏𝑐𝑐)(𝑡𝑡𝑎𝑎𝑡𝑡𝑡𝑡𝑡𝑡) − 𝑦𝑦�(𝑐𝑐𝑏𝑏𝑐𝑐𝑡𝑡𝑡𝑡𝑏𝑏𝑐𝑐)(𝑏𝑏𝑡𝑡𝑎𝑎𝑏𝑏𝑡𝑡𝑡𝑡)�
Robust standard errors are clustered by 6-digit North American Industrial Classification System
(NAICS) code. Other specifications, not reported here, used alternatives such as CBSA to
cluster the standard errors; this had no significant effect on the results.
The probit model used to estimate propensity scores is specified as
𝑡𝑡𝑖𝑖 = 𝛼𝛼 + 𝛽𝛽𝛽𝛽 + 𝜀𝜀𝑖𝑖
where 𝑡𝑡𝑖𝑖 is a treatment status dummy and 𝛽𝛽 is a matrix of independent variables including the
number of firms in the same CBSA and/or industry, employment in 2007, log of sales in 2007,
firm age in 2012 and the log of total federal funding to the firm. I estimate ATT using
propensity-score-matched treatment and control groups according to
𝐸𝐸[𝑌𝑌1𝑖𝑖 − 𝑌𝑌0𝑖𝑖 | 𝐷𝐷𝑖𝑖 = 1] = 𝐸𝐸[𝑌𝑌1𝑖𝑖 | 𝐷𝐷𝑖𝑖 = 1] − 𝐸𝐸[𝑌𝑌0𝑖𝑖 | 𝐷𝐷𝑖𝑖 = 1]
where 𝐸𝐸[𝑌𝑌1𝑖𝑖 | 𝐷𝐷𝑖𝑖 = 1] is the estimated value of the treatment group outcome (change in
employment or annual sales) given treatment and 𝐸𝐸[𝑌𝑌0𝑖𝑖 | 𝐷𝐷𝑖𝑖 = 1] is the counterfactual control
group outcome assuming treatment. Matched controls supply counterfactual outcome estimates.
In addition to robustness checks using the non-geographically matched sample, I also
include ordinary and weighted least squares estimates of the form
𝑦𝑦𝑖𝑖 = 𝛼𝛼 + 𝛽𝛽𝑡𝑡𝑖𝑖 + 𝛾𝛾𝛽𝛽 + 𝜀𝜀𝑖𝑖
where 𝑦𝑦𝑖𝑖 is either the percent growth in employment or the percent growth in annual sales for
firm i between 2007 and 2012. The treatment dummy, 𝑡𝑡𝑖𝑖, indicates SBIR/STTR participation

LEWIS: PICKING WINNERS 27
with 𝛽𝛽 the coefficient of interest. The independent variables included in the propensity scoring
probit regression model are also included here as controls in the matrix 𝛽𝛽. Error is again
captured in 𝜀𝜀𝑖𝑖 and is assumed orthogonal. In addition to OLS, the model is estimated using
frequency weights generated by the propensity score matching procedure. I weight each
treatment and control observation by the number of corresponding matches from the other group,
giving greater weight to firms possessing broader similarities to their peers.
Section IV: Results
The objective of the three primary model specifications is to answer several questions
about the performance of the U.S. government’s public venture capital program. Is the
government, at a large scale and over a long period of time, capable of stimulating productive
investment in R&D by small, innovative firms? Has it been successful at replicating the private
venture capital industry at a national scale using bureaucratic structures? Does the US economy
perform better when agencies deliberately stimulate R&D investment at the most basic level of
the small business? There are two primary competing hypotheses. The consensus in the
literature examining the SBIR/STTR program is that it has indeed been a success, and that
subsidies create innovation and growth that spills over into the broader economy, providing
social benefits beyond the impact to individual firms. A second body of literature focuses on
public choice theory and the economics of rent seeking; it leads to the conclusion that such
programs are unlikely to drive sustained high levels of performance given the weak and even
perverse incentives offered to program participants and administrators.

LEWIS: PICKING WINNERS 28
A. Specification 1: Phase II Recipients versus a Phase-I-Only Control Group
Specification 1 replicates what is arguably the most convincing technique employed to
date that suggests the program has been a success. Lerner (1999) supplements the large number
of case-study-based analyses of the SBIR/STTR program with a broad look at the data. A
comprehensive dataset was unavailable at the time the study was conducted, but the results can
be replicated using modern data and similar methods. Table 9 displays t-tests for equality of
means across the full treatment- and control-firm candidate populations in each model
specification. The mean employment level for the 3,138 Phase-I-only firms increases by 71%
between 2007 and 2012, compared to 66% for the 3,656 Phase II firms; this difference is not
statistically significant. A broad look at sales growth produces a similar result: Phase-I-only
firms experienced mean growth in annual sales of 125% (in constant 2012 dollars) compared to
120% for the treatment group. This difference in means is again insignificant.
A treatment sample matched to control group candidate firms by industry, sales and
employment, however, produces more interesting results. Table 10 (columns 1 and 2) presents
the results of the precise-match difference-in-difference model comparing employment and sales
growth of treated firms receiving Phase II awards to control firms that did not progress beyond
Phase I. As in Lerner (1999), the treatment group outperforms the control group. Mean annual
sales rises by $83,600 between 2007 and 2012 for Phase II firms compared to Phase-I-only
firms, and the result is highly significant, with a p-value of 0.004. These treated firms also
experience average relative growth of 0.377 employees over the period, but the result is not
statistically significant (p-value 0.165). (Sort order is important to the matching procedure, and
some re-sorted specifications achieve a positive result significant at the 10% level.) Figure 8
graphically depicts the difference-in-difference relationship. There are a number of reasons,

LEWIS: PICKING WINNERS 29
however, why these results are suspect. Industry-, sales- and employment-level matching is
insufficient to capture all of the relevant differences between the groups. More awards, rather
than any resulting innovation and commercialization, may have produced the observed growth.
Geography, and the accompanying network effect, is a significant factor not captured in
the analysis that likely leads to bias. Columns 3 and 4 of Table 10 show a model that also
requires firm matches to be in the same CBSA; including this matching variable reverses the sign
of the results and eliminates statistical significance, though at a reduced sample size of 635
treatment firms and 657 control firms. Columns 5 and 6 report results of a similar model with
firms also matched on total Phase I awards rather than CBSA (using both reduces the sample size
to an unworkably small number of firms). Again, the signs reverse and the results lose statistical
significance. Matching is more difficult in this case, with 1,276 treatment firms matched to only
463 control firms.
B. Specification 2: Phase I Recipients versus a Non-SBIR/STTR Control Group
Specification 2 examines in isolation the control group from Specification 1: firms that
were awarded Phase I contracts but failed to progress to Phase II during the 2007 to 2012 period.
In the overall sample, the 3,138 Phase-I-only firms experienced average employment growth of
71% compared to 134% in a full sample of 35,172 non-SBIR/STTR firms (see Table 9). A t-test
that the latter exceeds the former rejects the null hypothesis at a level of significance of 0.0001.
Annual sales growth also reveals underperformance of Phase-I-only firms, with a 125% increase
in the treatment group and 252% for non-participants.
The Specification 2 precise-match difference-in-difference model compares treatment
firms to other government R&D contractors that did not participate in the SBIR/STTR program
by matching on CBSA in addition to the Specification 1 parameters of industry, sales and

LEWIS: PICKING WINNERS 30
employment. This model finds significant underperformance of Phase-I-only firms. Annual
sales and employment decline by $1.88M and 11.7 employees relative to the control group
(Table 11, columns 1 and 2; and Figure 9). These declines are highly statistically significant,
with p-values of 0.006 and 0.005, respectively.
Rather than limiting the sample to only those firms with precise control group matches,
the propensity scoring method uses the probit model in Table 5 to estimate probabilities of
inclusion in the treatment group based on a vector of firm characteristics. This technique finds
the best matches available from the 35,172 potential control group firms that had active
government R&D contracts over the period. Treatment and control groups are then used to
estimate the ATT. Matching treatment to control firms based on propensity scores allows for
matching on the additional characteristics of firm age and total federal funding without excessive
reductions in sample size. It produces negative coefficients, as reported in Table 12.
Employment growth in the Phase I treatment group is 383% lower than the control group over
six years, but with an insignificant p-value of only 0.162. Sales growth is also lower (-312%)
and lacking statistical significance, with a p-value of 0.196. I apply a difference-in-difference
model similar to the precise-match model employed above, but using the treatment and control
groups generated by propensity score matching. The results presented in Table 13 are even more
dramatic than those from the smaller samples derived from precise matching on firm
characteristics. Phase-I-only firms added 13.7 fewer employees and $2,370,000 less in annual
sales than the control group over six years, with p-values of 0.000 and 0.002, respectively.
Unlike the ATT reported above, however, standard errors in this model do not account for
propensity score estimation in derivation of the treatment and control groups.
LEWIS: PICKING WINNERS 31
Specification 4 is similar to Specification 2, without requiring that matched control firms
be in the same CBSA as their treated paired firm. Here I examine the bias effect suggested by the
inclusion of CBSA in the Specification 1 model. Based on the theory of agglomeration
synergies, dropping the CBSA matching requirement should bias the results upward in absolute
value. In the precise-match difference-in-difference model of Specification 4, Phase-I-only firms
experience mean declines in annual sales and employment of $1.95M and 10.6 employees
relative to their peers, with highly significant p-values of 0.004 and 0.012, respectively (Table
11, columns 5 and 6; Figure 11). The propensity score matching model estimates the ATT for
employment is a drop of 338%, with a p-value of 0.028. Sales growth is also poor, dropping by
298% relative to the control, with a p-value of 0.035 (Table 12). Difference-in-difference
estimates calculated using the propensity-score-matched treatment and control groups again
provide even more sharply negative results, as reported in Table 13, columns 5 and 6.
I contrast these results to those in Specification 2, in which firms required a
geographically matching control firm to be included in the sample. Phase-I-only firms in
Specification 4 performed at levels similar to the non-geographically-matched control group
($1.95M and 10.6 employee mean decline) as compared to Specification 2, which did require a
geographic match ($1.88M and 11.7 employee mean decline). Thus, for Phase-I-only firms we
do not see strong bias associated with the geography variable.
The finding that Phase-I-only firms underperform challenges the certification hypothesis
that SBIR/STTR awards serve as a signal to outside investors, but it is not conclusive. Private
venture capitalists may observe the failed attempt to progress to Phase II and choose not to
invest. The early success and later failure may result from clever innovation combined with a

LEWIS: PICKING WINNERS 32
management team that is unable to capitalize on the opportunity. Such management difficulties
would likely be observed by private investors. Ultimately the results are inconclusive.
C. Specification 3: Phase II Recipients versus a Non-SBIR/STTR Control Group
Specification 3 is more revealing. It examines successful SBIR/STTR participants who
continued to progress through the program and finds they also performed significantly worse
than similar firms over the six-year period. Compared to the full non-participant group of 35,172
firms growing at average rates of 134% in employment and 252% in sales over six years, the
3,656 firms receiving Phase II funding grew at only 66% and 120%, respectively (see Table 9).
In the precise-match difference-in-difference model, annual sales declined by $1.09M and
employment by seven employees relative to the control group, with p-values of 0.049 and 0.067,
respectively (Table 11, columns 3 and 4; and Figure 10). Propensity score matching provides
additional evidence of underperformance for Phase II award recipients (Table 12), with an ATT
of -217% growth in employment and -250% growth in sales (with p-values of 0.002 and 0.001,
respectively). Difference-in-difference estimates in Table 13 show Phase II firms growing by 27
fewer employees (p-value = 0.001) and $6.07M less in annual sales (p-value 0.012) than
matched control firms (again with standard errors not accounting for first-stage propensity score
estimation).
Similar to Specification 4, Specification 5 examines the findings in Specification 3 by
removing the geography variable. Phase II participants in Specification 5 experience similarly
poor performance, with declines of $1.83M and 14.4 employees (p-values 0.000) in the precise-
match difference-in-difference model (Table 11, columns 7 and 8; Figure 12). Propensity score
matching produces an ATT of -269% in employment growth and -320% in sales growth with
strong statistical significance (p-value 0.000) and the propensity-score-matched difference-in-

LEWIS: PICKING WINNERS 33
difference model produces even stronger evidence of underperformance (Table 13, columns 7
and 8).
Unlike Phase-I-only firms, performance of this treatment group relative to the control
($1.83M and 14.4 employee mean decline; see Table 11) was greater than that of the
geographically-matched sample in Specification 3 ($1.09M and 7 employee mean decline), with
stronger levels of statistical significance. As we saw in Specification 1, regional agglomeration
effects may account for this bias upward in absolute value. Firm performance relative to
neighboring firms is more similar, while performance differences relative to a national baseline
are magnified. I speculate that the absence of this effect for Phase-I-only firms may reflect a
failure to integrate with the local community of similar firms.
The finding in Specification 3 provides support for the hypothesis that SBIR/STTR
participants excel not at innovation, but at remaining small and collecting subsidies while their
peers grow. The Specification 3 result is also interesting in comparison to Specification 2. Both
groups participated in the program, but firms with longer periods of participation and higher
levels of funding experienced levels of poor performance similar to those that failed early on. It
is apparent from this result that failure in the SBIR/STTR program (i.e., non-progression to
Phase II) is not the operative indicator of broader market failure.
D. Alternative Models: Ordinary and Weighted Least Squares
Ordinary and weighted least squares estimates of treatment effects presented in Table 14
similarly suggest that SBIR/STTR participants grow more slowly than their peers. Using the
propensity scores estimated in Table 5, I again compare the matched treatment and control
groups used above in an ordinary least squares model that includes the treatment dummy as an
independent variable. I also use the number of firms calculated to be matches to weight each

LEWIS: PICKING WINNERS 34
observation in the model. Positive Specification 1 results reported above are absent in this
model, while in Specifications 2 and 3 participating firms are again shown to grow significantly
slower than their peers.
Section V: Conclusion
Competing schools of thought on the effects of government subsidies on private R&D
efforts come to different conclusions. One school emphasizes the externality problems
associated with private innovation. Non-appropriable, non-rival ideas spill over to the broader
marketplace, producing large social benefits that can only be partially captured by individual
investors. Agency conflict in venture capital markets excludes small, dynamic innovators from
competition for private-sector financing. This line of reasoning arrives at the conclusion that
government subsidies are necessary to correct market failures and maximize innovation and
growth of the national economy. The alternative literature asks not whether market failures
exist, but whether government agents are able to correct them. Proponents of this school suggest
that bureaucrats administering subsidy programs do not have the strong incentives faced by
private investors to select high-quality projects and carry them through to commercialization.
Applicants for the subsidies are incentivized not to innovate and grow, but to negotiate the
process to win government contracts and to remain small and thus eligible for funding.
The conclusion of this investigation is that support for the former position seems to rely
on outlying case studies and on evidence provided by individuals motivated to paint the program
in a positive light. Using more objective methods and sources of data, recipients of SBIR/STTR
funding are found to dramatically underperform relative to their peers. In the most telling model
presented here (Specification 3), program participants that progressed successfully through the

LEWIS: PICKING WINNERS 35
program experienced growth in annual sales more than $1.09M , or more than 200%, lower than
that experienced by similar firms who did not receive subsidies. Their employment growth over
the six-year period examined was lower by approximately 7 employees, or again more than
200% (see Table 11 and Table 12). These results are stronger under alternative specifications of
the model (Table 13).
Careful consideration of the evidence presented leads to the conclusion that the results
may be worse than the numbers seem to suggest. The model aggregates funding over the full
period of the study, meaning that awards received in 2012 are treated the same as those received
in 2007. This is unlikely to be the case. Effects of participation on employment and sales
growth take time to manifest. While we likely see the full effect for 2007 participants, 2012
participants would continue to feel an impact beyond the end of the observation period.
A subsidy program that distributes funds collected through taxation creates deadweight
losses that can be avoided through private funding mechanisms. Optimal public subsidy
programs therefore target marginal firms not funded by the private sector. We can combine this
intuition with empirical evidence on the dynamics of small business in the U.S. economy. Small
businesses generate substantial employment growth as they emerge, but few survive beyond five
or ten years. The net contribution to growth of the small business sector is far smaller than its
gross contribution. The sector relies on a few star performers to make up the difference.
Where on the continuum of net project returns is the marginal firm that just misses out on
obtaining private venture capital funding (Figure 2)? This is the firm that should be targeted by
subsidy programs such as SBIR/STTR. Intel and Apple may have obtained government startup
subsidies in their early years but it is unlikely that Gordon Moore or Steve Jobs would have
given up in the absence of public support. That they received subsidies may represent a failure

LEWIS: PICKING WINNERS 36
rather than a success of program administrators. Which firms should SBIR/STTR administrators
target? Where is the marginal firm? Given the long tail of the distribution of small business
performance, and the fact that private venture capital investments usually fail, the marginal
unfunded firm may be one that would be ultimately unsuccessful in making a positive social
contribution.
I leave determination of the placement of this critical margin for future research, but its
importance reveals a deeper theoretical problem for the SBIR/STTR program than the empirical
evidence presented here. The empirical evidence suggests that subsidizing R&D for small
businesses is a challenge given the misalignment of incentives and the administrative challenge
of picking winners. The theoretical evidence suggests that effective subsidy programs may be, in
fact, impossible. If the marginal firm in the competition for private investment does not produce
positive social benefits, then even an optimal subsidy program will target firms with a negative
net impact on the economic performance of the U.S. economy. If a gap does exist between the
margin of social benefit and the margin of private funding, it will be difficult for program
administrators to target this gap if outcomes are consistently at odds with stated objectives.

LEWIS: PICKING WINNERS 37
Tables and Figures
Figure 1: Total SBIR/STTR Awards
(2012 dollars)
Figure 1: Total annual SBIR/STTR funding since program inception, as measured by Phase I and Phase II awards reported at www.SBIR.gov for fiscal years 1983 through 2014.
Table 1: Number of SBIR/STTR Awards by Year, FY2000-2014 (random selection of recipient firms)
Firm Name 2000
2001
2002
2003
2004
2005
2006
2007
2008
2009
2010
2011
2012
2013
2014
Tota
l
Julia Group, The 1 1 2 Fulcrum Corp. 2 2 1 5 Laser Sensing Co. 2 2 Paragon Space Development Corp. 1 3 4 1 2 3 2 4 5 2 4 5 36 Zircon Computing LLC 1 1 Ekos Corporation 2 2 4 Nia Solutions Corporation 1 1 Advanced Cell Diagnostics, Inc. 1 1 1 1 1 5 Cornerstone Research Group, Inc. 3 3 5 13 8 12 13 10 13 12 15 13 8 3 10 141 Sims Brothers Incorporated 1 1 2 Hawthorne Mushrooms Inc. 1 1 2 Martek Bioscience Corporation 1 1 2 Bl Healthcare, Inc. 1 2 3 Energy Quest Technologies Inc. 1 2 1 4 Scentczar Corp. 1 4 5 Ventana Research 1 1 Isotron Corporation 1 3 1 2 1 8
Table 1: Total number of separate Phase I and Phase II awards received by a random sample of SBIR/STTR program participants in fiscal years 2000 through 2014.
$0
$500,000,000
$1,000,000,000
$1,500,000,000
$2,000,000,000
$2,500,000,000
$3,000,000,000

LEWIS: PICKING WINNERS 38
Figure 2: Target for Optimal R&D Subsidies
Figure 2: This figure illustrates the target range for projects funded by government R&D subsidies. The figure assumes that private agents require a larger net return to be willing to invest in a project than is socially optimal. It also assumes that many funded projects do not produce a positive private rate of return. If the margin of private funding falls to the left of the margin of social benefit, then no optimal policy exists for publicly subsidizing R&D projects.
Figure 3: Total SBIR/STTR Funding by Agency (2012 Dollars)
Figure 3: Total SBIR/STTR Phase I and Phase II funding by administering agency in fiscal years 1983 through 2014.
$0
$200,000,000
$400,000,000
$600,000,000
$800,000,000
$1,000,000,000
$1,200,000,000
$1,400,000,000
$1,600,000,000
1983 1988 1993 1998 2003 2008 2013
DOD HHS NASA DOE NSF DOA
DHS DOT ED EPA DOC

LEWIS: PICKING WINNERS 39
Figure 4: Average SBIR/STTR Phase I Awards for Select Agencies
(2012 dollars)
Figure 4: Average size of SBIR/STTR Phase I awards by agency in fiscal years 1983 to 2014.
Figure 5: Average SBIR/STTR Phase II Awards for Select Agencies (2012 dollars)
Figure 5: Average size of SBIR/STTR Phase II awards by agency in fiscal years 1983 to 2014.
$0
$50,000
$100,000
$150,000
$200,000
$250,000
$300,000
$350,000
1983 1988 1993 1998 2003 2008 2013
HHS NSF DOE DOD NASA
$0
$200,000
$400,000
$600,000
$800,000
$1,000,000
$1,200,000
$1,400,000
$1,600,000
1983 1988 1993 1998 2003 2008 2013
HHS DOE DOD NASA NSF

LEWIS: PICKING WINNERS 40
Figure 6: Total SBIR/STTR Funding by State (Top 5) (2012 dollars)
Figure 6: Total SBIR/STTR Phase I and Phase II funding by state of recipient firm in fiscal years 1983 through 2014.
Figure 7: Total SBIR/STTR Funding by CBSA (2012 dollars)
Figure 7: Total SBIR/STTR Phase I and Phase II funding by CBSA in fiscal years 2007 through 2012. Includes only SBIR recipients matched to NETS database firms. Top 5 CBSAs by funding are (respectively) Boston, MA; Washington, DC; Los Angeles, CA; New York, NY; and San Diego, CA.
$0
$100,000,000
$200,000,000
$300,000,000
$400,000,000
$500,000,000
$600,000,000
1983 1988 1993 1998 2003 2008 2013
CA MA VA MD NY
SBIR Funding by CBSA FY2007-2012

LEWIS: PICKING WINNERS 41
Table 2: Treatment and Control Group Summary Statistics: Specification 1
Mean Std. Dev. Min Max Obs Treatment Group Employees 3.60 5.63 0 100
1,555 Annual Sales $370,188 $644,302 $0 $7,269,780 Phase I Awards $479,751 $678,345 $0 $6,856,135 Phase II Awards $1,739,419 $1,951,572 $57,963 $26,200,000 Control Group Employees 3.21 5.65 0 90
1,543 Annual Sales $329,511 $645,319 $0 $7,375,086 Phase I Awards $250,825 $319,073 $32,327 $4,806,344 Phase II Awards $0 $0 $0 $0 Table 2: Treatment and control group summary statistics for Specification 1. The treatment group contains firms awarded positive Phase I and Phase II SBIR/STTR awards between fiscal years 2007 and 2012. The control group contains firms that were awarded Phase I contracts but did not progress to Phase II. Treatment firms are matched to control firms by 8-digit SIC, employment level and annual sales.
Table 3: Aggregate Summary Statistics
Mean Std. Dev. Min Max Obs Recipients of Phase I Funding Only Employees, 2007 8.07 25.5 0 475
3,138 Annual Sales, 2007 $1,159,361 $5,281,840 0 $192,000,000 Firm Age in 2012 (years) 9.84 10.2 1 117 Phase I Awards $245,038 $303,941 $22,702 $4,806,344 Recipients of Phase II Funding Employees, 2007 12.4 25.8 0 330
3,656 Annual Sales, 2007 $2,028,673 $13,100,000 0 $679,000,000 Firm Age in 2012 (years) 13.4 10.0 1 124 Phase I and II Awards $3,064,484 $6,123,499 $106,637 $150,000,000 Non-SBIR/STTR Firms With Active Federal R&D Contract Vehicles Employees, 2007 115 683 0 34,000
35,172 Annual Sales, 2007 $17,100,000 $161,000,000 0 $23.5B Firm Age in 2012 (years) 23.3 25.9 1 376 Federal R&D Funding $10,600,000 $230,000,000 0 $19.9B Table 3: Summary statistics for the overall populations of SBIR/STTR recipient and non-recipient firms. The top portion of the table contains firms that were awarded Phase I contracts between fiscal years 2007 and 2012 but did not progress to Phase II. The center portion contains firms awarded positive Phase II SBIR/STTR awards. The bottom contains non-SBIR/STTR participants who had active R&D contract vehicles with the federal government between 2007 and 2012.

LEWIS: PICKING WINNERS 42
Table 4: Treatment and Control Group Summary Statistics: Specification 2
Mean Std. Dev. Min Max Obs Treatment Group Employees 2.32 6.71 0 110
885 Annual Sales $221,497 $627,497 $0 $11,000,000 Phase I Awards $244,037 $279,581 $32,327 $3,977,982 Phase II Awards $0 $0 $0 $0 Control Group Employees 2.32 6.37 0 106
1,017 Annual Sales $214,170 $600,650 $0 $11,500,000 Phase I Awards $0 $0 $0 $0 Phase II Awards $0 $0 $0 $0 Table 4: Treatment and control group summary statistics for Specification 2. The treatment group contains firms awarded positive Phase I SBIR/STTR awards, but no Phase II awards, between fiscal years 2007 and 2012. The control group contains non-SBIR/STTR firms who were awarded other government R&D contracts. Treatment firms are matched to control firms by 8-digit SIC, CBSA, annual sales (within $500,000) and employment level (within 10 employees).

LEWIS: PICKING WINNERS 43
Table 5: Probit Regression for Estimation of Propensity Scores
Specification 2 Specification 4 Specification 3 Specification 5 Treatment Group: Phase I only Phase I and Phase II
Control Group: Non-SBIR R&D funding Non-SBIR R&D funding Dependent Variable: Treatment Treatment Treatment Treatment
(1) (2) (3) (4) Number of firms of -0.00155*** -0.000434***
matching SIC & CBSA (0.000131) (0.0000841) Number of firms of 0.0000564** 0.000019
matching SIC (0.0000235) (0.0000248) Employment, 2007 -0.00515*** -0.00513*** -0.00329*** -0.0105***
(0.000666) (0.000673) (0.000349) (0.000755) Log Annual Sales, 2007 -0.0336*** -0.0343*** -1.12e-09 0.00489*
(0.00254) (0.00254) (1.49e-09) (0.00283) Firm Age in 2012 -0.0148*** -0.0139*** -0.0131*** -0.0105***
(0.00151) (0.00152) (0.00071) (0.00124) Log Federal Funding 0.161*** 0.154*** -8.8e-11*** 0.352***
(0.00277) (0.00263) (2.97e-11) (0.00623) Constant -2.32*** -2.32*** -0.983*** -5.27***
(0.0296) (0.0287) (0.0146) (0.076) Observations 38,310 38,310 38,828 38,828
Pseudo R-squared 0.2450 0.2374 0.0512 0.4118 Notes: *** Significant at the 1 percent level ** Significant at the 5 percent level * Significant at the 10 percent level (Robust standard errors) Table 5: Results for probit regressions used to estimate propensity scores for treatment/control group matching. The probit model estimates the probability that a given firm receives SBIR/STTR funding given the levels of the included control variables.

Table 6: Treatment and Control Group Summary Statistics: Specification 3
Mean Std. Dev. Min Max Obs Treatment Group Employees 4.36 7.35 0 80
828 Annual Sales $454,356 $898,914 $0 $9,462,606 Phase I Awards $462,057 $683,967 $0 $5,780,221 Phase II Awards $1,826,980 $2,298,800 $126,550 $23,200,000 Control Group Employees 4.01 7.40 0 80
963 Annual Sales $418,065 $875,518 $0 $9,126,717 Phase I Awards $0 $0 $0 $0 Phase II Awards $0 $0 $0 $0 Table 6: Treatment and control group summary statistics for Specification 3. The treatment group contains firms awarded positive Phase I and Phase II SBIR/STTR awards between fiscal years 2007 and 2012. The control group contains non-SBIR/STTR firms who were awarded other government R&D contracts. Treatment firms are matched to control firms by 8-digit SIC, CBSA, annual sales (within $500,000) and employment level (within 10 employees).
Table 7: Treatment and Control Group Summary Statistics: Specification 4
Mean Std. Dev. Min Max Obs Treatment Group Employees 3.50 9.73 0 220
1,955 Annual Sales $374,589 $1,134,010 $0 $23,200,000 Phase I Awards $234,489 $275,802 $22,702 $4,131,702 Phase II Awards $0 $0 $0 $0 Control Group Employees 3.43 9.20 0 223
2,448 Annual Sales $365,169 $1,069,146 $0 $23,500,000 Phase I Awards $0 $0 $0 $0 Phase II Awards $0 $0 $0 $0 Table 7: Treatment and control group summary statistics for Specification 4. The treatment group contains firms awarded positive Phase I SBIR/STTR awards, but no Phase II awards, between fiscal years 2007 and 2012. The control group contains non-SBIR/STTR firms who were awarded other government R&D contracts. Treatment firms are matched to control firms by 8-digit SIC, annual sales (within $500,000) and employment (within 10 employees). Firms are not matched by CBSA as in Table 4.

LEWIS: PICKING WINNERS 45
Table 8: Treatment and Control Group Summary Statistics: Specification 5
Mean Std. Dev. Min Max Obs Treatment Group Employees 6.48 13.4 0 300
1,933 Annual Sales $734,779 $1,829,492 $0 $40,800,000 Phase I Awards $536,938 $1,145,657 $0 $24,900,000 Phase II Awards $2,059,290 $3,644,023 $57,963 $81,100,000 Control Group Employees 6.16 14.0 0 300
2,390 Annual Sales $697,427 $1,811,722 $0 $41,000,000 Phase I Awards $0 $0 $0 $0 Phase II Awards $0 $0 $0 $0 Table 8: Treatment and control group summary statistics for Specification 5. The treatment group contains firms awarded positive Phase I and Phase II SBIR/STTR awards between fiscal years 2007 and 2012. The control group contains non-SBIR/STTR firms who were awarded other government R&D contracts. Treatment firms are matched to control firms by 8-digit SIC, annual sales (within $500,000) and employment level (within 10 employees). Firms are not matched by CBSA as in Table 6.
Table 9: t-Tests for Equality of Means in Treatment and Candidate Control Groups
Obs. Mean Std. Err. HA: Diff. < 0 HA: Diff. ≠ 0 HA: Diff. > 0
Specification 1
Emp.
C
hg. Control: Phase I 3,138 0.714 0.0606
0.775 0.450 0.225 Treatment: Phase II 3,656 0.660 0.0389 Combined 6,794 0.685 0.0350
Sale
s C
hg. Control: Phase I 3,138 1.25 0.421
0.535 0.930 0.465 Treatment: Phase II 3,656 1.20 0.206 Combined 6,794 1.22 0.224
Specification 2
Emp.
C
hg. Control: Non-SBIR 35,172 1.34 0.155
0.999 0.0002 0.0001 Treatment: Phase I 3,138 0.714 0.0606 Combined 38,310 1.29 0.142
Sale
s C
hg. Control: Non-SBIR 35,172 2.52 0.506
0.973 0.0536 0.0268 Treatment: Phase I 3,138 1.25 0.421 Combined 38,310 2.41 0.466
Specification 3
Emp.
C
hg. Control: Non-SBIR 35,172 1.34 0.155
1.00 0.000 0.000 Treatment: Phase II 3,656 0.660 0.0389 Combined 38,828 1.28 0.140
Sale
s C
hg. Control: Non-SBIR 35,172 2.52 0.506
0.992 0.0163 0.00820 Treatment: Phase II 3,656 1.20 0.206 Combined 38,828 2.39 0.459
Table 9: t-tests for equality of means across treatment and control candidate populations. Variables of interest are the change in employment and sales between 2007 and 2012, computed as (Value2012 – Value2007) / Value2007. Treatment and control group variances are not assumed equal.
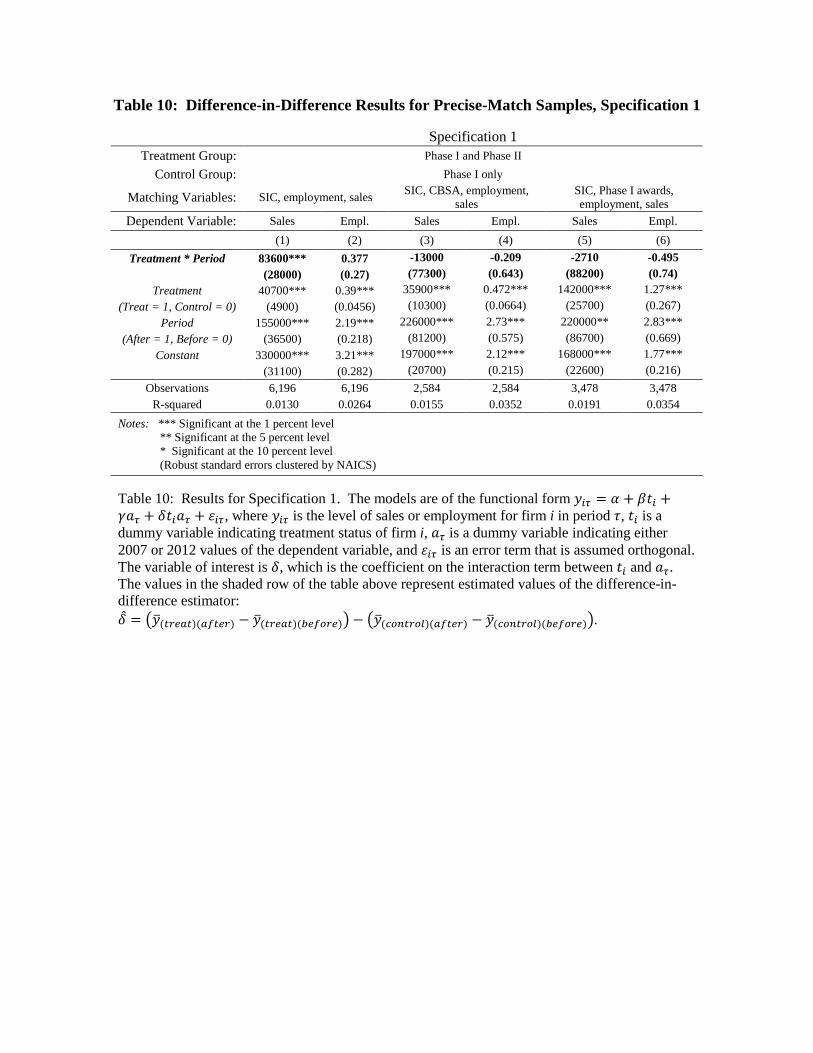
Table 10: Difference-in-Difference Results for Precise-Match Samples, Specification 1
Specification 1 Treatment Group: Phase I and Phase II
Control Group: Phase I only
Matching Variables: SIC, employment, sales SIC, CBSA, employment, sales
SIC, Phase I awards, employment, sales
Dependent Variable: Sales Empl. Sales Empl. Sales Empl. (1) (2) (3) (4) (5) (6)
Treatment * Period 83600*** 0.377 -13000 -0.209 -2710 -0.495 (28000) (0.27) (77300) (0.643) (88200) (0.74)
Treatment 40700*** 0.39*** 35900*** 0.472*** 142000*** 1.27*** (Treat = 1, Control = 0) (4900) (0.0456) (10300) (0.0664) (25700) (0.267)
Period 155000*** 2.19*** 226000*** 2.73*** 220000** 2.83*** (After = 1, Before = 0) (36500) (0.218) (81200) (0.575) (86700) (0.669)
Constant 330000*** 3.21*** 197000*** 2.12*** 168000*** 1.77*** (31100) (0.282) (20700) (0.215) (22600) (0.216)
Observations 6,196 6,196 2,584 2,584 3,478 3,478 R-squared 0.0130 0.0264 0.0155 0.0352 0.0191 0.0354
Notes: *** Significant at the 1 percent level ** Significant at the 5 percent level * Significant at the 10 percent level (Robust standard errors clustered by NAICS) Table 10: Results for Specification 1. The models are of the functional form 𝑦𝑦𝑖𝑖𝑖𝑖 = 𝛼𝛼 + 𝛽𝛽𝑡𝑡𝑖𝑖 +𝛾𝛾𝑎𝑎𝑖𝑖 + 𝛿𝛿𝑡𝑡𝑖𝑖𝑎𝑎𝑖𝑖 + 𝜀𝜀𝑖𝑖𝑖𝑖, where 𝑦𝑦𝑖𝑖𝑖𝑖 is the level of sales or employment for firm i in period 𝜏𝜏, 𝑡𝑡𝑖𝑖 is a dummy variable indicating treatment status of firm i, 𝑎𝑎𝑖𝑖 is a dummy variable indicating either 2007 or 2012 values of the dependent variable, and 𝜀𝜀𝑖𝑖𝑖𝑖 is an error term that is assumed orthogonal. The variable of interest is 𝛿𝛿, which is the coefficient on the interaction term between 𝑡𝑡𝑖𝑖 and 𝑎𝑎𝑖𝑖. The values in the shaded row of the table above represent estimated values of the difference-in-difference estimator: 𝛿𝛿 = �𝑦𝑦�(𝑡𝑡𝑡𝑡𝑡𝑡𝑡𝑡𝑡𝑡)(𝑡𝑡𝑎𝑎𝑡𝑡𝑡𝑡𝑡𝑡) − 𝑦𝑦�(𝑡𝑡𝑡𝑡𝑡𝑡𝑡𝑡𝑡𝑡)(𝑏𝑏𝑡𝑡𝑎𝑎𝑏𝑏𝑡𝑡𝑡𝑡)� − �𝑦𝑦�(𝑐𝑐𝑏𝑏𝑐𝑐𝑡𝑡𝑡𝑡𝑏𝑏𝑐𝑐)(𝑡𝑡𝑎𝑎𝑡𝑡𝑡𝑡𝑡𝑡) − 𝑦𝑦�(𝑐𝑐𝑏𝑏𝑐𝑐𝑡𝑡𝑡𝑡𝑏𝑏𝑐𝑐)(𝑏𝑏𝑡𝑡𝑎𝑎𝑏𝑏𝑡𝑡𝑡𝑡)�.

Table 11: Difference-in-Difference Results for Precise-Match Samples, Specifications 2 - 5
Specification 2 Specification 3 Specification 4 Specification 5 Treatment Group: Phase I only Phase I and Phase II Phase I only Phase I and Phase II
Control Group: Non-SBIR R&D funding Non-SBIR R&D funding Non-SBIR R&D funding Non-SBIR R&D funding Matching Variables: SIC, CBSA, employment, sales SIC, employment, sales Dependent Variable: Sales Empl. Sales Empl. Sales Empl. Sales Empl.
(1) (2) (3) (4) (5) (6) (7) (8) Treatment * Period -1880000*** -11.7*** -1090000** -7.07* -1950000*** -10.6** -1830000*** -14.4***
(655000) (4.06) (541000) (3.79) (669000) (4.2) (433000) (3.98) Treatment 7330 -0.00318 36300*** 0.356*** 9420 0.065 37400** 0.318**
(Treat = 1, Control = 0) (6740) (0.0468) (9470) (0.0778) (8140) (0.0673) (16700) (0.124) Period 2210000*** 15.1*** 1370000** 10.2*** 2170000*** 13.3*** 2070000*** 17.2***
(After = 1, Before = 0) (663000) (3.9) (527000) (3.76) (674000) (4.21) (447000) (4.07) Constant 214000*** 2.32*** 418000*** 4.01*** 365000*** 3.43*** 697000*** 6.16***
(39200) (0.39) (65900) (0.486) (49000) (0.418) (82200) (0.702) Observations 3,804 3,804 3,582 3,582 8,806 8,806 8,646 8,646
R-squared 0.0048 0.0072 0.0047 0.0049 0.0050 0.0066 0.0055 0.0043 Notes: *** Significant at the 1 percent level ** Significant at the 5 percent level * Significant at the 10 percent level (Robust standard errors clustered by NAICS) Table 11: Results for Specifications 2-5. The models are of the functional form 𝑦𝑦𝑖𝑖𝑖𝑖 = 𝛼𝛼 + 𝛽𝛽𝑡𝑡𝑖𝑖 + 𝛾𝛾𝑎𝑎𝑖𝑖 + 𝛿𝛿𝑡𝑡𝑖𝑖𝑎𝑎𝑖𝑖 + 𝜀𝜀𝑖𝑖𝑖𝑖, where 𝑦𝑦𝑖𝑖𝑖𝑖 is the level of sales or employment for firm i in period 𝜏𝜏, 𝑡𝑡𝑖𝑖 is a dummy variable indicating treatment status of firm i, 𝑎𝑎𝑖𝑖 is a dummy variable indicating either 2007 or 2012 values of the dependent variable, and 𝜀𝜀𝑖𝑖𝑖𝑖 is an error term that is assumed orthogonal. The variable of interest is 𝛿𝛿, which is the coefficient on the interaction term between 𝑡𝑡𝑖𝑖 and 𝑎𝑎𝑖𝑖. The values in the shaded row of the table above represent estimated values of the difference-in-difference estimator: 𝛿𝛿 = �𝑦𝑦�(𝑡𝑡𝑡𝑡𝑡𝑡𝑡𝑡𝑡𝑡)(𝑡𝑡𝑎𝑎𝑡𝑡𝑡𝑡𝑡𝑡) − 𝑦𝑦�(𝑡𝑡𝑡𝑡𝑡𝑡𝑡𝑡𝑡𝑡)(𝑏𝑏𝑡𝑡𝑎𝑎𝑏𝑏𝑡𝑡𝑡𝑡)� − �𝑦𝑦�(𝑐𝑐𝑏𝑏𝑐𝑐𝑡𝑡𝑡𝑡𝑏𝑏𝑐𝑐)(𝑡𝑡𝑎𝑎𝑡𝑡𝑡𝑡𝑡𝑡) − 𝑦𝑦�(𝑐𝑐𝑏𝑏𝑐𝑐𝑡𝑡𝑡𝑡𝑏𝑏𝑐𝑐)(𝑏𝑏𝑡𝑡𝑎𝑎𝑏𝑏𝑡𝑡𝑡𝑡)�.

Figure 8: Specification 1 Treatment and Control Groups
Figure 8: This chart provides visual representations of the difference-in-difference model specified in columns (1) and (2) of Table 10. The treatment group is composed of firms awarded Phase I and Phase II contracts. Control group firms participated in the program but did not progress beyond Phase I. Groups are matched on industry, 2007 employment and 2007 sales. The solid line represents the change in sales or employment of the treatment group between 2007 and 2012. The dashed line represents the change in sales or employment of the control group.
Figure 9: Specification 2 Treatment and Control Groups
Figure 9: This chart provides visual representations of the difference-in-difference model specified in columns (1) and (2) of Table 11. The treatment group is composed of firms awarded Phase I contracts only. Control group firms did not participate in the program, but did receive other government R&D contracts during the period. Groups are matched on industry, CBSA, sales and employment. The solid line represents the change in sales or employment of the treatment group between 2007 and 2012. The dashed line represents the change in sales or employment of the control group.

LEWIS: PICKING WINNERS 49
Table 12: PS Matching Estimates of Average Treatment Effect on the Treated
Coef. AI Robust Std. Error z P > | z | Obs.
Spec. 2 Employment -3.83 2.74 -1.40 0.162 38,310 Annual Sales -3.12 2.41 -1.29 0.196 38,310
Spec. 3 Employment -2.17 0.713 -3.04 0.002 38,828 Annual Sales -2.50 0.763 -3.27 0.001 38,828
Spec. 4 Employment -3.38 1.54 -2.20 0.028 38,310 Annual Sales -2.98 1.42 -2.11 0.035 38,310
Spec. 5 Employment -2.69 0.705 -3.81 0.000 38,828 Annual Sales -3.20 0.821 -3.89 0.000 38,828
Table 12: Estimates of the average treatment effect on the treated (ATT) in the propensity score matching models in Table 5. Reported values are differential growth in employment and annual sales computed as (Value2012 – Value2007) / Value2007. Estimates use Abadie and Imbens (2012) robust standard errors.

Table 13: Difference-in-Difference Estimates with Propensity Score Matching Specification 2 Specification 3 Specification 4 Specification 5
Treatment Group: Phase I only Phase I and Phase II Phase I only Phase I and Phase II Control Group: Non-SBIR R&D funding Non-SBIR R&D funding Non-SBIR R&D funding Non-SBIR R&D funding
PS Match Variables: CBSA/SIC matches, employment, log sales, age, funding
CBSA/SIC matches, employment, log sales, age, funding
SIC matches, employment, log sales, age, funding
SIC matches, employment, log sales, age, funding
Dependent Variable: Sales Empl. Sales Empl. Sales Empl. Sales Empl. (1) (2) (3) (4) (5) (6) (7) (8)
Treatment * Period -2370000*** -13.7*** -6070000** -27.5*** -4090000** -21*** -6340000*** -33.4*** (753000) (3.49) (2420000) (8.12) (1910000) (6.34) (2440000) (8.48)
Treatment -594000*** -2.02** -273000 -1.94** -487000*** -1.48* -867000*** -3.46*** (Treat = 1, Control = 0) (206000) (0.802) (419000) (0.96) (186000) (0.811) (278000) (0.997)
Period 2470000*** 16.1*** 5880000** 29.9*** 4180000** 23.5*** 6520000*** 36*** (After = 1, Before = 0) (732000) (3.37) (2380000) (8.06) (1900000) (6.28) (2420000) (8.42)
Constant 2040000*** 12*** 3100000*** 18*** 1920000*** 11.3*** 3330000*** 19.5*** (167000) (0.557) -273000 (0.641) (143000) (0.577) (203000) (0.708)
Observations 9,592 9,592 8,228 8,228 9,686 9,686 8,308 8,308 R-squared 0.0047 0.0073 0.0024 0.0051 0.0018 0.0044 0.0031 0.0071
Notes: *** Significant at the 1 percent level ** Significant at the 5 percent level * Significant at the 10 percent level (Robust standard errors) Table 13: Difference-in-difference estimates using all treated observations and control groups derived using propensity score matching from the probit model in Table 5.

Figure 10: Specification 3 Treatment and Control Groups
Figure 10: This chart provides visual representations of the difference-in-difference model specified in columns (3) and (4) of Table 11. The treatment group is composed of firms awarded Phase I and Phase II contracts. Control group firms did not participate in the program, but did receive other government R&D contracts during the period. Groups are matched on industry, CBSA, sales and employment. The solid line represents the change in sales or employment of the treatment group between 2007 and 2012. The dashed line represents the change in sales or employment of the control group.
Figure 11: Specification 4 Treatment and Control Groups
Figure 11: This chart provides visual representations of the difference-in-difference model specified in columns (5) and (6) of Table 11. The treatment group is composed of firms awarded Phase I contracts only. Control group firms did not participate in the program, but did receive other government R&D contracts during the period. Groups are matched on industry, sales and employment, but not CBSA. The solid line represents the change in sales or employment of the treatment group between 2007 and 2012. The dashed line represents the change in sales or employment of the control group.

LEWIS: PICKING WINNERS 49
Figure 12: Specification 5 Treatment and Control Groups
Figure 12: This chart provides visual representations of the difference-in-difference model specified in columns (7) and (8) of Table 11. The treatment group is composed of firms awarded Phase I and Phase II contracts. Control group firms did not participate in the program, but did receive other government R&D contracts during the period. Groups are matched on industry, sales and employment, but not CBSA. The solid line represents the change in sales or employment of the treatment group between 2007 and 2012. The dashed line represents the change in sales or employment of the control group.

Table 14: Ordinary and Weighted Least Squares Estimates
Specification 1: OLS Specification 2: OLS Specification 2: WLS Specification 3: OLS Specification 3: WLS Treatment Group: Phase I and Phase II Phase I only Phase I and Phase II
Control Group: Phase I only Non-SBIR R&D funding Non-SBIR R&D funding Dependent Variable: Sales Chg. Empl. Chg. Sales Chg. Empl. Chg. Sales Chg. Empl. Chg. Sales Chg. Empl. Chg. Sales Chg. Empl. Chg.
(1) (2) (3) (4) (5) (6) (7) (8) (9) (10) Treatment Indicator -0.385 -0.173* -2.32*** -1.44*** -1.47*** -1.4** -1.95*** -1.65*** -3.12*** -2.37***
(0.406) (0.09) (0.86) (0.297) (0.417) (0.656) (0.728) (0.338) (0.767) (0.658) Number of firms of 0.00205 0.000676*** 0.00409*** 0.00214*** 0.000984*** 0.000661*** 0.00424*** 0.00216 -0.000555*** -0.00018
matching SIC & CBSA (0.00184) (0.000233) (0.000877) (0.000599) (0.000363) (0.000244) (0.000808) (0.00174) (0.000209) (0.000415) Employment, 2007 -0.00566*** -0.00341*** 0.00326 -0.000328*** -0.000714 -0.000355 0.00328 -0.000322*** -0.00424*** -0.00421***
(0.00203) (0.000818) (0.00233) (0.000116) (0.000634) (0.000489) (0.00233) (0.000124) (0.00061) (0.000371) Log Annual Sales, 2007 -0.0535** -0.0178** -0.319 -0.0323* -0.0449** 0.00191 -0.336 -0.0321 -0.0432 -0.00741
(0.0211) (0.00812) (0.211) (0.0186) (0.0205) (0.0369) (0.218) (0.0203) (0.034) (0.0144) Firm Age in 2012 -0.0000473 -0.0209*** 0.065 -0.00461 -0.01*** -0.00632** 0.0651 -0.0048 -0.00357 -0.000972
(0.0235) (0.00362) (0.077) (0.00827) (0.00272) (0.00269) (0.0771) (0.00826) (0.00394) (0.00381) Log Federal Funding 0.233** 0.11*** 0.179 0.124*** 0.0628 0.283 0.182 0.127*** 0.317 0.344**
(0.0995) (0.0389) (0.143) (0.0423) (0.0838) (0.2) (0.143) (0.0386) (0.227) (0.16) Constant -1.16 -0.261 3.08** 0.897*** 2.11** -1.51 3.26** 0.843** 0.115 -1.73
(1.38) (0.48) (1.46) (0.296) (1.04) (2.19) (1.49) (0.352) (3.14) (1.88) Observations 6,736 6,736 36,191 36,191 38,056 38,056 36,703 38,828 38,674 38,828
R-squared 0.0006 0.0149 0.0012 0.0008 0.0048 0.0070 0.0012 0.0009 0.0121 0.0103 Notes: *** Significant at the 1 percent level ** Significant at the 5 percent level * Significant at the 10 percent level (Robust standard errors clustered by CBSA) Table 14: Least squares models estimate 𝑦𝑦𝑖𝑖 = 𝛼𝛼 + 𝛽𝛽𝑡𝑡𝑖𝑖 + 𝛾𝛾𝛽𝛽 + 𝜀𝜀𝑖𝑖 where 𝑦𝑦𝑖𝑖 represents either the percent growth in employment or sales for firm i calculated as (Value2012 – Value2007) / Value2007. 𝑡𝑡𝑖𝑖, indicates SBIR/STTR participation with 𝛽𝛽 the coefficient of interest. Control variables are included in the matrix 𝛽𝛽. Error is captured in 𝜀𝜀𝑖𝑖. WLS frequency weights are the number of matching firms based on propensity scores calculated in Table 5.

References
Abadie, Alberto, and Guido Imbens. 2012. “Matching on the Estimated Propensity Score.”
NBER Working Paper 15301 (Dec 2012).
Akerlof, G.A. 1970. “The Market for Lemons: Quality Uncertainty and the Market
Mechanism.” Quarterly Journal of Economics 84: 488-500.
Anvadike-Danes, Michael, Carl-Magnus Bjuggren, Santra Gottschalk, Werner Holzl, Dan
Johansson, Mika Maliranta and Anja Myrann. 2015. “An international cohort
comparison of size effects on job growth.” Small Business Economics 44: 821-844.
Arrow, Kenneth. 1962. “Economic Welfare and the Allocation of Resources for Invention,” in
Richard Nelson (ed.), The Rate and Direction of Inventive Activity. Princeton,
NJ: Princeton University Press.
Audretsch, David B., and Maryann P. Feldman. 1996. “R&D Spillovers and the Geography of
Innovation and Production.” The American Economic Review 86(3): 630-40.
Audretsch, David B., Albert N. Link and John T. Scott. 2002. “Public/Private Technology
Partnerships: Evaluating SBIR Supported Research.” Research Policy 31: 145-58.
Audretsch, David B. 2003. “Standing on the Shoulders of Midgets: The U.S. Small Business
Innovation Research Program (SBIR).” Small Business Economics 20(2), Special Issue
on Policies Promoting Innovation in Small Firms: 129-35.
Becker, Gary S. 1983. “A Theory of Competition Among Pressure Groups for Political
Influence.” The Quarterly Journal of Economics 98(3): 371-400.
Bronzini, Raffaello, and Eleonora Iachini. 2014. “Are Incentives for R&D Effective? Evidence
from a Regression Discontinuity Approach.” American Economic Journal – Economic
Policy 6(4): 100-34.

LEWIS: PICKING WINNERS 49
Davis, Steven, John Haltiwanger and Scott Schuh. 1996. “Small Business and Job Creation:
Dissecting the Myth and Reassessing the Facts.” Small Business Economics 8(4): 297-
315.
Decker, Ryan, John Haltiwanger, Jon Jarmin and Javier Miranda. 2014. “The Role of
Entrepreneurship in US Job Creation and Economic Dynamism.” The Journal of
Economic Perspectives 28(3): 3-24.
Gans, Joshua S., and Scott Stern. 2000. “When Does Funding Research by Smaller Firms Bear
Fruit? Evidence from the SBIR Program.” NBER Working Paper 7877.
General Services Administration (GSA) Office of Government-wide Policy. 2011. Federal
Procurement Data System Product and Service Codes Manual (1 Oct).
Gonzalez, Xulia, Jordi Jaumandreu and Consuelo Pazo. 2005. “Barriers to Innovation and
Subsidy Effectiveness.” The RAND Journal of Economics 36(4): 930-950.
Griliches, Zvi. 1958. “Research costs and social returns: hybrid corn and related innovations.”
Journal of Political Economy 66: 419-31.
Griliches, Zvi. 1979. “Issues in Assessing the Contribution of Research and Development to
Productivity Growth.” Bell Journal of Economics 10(1): 92-116.
Griliches, Zvi. 1992. “The Search for R&D Spillovers.” The Scandinavian Journal of
Economics 94, Supplement. Proceedings of a Symposium on Productivity Concepts and
Measurement Problems: Welfare, Quality and Productivity in the Service Industries:
S29-S47.
Grossman, Gene, and Elhanan Helpman. 1991. Innovation and Growth in the Global Economy.
Cambridge, MA: MIT Press.

LEWIS: PICKING WINNERS 49
Hall, B.H. 2002. “The Financing of Research and Development.” Oxford Review of Economic
Policy 18(1): 35-51.
Huggins, Robert, and Piers Thompson. 2015. “Entrepreneurship, innovation and regional
growth: a network theory.” Small Business Economics 45: 103-28.
Jaffe, Adam B., Manuel Trajtenberg and Rebecca Henderson. 1993. “Geographic Localization
of Knowledge Spillovers as Evidenced by Patent Citations.” The Quarterly Journal of
Economics 108(3): 577-98.
Jones, Charles I., and John C. Williams. 1998. “Measuring the Social Return to R&D.” The
Quarterly Journal of Economics 113(4): 1119-35.
Krugman, Paul. 1991. “Increasing Returns and Economic Geography.” Journal of Political
Economy 99(3): 483-99.
Lerner, Josh. 1999. “The Government as Venture Capitalist: The Long-Run Impact of the SBIR
Program.” Journal of Business 72(3): 285-318.
Lerner, Josh and Colin Kegler. 2000. “Evaluating the Small Business Innovation Research
Program: A Literature Review,” in The Small Business Innovation Research Program
(SBIR): An Assessment of the Department of Defense Fast Track Initiative (edited by
Charles Wessner), Washington, DC: National Academy Press, 307-324.
Lerner, Josh. 2002. “When Bureaucrats Meet Entrepreneurs: The Design of Effective ‘Public
Venture Capital’ Programmes.” The Economic Journal 112(477): F73-F84.
Marshall, A. 1920. Principles of Economics. London: Macmillan.
Meuleman, Miguel, and Wouter De Maeseneire. 2012. “Do R&D subsidies affect SME’s access
to external financing?” Research Policy 41(3): 580-91.

LEWIS: PICKING WINNERS 49
Montmartin, Benjamin, and Marcos Herrera. 2015. “Internal and external effects of R&D
subsidies and fiscal incentives: Empirical evidence using spatial dynamic panel models.”
Research Policy 44: 1065-79.
Peltzman, Sam. 1976. “Toward a More General Theory of Regulation.” Journal of Law and
Economics 19(2), Conference on the Economics of Politics and Regulation: 211-40.
Romer, Paul. 1986. “Increasing Returns and Long Run Growth.” Journal of Political Economy
94(5): 1002-37.
Romer, Paul. 1990. “Endogenous Technological Change.” Journal of Political Economy 98(5),
Part 2: The Problem of Development: A Conference of the Institute for the Study of
Free Enterprise Systems: S71-S102.
Small Business Administration. 2014. Small Business Innovation Research (SBIR) Program
Policy Directive. Small Business Administration Office of Investment and Innovation.
www.SBIR.gov.
Soderblom, Anna, Mikael Samuelsson, Johan Wiklund and Rickard Sandberg. 2015. “Inside the
black box of outcome additionality: Effects of early-stage government subsidies on
resource accumulation and new venture performance.” Research Policy 44: 1501-12.
Stigler, George J. 1971. “The Theory of Economic Regulation.” The Bell Journal of Economics
and Management Science 2(1): 3-21.
Takalo, Tuomas, Tanja Tanayama and Otto Toivanen. 2013. “Estimating the Benefits of
Targeted R&D Subsidies.” The Review of Economics and Statistics 95(1): 255-272.
Wallsten, Scott J. 2000. “The Effects of Government-Industry R&D Programs on Private R&D:
The Case of the Small Business Innovation Research Program.” The RAND Journal of
Economics 31(1): 82-100.

LEWIS: PICKING WINNERS 49
Wessner, Charles W. (ed.) 2000. The Small Business Innovation Research Program: An
Assessment of the Department of Defense Fast Track Initiative. Washington, DC:
National Academy Press.
Zuniga-Vicente, Jose Angel, Cesar Alonso-Borrego, Francisco J. Forcadell and Jose I. Galan-
Zazo. 2014. “Assessing the Effect of Public Subsidies on Firm R&D Investment: A
Survey.” Journal of Economic Surveys 28(1): 36-67.
Top Related