


Languages
Pages
Legal

PHYSICOCHEMICAL PROPERTIES OF INDONESIAN SAGO STARCH: IN
COMPARISON WITH ARENGA SAGO, WHEAT, CORN, AND TAPIOCA
STARCHES
Ansharullah, Sri Wahyuni, Tamrin, and Djukrana
ABSTRACT
Physicochemical properties of native sago starch obtained from Metroxylon sp. Palms in
Southeast Sulawesi Indonesia, such as chemical composition, total stach content, apparent
amylose content, pasting properties, endothermic thermal behaviour, starch paste clarity,
freeze-thaw stability, hardness of gel, and microscopic structure of the granules, were
analysed. As a comparison, those properties of Metroxylon sago starch obtained from a
different source, sago starch derived from Arenga sp. Palms, wheat corn, and tapioca starches
were also analysed.
All sago starch samples contained less fat and protein, compared to cereal starches. These
starch samples contained amylose of 25.27 – 27.47 %, significantly higher compared to
wheat, corn, and tapioca starches with amylose content of 21.45, 21.63, and 18.21%
respectively. In general, Metroxylon sago starch samples exhibited relatively higher peak
viscosity in its RVA pasting curves, and higher endothermic energy. The samples of
Metroxylon sago starch had bigger granules sizes, and had a more transparent paste. The gels
of the Metroxylon sago starch were harder, and showed a relatively better stability to freezy-
thaw treatment.
The information obtained in this experiment will be important for the utilisation of the sago
starch in the food industry.
INTRODUCTION
The use of starch has continued to grow over the years. Starch has been applied over a wide
range of products, either as a raw material or as an additive, and thus starch plays an
important role in many industries such as food, pharmaceutical, textile, ets. In the food
industries, starch has been used as thickener, gelling agent, absorber of water, bulking agent,
anti sticky agent, and source of energy for fermentataion (Eliasson and Gudmundson, 1996)
As the industrial scale, the choice of raw material of a starch would depend upon such factors
as availability, cost, efficieny of the processing, and the quality of final product. Raw sago
starch is abundantly in such countries as Indonesia, Malaysia, and Papua New Guinea, and
therefore has a potential for major application in the food industry. Metroxylon sp. and
Arenga sp. are two major sources of sago starch (Johnson, 1977). Metroxylon sp. Has
botanical and agronomic difference compared to Arenga sp. The formar could produce starch
up to about 250 kg per palm (Flach, 1977), while the latter could produce about 75 kg per
palm (Dransfield, 1977). Starches produced from these two species would also clearly
possess different characteristics.
A knowledge of physicochemical properties of a starch is important before using in any
application. This would help, for example, in planning and in designing the future
application process. The present study was undertake to characterise the physicochemical
properties of native sago starches, ini comparison with other well-characterised starches.

MATERIAL AND METHODS
Materials
Two native sago starches (from Metroxylon sp.) were used in this study. Sample sago INA
was obtained from Southeast Sulawesi, Indonesia, and sago MAL was from Sarawak
Chemical Industries Sdn. Bhd. Sarawak, Malaysia.
For comparison, other starches were also analysed including arenga sago (from Arenga sp.
Produced in Indonesia), wheat (Manildra Pty Ltd., Sydney, Australia), corn (Hongkong
produce), and tapioca (Thailand produce).
Methods
Determination of Chemical Proximate Composition
Chemical proximate composition of moisture, protein, fat, and ash of the starch samples were
determined using the method of Egan et al. (1981). Moisture content was determined by
measuring the lost weight of the samples after oven-drying at 105oC for 24 h.
Protein content was determined by Kjeldahl method using the Tecator Kjesltec Systems. The
samples (2 g ) were digested in an electronically heated aluminium block digester, followed
by rapid steam distillation of ammonia with automatic dilution and alkali addition. The
distillates were then titrated against 0.1 M HCl. The percentage of protein was calculated
according to Donnolley and Sturgess (1992), as follows:
%N = 14.01 x (mL of sample titre – mL of blank titre) x molarity of HCl
Sample weight x 10
% Protein = % N x 6.25
Fat content was determined by extracting the fat out of the samples with a petroleun spirit
(with a boiling point range of 60 – 80 oC) in a continuous soxhlet apparatus for 6 h.
Total ash content was determined by measuring the weight of ash after incinerating the
samples in a muffle furnace at 550oC for 24 h.
Determination of Total Starch Content
Total starch content of the samples was determined using enzymatic method of McCleary et
al. (1994). The samples (100 mg) were weighed into test tubes, moistened with 0.2 mL
aqueous ethanol (80% v/v), and stirred on a vortex mixer. Three mL of thermostable -amylaxe (300 units) in MOPS (3-N-morpholino propane sulphonic acid) buffer (50 mM, pH
7.0) was immediately added, stirred vigorously for 10 s, and incubated in a boiling water bath
for 6 min. The tubes were removed and placed in a 50oC water bath, then 4 mL of sodium
acetate buffer (200 mM, pH 4.5) was added, followed by 0.1 mL amyloglucosidase (20
units). The tubes were incubated at 50oC for 30 min and stirred occasionally. The entire
contents of the tubes were transferred to a 100 mL volumetric flask, and the volume was
adjusted to the marks with distilled water. The contents were mixed with 3 mL of GOPOD
(glucose oxidase-peroxidase/4-aminoantipypirine/p-hydroxybenzoic acid) reagent, and
incubated at 50oC for 20 min. The absorbance of the samples and glucose controls were read
at 510 nm against reagent blank.
% Total starch (as is basis) = E x F x 1000 x 1/100 x 100/W x 162/180
= E x F x 90

% Total starch (dry basis) = % starch (as is) x 100
(100 - % moisture)
E = absorbance at 510 nm against reagent blank
F = (100 g of glucose standard)/(absorbance for 100 g of glucose).
1000 = volume correction factor (0.10 mL out of 100 mL was analysed).
1/1000 = conversion from g to mg W = weight of samples analysed
100/W = a factor to express starch as a percentage of sample weight
162/180 = a factor to convert free glocose to anhydroglucose, as occurs in starch
MOPS (sodium salt) was obtained from sigma; GOPOD reagent, thermostable amylase, amyoglucosidase, glucose standard, and reference starch were obtained from Megazyme Pty
Ltd (Warriewood, Sydney, Australia)
Determination of Amylose Content
The method of Wootton and Mahdar (1993) was used to determine the amylose content.
Briefly, 20 mg of samples were dispersed in 10 mL of 0.5 M KOH solution, and made up to
100 mL. An aliquot (10 mL) was placed in a 50 mL volumetric flask, together with 5 mL of
0.1 M HCl and 0.5 mL iodine reagent (0.2% I2 in 2% KI), and made up to volume.
Absorbance of the solution was measured at 589 nm after 5 min. A blank (reagents only, no
starch) was similarly prepared. A standard curve was established by determining absorbance
of the mixture of amylose/amylopectin (with ration 20:80) in 5 mg increments of amylose
using the above procedure. Amylose (%) was measured with reference to the standard curve.
RVA Pasting Characteristics
Pasting properties of the starch samples were measured by the RVA (Newport Scientific Pty.
Ltd., Warriewood, NSW, Australia) samples of 2 g (14% moisture basis) were weighed
directly into the aluminium sample canister. Then, 25 mL of deionised water was added.
A 13 min test was carried out in the RVA, including initial equilibrium for 1 min at 50oC,
heating for 3.75 min to a maximum temperature of 95oC, holding for 2.5 min at 95
oC, cooling
for 3.75 min to a temperature of 50oC, and holding for 2 min at 50
oC (Anonymous, 1995a).
Pasting characteristics measured were peak viscosity, temperature and time at which the peak
occured, minimum viscosity, final viscosity, pasting temperature, breakdown rate (the
decrease in viscosity between peak and minimum per min), retrogradation rate (the increase
in viscosity per min during cooking from 95 to 50oC), and rate of increase in viscosity during
50oC holding period. The viscosity was measured in Rapid Visco Unit (RVU), in which one
RVU was equivalent to about 12 cPoise.
Determination of Gelatinisation Temperature and Endothermic Energy by Differential
Scanning Calorimeter (DSC)
Differential Scanning Calorimeter (DSC-7 Perkin Elmer), calibrated with indium ( H 28.45
J/g, melting point 156.6oC), was used to determine the thermal transition temperature and
endothermic energy ( H). The samples (1 g) were vigorously mixed with distilled water in a small glass bottles with air tight lids to obtain a starch/water ratio of 1:2 (dry basis). Portions
(10-15 mg) of the well mixed slurries were weighed directly into a 40 L DSC pan using a micropipette, then sealed immediately. The sealed pans were allowed to stand for 2 h at
room temperature before heating from 20 to 120oC, at a scanning rate of 10
oC per min. An
empty pan was used as reference. Thermal transition temperatures of starch were defined in
terms of To (onset), Tp (peak), and Te (end) of gelatination temperature. Gelatination

endothermic energy ( H) in J/g was determined by integrating the peak area of the DSC endotherm.
Starch Paste Clarity
The method of Craig et al (1989) was adapted in measuring the paste clarity. The pastes
(1%) were prepared by suspending the starch (100 mg) in 10 mL of distilled water in screw-
cap tubes). The tubes were then heated in a boiling water bath for 30 min with occasional
shaking. The pH of the mix was varied from 2 to 10 by addition of 0.1 N HCl or NaOH as
required. After cooling to ambient temperature, the percentage of transmittace (%T) was
read at 650 nm against water as blank in a LKB Biochrom Spectrophotometer.
Freeze –thaw Stability
The procedure of Kereliuk and Sosulski (1996) with minor modification was used to measure
the freeze-thaw stability. The gels were prepared by heating the starch (6% w/w, in distilled
water) in a boiling water bath for 20 min. The gels were then placed in the 50-mL. Centifuge
tubes, and subjected to both cold storage at 4oC and frozen storage at -15
oC for the period of
seven days. The freeze-thaw stability was determined by measuring the liquid exuded
(syneresis) after 7 days of storage. The degree of syneresis, expressed as the percentage
weight loss by the gels, was determined after thawing the gels at 25oC for 6 h, and
centrifuging at 3000xg for 10 min.
Hardness of the Gel
The gels were prepared according to a modified method of Jane and Chen (1992), by heating
the starch (8% w/w, in water) in a boiling water bath for 20 min. Stirring rate and heating
were kept constant for all samples. The pastes were transferred into a modified plastic
syringe (3 cm in diameter and 5 cm in height). The pastes were sealed in plastic bags, and set
at 4oC for 48 h. Hardness of the gels was determined by using a Texture Analyser TA-XT2
with the two cycle program. The gels were cut into 1 cm height, and placed on the
compression table. The cylindrical flat end probe (5-cm diameter) was driven down so as just
to touch the gel surface. The probe was then driven down at a constant speed of 1 mm/s into
the gel for a distance of 5 mm.
Structures of the Starch Granules by Light Microscope
The starch samples were dispersed in distilled water and the granule structures were obtained
with BHC Model Olympus Compound Microscope, equipped with Olympus PM-10AOS
Automatic Photomicrographic System.
Statistical Analysis
The results reported were the means of at least two replicates. Analysis of variance wsas
performed using the Minitab Release 9.2 statistical package (Minitab Inc., 1993). Duncan
multiple range test was utilised for comparison among means.
RESULTS AND DISCUSSION
Chemical Composition
Moisture contents of the sago INA was higher than that of the other sago starch sample
(Table 1). Considering that the sample was processed by a local small-scale industry, this
high moisture content was probably due to insufficient drying in its processing.

Compared to the other sago starch samples, sago INA contained similar amounts of protein,
total ash dan fat. Sim et al (1991) reported a protein content of sago starch of about 0.02 to
0.06 %; while Arbakariya et al. (1990) reported the protein content of 0.38 – 0.57 %. Wheat
and corn starches had an appreciably higher protein while tapioca had a similar amount.
Fat content of the samples of sago starches and tapioca was significantly lower than that of
wheat and corn starches examined in this experiment. A higher fat content of sago starch
sample of 0.20 – 0.30 % was reported by Arbakariya et al. (1990). Meanwhile, Swinkels
(1985a) reported a fat content of wheat, corn and tapioca of 0.8, 0.7, and 0.1% respecitively.
Total Starch and Amylose contents
Statistically, there was no significant differences in the total starch content of the samples
analysed in this study. For comparison, the total starch content of several starch sources
adapted from selected literatures is also given in Table 2.
As shown in Table 2, sago INA sample contained an insignificantly lower starch compared
with sago Mal sample. Considering that these samples were derived from similar botanical
origins, this slight difference could be due to different environmental conditions during
growing or due to technical factors. There was apparently an indication that the purity of the
sago INA sample was slightly lower, most likely due to a less-developed method in its
prosessing. As discussed in Chapter 1, sago starch may be prepared by either traditional or
modern methods. The starch prepared by the traditional method, as in the case for sago INA,
would contain relatively higher concentration of impurities resulting in a lower starch content
and quality. One way to overcame this shortcoming would be by fostering the development
of a more shopisticated sago starch refinery.
Amylose content of sago INA was similar to that of other sago starch samples, but it was
higher compared to that of wheat, corn and tapioca. As a comparison, selected literature
values on amylose content of several starches are also given in Table 3. As shown in Table 3,
the values for amylose content varied between the starch sources, even within the same
botanical origin.
RVA Pasting Characteristics
The pasting properties derived from RVA curves are summarised in Table 4. Several
differences of the properties between the starches analysed were noted.
Peak viscosities of the sago INA and MAL were higher than those of other starches.
Amongst properties of the starch samples analysed, the size of the granules might contribute
to this difference in peak viscosity, with sago INA and sago MAL having the biggest sizes
and highest peak viscosities. The peak viscosity indicated the ability of the stach granules to
swell freely before their physical rupture (Rasper, 1982), with the starch having a high peak
viscosity also possessing a high swelling power (Leach et al, 1950); Swinkels, 1985b).
For industrial application, a high-viscous type of starch may be beneficial. In this regard, in
order to prepare a paste with a given viscosity, for example, a lesser amount of such a starch
would be required than with a low-viscous type of starch.
Final viscosity indicated the ability of the starch samples to from a viscous paste or gel after
cooking and cooling. At the end of the RVA test, sago MAL produced the most viscous
paste; while sago arenga produced the least viscous paste.

Temperature and time at which the peak occured indicated the vulnerability of the granules to
breakdown. The results of this study indicated that all sago and tapioca starches underwent
granule rupture at a relatively lower temperature compared to wheat and corn starches.
Wheat and corn starches had similar peak temperature of 95oC, but the latter occured earlier.
This suggested that corn starch was relatively easier to cook that ws the wheat starch. Peak
time was positively correlated with the lipid content of the samples, with a correlation
coefficient of 0.94. As discussed by Swinkels (1985a), it seems that lipid, complexed with
amylose, in the cereal starch samples might have reduced the water binding capacity, the
swelling, and the solubilisation of the starch, resulting in a delay of the gelatinisation process.
Rate of viscosity increase or the steepness of the initial rise in viscosity of the RVA curves
was a reflection of th heterogeneity of the starch granule. From this analysis, the granules of
wheat and corn starches had lower rates in viscosity increase. This suggested that their
granules had swollen over a wider range of temperatures, indicating a more heterogneous
distribution of granules. On the other hand, sago INA and sago MAL which had a steeper
viscosity increase suggested more homogenous distribution of granules.
Breakdown rate indicated the fragility of the swollen granules of the samples to the shearing
and mixing. This effect was also observed when temperature was held constant at 95oC for
about 2.5 min during the test. Starches showing a high peak viscosity and hence a high
swelling power were also characterised by a lesser resistance to a breakdown on cooking,
resulting in a rapid viscosity decrease (Rasper, 1982). Sago INA and MAL had higher
breakdown rate; while wheat and corn starches exhibited a lower rate indicating a more stable
paste. Seemingly, these sago starch samples would require such a chemical modification as
cross-linking, if they are to be incorporated into food systems that require a hot stable paste,
such as sterilisation or canning. Cross-linking would greatly imporve the resistance of starch
to mechanical breakdown.
Further increase in temperature after the peak occured was associated with disintegrating of
swollen granules. The hot starch paste would consist of exuded amylose, fragments of
granules, and colloidally and molecularly dispersed starch molecules (Olkku and Rha, 1978;
Dengate, 1984). The increase in viscosity upon cooling was most likely due to the
reassociation of the fragmentd and dispersed molecules. Retrogradation rate measured the
increase in viscosity upon cooling from 95 to 50oC. Sago MAL had the highest rate, and
sago arenga had the least rate. The viscosity of all samples increased further when
temperature was held constant at 50oC for another 2 min. This suggested that at cohesive
network might have been formed during retrogradation.
Thermal Transition Temperatures and Endothermic Gelatinatinisation Energy
The onset temperature (To), peak temperature (Tp), end temperature (Te), and gelatinisation
endothermic energy ( H) of the samples in the present study are given in Table 5. All samples gave a single gelatinisation endotherm.
The gelatinisation temperature ranges (Te – To) varied from 10.4oC to 15.7
oC. The present
values of gelatinisation temperature range for wheat, corn and tapioca samples were
markedly lower that those reported by Wootton and Bamunuarachchi (1979a) of 36, 19, and
24oC respectively. This disparity was most likely due to the difference in heating rate
employed during the DSC drun, where the present study used a heating rate of 10oC per min
while the latter authors used 16oC per min. In another study, Wootton and Bamunuarachchi
(1979b) reported that increasing heating rate in DSC test resulted in an increase of
gelatinisation temperature ranges. This is also corresponding to a lower value for corn of
7.5oC reported by Kreliuk and Sosulski (1996) who used a heating rate of 5
oC per min.
Transition enthalpies ( H) varied from 7.39 to 16.13 J/g. The value for wheat starch was slightly lower that that reported by Wolters and Cone (1992) of 9.8 J/g. The value for corn
was also lower that that reported by Bello-Perez and Paredes-Lopez (1995) of 14.7 J/g and by
Kereliuk dan Sosulski (1996) of 12.5 J/g.
The values for transition temperature and enthalpy ( H) reported in the literature varied
markedly even with similar starch samples. It is therefore of great importance to define the
procedure employed in the DSC run in studying the thermal behaviour of starch
gelatinisation, as also indicated by Wootton and Bamunuarachchi (1979b).
Among samples analysed in the present study, the transition temperatures and enthalpies
were the highest for sago INA and sago MAL and lowest for the wheat sample. Transition
temperatures and endothermic energy ( H) may reflect the intrinsic stability, heterogeneity in size, and perfection of crystalline regions of the starch granules (Zobel, 1992). The results of
this study presented two distinct thermal behaviours: (1) relatively higher values for all sago
starches and tapioca; and (2) relatively lower values for corn and wheat.
Part of the amylose molecules in cereal starches might have been complexed with fatty
substances, leading to a weaker crestalline structure (Swinkels, 1985b). This seems partly
responsible for a lower transition temperature and endothermic energy for corn and wheat
starches. On the other hand, higher values for thermal properties of sago starches and tapioca
may reflect a high degree of crystallinity, C-type in their x-ray diffraction pattern (Gorinstein
et al., 1994; Tekada et al., 1989). Working on wheat starch, Wong and Lelievre (1982) have
also shown that the starches with a greater crystallinity exhibited a greater endothermic
energy.
Granules structures were organised into a crystalline and amorphous regions. The area of
crystallinity in native starches varied between 15 – 50% (Swinkels, 1985b). Amylopectin
fraction of the starch mainly constituted the crystalline region, while amylose was in less
organised amorphous regions. Eliasson and Gudmundsson (1996) reviewed four different
types of granule crystallinity, studied by x-ray diffraction technique. They were: (1) a-type,
typical for cereal starches; (2) B-type, typical for tuber and root starches; (3) C-type, mixture
of A- and B-types; and (4) V-type, typical for gelatinized lipid-containing starch.
Starch Paste Clarity
The paste clarity is an important property of starch in an intended food application. A
transparent starch, for example, may be preferred for the thickening a fruit pie filling; but a
opaque starch might better be used for thickening a mayonnaise. The clarity of a starch may
be improved by chemical modification such as phosphorylation and estersification (Solarek,
1986).
All sago and tapioca starches had a considerably more transparent paste than corn and wheat
starches. The clarity of these starches was steady in the pH ranges of 2 to 9. At pH 10, the
clarity increased slightly for sago INA, sago MAL, corn, and wheat, and increased markedly
for sago arenga and tapioca.
The clarity of starch varied considerably, depending upon its sourde. Craig et al. (1989)
hypothesised that the opacity of starch was caused by the presence of granular remnants in
the paste. This might be true, sice the starch paste of wheat and corn formed an appreciable

amount of precipitate after 24 hour standing at room temperature whereas such a precipitate
was produced only in a very little amount from the paste of all sago and tapioca starches (data
not quantitavely measured). This might suggest that the latter starch pastes still contained an
appreciable amount of granular remnants.
During the test, the light transmitted through the swollen granules would be refracted, and the
degree of refraction would be decreased with increasing swelling of granules (Craig et al.,
1989). Starch with relatively bigger granule sizes such as potato, tapioca, and sago tended to
swell more compared to the granules with smaller sizes; this may be seen on their RVA
curves. These in turn would lead to a higher percentage of light transmission. Wheat and
corn starches, on the other hand, had a lesser extent of swollen granules resulting in a more
opaque paste.
Presumably, lipid content of the starch had also anb influende on the paste clarity. Swinkles
(1985a) noted that the presence of an amylose-lipid complex would result in a more opaque
or cloudly starch paste. The lower paste clarity of wheat and corn starch samples might be
due to this effect as well. Measuring the paste clarity of wheat and corn starches after
extracting the lipids with hot ethanol, Craig et al (1989) found a contradicted result. But they
presumed that the defatting process lead to the increased association of starch chains,
resulting in a more opaque paste.
Such other factors as the content of phosphorus and other minerals might also have an
influence on the paste clarity. However, these were not examined in this study.
Freese-thaw Stability
The freezy-thaw stability of the gel of the starches was determined by measuring the amount
of water exuded (syneresis) from the starch gel system stored at low temperature. The
increased inter-molecular and intra-molecular hydrogen bonding would give rise to forming
an aggregation of the starch chains, which separated out during gelatinisation. Freezing
would cause the starch gel to lose its hydration capacity for water molecules, resulting in
formation of sponge-like materials and syneresis of watery fluid (Schoch, 1968).
The degree of syneresis after thawing the starch gels having been stored at 4oC and -15
oC for
7 days is presented in Table 6. The degree of syneresis of sago and tapioca starch gels stored
at 4oC was significantly lower that that of wheat and corn starch gels. The value for corn
starch gel was higher than that reported by Kereliuk and sosulski (1996) of 0.4 to 2.0%.
After storage at -15oC, the samples of sago INA and sago MAL exhibited a significantly
lower degree of syneresi in comparison with the other starch gels. This indicated that these
sago starch gels showed a relatively better stability toward freezing and thawing process.
The value for wheat starch gel was lower than that reported by Hoover and Vasanthan (1994)
of 60.1%; while the value for corn starch gel was higher that that reported by Kereliuk and
Sosulski (1996) of 6.1 to 30.3%.
The starch gel having a good resistance to freeze-thaw operation would have potential for
incorporating in food systems that must undergo freezing and thawing before consumer use.
The freeze-thaw stability of a starch may be improved by introduction of subtituent
chemicals, such as acetyl, hydroxyethyl or hydroxypropyl groups, into the starch molecules
(Jarowenko, 1986; Moser, 1986; Tuschhoff, 1986).
Hardness of the Gel
Hardness of the gel of sago INA was not significantly different (p<0.01) from that of sago
MAL. Appaently, the amylose content of the samples contributed to the hardness of the gel,
with a correlation coefficient (r) of 0.74. A review by Eliasson and Gudmundsson (1996)
revealed that during heating in the gelatinisation process, most of the amylose and a lesser
amount of the amylopectin fractions were leached out forming a network gel. The firmness
of the gel was increased with time and a colder temperature.
The lipid content of the samples probably also contributed to the gel strength, with a higher
lipid content having a softer gel. Takahashi and Seib (1988) also reported that the gel of the
defatted corn and wheat starches was about 50% harder that that of their undefatted
counterparts. This might be attributed to the role of lipid in weakening the overall network
and structure of the gel during retrogradation. Due to its hydrophobic effects, lipid would
hinder the forming of hydrogen bonds resulting in a softer gel.
Lighter Microscope Photograph
The granules of sago INA and sago MAL samples were morphologically similar, with oval
and some truncated oval shapes, while the granule shape of sago arenga was elliptical. Their
granules were relatively bigger in size compared to the other starch samples. The shape of
wheat granules was fairly circular and smaller in size compared with the other starch samples
examined in the present study. The shape of corn granules was fairly regular polyhedral;
while that of tapioca granules was mostly round with a flat surface on one side.
The shape and size characteristics of the sample granules observed in the present study were
in general agreement with those reviewed by Moss (1976) and Swinkels (1985b).
CONCLUSIONS
Sago INA sample was the main material investigated in this study. The results showed that
physicochemical properties of sago INA sample were similar to those of sago MAL sample,
but different significantly with those of cereal starches (wheat and corn starch samples), with
respect to chemical compositions, amylose content, pasting properties, thermal transition
temperatures, endothermic energies, paste clarity, freeze-thaw stability and hardness of the
gels, as well as granule size and shape.
It is of great importance to note that some properties of this Metroxylon sago starch may be
beneficial for certain application in food industry. Its properties such as higher viscosity and
clarity may be suitable for thickener and fruit pie filling, respectively. Likewise, its relatively
better freeze thaw stability and harder gel may make this starch appropriate to be used in
cold/frozen food and gelling application. However, its paste resistance to shearing and
mixing at hot temperature may need to be improved, if this sago starch is to be used in the
products such as canned and sterilised foods. A more specific investigation is obviously
required to reaffirm the suitability of this starch for the intended application.
REFERENCES
Anonymous. 1995a. Rapid pasting method using the Newport rapid visco analyser. Int.
Assoc. Cereal Sci. Technol. (ICC). Draft Standard No. 162
Anonymous. 1995b. Total starch assay procedure (amyloglucosidaed/ -amylase method). Megazyme Australia, Warriewood, NSW, Australia
Arbakariya, A., Asbi, B.A., and Norjehan, R. 1990. Rheological behaviour of sago starch
during liquefaction and saccharification. Food Engineer. 10. Ann. New York Acad.
Sci., New York. 613: 610-613.
Bello-Perez, L. A. And Paredes-Lopez, O. 1995. Starch and amylopectin: effect of solures
on their calorimetric behaviour. Food Che. 53: 243-247
Craig, S. A. S., Maningat, C. C., Seib, P. A. And Hoseney, R. C. 1089. Starch paste clarity.
Cereal Chem. 66: 173-182.
Dengate, H. N. 1984. Swelling, pasting and gelling of wheat starch. Adv. Cereal Sci.
Technol. 6: 49-82.
Donnolley, P. J. And Sturgess, R. K. 1992. Food Analysis, 4th ed., 107-110. Faculty of
Science and Technology, University of Western Sydney, Hawkesbury, Richmond,
NSW, Australia.
Dransfield, J. 1977. Dryland sago palms. In Sago 76: Papers of the First International Sago
Symposium, The Equatorial Swamp as a Natural Resource, K. Tan (Ed.), 77-83.
Kemajuan Kanji Sdn. Bhd., Kuala Lumpur, Malaysia.
Egan, H., Kirk, R. S., and Sawyer, R. 1981. Pearsons’s Chemical Analysis of Foods, 8th ed.,
7-34. Longman Scientific and Technical, london, England.
Eliasson, A. –C. And Gudmundsson, M. 1996. Starch physicochemical and functional
aspects. In Carbohydrates in Foods, A.-C. Eliasson (Ed.), 431-503. Marcel Dekker,
New York.
Flach, M. 1977. Yield Potential of the sagopalm, Metroxylon sagu, and its realisation. In
Sago 76: Papers of the First International Sago Symposium, The Equatorial Swamp
as a Natural Resource, K. Tan (Ed.), 157-177. Kemajuan Kanji Sdn. Bhd., Kuala
Lumpur, Malaysia.
Gorinstein, S., Oates, C.G., Chang, Sh. –M, and Lii, C. –Y. 1994. Enzymatic hydrolysis of
sago starch. Food Chem. 49: 411-417.
Hizukuri, S. 1996. Starch: analytical aspects. In Carbohydrates in Foods, A.-C. Eliasson
(Ed.), 347-429. Marcel Dekker, New York.
Hoover, R. And Vasanthan, T. 1994. The effect of annealing on the physicochemical
properties of wheat, oat, potato, and lentil starches. J. Food Biochem. 17: 303-325.
Jane, J.-L. and Chen, J.-F. 1992. Effect of amylose molecular size and amylopectin branch
chain length on paste properties of starch. Cereal Chem. 69: 60-65.
Jarowenko, W. 1986. Acetylated starch and miscellaneous organic esters. In Modified
Starches: Properties and Uses, O.B. Wurzburg (Ed.), 55-77. CRC Press, Inc.,
Florida
Johnson, D. 1977. Distribution of sago making in the old world. In Sago 76: Papers of The
First International Sago Symposium, The Equatorial Swamp as a Natural Resource,
K Tan (Ed.), 65-7, 6. Kemajuan Kanji Sdn, Bhd., Kuala Lumpur, Malaysia.
Kereliuk, G.R. and Sosulski, F.w. 1996. Comparison of starch from flint corn with that from
dent corn and potato. Lebensm. –Wiss. U. –Technol. 29: 349-356.
Kim, Y.S., Wiesenborn, D.P., Orr, P.H., and Grant, L.A. 1995. Screening potato starch for
novel properties using differential scanning calorimetry. J. Food Sci. 60: 1060-1065.
Leach, H. W., McCowen, L. D., an Schoch, T.J. 1959. Structure of the starch granule. I.
Swelling and solubility patterns of various starches. Cereal chem. 36: 534.
McCleasry, B.V., Solah, V., and Gibson, T. S. 1994. Quantitative measurement of total
starch in cereal flours and products. J. Cereal Sci. 20: 51-58.
Moser, K. B.. 1996. Hydroxyethylated starches. In Modified Starches: Properties and Uses,
O. B. Wurzburg (Ed.), 79-88. CRC Press, Inc., Florida.
Moss, G. E. 1976. The Microscopy of starch. In Examination and Analysis of Starch and
Starch Products, J.A. Radley (Ed.), 1-32. Applied Science Publisher Ltd., London
Olkku, T., and Rha, C. 1978. Gelatinization of starch and wheat flour starch – a review.
Food Chem. 3: 293-317.
Rasper, V. 1982. Theoretical aspects of amylographology. In The Amylograph Handbook,
W.C. Shuey and K. H. Tipples (Ed.).\, 1-6. Am. Assoc. Cereal Chem., St. Paul
Minnesota.
Schoch, T.J. 1968. Effects of freezing and cold storage on pasted starches. In The Freezing
Preservation of Foods. Vol 4: Freezing of Precooked and Prepared Foods, 4th ed.,
D.K. Tressler, W.B., Van Arsdel and M.J. Copley (Ed.), 44-56. The AVI Publ.
Company, Inc., Westport, Connecticut.
Sim, S.L., Oates, C.G. and Wong, H.A. 1991. Studies on sago starch. Part I:
Characterization and comparison of sago starches obtained from Metroxylon sagu
processed at different times. Starch/Starke 43: 459-466.
Solarek, D.B. 1986. Phosphorylated starches and miscellaneous inorganic esters. In
Modified Starches: Properties and Uses, O.B. Wurzburg (Ed.), 97-112. CRC Press,
Inc., Florida.
Swinkels, J.J.M. 1985a. Composition and properties of commercial native starches.
Starch/Starke 37: 1-5.
Takahashi, S. and Seib, P.A. 1988..Paste and gel properties of prime corn and wheat starches
with and without native lipids. Cereal chem. 65: 474-483.
Takeda, Y., Shitaozono, T., and Hizukuri, S. 1988. Molecular structure of corn starch.
Starch/Starke 40: 51-55.
Tuschhoff, J.V. 1986. Hydroxypropylated starches. In Modified Starches: Properties and
Uses, O.B. Wurzburg (Ed.), 89-96. CRC Press, Inc., Florida.
Wolters, M.G.E., and Cone, J.W. 1992. Prediction of degradability of starch by
gelatinization enthalpy as measured by differential scanning calorimetry.
Starch/Starke 44: 14-18.
Wong, R.B.K. and Lelievre, J. 1982. Comparison of the crystallinities of wheat starches
with different swelling capacities. Starch/Starke 34: 159-161.
Wootton, M., and Bamunuarachchi, A. 1979a. Application of differential scanning
calorimetry to starch gelatinization. I. Commercial native and modified starch.
Starch/Starke 31: 262-264.
Wootton, M., and Mahdar, D. 1993. Properties of starches from Australian wheats. Part I:
Separation of starch and gluten. Starch/Starke 45: 255-258.
Zobel, H.F. 1992. Starch granule structure. In Developments in Carbohydrate Chemistry,
R.J. Alexander and H.F. Zobel (Ed.), 1-36. Am. Assoc. Cereal Chem., St. Paul,
Minnesota.

Tabel 1. Chemical compositions of sago starch in comparison with those of other
starches1,2
Samples Moisture
(% wet basis)
Crude protein3
(% dry basis)
Crude fat
(% dry basis)
Total ash
(% dry basis)
Sago INA 13.96a 0.05
a 0.14
a 0.22
a
Sago Mal 9.72d 0.02
b 0.08
a 0.13
b
Sago Arenga 10.03cd
0.06a 0.08
a 0.25
a
Wheat 12.30ad
0.35c 0.80
b 0.17
b
Corn 6.81c 0.25
d 0.89
c 0.81
c
Tapioca 11.56bc
0.05a 0.08
a 0.56
d
1 Values were means of duplicates
2 Mean values in each column not followed by the same superscript were significantly
different (p<0.01) 3%Crude protein was calculated as %total N x 6.25
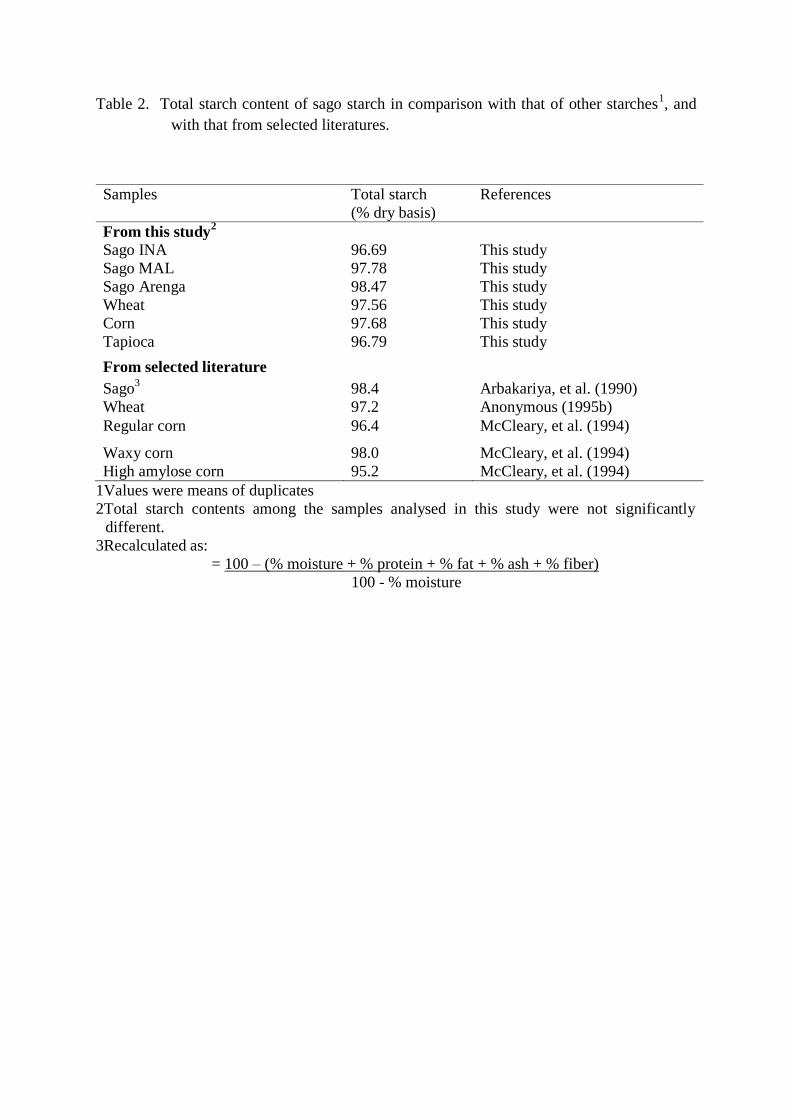
Table 2. Total starch content of sago starch in comparison with that of other starches1, and
with that from selected literatures.
Samples Total starch
(% dry basis)
References
From this study2
Sago INA 96.69 This study
Sago MAL 97.78 This study
Sago Arenga 98.47 This study
Wheat 97.56 This study
Corn 97.68 This study
Tapioca 96.79 This study
From selected literature
Sago3 98.4 Arbakariya, et al. (1990)
Wheat 97.2 Anonymous (1995b)
Regular corn 96.4 McCleary, et al. (1994)
Waxy corn 98.0 McCleary, et al. (1994)
High amylose corn 95.2 McCleary, et al. (1994)
1Values were means of duplicates
2Total starch contents among the samples analysed in this study were not significantly
different.
3Recalculated as:
= 100 – (% moisture + % protein + % fat + % ash + % fiber)
100 - % moisture
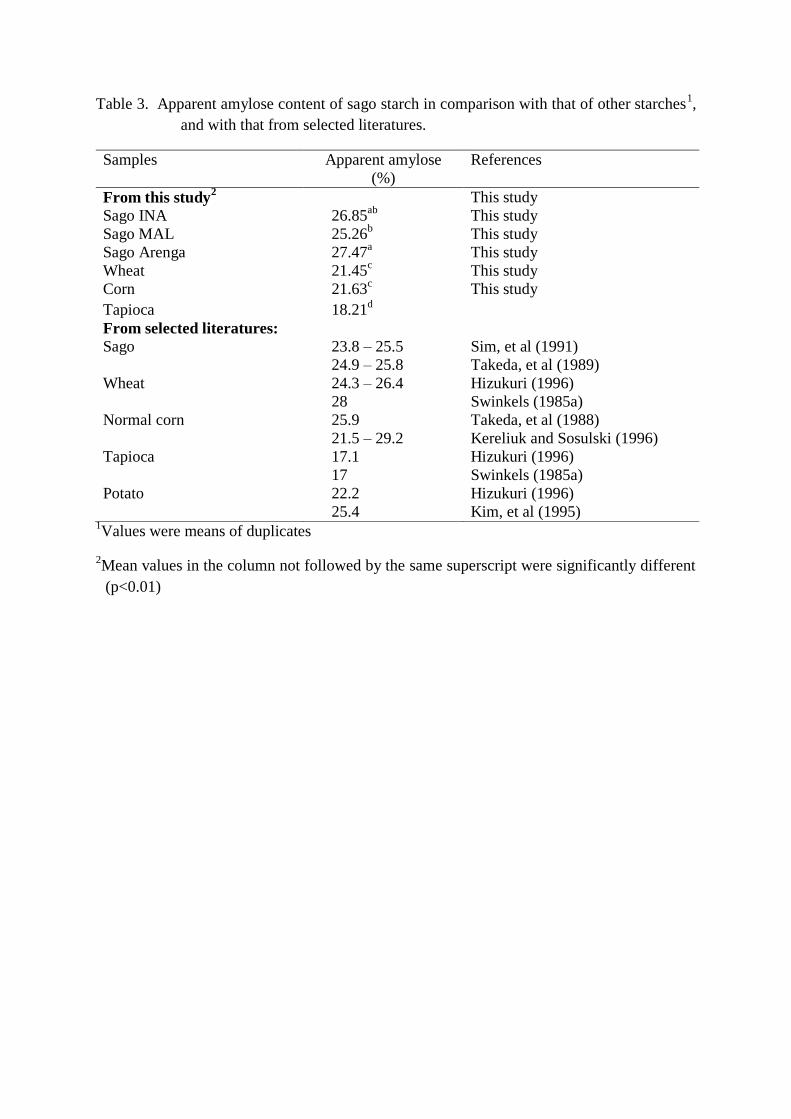
Table 3. Apparent amylose content of sago starch in comparison with that of other starches1,
and with that from selected literatures.
Samples Apparent amylose
(%)
References
From this study2 This study
Sago INA 26.85ab
This study
Sago MAL 25.26b This study
Sago Arenga 27.47a This study
Wheat 21.45c This study
Corn 21.63c This study
Tapioca 18.21d
From selected literatures:
Sago 23.8 – 25.5
24.9 – 25.8
Sim, et al (1991)
Takeda, et al (1989)
Wheat 24.3 – 26.4
28
Hizukuri (1996)
Swinkels (1985a)
Normal corn 25.9
21.5 – 29.2
Takeda, et al (1988)
Kereliuk and Sosulski (1996)
Tapioca 17.1
17
Hizukuri (1996)
Swinkels (1985a)
Potato 22.2
25.4
Hizukuri (1996)
Kim, et al (1995) 1Values were means of duplicates
2Mean values in the column not followed by the same superscript were significantly different
(p<0.01)

Table 4. RVA pasting properties of sago starch in comparison with those of other starches
RVA pasting
properties 1,2
Samples
Sago INA Sago MAL Sago Arenga Wheat Corn Tapioca
Peak viscosity
(RVU)
185.91a 231.69
b 94.16
c 84.73
c 117.68
d 128.96
e
Peak occured at:
Temperature (oC)
Time (min)
81.15a
3.50a
84.25b
3.88b
80.78a
3.47a
95.00c
6.34c
95.00c
5.48d
84.98b
3.90b
Minimum
viscosity (RVU)
65.72a
99.91b
20.50c
70.42d
89.62c
57.79f
Final viscosity
(RVU)
105.79a
162.04b
28.13c
121.38d
149.92c
76.67f
Pasting
temperature (oC)
75.10a
73.93ab
72.95c
93.10c
87.93d
70.98e
Breakdown rate
(RVU/min)
26.72a
34.49b
12.87c
7.93d
10.45cd
18.10e
Retrogradation
rate (RVU/min)
5.97a
12.95b
0.64c
5.96a
6.83a
2.34d
Rate of viscosity
increasing before
peak (RVU/min)
422.12a
238.91b
139.66c
40.01d
78.10e
97.48f
Rate of viscosity
decrease during
95oC holding
time (RVU/min)
32.01a
27.03b
10.83cd
9.27d3
12.13c3
17.19e
Rate of viscosity
increase during
50oC holding
time (RVU/min)
5.84a 6.42
b 2.32
c 12.80
d 15.31
e 4.36
f
1Values were means of duplicates
2Mean values in each row sharing the same superscript were not significantly different
(p<0.01) 3The values were calculated only from the descending slope starting from the peak because
the peak was reached after 95oC.
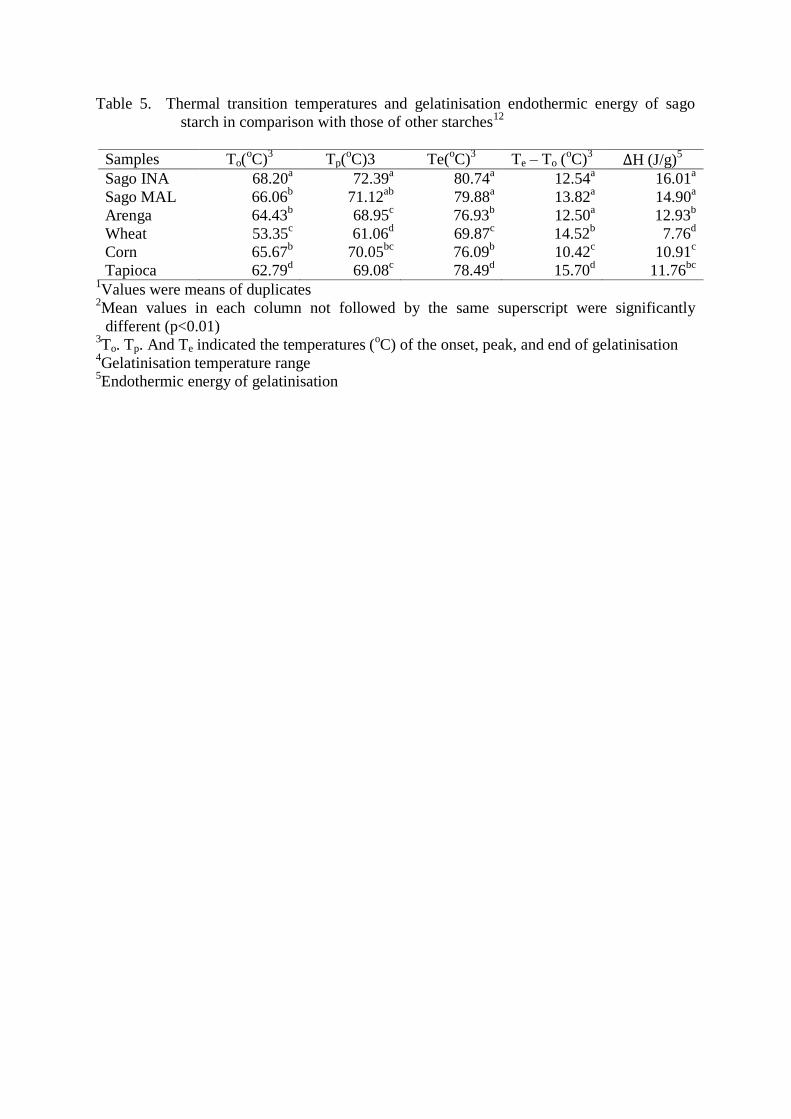
Table 5. Thermal transition temperatures and gelatinisation endothermic energy of sago
starch in comparison with those of other starches12
Samples To(oC)
3 Tp(
oC)3 Te(
oC)
3 Te – To (
oC)
3 H (J/g)
5
Sago INA 68.20a 72.39
a 80.74
a 12.54
a 16.01
a
Sago MAL 66.06b 71.12
ab 79.88
a 13.82
a 14.90
a
Arenga 64.43b 68.95
c 76.93
b 12.50
a 12.93
b
Wheat 53.35c 61.06
d 69.87
c 14.52
b 7.76
d
Corn 65.67b 70.05
bc 76.09
b 10.42
c 10.91
c
Tapioca 62.79d 69.08
c 78.49
d 15.70
d 11.76
bc
1Values were means of duplicates
2Mean values in each column not followed by the same superscript were significantly
different (p<0.01) 3To. Tp. And Te indicated the temperatures (
oC) of the onset, peak, and end of gelatinisation
4Gelatinisation temperature range
5Endothermic energy of gelatinisation

Table 6. Freeze-thaw stability of the gels of sago starch in comparison with those of other
starches1,2
Samples Degree of syneresis (%)3
4oC -15
oC
Sago INA 0.20a 28.09
a
Sago MAL 0.27a 25.93
b
Sago Arenga 0.38a 51.53
c
Wheat 1.19b 44.76
d
Corn 8.17c 64.80
e
Tapioca 0.24a 34.79
f
1Values were means of three replicates
2Means values in each column not followed by the same superscript were significantly
different (p<0.01) 3Syneresis was measured by the percentage of water exuded after thawing the gels having
been stored at 4oC and -15
oC for 7 days
Top Related