


Languages
Pages
Legal


INTERREG Levende bodem project bijeenkomst, Wageningen, 15th February 2017 - 1
www.phosphorusplatform.eu
Phosphate challenges in the Netherlands within a European context
Kimo van Dijk - European Sustainable Phosphorous Platform • [email protected]
• www.phosphorusplatform.eu @phosphorusfacts

Primary phosphorus chain
Source: Cordell, D., J. O. Drangert, et al. (2009). "The story of phosphorus:
Global food security and food for thought." Global Environmental Change-
Human and Policy Dimensions 19(2): 292-305.
Non-renewable at human time scale
Spatially concentrated: geopolitical
dependency and tension
Relatively low price, but price
volatility (2008 case)
Lower P-rock quality:
● Decreasing P content
● Increasing impurities (e.g.
cadmium, uranium)
Pollution and eutrophication

Current ‘linear’ use: primary P input
Source: Fertilizers Europe, 2012, adapted
from Environmental Aspects of Phosphate
and Potash Mining, UNEP & IFA, 2001.
Rehabilitation
Beneficiation
Exploration
Application
Plant Uptake
Food-Feed-Fuel
Consumption
Harvest
Waste & Losses
Recycling
Mineral P
Waste & Losses
Recycling
Mining Processing
Distribution
Closing the cycle
at the level of:
Farm
City
Region
Country
Continent
World
Sewerage
Food processing and
Catering waste
Household waste
Erosion
Run-off

Phosphorus use in the EU-27 in 2005
Detergent,
wood, paper
& fibres
Crops, fish,
food products &
mineral additives
Animal feed,
mineral additives
& live animals
Mineral fertiliser,
seeds & pesticides
Solid & liquid
organic waste
Organic waste
Wood, paper &
fibres
Slaughter
residues, solid &
liquid waste
Crops &
food products
Manure losses
Live animals
Leaching & runoff
Seeding materials
Input 2392
Output 1468
Flows & stocks in Gg = Mkg = kton P per year
Van Dijk et al. (2016)

EU-27 import, export and losses per sector
Van Dijk et al. (2016)
0
500
1000
1500
2000
2500
Gross import Gross export Net trade Losses Accumulation
Ph
osp
ho
rus
qu
anti
ty [
Gg
P/y
ear
]
Absolute quantity
[Gg P/year]
Relative fraction of total
system import, export &
losses [%]
Primary P import
Import Export Losses Import Export Losses Gg P/year % of
total
system
primary
import
% of
total
sector
import
CP 1399 4 84 58 1 7 1391 78 99
AP 440 21 62 18 9 5 250 14 57
FP 338 216 339 14 86 28 27 2 8
NF 215 11 77 9 4 6 110 6 51
HC - - 655 - - 54 - - -
Total 2392 251 1217 100 100 100 1777 100

EU-27 P use efficiency per sector
Van Dijk KC, Lesschen JP, Oenema O. Phosphorus flows and
balances of the European Union Member States. Sci Total Environ
2016. DOI 10.1016/j.scitotenv.2015.08.048
CP AP FP NF HC
PUE-1 Output flows minus losses 70 97 80 76 21
PUE-2 Upward output flows plus
export
70 24 52 76 -
𝑃𝑈𝐸𝑠𝑒𝑐𝑡𝑜𝑟 = 𝑂𝑢𝑡𝑝𝑢𝑡𝑒𝑓𝑓𝑒𝑐𝑡𝑖𝑣𝑒
𝐼𝑛𝑝𝑢𝑡𝑡𝑜𝑡𝑎𝑙∗ 100

Per ha P use EU-27 versus Netherlands
Van Dijk KC, Lesschen JP, Oenema O.
Phosphorus flows and balances of the European Union Member States
Sci Total Environ 2016.
DOI 10.1016/j.scitotenv.2015.08.048
Flows & stocks in:
kg P / hectare agricultural land /year

Animal feed P origin in EU-27
Source: Miterra-Europe model,
CAPRI & FAOSTAT data 2003-2005

Agricultural P balances per country for
2005 & period 1905-2005
Van Dijk et al. (submitted) Van Dijk et al. (2016)
128 Mtons P accumulated
in agricultural soils between 1905 -2005

Agronomic P balances in the EU
Annual regional agricultural P balances [kg P/ha] for EU-15 in 2000
Estimated cumulative P balances [kg P/ha] of EU countries during 1991–2005
Source: Csathó & Radimszky 2012
Source: Grizzetti
& Aloe, 2007

Phosphorus flows in NL for 2011
IMPORT
110.5 ± 4.0 EXPORT
69.0 ± 4.0
SURPLUS
41.6 ± 3.9
Smit et al. 2015. A substance flow analysis of phosphorus in the food production, processing and
consumption system of the Netherlands. DOI 10.1007/s10705-015-9709-2
Gg P per year

Phosphorus balance & losses in NL in 2011
Import Export Net balance
Fertilizer 7 +7
Feed 67.1 +67.1
Food 32.9 49.2 -16.3
Non-food 3.4 1.3 +2.1
Animals 0.2 +0.2
Manure 16 -16
Waste 2.4 -2.4
TOTAL 110.6 68.9 41.7
Potential losses Gg P/year
Sequestered 23.2
Accumulation soils 11.8
Emissions to water 6.6
TOTAL 41.6 Smit et al. 2015. A substance flow analysis of phosphorus in
the food production, processing and consumption system of
the Netherlands. DOI 10.1007/s10705-015-9709-2

Average phosphate surplus in Dutch
agriculture 1880-2010
-10
0
10
20
30
40
50
60
70
80
90
1860 1880 1900 1920 1940 1960 1980 2000 2020
Year
Su
rplu
s,
kg
P2O
5/h
a
-1000
0
1000
2000
3000
4000
5000
6000
7000
8000
9000C
um
ula
tive s
urp
lus, k
g P
2 O5 /h
a
AnnualCumulative
Target2015
1 kg P = 2.29 kg P2O5 Ehlert et al., 2011
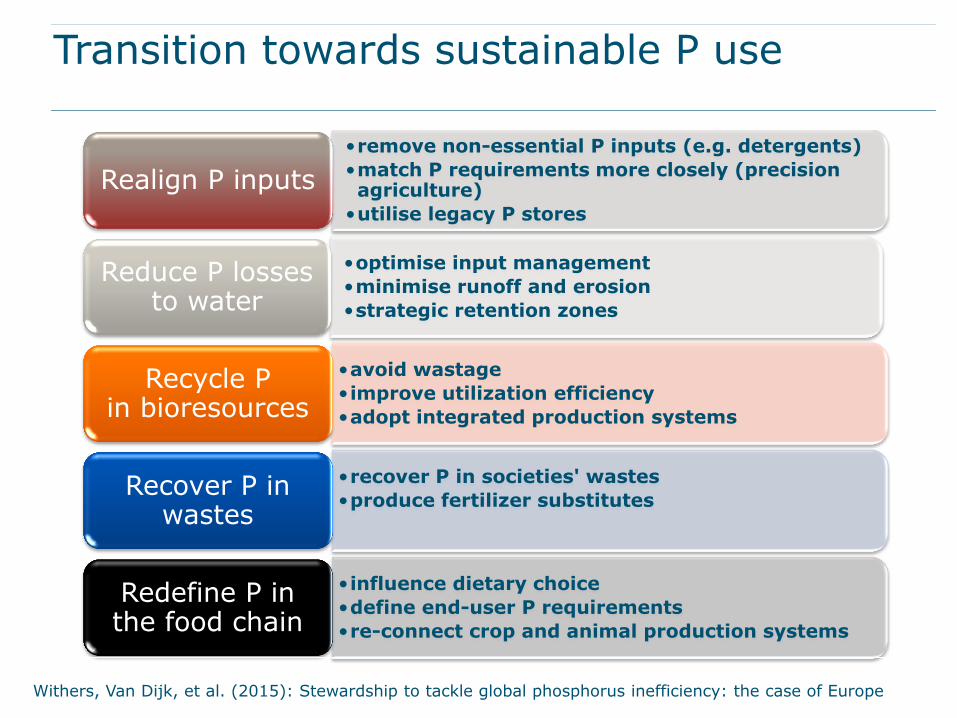
Transition towards sustainable P use
•remove non-essential P inputs (e.g. detergents)
•match P requirements more closely (precision agriculture)
•utilise legacy P stores
Realign P inputs
•optimise input management
•minimise runoff and erosion
•strategic retention zones
Reduce P losses to water
•avoid wastage
•improve utilization efficiency
•adopt integrated production systems
Recycle P in bioresources
•recover P in societies' wastes
•produce fertilizer substitutes
Recover P in wastes
•influence dietary choice
•define end-user P requirements
•re-connect crop and animal production systems
Redefine P in the food chain
Withers, Van Dijk, et al. (2015): Stewardship to tackle global phosphorus inefficiency: the case of Europe

Concentrated feed fertilizer
P import
Livestock
Manure
Akkerbouw
P export Agricultural P cycle
Arable land
Bio-refinery
Reduction
P input
P-
recovery
Mineral
concentrates
Manure
separation 3
4
5
1
2
Non-food
The Netherlands: P out of
agriculture P cycle:
40 million kg manure P2O5
Intervention scheme technical solutions
10 mill. kg P2O5
1-5 mill. kg P2O5
1-5 mill. kg P2O5

Recovery of P products from wastes

Pig slurry
Fertlizer industry (e.g. ICL Fertilizers Europe)
Phosphate ash fertilizer
Phosphate fertilizer
Phosphor (P4)
Liquid fraction
Wet solid fraction
P-Biochar
Phosphate and Phosphorus recovery from manure
Communal waste water
Pretreatment (N,K & P)
Drying
P producer (THERMPHOS)
SNB (sludge treatment) (incineration & energy production)
WWTP (waste water treatment plant)
Incineration/Biomass plant (incineration & energy production)
Pyrolysis plant (BTG, … icw ECN)
Biogas/ CHP/ residual heat
Dry solid fraction
Short term
Long term
Export
Agricultural land
Source: Schoumans et al., 2011
household waste
Production of secondary P for industries with
an existing international market
Mineral concentrates
Effluent

INTERREG Levende bodem project bijeenkomst, Wageningen, 15th February 2017 - 18
www.phosphorusplatform.eu
Regulatory drivers - EU 2014: EU Consultative Communication on Sustainable Use of Phosphorus 2014: phosphate rock on EU Critical Raw Materials List 2015: EU Circular Economy Package 2016: EU Fertilisers Regulation
revision proposal (underway) 2016: CEN position on standards
needs to support P-recycling
http://ec.europa.eu/environment/natres/phosphorus.htm
http://europa.eu/rapid/press-release_MEMO-14-377_en.htm

INTERREG Levende bodem project bijeenkomst, Wageningen, 15th February 2017 - 19
www.phosphorusplatform.eu Regulatory drivers – national 2005: Denmark tax on P in livestock feed 2013: Denmark Resource Strategy
80% recycling of sewage P (in. biosolids to crops (objectives only)
2013: HELCOM Ministerial Declaration to “enhance” P recycling
2015: Sweden 40% P and 10% N recycling inc. biosolids to crops (objectives only)
2016: Switzerland decree P-recovery from sewage (obligation - promulgated)
2016: Germany decree P-recovery from sewage (obligation wwtp > 50 kpe, notified to EU)

INTERREG Levende bodem project bijeenkomst, Wageningen, 15th February 2017 - 20
www.phosphorusplatform.eu
2016- 2017 EU Fertilisers Regulation - Currently in Council - Parliament decision process - Fertilisers (mineral & organic), soil amendments, etc - EU criteria for composts, digestates, food industry wastes and animal by-products - Sewage biosolids excluded - No provision for traceability - STRUBIAS JRC expert group underway, addition of: struvite, ashes, biochars - Large discussions about contaminations (Cd) and definition organic vs. mineral fertilisers - Many issues remaining! see www.phosphorusplatform.eu/regulatory
http://ec.europa.eu/DocsRoom/documents/15949

INTERREG Levende bodem project bijeenkomst, Wageningen, 15th February 2017 - 21
www.phosphorusplatform.eu
Phosphorus recycling synergies • Improving sewage treatment (nutrient removal) • Reducing ammonia emissions • Anaerobic digestion & biogas • Avoiding landfill • Rural economy development
http://www.aljazeera.com/programmes/earthrise/2014/12/re
cycling-phosphorus-2014121693225616272.html

INTERREG Levende bodem project bijeenkomst, Wageningen, 15th February 2017 - 22
www.phosphorusplatform.eu
Nutrient recycling products • Refined fertiliser products • Organic fertilisers:
- composts, digestates - dried pelleted bio-wastes
• Mineral concentrates • Industrial chemicals:
- phosphoric acid - P4 (white phosphorus)
• Key = product must correspond to user requirements needs and requirements (quality, equipment, logistics …)

INTERREG Levende bodem project bijeenkomst, Wageningen, 15th February 2017 - 23
www.phosphorusplatform.eu
New business opportunities P-recycling inputs Livestock manures Wastewater treatment Food wastes Meat & Bone Meal Ash Agro-industry, industrial Biofuels, biomaterials
www.phosphorusplatform.eu/successstories

24 European Sustainable Phosphorus Platform
Success story: Ecophos P-recycling from sewage sludge ash • Pilot plant operational Varna, Bulgaria • Produce DCP (Di Calcium Phosphate) for fertilisers, animal feed • Full-scale plant under construction Dunkerque, France
capacity: 200 000 t/y DCP from low grade P-rock and ash • Contract to treat 60 000 t/y ash from Netherlands (SNB – HVC Groep)
= 4 000 t/y P See SCOPE Newsletter 111 and www.ecophos.com

25 European Sustainable Phosphorus Platform
Success story: ICL fertilisers Amsterdam & Ludwigshaven • Use of secondary materials
in fertiliser production: - meat and bone meal ash - struvite
• Objective: 100% by 2025 • Pilot testing successful • Industrial installations
(storage, handling) planned www.icl-group.com

26 European Sustainable Phosphorus Platform
Success story: Timac: struvite as maize starter fertiliser • NuReSys Recovered struvite from potato processing • Non-burning, enabling “ultra localisation” next to roots • Micro-granulation • Ammonium addition for nutrient balance

27 European Sustainable Phosphorus Platform
Success story: Friesland Campina milk cooperative, NL • Biogas production and P-recovery from manure • Bonus/malus in milk purchase prices • Funding support for farmers’
manure treatment investments
www.frieslandcampina.com

Thank you for
your attention
Questions? Suggestions? Collaboration? [email protected] [email protected] Twitter: www.twitter.com/kimovandijk Website: kimovandijk.weebly.com

Additional literature and links
Van Dijk et al. 2016. Phosphorus flows and balances of the European Union Member States.
Withers et al. 2015. Stewardship to tackle global phosphorus inefficiency: The case of Europe.
Schoumans et al. 2015. Phosphorus management in Europe in a changing world.
Withers et al. 2015, Greening the global phosphorus cycle: How green chemistry can help achieve planetary P sustainability.
Outcomes 2nd Scientific European Phosphorus Workshop in Wageningen: http://www.wageningenur.nl/sepw2013
Lesschen et al. 2013. Options for closing the phosphorus cycle in agriculture; Assessment of options for Northwest Europe
and the Netherlands. edepot.wur.nl/289653
K.A. Wyant, J.R. Corman, and J.J. Elser. Phosphorus, Food, and Our Future. Oxford University Press, New York City, New
York, USA. http://ukcatalogue.oup.com/product/9780199916832.do#.UcHr6fY6VVM
European Commission - Sustainable Phosphorus Use:
http://ec.europa.eu/environment/integration/research/newsalert/pdf/IR7.pdf
Dutch Nutrient Platform: www.nutrientenplatform.nl and
European Sustainable Phosphorus Platform: www.phosphorusplatform.eu

30 European Sustainable Phosphorus Platform
Success story: Fertikal, Antwerp • 180 000 t/y (wet weight) manure
processed to organic fertilisers: • solid/liquid separation
dried, pelletised • For agriculture, horticulture • Distributed
to 25 countries worldwide www.fertikal.be

31 European Sustainable Phosphorus Platform
Success story: COOPERL / Brittany farmers’ cooperatives • 400 000 t/y manure processed to organic fertiliser product
- 150 000 t composted poultry litter - 150 000 t dried poultry manure - 100 000 t pig manure (1 100 farms)
• Adapted to specific crops and exported to other regions of France • Positive farmer acceptance • TRAC Emeraude stabling system Supported by EU Investment Plan http://www.cooperl.com/en/environmental-solutions

32 European Sustainable Phosphorus Platform
Success story: Fibrophos UK • Bioenergy and fertiliser (ash) from chicken litter • Since the 1990’s • Phosphorus, potassium, sulphur, trace elements • 800 000 t/y chicken litter processed annually • P shows both immediate and durable crop
http://www.fibrophos.co.uk/phosphate-in-fibrophos-fertiliser/

33 European Sustainable Phosphorus Platform
Success story: SARIA UK – Kalfos • P-fertiliser and soil conditioner
from combustion of animal by-products (MBM) • Authorised for arable and grazing land • 12 000 tonnes/year http://www.kalfos.co.uk/

INTERREG Levende bodem project bijeenkomst, Wageningen, 15th February 2017 - 34
www.phosphorusplatform.eu
ESPP: a coalition for action • Bring together industry, R&D, authorities, stakeholders
water & waste industries, mineral and organic fertilisers, chemicals, P-recycling technology suppliers, national & regional governments, knowledge institutes …
• Build awareness and share a vision for sustainable phosphorus in Europe
• Dialogue & network expertise and experience • Assess and propose policy & regulatory developments • Disseminate innovation, business cases, value chains
Top Related