


Languages
Pages
Legal


THIS REPORT CONTAINS ASSESSMENTS OF COMMODITY AND TRADE ISSUES MADE BY
USDA STAFF AND NOT NECESSARILY STATEMENTS OF OFFICIAL U.S. GOVERNMENT
POLICY
Date:
GAIN Report Number:
Approved By:
Prepared By:
Report Highlights:
Local ethanol production is expected to increase through 2017 due to a modest buildup in capacity.
Imports are expected to decline from 311 million liters (MLi) in 2015 to 281 MLi in 2016, declining
again to 278 MLi in 2017. Meeting the current 10 percent ethanol blend using local ethanol remains
problematic. For biodiesel, while there have been no compliance issues with the present two percent
blend mandate, increasing biodiesel prices have forced the postponement of implementing a five percent
blend in 2015. In general terms, increasing prices of locally produced biofuels, coupled with declining
global oil prices is likely forcing the Philippine government to rethink its current energy policy,
including those for renewable energy and biofuels.
Perfecto Corpuz
Ralph Bean
Philippine Biofuels Situation and Outlook
Biofuels Annual
Philippines
Required Report - public distribution
Post:
Executive Summary:
The Biofuels Act or Republic Act (RA) 9367 was signed in January 2007 making the Philippines the
first country in Southeast Asia to have biofuels legislation in place. Sugarcane and molasses are used in
Philippine ethanol production, while coconut oil (CNO), where coconut methyl ester (CME) is derived,
is the preferred biodiesel feedstock. The current blend mandates are 10 percent and two percent for
ethanol and biodiesel, respectively.
Meeting the current ten (10) percent ethanol blend using local ethanol, however, has been problematic;
while there have been no supply issues complying with the mandated two percent blend for biodiesel.
The Biofuels Act gives priority to local ethanol over imports, but the mandated blend historically has
largely been met through the latter.
In 2015, the Philippines was the 3rd largest market for U.S. ethanol in 2015 (with sales over $170
million). Overall ethanol imports, however, declined nine percent to 311 million liters (MLi) from 339
MLi in 2014 due to increased local production. Last year, there were eight ethanol plants operating,
unchanged from the previous year’s level, with a combined capacity of 222 MLi. Based on preliminary
data from the Philippine government (GPH), the 10 percent blend was not reached in 2015. By 2017,
Post predicts 11 distilleries, with aggregate capacity of 322 MLi, will produce close to 300 MLi or
roughly half of total ethanol requirements. Compliance with the 10 percent mandate this year is
expected due to stricter enforcement as local output increases. This is premised on an optimistic
capacity utilization rate of above 90 percent for 2016 and 2017. As a result, imports are projected to
decline through 2017.
On the other hand, RA 9367 disallows biodiesel importation, and local biodiesel has consistently met
blend requirements. Last year, 11 refineries produced 204 MLi, well over B2 (2 percent biodiesel
blend) requirements with carryover stocks, and strengthening its position for a possible increase in the
blend mandate in 2015. Capacity utilization was only at 35 percent of total aggregate capacity of 585
MLi in 2015. The planned B5 blend last year did not happen, however, and is assumed to be
implemented in 2016.
The GPH’s goal is to raise the ethanol mandate to 20 percent by 2020 and the biodiesel mandate to 10
percent (also by 2020, but increasing to 20 percent by 2030). Existing production capacity, however,
will only support marginal increments in blending that fall far short of targets, and delivery
infrastructure is entirely inadequate for large increases. On the demand side, going E20 (20 percent
ethanol blend) will likewise require a major shift to a new vehicle fleet able to accommodate higher
blends. For biodiesel, a local expert believes algal biodiesel would be necessary to augment feedstock
supply in order to comply with the B20 blend by 2030.
Despite declining fuel prices in recent years, Philippine consumers are not likely experiencing the full
benefit as a result of increasing ethanol and biodiesel prices. Already there have been critics of the
biofuels program claiming it has effectively raised pump prices. The new Philippine government (GPH)
under recently elected President Rodrigo Roa Duterte has indicated its intention to review the country’s
existing energy policy.
Manila
II. Policy and Programs
The lead agency responsible for the country’s Biofuels Program is the Philippine Department of Energy
(DOE). The country’s biofuels strategy is expressed in the National Biofuels Plan (NBP) which is
based on the Philippine Energy Plan (PEP). The PEP reflects the mission to ensure the delivery of
secure, sustainable, sufficient, affordable and environmentally-friendly energy to all economic sectors,
while the NBP is a preliminary assessment of the previous year’s NBP, and outlines the short-, medium-
and long-term plans of the National Biofuels Board (NBB). Both the PEP and the NBP are often
reviewed, and assumptions adjusted.
The Biofuels Act was signed in January 2007 making the Philippines the first country in Southeast Asia
to have legislation mandating the blending of biofuels into local gasoline and petroleum diesel. Section
2 of RA 9367 cites the law as a measure to:
develop and utilize indigenous renewable and sustainably-sourced clean energy to reduce
dependence on imported oil.
mitigate toxic and greenhouse gas (GSG) emissions;
increase rural employment and income; and
ensure the availability of alternative and renewable clean energy without any detriment to the
natural ecosystem, biodiversity and food reserves of the country.
To encourage investments, fiscal incentives are provided by RA 9367. Entities engaged in the
plantation of biofuels feedstock are entitled to duty-free importation and value added tax (VAT)
exemption on all types of agricultural inputs and machinery. Priority is also given to potential biofuels
investors by government financing agencies. Section 5.2 of the Biofuels Act allows ethanol importation
only up to four years after the 2009 blend implementation or 2013. RA 9367 does not provide for
biodiesel importation.
In 2008, RA 9367 was strengthened with the passing of the Renewable Energy Act or Republic Act
9513 (RA 9513). When the Renewable Energy Act was signed, the country was already world’s second
largest producer of geothermal energy (next to the U.S.) and was also the first country in Southeast Asia
to establish a commercial wind farm as well as the first grid-connected solar photovoltaic power plant.
The GPH has set a goal to triple renewable energy capacity by 2030. Despite RA 9513, the
contribution of renewable energy to the country’s overall energy mix has been declining from 43
percent in 2009, to roughly 30 percent in 2015.
On May 2016, the Philippines elected Rodrigo Roa Duterte as the country’s 16th
president. Winning the
elections on a platform calling for change, President Duterte formally assumed office on July 1, 2016.
Although the Duterte government’s energy policy is not very clear, public statements from the President
and senior officials indicate that the general priority places economic development ahead of
environmental concerns. As a result, a review and possible revisions of energy targets and strategies,
including the fuel mix policy and biofuels, are expected under the new GPH.
III. Gasoline and Diesel
Fuel Use History (Million Liters)
Calendar
Year
2005 2006 2007 2008 2009 2010 2011 2012 2013 2014 2015
Gasoline
Total
3,838 3,584 3,692 3,508 3,784 3,918 3,882 4,114 4,365 4,547 5,211
Diesel
Total
6,563 6,210 6,440 6,463 6,938 7,164 7,081 7,403 7,871 8,370 9,331
On-road 5,158 4,881 5,062 5,080 5,454 5,631 5,566 5,819 6,187 6,579 7,334
Agriculture
Constructi
on &
Mining
Shipping &
Rail
Industry
Heating
Jet Fuel
Total
1,253 1,310 1,408 1,407 1,503 1,529 1,721 1,808 1,910 1,975 2,073
Total Fuel
Markets
11,65
4
11,10
4
11,54
0
11,37
9
12,22
6
12,61
1
12,68
4
13,32
5
14,14
7
14,89
3
16,61
5
Fuel Use Projections (Million
Liters)
Calendar
Year
2016 2017 2018 2019 2020 2021 2022 2023 2024 2025 2026
Gasoline
Total
5,472 5,745 6,032 6,334 6,651 6,983 7,332 7,699 8,084 8,488 8,913
Diesel
Total
9,798 10,28
7
10,80
2
11,34
2
11,90
9
12,50
4
13,13
0
13,78
6
14,47
5
15,19
9
15,95
9
On-road 7,701 8,086 8,490 8,915 9,360 9,828 10,32
0
10,83
6
11,37
8
11,94
7
12,54
4
Agriculture
Constructi
on &
Mining
Shipping &
Rail
Industry
Heating
Jet Fuel
Total
2,177 2,285 2,400 2,520 2,646 2,778 2,917 3,063 3,216 3,377 3,546
Total Fuel
Markets
17,44
6
18,31
8
19,23
4
20,19
6
21,20
5
22,26
6
23,37
9
24,54
8
25,77
5
27,06
4
28,41
7
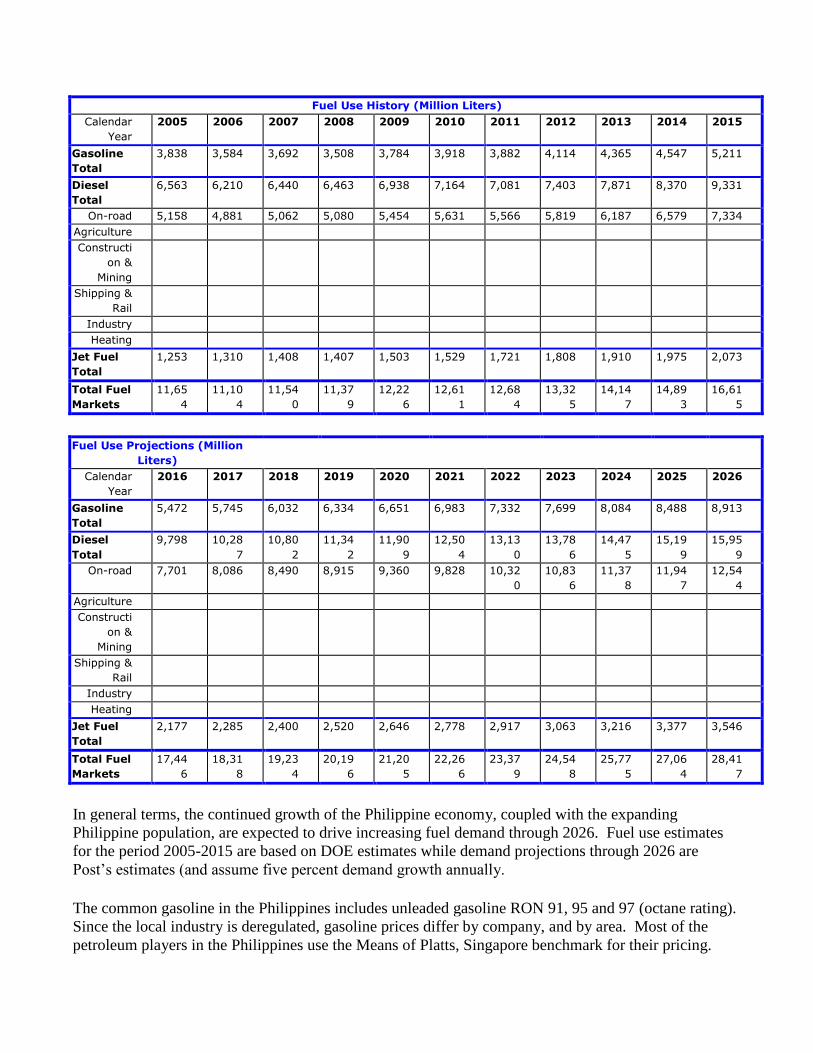
In general terms, the continued growth of the Philippine economy, coupled with the expanding
Philippine population, are expected to drive increasing fuel demand through 2026. Fuel use estimates
for the period 2005-2015 are based on DOE estimates while demand projections through 2026 are
Post’s estimates (and assume five percent demand growth annually.
The common gasoline in the Philippines includes unleaded gasoline RON 91, 95 and 97 (octane rating).
Since the local industry is deregulated, gasoline prices differ by company, and by area. Most of the
petroleum players in the Philippines use the Means of Platts, Singapore benchmark for their pricing.
Gasoline, diesel and jet fuel are subject to the following local excise tax rates in the Philippines:
Leaded premium gasoline - P 5.35 ($0.11) per liter
Unleaded premium gasoline - P 4.35 ($0.09) per liter
Aviation turbo jet fuel - P 3.67 ($0.08) per liter
Diesel and other similar fuel oils are tax-free. In addition to the excise tax, petroleum products are
subject to a 12 percent value-added tax (VAT).
Fuel prices continued to decline through 2016. Average gasoline (RON 95) prices in June 2016
declined 12 percent to P41.15 per liter ($0.87 per liter) from P46.95 per liter ($1.00 per liter) in June
2015. Diesel prices also declined six percent from P29.80 per liter ($0.63 per liter) to 27.95 ($0.59 per
liter) during the same period, according to DOE data.
Before the passage of Republic Act No. 8479 or the Downstream Oil Industry Deregulation Act of
1998, close to 100 percent of the Philippine petroleum market was dominated by a handful of big
players. As more players entered the market, the market share of large players declined to roughly 70
percent in 2014, and further slid to 60 percent in 2015. Small industry players, which are generally
supportive of biofuels, are estimated to have a market share of 35-40 percent in 2015.
On the demand side, on May 29, 2015, then President Benigno Aquino III signed Executive Order No.
182 (EO 182) which implements the Comprehensive Automotive Resurgence Strategy (CARS)
Program. The CARS program aims to make the country a regional hub for car manufacturing through
2022. The Philippine Department of Trade and Industry (DTI) is optimistic the program will assist local
auto makers export to the Association of Southeast Asian Nations (ASEAN) market. Under CARS,
incentives worth P4.5 billion ($96 million) will be provided annually for six years to support the
manufacturing of three vehicle models. A car maker can qualify for incentives for a model if it produces
at least 200,000 units over six years. There are no export requirements, as well as foreign equity
restrictions. Fiscal support will be in the form of non-transferable tax payment certificates that can be
used to pay for taxes and import duties. Some industry contacts say EO 182 sets very high standards,
claiming the 200,000 thousand production level is above the existing capacity of most local assemblers.
Local motor vehicle sales grew 23 percent from 235,000 units in 2014 to 289,000 units in 2015,
according to the Chamber of Automotive Manufacturers of the Philippines Inc. (CAMPI) and the Truck
Manufacturers Association (TMA). CAMPI and TMA account for about 85-90 percent of overall
Philippine vehicle sales.
According to a DTI official, a review of CARS is expected as a result of continued and brisk motor
vehicle sales. Industry had set a sales target of 350,000 to 360,000 units for 2016 and auto makers claim
they are on track in meeting this goal. For January to June 2016, industry reports a 27 percent sales
increase to 167,481 units sold in the first six months of 2016, from 131,465 motor vehicles sold during
the same period last year. By 2021, or one year before the end of the CARS program, vehicle sales is
forecast to reach 500,000 units.

IV. Ethanol
Ethanol Used as Fuel and Other Industrial Chemicals (Million Liters)
Calendar Year
200
8
200
9
201
0
201
1
201
2
201
3 2014
201
5 2016 2017
Beginning Stocks 0 0 0 0 0 0 0 0 0 0
Fuel Begin
Stocks 0 0 0 0 0 0 0 0 0 0
Production
Fuel Production 1 23 10 4 35 72 115 168 266 296
Imports
Fuel Imports 13 64 140 215 248 297 339 311 281 278
Exports
Fuel Exports 0 0 0 0 0 0 0 0 0 0
Consumption
Fuel
Consumption 14 87 150 219 283 369 454 479 547 574
Ending Stocks
Fuel Ending
Stocks 0 0 0 0 0 0 0 0 0 0
Total
BalanceCheck 0 0 0 0 0 0 0 0 0 0
Fuel
BalanceCheck 0 0 0 0 0 0 0 0 0 0
Production Capacity
Number of
Refineries 1 2 3 3 4 4 8 8 10 11
*Nameplate
Capacity 9 49 79 79 133 133 222 222 282 322
Capacity Use (%) 11% 47% 13% 5% 26% 54% 52% 76% 94% 92%
Co-product Production (1,000 MT)
Bagasse 5 92 46 0 19 79 101 83 78 92
Feedstock Use for Fuel (1,000 MT)
Sugar Cane 15 308 154 0 62 262 338 277 262 308
Molasses 0 12 0 16 127 224 380 612 1,016 467
Sugar 0 0 0 0 0 0 0 0 0 1
Market Penetration (Million Liters)
Fuel Ethanol 14 87 150 219 283 369 454 479 547 574
Gasoline
3,50
8
3,78
4
3,91
8
3,88
2
4,11
4
4,36
5 4,547
5,21
1 5,472 5,745
Blend Rate (%)
0.4
%
2.3
%
3.8
%
5.6
%
6.9
%
8.5
%
10.0
%
9.2
%
10.0
%
10.0
%
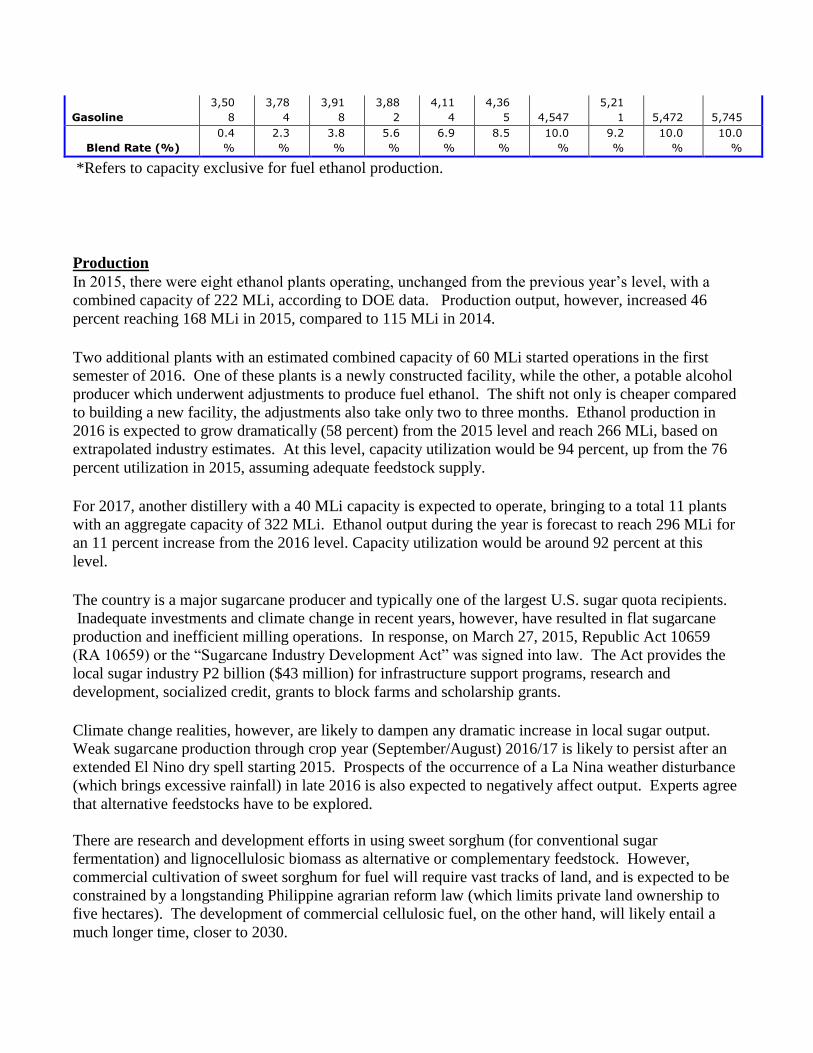
*Refers to capacity exclusive for fuel ethanol production.
Production
In 2015, there were eight ethanol plants operating, unchanged from the previous year’s level, with a
combined capacity of 222 MLi, according to DOE data. Production output, however, increased 46
percent reaching 168 MLi in 2015, compared to 115 MLi in 2014.
Two additional plants with an estimated combined capacity of 60 MLi started operations in the first
semester of 2016. One of these plants is a newly constructed facility, while the other, a potable alcohol
producer which underwent adjustments to produce fuel ethanol. The shift not only is cheaper compared
to building a new facility, the adjustments also take only two to three months. Ethanol production in
2016 is expected to grow dramatically (58 percent) from the 2015 level and reach 266 MLi, based on
extrapolated industry estimates. At this level, capacity utilization would be 94 percent, up from the 76
percent utilization in 2015, assuming adequate feedstock supply.
For 2017, another distillery with a 40 MLi capacity is expected to operate, bringing to a total 11 plants
with an aggregate capacity of 322 MLi. Ethanol output during the year is forecast to reach 296 MLi for
an 11 percent increase from the 2016 level. Capacity utilization would be around 92 percent at this
level.
The country is a major sugarcane producer and typically one of the largest U.S. sugar quota recipients.
Inadequate investments and climate change in recent years, however, have resulted in flat sugarcane
production and inefficient milling operations. In response, on March 27, 2015, Republic Act 10659
(RA 10659) or the “Sugarcane Industry Development Act” was signed into law. The Act provides the
local sugar industry P2 billion ($43 million) for infrastructure support programs, research and
development, socialized credit, grants to block farms and scholarship grants.
Climate change realities, however, are likely to dampen any dramatic increase in local sugar output.
Weak sugarcane production through crop year (September/August) 2016/17 is likely to persist after an
extended El Nino dry spell starting 2015. Prospects of the occurrence of a La Nina weather disturbance
(which brings excessive rainfall) in late 2016 is also expected to negatively affect output. Experts agree
that alternative feedstocks have to be explored.
There are research and development efforts in using sweet sorghum (for conventional sugar
fermentation) and lignocellulosic biomass as alternative or complementary feedstock. However,
commercial cultivation of sweet sorghum for fuel will require vast tracks of land, and is expected to be
constrained by a longstanding Philippine agrarian reform law (which limits private land ownership to
five hectares). The development of commercial cellulosic fuel, on the other hand, will likely entail a
much longer time, closer to 2030.
According to an industry expert, there is no known local company producing or using ethyl tert-butyl
ether or ETBE as an octane enhancer. The common enhancer used is methyl tert-butyl ether and
reformates, according to the same source.
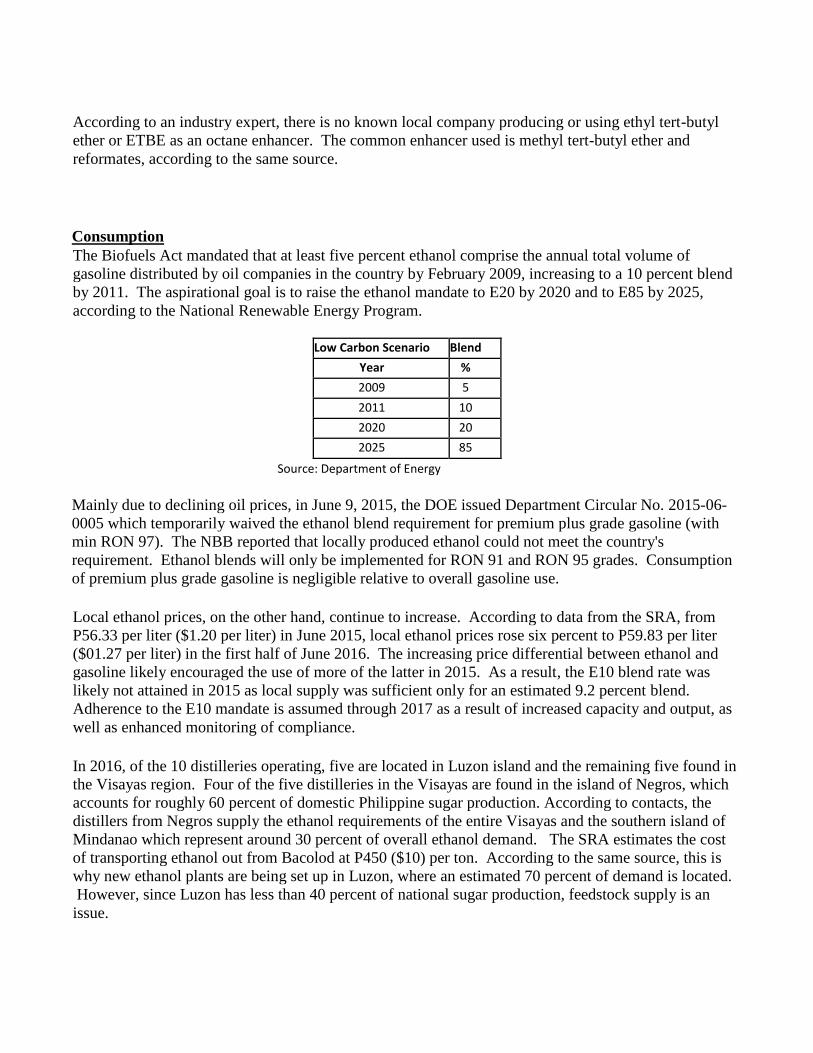
Consumption
The Biofuels Act mandated that at least five percent ethanol comprise the annual total volume of
gasoline distributed by oil companies in the country by February 2009, increasing to a 10 percent blend
by 2011. The aspirational goal is to raise the ethanol mandate to E20 by 2020 and to E85 by 2025,
according to the National Renewable Energy Program.
Low Carbon Scenario Blend
Year %
2009 5
2011 10
2020 20
2025 85
Source: Department of Energy
Mainly due to declining oil prices, in June 9, 2015, the DOE issued Department Circular No. 2015-06-
0005 which temporarily waived the ethanol blend requirement for premium plus grade gasoline (with
min RON 97). The NBB reported that locally produced ethanol could not meet the country's
requirement. Ethanol blends will only be implemented for RON 91 and RON 95 grades. Consumption
of premium plus grade gasoline is negligible relative to overall gasoline use.
Local ethanol prices, on the other hand, continue to increase. According to data from the SRA, from
P56.33 per liter ($1.20 per liter) in June 2015, local ethanol prices rose six percent to P59.83 per liter
($01.27 per liter) in the first half of June 2016. The increasing price differential between ethanol and
gasoline likely encouraged the use of more of the latter in 2015. As a result, the E10 blend rate was
likely not attained in 2015 as local supply was sufficient only for an estimated 9.2 percent blend.
Adherence to the E10 mandate is assumed through 2017 as a result of increased capacity and output, as
well as enhanced monitoring of compliance.
In 2016, of the 10 distilleries operating, five are located in Luzon island and the remaining five found in
the Visayas region. Four of the five distilleries in the Visayas are found in the island of Negros, which
accounts for roughly 60 percent of domestic Philippine sugar production. According to contacts, the
distillers from Negros supply the ethanol requirements of the entire Visayas and the southern island of
Mindanao which represent around 30 percent of overall ethanol demand. The SRA estimates the cost
of transporting ethanol out from Bacolod at P450 ($10) per ton. According to the same source, this is
why new ethanol plants are being set up in Luzon, where an estimated 70 percent of demand is located.
However, since Luzon has less than 40 percent of national sugar production, feedstock supply is an
issue.
Trade
In general terms, ethanol tariffs under various free trade agreements of the Association of Southeast
Asia Nations, including the Philippines, fell to zero in 2016, down from five percent in 2015. Most
Favored Nation tariffs for WTO-member countries, including the United States, are also at zero percent
in 2016, down from 10 percent the previous year. An additional one percent duty is imposed if the
ethanol is to be used for fuel-blending purposes under the Philippine Fuel Ethanol Program.
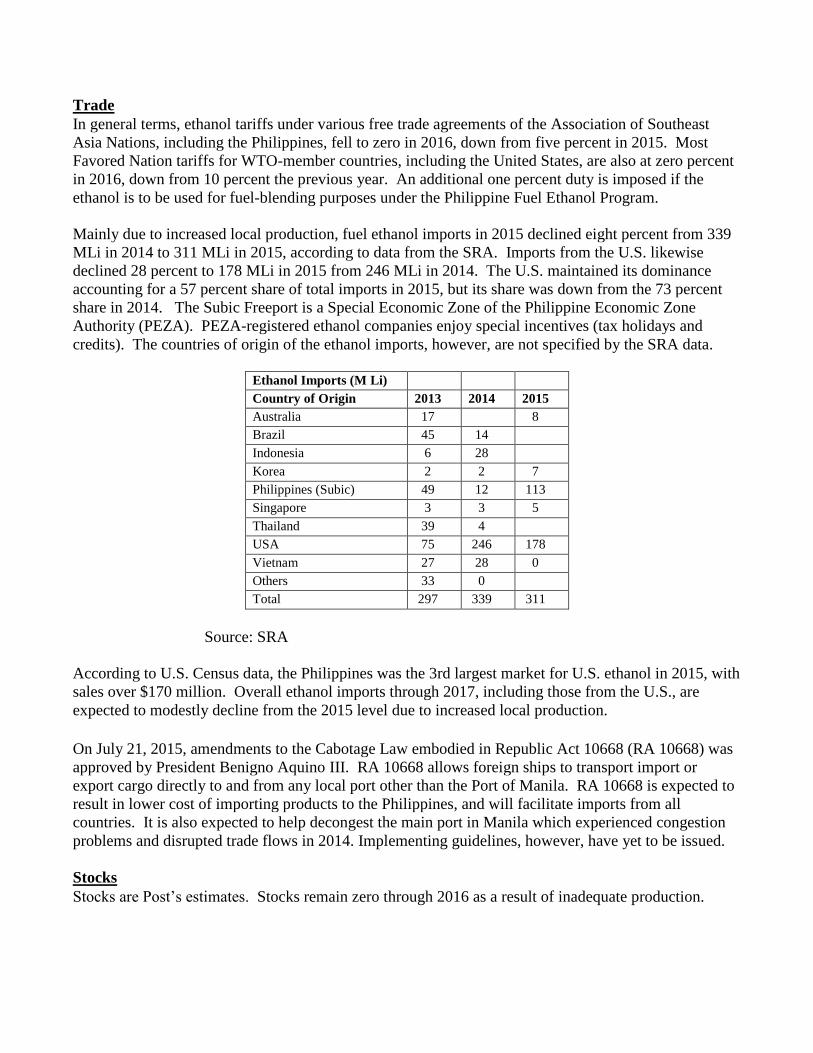
Mainly due to increased local production, fuel ethanol imports in 2015 declined eight percent from 339
MLi in 2014 to 311 MLi in 2015, according to data from the SRA. Imports from the U.S. likewise
declined 28 percent to 178 MLi in 2015 from 246 MLi in 2014. The U.S. maintained its dominance
accounting for a 57 percent share of total imports in 2015, but its share was down from the 73 percent
share in 2014. The Subic Freeport is a Special Economic Zone of the Philippine Economic Zone
Authority (PEZA). PEZA-registered ethanol companies enjoy special incentives (tax holidays and
credits). The countries of origin of the ethanol imports, however, are not specified by the SRA data.
Ethanol Imports (M Li)
Country of Origin 2013 2014 2015
Australia 17
8
Brazil 45 14
Indonesia 6 28
Korea 2 2 7
Philippines (Subic) 49 12 113
Singapore 3 3 5
Thailand 39 4 USA 75 246 178
Vietnam 27 28 0
Others 33 0 Total 297 339 311
Source: SRA
According to U.S. Census data, the Philippines was the 3rd largest market for U.S. ethanol in 2015, with
sales over $170 million. Overall ethanol imports through 2017, including those from the U.S., are
expected to modestly decline from the 2015 level due to increased local production.
On July 21, 2015, amendments to the Cabotage Law embodied in Republic Act 10668 (RA 10668) was
approved by President Benigno Aquino III. RA 10668 allows foreign ships to transport import or
export cargo directly to and from any local port other than the Port of Manila. RA 10668 is expected to
result in lower cost of importing products to the Philippines, and will facilitate imports from all
countries. It is also expected to help decongest the main port in Manila which experienced congestion
problems and disrupted trade flows in 2014. Implementing guidelines, however, have yet to be issued.
Stocks
Stocks are Post’s estimates. Stocks remain zero through 2016 as a result of inadequate production.
V. Biodiesel/Renewable Diesel
Production
Biodiesel (Million Liters)
Calendar Year
200
8
200
9
201
0
201
1
201
2
201
3
201
4
201
5
201
6 2017
Beginning
Stocks 1 2 7 6 16 17 19 28 62 40
Production 66 137 124 133 138 155 172 204 360 365
Imports 0 0 0 0 0 0 0 0 0 0
Exports 0 0 0 0 0 0 0 0 0 0
Consumption 64 131 125 123 137 153 163 170 382 405
Ending Stocks 2 7 6 16 17 19 28 62 40 0
BalanceCheck 1 1 0 0 0 0 0 0 0 0
Production Capacity
Number of
Biorefineries 8 10 8 9 9 9 11 11 11 12
Nameplate
Capacity 350 350 436 350 393 393 585 585 585 660
Capacity Use (%)
18.9
%
39.1
%
28.4
%
38.0
%
35.1
%
39.4
%
29.4
%
34.9
%
61.5
%
55.3
%
Feedstock Use for Fuel (1,000 MT)
Coconut Oil 60 125 113 122 126 142 157 186 329 334
Market Penetration (Million Liters)
Biodiesel, on-road
use 64 131 125 123 137 153 163 170 382 405
Diesel, on-road
use
5,08
0
5,45
4
5,63
1
5,56
6
5,81
9
6,18
7
6,57
9
7,33
4
7,70
1 8,086
Blend Rate (%) 1.3% 2.4% 2.2% 2.2% 2.4% 2.5% 2.5% 2.3% 5.0% 5.0%
Diesel, total use
6,46
3
6,93
8
7,16
4
7,08
1
7,40
3
7,87
1
8,37
0
9,33
1
9,79
8
10,28
7
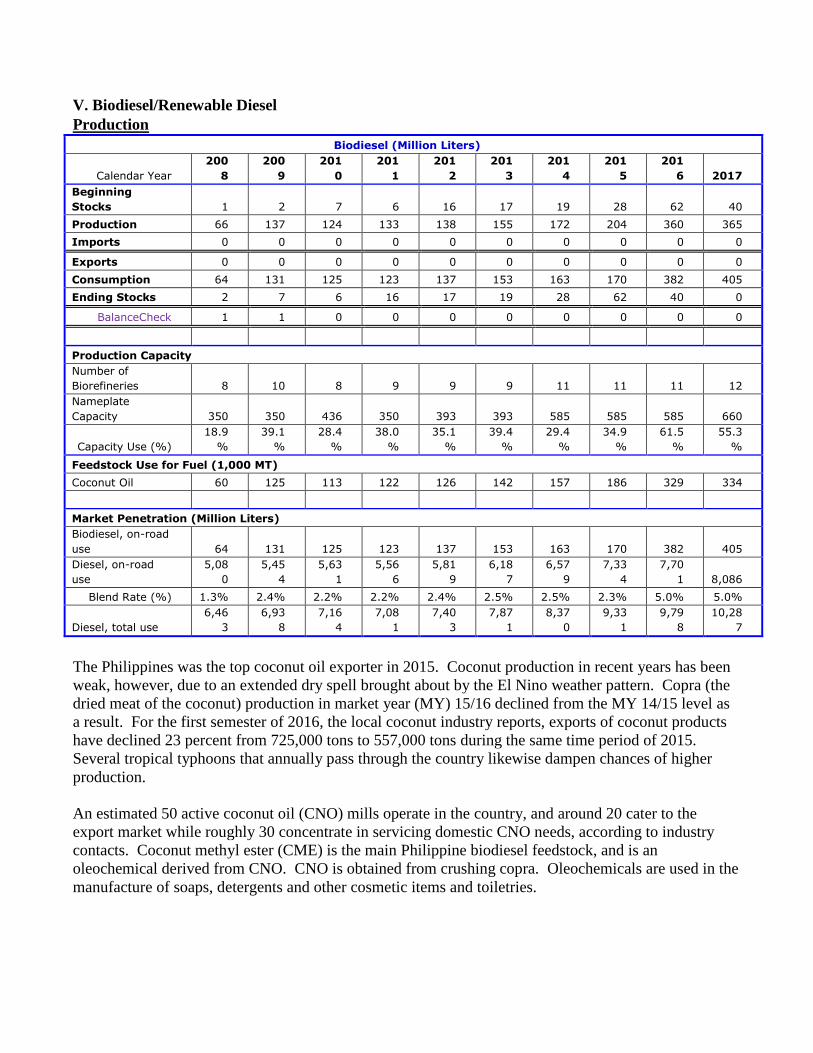
The Philippines was the top coconut oil exporter in 2015. Coconut production in recent years has been
weak, however, due to an extended dry spell brought about by the El Nino weather pattern. Copra (the
dried meat of the coconut) production in market year (MY) 15/16 declined from the MY 14/15 level as
a result. For the first semester of 2016, the local coconut industry reports, exports of coconut products
have declined 23 percent from 725,000 tons to 557,000 tons during the same time period of 2015.
Several tropical typhoons that annually pass through the country likewise dampen chances of higher
production.
An estimated 50 active coconut oil (CNO) mills operate in the country, and around 20 cater to the
export market while roughly 30 concentrate in servicing domestic CNO needs, according to industry
contacts. Coconut methyl ester (CME) is the main Philippine biodiesel feedstock, and is an
oleochemical derived from CNO. CNO is obtained from crushing copra. Oleochemicals are used in the
manufacture of soaps, detergents and other cosmetic items and toiletries.

According to the DOE, there were 11 registered biodiesel refineries in 2015, unchanged from the
previous year, with an aggregate annual capacity of 585 MLi. Seven CME producers operate in the
island of Luzon, three in Mindanao, and one plant in the Visayas islands.
There is a registered biodiesel applicant with the DOE that has obtained a notice to proceed with
constructing a 75 MLi biodiesel facility on the island of Mindanao. The Biodiesel Table assumes
operations of this refinery in 2017, which brings to a total 12 plants with an aggregate capacity of 660
MLi. As a result, biodiesel production will considerably increase to 360 MLi in 2016, up from 204 MLi
in 2015, increasing anew to 365 MLi in 2017, as a result of the higher B5 mandate (refer to
Consumption, Biodiesel).
Consumption
RA 9367 also mandated the use of a minimum one percent biodiesel blend in all diesel fuels by
February 2007, to increase to a 2 percent blend by 2009. Higher blends are programmed as follows and
are specified in the NBP 2013-2030:
Biodiesel Demand
Low Carbon Scenario Blend
Year %
2007 1
2009 2
2015 5
2020 10
2030 20
Source: Department of Energy
Biodiesel blending is currently at two percent. The B5 blend was set to be implemented in 2015 (as
indicated in the above table) but high local biodiesel prices (about thrice the price of diesel) have raised
concerns, particularly its impact on public transport prices. According to the DOE, local diesel prices in
June 2016 declined six percent from P29.80 per liter ($0.63 per liter) to 27.95 ($0.59 per liter) in June
2015, according to DOE data. Results of the economic study on the impact of the higher biodiesel
mandate (mentioned in the previous annual report) are unknown, but are likely to be considered in the
DOE’s review of targets and policies.
The Biodiesel Table assumes implementation of the B5 blend in 2016. As a result, capacity utilization
is expected to increase considerably starting in 2016. From 35 percent in 2015, capacity utilization is
expected to increase to 62 percent in 2016. Utilization, however, will likely to decline to 55 percent in
2017 with the operations of a new refinery (with a 75 MLi capacity).
By 2020, the required biodiesel blend will be raised to 10 percent, per RA 9367. At this level, roughly
900 million liters of CME would be required. At a 10 percent blend, however, local CNO supply would
be inadequate, and diverting it to CME production would displace CNO for other uses. At present,
there are plans to add palm oil to the blend mix.
Trade
There is no provision for biodiesel importation in the Biofuels Act.
Stocks
Biodiesel stocks are likely to peak in 2015, in anticipation of the B5 blend implementation in 2016,
before declining in 2016 as the higher rate is implemented. Zero ending inventories are predicted in
2017 due to increased demand.
VI. Advance Biofuels
RA 9367 mandates a B20 blend by 2030. According to a local expert, algal biodiesel would be
necessary to augment feedstock supply in order to comply with the higher mandate. There is little
information on current research and development for cellulosic fuel available, as well as on
demonstration plants that prove the commercial viability of advanced biofuels technology.
VII. Notes on Statistical Data
The numbers on the Fuel Use Projections Table are guided by the following assumptions:
Fuel use figures through 2015 are based on DOE estimates.
Gasoline, diesel and jet fuel use estimates for 2016 through 2025 use a five percent growth rate.
Ethanol consumption numbers are Post’s estimates based sales figures from the DOE and/or the
SRA.
Post assumes zero carryover stocks due to tightness in local ethanol supply.
Biodiesel consumption estimates are based on CME sales numbers from the DOE and/or the
SRA.
A metric ton of sugarcane: 65 liter fuel ethanol conversion rate is used with a sugarcane co-product
(bagasse) recovery of 300 kilos (kg) per ton cane. On the other hand, potable alcohol plants use
molasses for fuel ethanol production a rate of a ton of molasses: 245 liters of ethanol.
For biodiesel, converting CNO to CME uses a conversion rate of 0.914 percent.
0.914 liter CNO = 1 liter CME
Top Related