


Languages
Pages
Legal


1
SMAP Workshop
Janaize Markland Director, Enterprise Risk Management and Insurance PG&E August 3, 2015
Jamie Martin Director, Economic & Project Analysis PG&E
2
Risk Management Culture
Risk Management Framework
Integrated Planning Process
PG&E Risk Framework + Integrated Planning
Risk Assessment Risk Response Risk Monitoring
Executive
Guidance
Session 1
Session D Session 2
Consistency Governance and Oversight Communication Embedded in Decision
Making Continuous Improvement
Output
Executive Guidance PG&E’s 5-Year Goals
Session D - Risk Register - Discussions on risk management plans and progress - Tools: RET, LOB-Specific models
Session 1 - LOB’s 5-year Operating Plan: goals and strategies including risk management objectives - LOB preliminary prioritization of proposed work - Tools: RIBA, LOB-Specific models
Session 2 - LOB’s 2-year Execution Plan: work plan, resource plan and detailed budget - LOB prioritization of proposed work - Metrics and targets - Sets the foundation for rate case forecasts - Tools: RIBA, LOB-Specific models
3
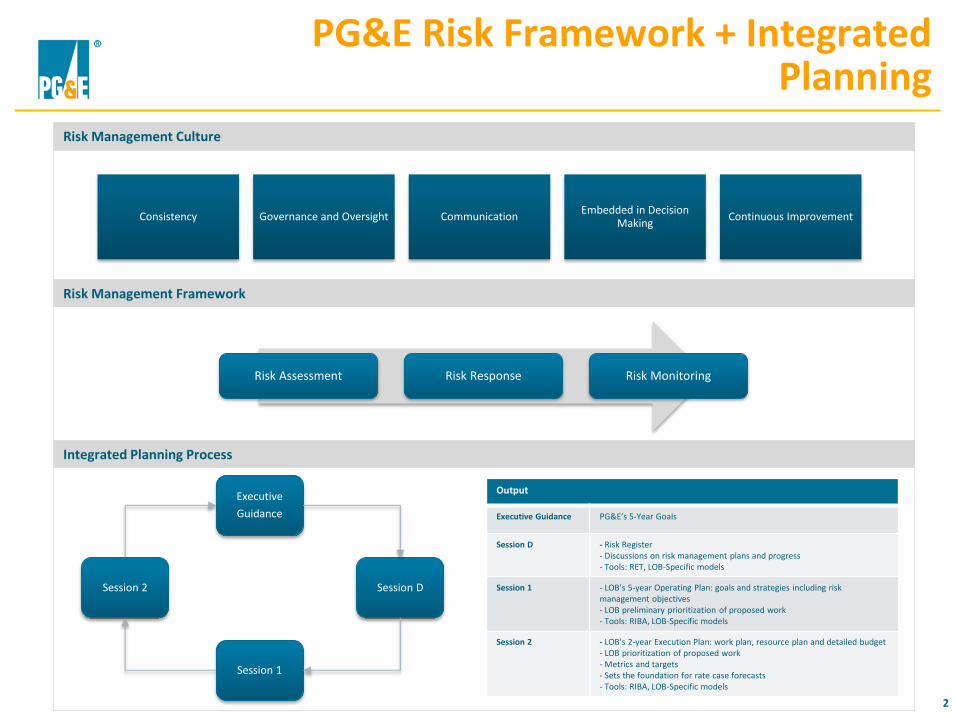
Risk Assessment: Risk Evaluation Tool & Risk Taxonomy
Risk Evaluation Tool (RET):
- The Company’s 7x7 RET model features:
- 6 impact categories: Safety, Environmental, Compliance, Reliability, Trust, Financial
- 7 impact levels: Catastrophic, Severe, Extensive, Major, Moderate, Minor, Negligible
- 7 frequency levels: Common, Regular, Frequent, Occasional, Infrequent, Rare, Remote
- Log-based scale where each bucket is roughly 10x worse than the bucket directly below (frequency and impact).
- Four logs over seven frequency groups were used to increase separation between risks.
- Weightings: Weightings for each of the 6 impact categories are based on the company’s goals around Safety, Reliability and Affordability.
Consistency Governance
and Oversight Communication
Embedded in Decision Making
Continuous Improvement
> 10 times per year 1 - 10 times per year Once every 1 - 3
years
Once every 3 - 10
years
Once every 10 - 30
years
Once every 30 - 100
years
Once every 100 +
years
F = > 10 F = 1 - 10 F = 1 - 0.30 F = 0.20 - 0.10 F = 0.10 - 0.03 F = 0.03 - 0.01 F = <0.01
Common Regular Frequent Occasional Infrequent Rare Remote
(7) (6) (5) (4) (3) (2) (1)
Safety
Environmental
Compliance
Reliability
Reputational
Financial
Catastrophic Severe Extensive Major Moderate Minor Negligible
(7) (6) (5) (4) (3) (2) (1)
Freq
uenc
yO
bjec
tives
Impa
ct
• PG&E benchmarked industry, consulted with experts, and worked with academia (UC Berkeley, Stanford) to solicit input and validate approach.
• Each LOB with functional responsibility for a criteria column (i.e., safety, compliance, environmental, reliability, financial, reputational) provided specific language to articulate each impact level in a consistent way
• Market and Credit Risk Management performed a validation of the model’s mathematics and structure.
• Frequency scale
• Objectives of the company
• Impact scale

4
Risk Evaluation Tool
The tool is comprised of the following features:
- Input fields that match the risk database (for easy upload/translation of data)
- Three scoring sections for:
- Inherent residual score
- Current residual score
- Forecasted residual score
- Drop down selection boxes for each impact category to input impact level
- Frequency override option if data is available
- Justification boxes for each impact criteria + frequency
Consistency Governance
and Oversight Communication
Embedded in Decision Making
Continuous Improvement
5
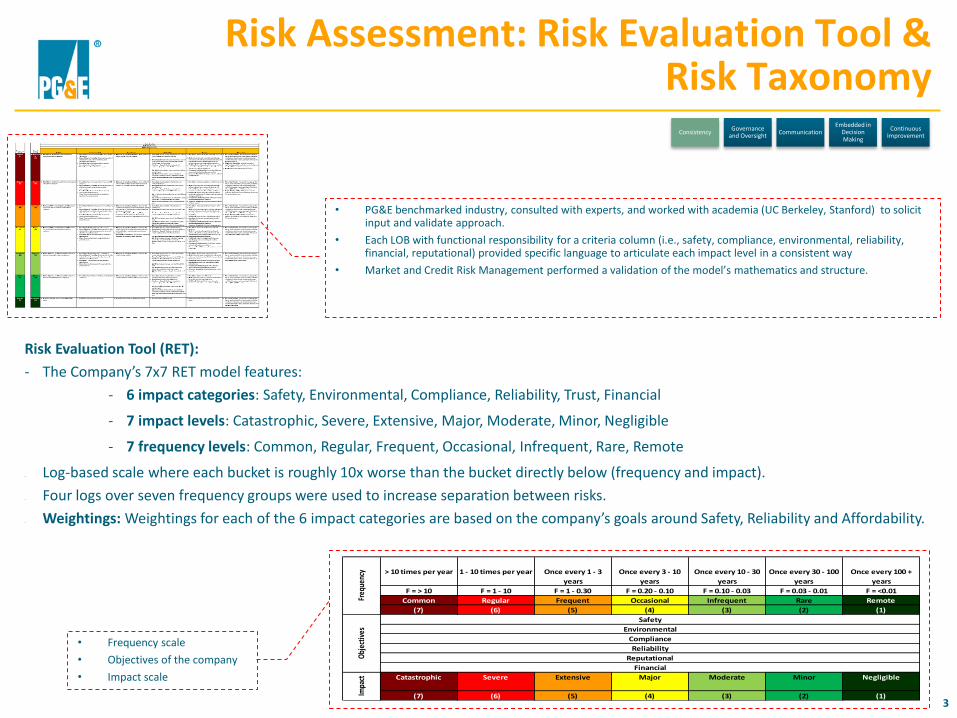
Risk Evaluation Tool
- As risks are evaluated, the drop down fields are used to record and track the impact levels
- Within each Impact category (Safety, Environmental, etc.) the user has the option to select from one of the 7 impact levels
- A justification field for each impact category is shown next to the drop down box. This field allows the users to input free form text and explain the reasoning behind the selected impact level
- After all 6 impact categories + a frequency have been decided and selected in the RET, a risk score will populate (see image below)
- The RET allows for users to input a “Frequency per Year Override” if the data exists to do so
Consistency Governance
and Oversight Communication
Embedded in Decision Making
Continuous Improvement
6
Heat Map
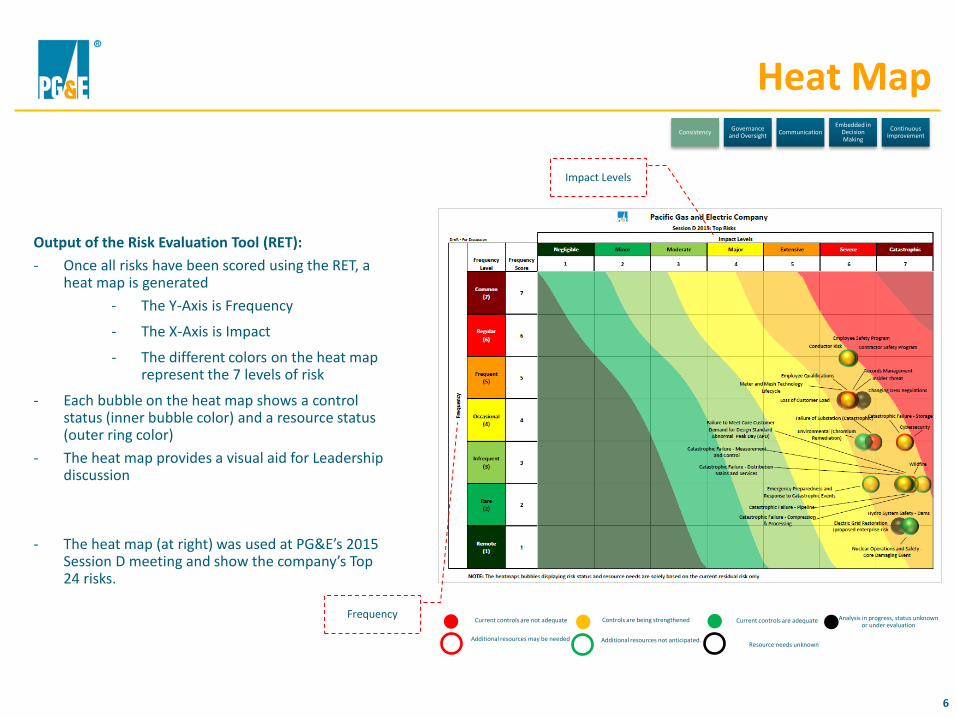
Output of the Risk Evaluation Tool (RET):
- Once all risks have been scored using the RET, a heat map is generated
- The Y-Axis is Frequency
- The X-Axis is Impact
- The different colors on the heat map represent the 7 levels of risk
- Each bubble on the heat map shows a control status (inner bubble color) and a resource status (outer ring color)
- The heat map provides a visual aid for Leadership discussion
- The heat map (at right) was used at PG&E’s 2015 Session D meeting and show the company’s Top 24 risks.
Current controls are not adequate Current controls are adequate Analysis in progress, status unknown or under evaluation
Controls are being strengthened
Resource needs unknown Additional resources may be needed Additional resources not anticipated.
Impact Levels
Frequency
Consistency Governance
and Oversight Communication
Embedded in Decision Making
Continuous Improvement

7
Risk Assessment: Calibration
While preparing for Session D, many risk calibration scoring sessions are held to ensure the risk evaluation tool was applied consistently:
- Horizontal Calibration:
- Analyzes all overall risk scores across all six impact categories
- Compares and contrasts justifications, impact scores, and frequency scores
- Provides LOBs with context, insight into other company risks, and assurance the criteria has been applied consistently
- Vertical Calibration:
- With subject matter expertise for each impact category, a verification process is held to ensure scores in each impact were consistently applied
Consistency Governance
and Oversight Communication
Embedded in Decision Making
Continuous Improvement

8
Risk Database: ECTS-Risk
The Enterprise Compliance Tracking System (ECTS) is currently PG&E’s official system of record for all risk related data
•- ECTS-Risk provides:
– A single repository for enterprise and operational risk data, across all LOBs (previously a manual and decentralized approach, including spreadsheets and word documents)
– Audit trail of risk data and decisions
– Management reports to facilitate oversight, monitoring and decision making
– A way to track and monitor progress on mitigations and response plans across the company
– A tasking function for Risk Managers within the LOBs to track progress to plan
– A scoring section that mirrors the risk evaluation tool
Scoring tool built
In ECTS-Risk is modeled
after the risk evaluation
Tool
ECTS-Risk homepage
provides insight into
LOB or Company risk register
Consistency Governance
and Oversight Communication
Embedded in Decision Making
Continuous Improvement

9
Monthly Report Out: Dashboard
•Dashboard reporting:
- The dashboard to the right is one example of how PG&E utilizes ECTS to provide all LOBs visibility into their current data
- Provided monthly to Risk Managers in all LOBs and is available for officer-level Risk and Compliance Committee Meetings
Consistency Governance
and Oversight Communication
Embedded in Decision Making
Continuous Improvement

10
Business Plan Review (BPR)
The Business Plan Review (BPR) is a monthly report out by each LOB on their metric score card
- The BPR is directly aligned with Session D LOB commitments
- LOBs are able to provide insight and updates as performance to plan
- Top mitigations and risk metrics are tracked
- With Enterprise Risk oversight, each LOB self reports their status for the month
Metrics in place
For top risks
Key mitigations
For top risks
Top Risks
Consistency Governance
and Oversight Communication
Embedded in Decision Making
Continuous Improvement

11
Integrated Planning & RIBA
Session D This session focuses on PG&E’s top risks and compliance issues
Session 1 Session 1 discusses strategies for
managing LOB priorities, including plans for top risks
RIBA RIBA ensures that risk informs
prioritization discussions
Session 2 This Session prioritizes resources needed in order to execute strategy
Session D
RIBA
Session 1 Session 2
Consistency Governance
and Oversight Communication
Embedded in Decision Making
Continuous Improvement

12
Risk Informed Budget Allocation (RIBA)
Score Calibrate Prioritization Risk-Informed
Discussion
• Each project is risk-scored with a Subject Matter Expert
• Projects are scored along three dimensions
o Safety
o Reliability
o Environmental
• Projects are flagged based on the driver(s) of the work
Negligible Minor Moderate Major Extensive Severe Catastrophic
Frequency
Level
7 10 32 100 316 1,000 3,162 10,000
6 6 18 56 178 562 1,778 5,623
5 2 7 23 74 234 740 2,340
4.5 2 7 21 67 211 669 2,115
4 2 6 18 56 178 562 1,778
3 1 4 14 43 135 426 1,348
2 1 3 10 32 100 316 1,000
1 1 2 6 18 56 178 562
Impact Levels
Fre
qu
en
cy
1 2 3 4 5 6 7
• Scorers present their methodology to the broader group to ensure standard application of scoring and flagging taxonomy
• Projects are calibrated across the LOB portfolios
• Prioritization discussions are based on risk scores and flags as well as other considerations (e.g. system and execution constraints)
• Leadership across the LOB participates
• RIBA expanded scoring team participates
• Executive leadership
• Confidence using the RIBA process to make budget decisions in current and future years
Distribution Expense Opportunity
Emergent
Work /
Forecast
Increase
Watch
1 Emergency YTD under run $12.1, forecast 6.0$
2 Cancelled orders, safety net payments under run 1.2$
3 UG project tags SF placeholder 1.0$
4 Insulators wash (assess in Sep) TBD
5 Idle Facilities investigation (extend program) TBD
6 Pole, Test & Treat credits (AT&T) 1.0$
7 9.2$
8 Maintenance unit cost increase (2.5)$
9 Network maintenance unit cost increase (0.9)$
10 Standard Cost Variance - YTD unfavorable (3.4)$
11 Maintenance volume increase / FAS tags (5.6)$
12 Solar applications volume increase (1.6)$
13 (14.0)$
14 Major Emergency risk TBD
15 Ops & Automation (operator HC / cap-exp split) at run-rate (3.7)$
16 SCV risk (YTD results extrapolated for remainder of year) (4.0)$
17 PCC Reduction 1.5% of DET (1/3 expense) 7.5$
18 (0.2)$
19 Net 9.2$ (4.8)$ (5.0)$
Consistency Governance
and Oversight Communication
Embedded in Decision Making
Continuous Improvement

13
Risk Informed Budget Allocation (RIBA)
Step 1 – General and Scoring Information
GENERAL INFORMATION
LOB Project Identifier 1
LOB Project Identifier 2 Project Name
Project Description MWC MWC Group MAT
MAT Description
Project Manager Asset Engineer
Asset Supervisor
19.4 31047788 Madera 1104 – Reconductor [Location]
NA 08 E Dist Relia 08J Annealed Con [Name] [Name]
[Name]
SCORING INFORMATION
Project Scorer Interviewee (e.g. name of asset engineer) Scoring Date
Bundle # or Tier # if part of a program Project Notes
[Name]
[Name] 5/20/14 NO Reconductor 1440’ of #6 Cu. Due to number of splices
Consistency Governance
and Oversight Communication
Embedded in Decision Making
Continuous Improvement

14
Risk Informed Budget Allocation (RIBA)
Step 3 – Risk Scores
SAFETY RISK SCORE
Impact Score Impact Notes
Time-to-impact / Frequency Score
Frequency Override (1/T) Frequency Notes
Total Safety Risk Score
6
Possibility for Live wire down causing fatality. Right across the street from [School]
1 Per Calculation: 11 fatalities / 14 year = 0.79. 0.79 /2700 WD outages = 0.0003 for a frequency of 1.
178
ENVIRONMENTAL RISK SCORE
Impact Score Impact Notes
Time-to-impact / Frequency Score
Frequency Override (1/T) Frequency Notes
Total Environmental Risk Score
1
Urban neighborhood. Right across the street from [School]
1 1
RELIABILITY RISK SCORE
Impact Score Impact Notes
Time-to-impact / Frequency Score
Frequency Override (1/T) Frequency Notes
Total Reliability Risk Score
4 Broken Wires. CESO = 3161. Duration 6+ hours. Impacts [School].
6 4 WD outages in 3 years 178
Total Risk
Score
356
Consistency Governance
and Oversight Communication
Embedded in Decision Making
Continuous Improvement

15
Risk Informed Budget Allocation (RIBA)
Step 4 – Flags
COMMITMENTS AND OTHER CONSIDERATIONS
Commitment
If a “4 – Public/Regulatory commitment,” then state who the commitment is to
Due date for compliance (MM/DD/YYYY)
Inflight YES OR NO
Inter-relationships with other projects YES OR NO
Capacity YES OR NO
Financial Benefits (Select: hard, soft, none)
Benefit Amount ($000)
Support YES OR NO
Notes for other commitments and requirements
NO NO NO
Consistency Governance
and Oversight Communication
Embedded in Decision Making
Continuous Improvement

16
Continuous Improvement - Continue to enhance Session D to focus on progress from the past
year as well as goals for the upcoming year
- Continue to refine the EORM process in accordance with PG&E’s EORM Vision 2020, beginning with:
- Increase use of data in risk assessments , including using PRA and other methods for risk quantification
- Increase use of alternatives analysis
- Increase use of risk metrics to determine effectiveness of risk mitigations
- Strengthening connections within Integrated Planning
- Continue to strengthen RIBA process and alignment with EORM
- Ensure that improvements made in the EORM program are incorporated into the RIBA process, as appropriate
- Continue to benchmark to inform and refine future direction:
- Asset intensive, industry leading companies in utilities and beyond
- 3rd party peer reviewers
0
500
1000
1500
Cu
rren
t R
esid
ual
Ris
k Sc
ore
2015 Company Risk Portfolio
Example of ability to calibrate the entire portfolio of risk based on RET enhancements
Example of Nuclear PRA Overview
Consistency Governance
and Oversight Communication
Embedded in Decision Making
Continuous Improvement
Negligible Minor Moderate Major Extensive Severe Catastrophic
Frequency
Level
Frequency
Score1 1 1 1 1 1 1 1 1 2 2 2 2 2 2 2 2 2 2 3 3 3 3 3 3 3 3 3 3 4 4 4 4 4 4 4 4 4 4 5 5 5 5 5 5 5 5 5 5 6 6 6 6 6 6 6 6 6 6 7 7 7 7 7 7 7 7 7 7 7
Common
(7)7
Regular
(6)6
Frequent
(5)5
Occasional
(4)4
Infrequent
(3)3
Rare
(2)2
Remote
(1)1
1 2 3 4 5 6 7
Heat map progression and maturity

17
Enterprise and Operational Risk Management • Data-driven, risk-based decision making to support safe, reliable, and affordable electric and gas service
that is integrated into our planning process and becomes the foundation for our regulatory rate cases.
• PG&E leads the utility industry in the evolution of enterprise and operational risk management (EORM) by integrating EORM into the culture, strategic decision, regulatory processes, and operational business execution that is supported through a balance of quantitative and qualitative analysis.
• EORM will continue to improve its transparency and accountability of its business through the full integration of its risk management, asset management and investment management processes with the objective of safe, reliable, and affordable electric and gas service.
Consistency Governance
and Oversight Communication
Embedded in Decision Making
Continuous Improvement
2016
2017
2018
2019
2020
Co
nsi
ste
ncy
Q
uan
tifi
cati
on
C
ult
ure
• Risks across the organization are of an equivalent level to assist in a consistent management approach across all lines of business
• Risk tolerance is further explored during risk assessments and response plan approval and alternatives analysis review
• Practical and effective methods for quantifying risks have been identified and tested through pilots in gas operations and electric operations.
• Outcomes of risks are discussed in terms of uncertainty, including worst, best and most likely values
• The company discusses projects and initiatives in terms of risk reduction value.
• Asset investment strategies are evaluated in a probabilistic environment
• PG&E is able to develop a RAMP proceeding that is consistent with commission expectations
• Process is developed to establish risk tolerance within each LOB RCC
• The ability to utilize data models and methods for risk quantification continues to build upon successes and lessons learned during 2016 pilots
• LOBs are actively identifying data gaps and have plans to acquire data for enhanced risk quantification and assessment for top risks, as a matter of process
• Risk reduction value is
explicitly considered within investment planning Decisions.
• The investment management process has evolved to include uncertainty analysis and demonstrate ALARP
• Plan is implemented to consistently drive risk tolerance discussions within LOB
• Top risks and corresponding mitigations are supported by data that can be used to demonstrate baseline performance
• The process for establishing risk tolerance within the regulatory process is in established and serves as a guide for additional risk mitigation activities
• All top risks are quantified, performance targets have been established, and progress towards them is being made
• Key risk indicators are in place and are able to provide insights on risk reduction across the company’s risk portfolio
• PG&E can demonstrably show actual risk reduction benefits
• Risk tolerance is enabling PG&E to better manage its portfolio of risks
• Risks are quantified to the level appropriate for making trusted risk-informed, financially prudent decisions
• Risk reduction can be measured and is effectively communicated to stakeholders
• Management has independent assurance of risk management practices and outputs.
• Risk reduction value is discussed during integrated planning sessions.
• Risk reduction value is clearly understood and is a determining factor in investment decisions.

18
Appendix
19
Top LOB Risks Risk Owner Current Residual
Risk Score
2014 Session D
Status
2015 Session D Status as of 4/1/15
2016 EOY Forecasted
Status
Response Plan Status Explanation as of 4/1/15
Top Associated Compliance
Requirements
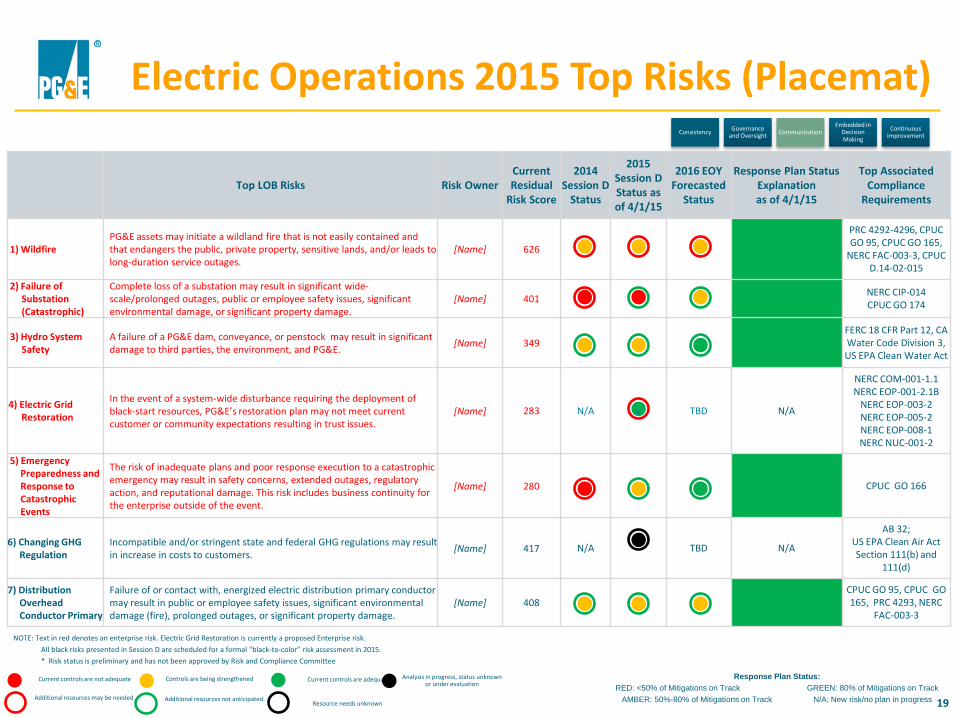
1) Wildfire PG&E assets may initiate a wildland fire that is not easily contained and that endangers the public, private property, sensitive lands, and/or leads to long-duration service outages.
[Name] 626
PRC 4292-4296, CPUC GO 95, CPUC GO 165,
NERC FAC-003-3, CPUC D.14-02-015
2) Failure of Substation (Catastrophic)
Complete loss of a substation may result in significant wide-scale/prolonged outages, public or employee safety issues, significant environmental damage, or significant property damage.
[Name] 401 NERC CIP-014 CPUC GO 174
3) Hydro System Safety
A failure of a PG&E dam, conveyance, or penstock may result in significant damage to third parties, the environment, and PG&E.
[Name] 349 FERC 18 CFR Part 12, CA Water Code Division 3, US EPA Clean Water Act
4) Electric Grid Restoration
In the event of a system-wide disturbance requiring the deployment of black-start resources, PG&E’s restoration plan may not meet current customer or community expectations resulting in trust issues.
[Name] 283 N/A
TBD N/A
NERC COM-001-1.1 NERC EOP-001-2.1B
NERC EOP-003-2 NERC EOP-005-2 NERC EOP-008-1 NERC NUC-001-2
5) Emergency Preparedness and Response to Catastrophic Events
The risk of inadequate plans and poor response execution to a catastrophic emergency may result in safety concerns, extended outages, regulatory action, and reputational damage. This risk includes business continuity for the enterprise outside of the event.
[Name] 280 CPUC GO 166
6) Changing GHG Regulation
Incompatible and/or stringent state and federal GHG regulations may result in increase in costs to customers.
[Name] 417 N/A TBD N/A
AB 32; US EPA Clean Air Act Section 111(b) and
111(d)
7) Distribution Overhead Conductor Primary
Failure of or contact with, energized electric distribution primary conductor may result in public or employee safety issues, significant environmental damage (fire), prolonged outages, or significant property damage.
[Name] 408 CPUC GO 95, CPUC GO 165, PRC 4293, NERC
FAC-003-3
Current controls are not adequate Current controls are adequate Analysis in progress, status unknown or under evaluation
Controls are being strengthened
Resource needs unknown Additional resources may be needed Additional resources not anticipated.
Response Plan Status:
RED: <50% of Mitigations on Track GREEN: 80% of Mitigations on Track
AMBER: 50%-80% of Mitigations on Track N/A: New risk/no plan in progress
NOTE: Text in red denotes an enterprise risk. Electric Grid Restoration is currently a proposed Enterprise risk.
All black risks presented in Session D are scheduled for a formal “black-to-color” risk assessment in 2015.
* Risk status is preliminary and has not been approved by Risk and Compliance Committee
*
Electric Operations 2015 Top Risks (Placemat) Consistency
Governance and Oversight
Communication Embedded in
Decision Making
Continuous Improvement

20
Session D: LOB Deep Dive
Risk Response Plan Mitigations
Mitigation Completion Date
(From Risk Assessment)
% Complete as of 4/1/15
Next Steps
Implement remote capability to disable reclose in wildfire areas 12/31/16 25% Continue build-out of SCADA infrastructure to support functionality. Identified 215 target locations requiring functionality.
Continued asset management programs focused on wildfire risk zones 12/31/18 On-going
Review exempt surge arrestors for use in distribution system and develop implementation strategy. Implement infrared strategy and develop bridging strategy for transmission lines with focus on wildfire areas.
Continued enhanced Vegetation Management in repeat outage locations
12/31/15 On-going
Public Safety & Reliability tree program directly considers repeat vegetation-related outages in planning criteria. Execute on five year plan for targeted historic locations. Also mitigates the Overhead Conductor risk.
Formalize corporate tracking of annual fire season safety awareness training completion
6/30/15 75% Complete implementation by identifying and assigning training to field personnel.
Develop algorithms to provide identification of poor performing conductor
6/30/14 100% Algorithm was implemented in STAR prototype. Also mitigates the Overhead Conductor risk.
Risk Response Plan Status Risk Response Plan Owner Eric Back Alternatives Analysis Evidenced Yes Metrics in Place Yes
Risk Name: Wildfire Risk Description: PG&E assets may initiate a wildland fire that is not easily contained and that endangers the public, private property, sensitive lands, and/or leads to long-duration service outages.
P(95) Scenario: A utility-related fire near a national park resulting in fire of greater than 10,000 acres, property damage, multiple loss of life and significant fines, claims, and law suits as well as extended regulations.
2014 SD Status
Current Risk Status as of 4/1/15
Metrics
Metric Description
Metric Legend Metric Status
T&D Overhead Wires Down
RED: Over 2615 AMBER:2615 or less GREEN: 2540 or less
911 response time
GREEN:93.5% of Target AMBER:92.6-93.4% RED: Less than 92.6%
92.6% through Feb
Vegetation Miles Worked
GREEN:97% of Target AMBER:95-96.9% RED: Less than 95%
Distribution Wildfire Detailed Inspections
TRACKING EOY target
of 178
Electric Asset Related Fires
UNDER DEVELOPMENT N/A
T&D Infrared Inspection Miles
UNDER DEVELOPMENT N/A
Comments: The last three years have made up the driest three-year period in recorded California history back to 1850 resulting in a higher risk posture for Wildfire. Electric operations is pursuing and executing on mitigations to reduce the short-term and long-term risk profile including infrastructure replacement, increased inspections, and increased non-exempt pole clearing.
Strategy to Manage Challenges: • Develop coalition of stakeholders to determine most effective wildfire reduction strategies • Utilize coalition of government agencies to effectively deploy wildfire mitigation strategies • Continue to align proactive mitigations with drought conditions and identified wildfire risk areas
Current controls are not adequate Current controls are adequate Analysis in progress, status unknown or under evaluation
Controls are being strengthened
Resource needs unknown Additional resources may be needed Additional resources not anticipated.
Response Plan Status:
RED: <50% of Mitigations on Track GREEN: 80% of Mitigations on Track
AMBER: 50%-80% of Mitigations on Track N/A: New risk/no plan in progress
Consistency Governance
and Oversight Communication
Embedded in Decision Making
Continuous Improvement
Top Related