


Languages
Pages
Legal


PETROFACIES AND PALEOTECTONIC EVOLUTION OF GONDWANAN AND
POST-GONDWANAN SEQUENCES OF NEPAL
Except where reference is made to the work of others, the work described in this thesis is my own or was done in collaboration with my advisory committee.
This thesis does notinclude proprietary or classified information.
_____________________________________ Raju Prasad Sitaula
Certificate of Approval: _____________________ _____________________ Charles E. Savrda Ashraf Uddin, Chair Professor Associate Professor Geology and Geography Geology and Geography _____________________ _____________________ Willis E. Hames George T. Flowers Professor Dean Geology and Geography Graduate School

PETROFACIES AND PALEOTECTONIC EVOLUTION OFGONDWANAN AND
POST-GONDWANAN SEQUENCES OF NEPAL
Raju Prasad Sitaula
A Thesis
Submitted to
the Graduate Faculty of
Auburn University
in Partial Fulfillment of the
Requirement for the
Degree of
Master of Science
Auburn, Alabama
Auburn, Alabama December 18, 2009

iii
PETROFACIES AND PALEOTECTONIC EVOLUTION OF GONDWANAN AND
POST-GONDWANAN SEQUENCES OF NEPAL
Raju Prasad Sitaula
Permission is granted to Auburn University to make copies of this thesis at its discretion,
upon the request of individuals or institutions and at their expense. The author reserves all publication rights.
_____________________________
Raju Prasad Sitaula
___________________________
Date of Graduation

iv
VITA
Raju Prasad Sitaula, son of Mr. Murari Prasad Sitaula and Mrs. Renuka Devi
Sharma Sitaula, was born in 1979 in Bhadrutar, Nuwakot. He passed his school Leaving
Certificate Examination in 1996 from Adarsha Yog Hari Madhyamik Vidhyalaya. He
passed the Proficiency Certificate Level Examination in 1998 from Amrit Science
College. He received his Bachelor of Science and Master of Science degrees in Geology
in 2002 and 2005, respectively, from Tri-Chandra Multiple Campus and Tribhuvan
University in Nepal. He entered the graduate school at Auburn University to pursue his
second Masters degree from the Department of Geology and Geography in Fall 2007.

v
THESIS ABSTRACT
PETROFACIES AND PALEOTECTONIC EVOLUTION OF GONDWANAN AND
POST-GONDWANAN SEQUENCES OF NEPAL
Raju Prasad Sitaula
Master of Science, December 18, 2009 (Bachelor of Science, Trichandra College, Nepal, 2004) (Master of Science, Tribhuvan University, Nepal, 2005)
206 Typed Pages
Directed by Ashraf Uddin
The Gondwanan sequences are widely distributed in several intracratonic basins
of peninsular India and also as discontinuous patches along the Himalayan orogenic belt.
The Tansen Group (2400 m) in western Nepal is thicker and more complete than the
Katari (380 m) and the Barahachettra (350 m) groups located in eastern Nepal.
In the Tansen Group, modal compositions of sandstone change from arkosic
(Permo-Carboniferous unit) to quartz arenitic and then to litharenitic (Eocene-Early
Miocene). Similar modal compositions are also present only in alleged Permo-
Carboniferous units Katari and Barahachettra groups of eastern Nepal. The
quartzofeldspathic sandstones of the Permo-Carboniferous Sisne (western Nepal) and
Saptakoshi (eastern Nepal) formations show high Eu values. The Quartzite unit of the
Saptakoshi Formation seems similar to the Amile Formation of western Nepal as both
contain higher percentages of mature quartz and stable heavy minerals, and show similar

vi
REE patterns. High contents of lithic fragments with relatively rare feldspars indicate that
the Tamrang sandstones were deposited in the juvenile foreland basin between India and
Tibet like the Eocene Bhainskati Formation of western Nepal.
Garnet chemistry suggests sediment supply from variously graded metamorphic
rocks. Tourmaline chemistry indicates sediments derivation from both lithium-high and
lithium-low igneous rocks. Chrome-spinels with low TiO2 contents in the Taltung
Formation show evidence of provenance from alkaline basalts.
Cooling ages of detrital muscovites from the Permo-Carboniferous units of all
three study sections show some older ages (300 Ma to 1700 Ma) and few younger (17 Ma
to 25 Ma) ages. The older ages could be related to the magmatism in the Indian craton
(e.g., Malani Rhyolite, Erinpura Granite, Chotanagpur Gneissic Terrain). Ages ~ 40 Ma
muscovites from the Bhainskati Formation suggest a Himalayan orogenic source.
Relatively younger ages, however, could indicate about the possible argon loss from the
muscovite or misinterpretation of the stratigraphy.
This study suggests that the stratigraphy of the Gondwana sequences in eastern
Nepal needs to be re-evaluated. The existing quartzite unit of supposedly Permo-
Carboniferous Saptakoshi Formation (eastern Nepal) should belong to Late Cretaceous,
equivalent to the Amile Formation of western Nepal. The Tamrang Formation (eastern
Nepal), which is currently considered as Permo-Carboniferous to Cretaceous, could be an
equivalent unit of the Eocene Bhainskati Formation of western Nepal.

vii
ACKNOWLEDGEMENTS
I would like to express my thanks and gratitude to my dear teacher Dr. Ashraf
Uddin for bringing me to Auburn University and giving me the chance to get a Master’s
degree in Geology. Dr. Uddin helped me not only as the principal advisor but also as a
real guardian to get the best outcome of this research.
I would like to express my sincere thanks to Dr. Charles Savrda, who helped with
significant editing in this thesis. It would have been difficult to get this research work
done without Dr. Savrda. I also would like to thank Dr. Willis Hames for help with the
geochronology part of this research.
I also acknowledge Mr. Chris Fleisher of University of Georgia for help during
microprobe analysis. I thank Dr. Bishal Nath Upreti and Dr. Megh Raj Dhital for
continuously guiding me through my research, supporting my fieldwork, and reviewing
my thesis work. I want to thank my colleagues Pawan Budhathoki, Ashok Sigdel, and
Biraj Gautam for their immense help in my fieldwork. I also want to pay my sincere
thanks to Mr. Suryalal Shrestha who provided lodging support at Masyam, Palpa, during
my fieldwork at the Tansen section. I am truly grateful to my colleagues at Auburn
University, Subhadip Mandal and Shahadat Hossain, for their significant support
throughout the development of thesis work, for literature review, lab work, data analysis

viii
and computer work. I am thankful for Subhadip not only for his support but also for the
support I got from him while sharing an apartment.
I am very grateful to Eva Lilly and Sheila Arington for their kind support
throughout my study with all administrative work. John Simms always helped to solve
the computer hardware problems I got during my work in the department. I also like to
thank Dr. Zeki Billor for his moral support and proper guidance for muscovite separation.
I also want to pay my sincere thanks to my seniors Prakash Dhakal and
Mohammad Wahidur Rahman for their guidance. Prakash was the one who helped me to
adjust with educational system and social life in United States. I am also grateful to
Bibek Upreti for his support in my thesis work as well as in my daily life. It was Bibek
who broke most of my sandstones samples which were very hard.
This research was funded by the U.S National Science Foundation (NSF-EAR-
0310306), Geological Society of America, and the Department of Geology and
Geography of Auburn University.
I want to thank my parents who gave me the opportunity to see this wonderful
world and supported me in every step of my life. I would like to thank my brother and
sisters for their love and support.

ix
Style manual or journal used
Geological Society of America Bulletin
Computer software used
Adobe Acrobat 6 Professional
Adobe Illustrator 8.0
Adobe Photoshop CS 2
Macromedia FreeHand 11.0
Golden Software Grapher 3.0
Golden Software Surfer 8.0
Microsoft Excel 2007
Microsoft Word 2007
Microsoft Office Picture Manager 2007

x
TABLE OF CONTENTS PageLIST OF FIGURES xii
LIST OF TABLES xx
CHAPTER 1: INTRODUCTION……………………………………………….......
1
1.1 Introduction…………………………………………………………………….. 11.2 Location of the study area……………………………………………..……….. 41.3 Previous Works………………………………………………………………… 51.4 Objectives……………………………………………………………………….
7
CHAPTER 2: GONDWANAN SEQUENCES OF NEPAL HIMALAYA AND PENINSULAR INDIA……………………………………………………………...
8
2.1 General Geological Setting of Nepal Himalaya………………………………... 82.2 Gondwana Stratigraphy of Nepal………………………………………………. 102.3 Gondwanan Sequences in other parts of Nepal………………………………… 242.4 Distribution of Gondwanan Basins in Peninsular India………………………... 262.5 Gondwanan Stratigraphy of other parts of extra-Peninsular India and other parts of Gondwanaland……………………………………………………………...
31
CHAPTER 3: EVOLUTION OF GONDWANAN BASINS………………………
36
3.1 Continental Breakup of Gondwanaland………………………………………... 363.2 Evolution of the Passive Margin at the Northern Boundary of India…………... 383.3 Evolution of Facies and Climatic control during the Evolution of Gondwanan Sequences…………………………………………………………………………...
40
CHAPTER 4: SANDSTONE PETROGRAPHY…………………………………... 44
4.1 Introduction…………………………………………………………………….. 444.2 Methods………………………………………………………………………… 454.3 Petrography……………………………………………………………………... 474.4 Sandstone Modes……………………………………………………………….. 604.5 Petrofacies Evolution …………………………………………………………...
62

xi
CHAPTER 5: HEAVY MINERAL ANALYSIS…………………………………... 68
5.1 Introduction……………………………………………………….……………. 685.2 Methods………………………………………………………………………… 715.3 Results………………………………………………………………………….. 745.4 Provenance……………………………………………………………………...
82
CHAPTER 6: MICROPOBE ANALYSIS………………………………………….
86
6.1 Introduction…………………………………………………………………….. 866.2 Mineral Chemistry…………………………………………………………….... 866.3 Sample Preparation…………………………………………………………….. 886.4 The Electron Micropobe………………………………………………………... 896.5 Results………………………………………………………………………….. 926.6 Discussion……………………………………………………………………….
102
CHAPTER 7: WHOLE ROCK CHEMISTRY…………………………….……….
107
7.1 Introduction…………………………………………………………………….. 1077.2 Methods………………………………………………………………………… 1087.3 Results…………………………………………………………………………..
110
CHAPTER 8: 40Ar/39Ar DETRITAL MUSCOVITE DATING……………….…... 130
8.1 Introduction…………………………………………………………………….. 1308.2 Methodology……………………………………………………………………. 1348.3 40Ar/39Ar Results……………………………………………………………….. 1358.4 Provenance Interpretation………………………………………………………. 145 CHAPTER 9: DISCUSSION AND CONCLUSION………………………………. 147
9.1 Synthesis………………………………………………………………………... 1479.2 Sandstone Petrography and Stratigraphy……………………………………….. 1479.3 Heavy Mineral Study…………………………………………………………… 1529.4 Micropobe Analysis…………………………………………………………….. 1529.5 Geochemical Analysis………………………………………………………….. 1539.6 40Ar/39Ar Muscovite Geochronology…………………………………………... 1549.7 Paleotectonic Setting…………………………………………………………… 1559.8 Conclusions…………………………………………………………………….. 159

xii
REFERENCES……………………………………………………………………... 161
APPENDICES……………………………………………………………………… 176

xiii
LIST OF FIGURES
Page
Figure 1.1 Configuration of continental masses in Gondwanaland (after Gray et
al., in press)……………………………………………………………………... 2
Figure 1.2 Location map of study sites in Nepal. Map also shows the Damodar
Basin of Peninsular India……………………………………………………….. 4
Figure 2.1 Geological map of Nepal showing locations of Gondwanan sequences
investigated in this study (modified from Amatya and Jnawali,
1994)………………………………………………………………………………. 9
Figure 2.2 Stratigraphic column of the Tansen Group, eastern Nepal (after Sakai,
1983), showing position of samples used in the current study……………………. 12
Figure 2.3 Geological map (A) of Tansen area (after Sakai, 1983) and geological
cross section (B) of Tansen area………………………………………………….. 13
Figure 2.4 Roadside outcrop of the Sisne Sandstone near Charchare area……….. 14
Figure 2.5 Steeply dipping Amile Quartzite along Bhainskati Khola near the
Charchare area, western Nepal……………………………………………………. 16
Figure 2.6 Geological map of the Barahachettra area (after Dhital, 1992 and
2006) and sample collection locations……………………………………………. 20
Figure 2.7 Stratigraphic Column of the Barahachettra (Dhital, 1992) and Katari
groups (Dhital 2006), eastern Nepal……………………………………………… 21

xiv
Figure 2.8 Geological map of the Katari area (Dhital, unpublished) and sample-
collection locations………………………………………………………………... 22
Figure 2.9 Outcrop of Kokaha Diamictite along Kokaha Khola, eastern Nepal….. 23
Figure 2.10 Outcrop of sandstone along Maruwa Khola in Katari area, eastern
Nepal………………………………………………………………………………. 23
Figure 2.11 (A) Geological map of peninsular India (after Najman, 2005) and (B)
distribution of Gondwanan basins in peninsular India (after Dutta, 2002)………… 27
Figure 2.12 Stratigraphic column of Gondwanan sequences in the Damodar
Basin (after Veveers and Tiwari, 1995)…………………………………………... 29
Figure 2.13 Distribution of Gondwanan basins on the Indian subcontinent (Frakes,
1975)……………………………………………………………………………….. 32
Figure 2.14 Main tectonic subdivision and relation of Indian Precambrian shield
(after Khan, 1994)………………………………………………………………….. 33
Figure 2.15 Distribution of Gondwanan basins in Gondwanaland in Early Permian
(Veveers and Tiwari, 1995)………………………………………………………... 35
Figure 3.1 Generalized reconstructions of (A) Early Cretaceous and (B) Tertiary
Gondwanaland (from Segev, 2002)………………………………………………... 38
Figure 3.2 Schematic reconstruction of micro continent barrier supposed to have
existed between the Lesser Himalayan and the Higher Himalayan terrains……….. 40
Figure 3.3 Paleogeography of Gondwanaland (www.paleoportal.com, 2009)…….. 41
Figure 3.4 Marine incursion in Gondwanaland during the Permian (Valdiya,
1998)……………………………………………………………………………….. 43
Figure 4.1 Representative photomicrographs of Gondwanan sandstones, western
Nepal. (A) Sisne Formation. (B )Taltung Formation………………………...…… 54

xv
Figure 4.2 Representative photomicrographs of Gondwanan sandstones, western
Nepal. (A) Amile Formation. (B) Bhainskati Formation………………………….
55
Figure 4.3 Representative photomicrographs of Gondwanan sandstones, (A)
Dumri Formation, western Nepal. (B) Katari Group, eastern Nepal……………… 56
Figure 4.4 Representative photomicrographs of the Gondwanan sandstones, (A)
Saptakoshi Formation, eastern Nepal, sample 23-5. (B) Saptakoshi Formation,
eastern Nepal, sample 22-7………………………………………………………... 57
Figure 4.5 (A) Representative photomicrograph of the Tamrang sandstone,
eastern Nepal (B) Aulis Basalt, Western Nepal…...…………………………….... 58
Figure 4.6 Variation of modal mineralogical composition of the Gondwanan
sandstones of Nepal. ……………………………………………………...……... 61
Figure 4.7 QtFL plot of Gondwanan sandstones of Nepal showing mean and
standard deviation polygons………………………………………………………. 65
Figure 4.8 QmFLt plot of Gondwanan sandstone of Nepal showing mean and
standard deviation polygons………………………………………………………. 66
Figure 4.9 QmPK plot of the Gondwanan sandstones of Nepal showing mean and
standard deviation polygons ……………………………………………………… 66
Figure 4.10 LsLvLm plot of the Gondwanan sandstones of Nepal showing mean
and standard deviation polygons. ………………………………………………… 67
Figure 5.1 Representative photomicrograph of tourmalines in Amile sandstone
(sample 15-6) of the Tansen Group, western Nepal………………………………. 74
Figure 5.2 Representative photomicrograph of heavy mineral assemblage in the
Taltung sandstone (sample K-1) of the Tansen Group, western Nepal…………… 76
Figure 5.3 Representative photomicrograph of heavy mineral assemblage in the
Sisne sandstone (sample 16-3) of the Tansen Group, western Nepal…………….. 78

xvi
Figure 5.4 Representative photomicrograph of heavy mineral assemblage in the
Permo-Carboniferous sandstone (sample 26-8) of the Katari Group, eastern
Nepal………………………………………………………………………………. 78
Figure 5.5 Representative photomicrograph of heavy mineral assemblage in the
Permo-Carboniferous sandstone (sample 26-8) of the Katari Group, eastern
Nepal………………………………………………………………………………. 81
Figure 5.6 Representative photomicrograph of heavy mineral assemblage in the
Permo-Carboniferous sandstone (sample 23-4) of the Barahachettra Group,
eastern Nepal…………………………………………………………………….... 81
Figure 5.7 Distribution of heavy minerals among different units and sections of
Gondwanan sandstones in Nepal………………………………………………….. 83
Figure 5.8 Distribution of highly stable heavy minerals (ZTR) among different
units and sections of Gondwanan sandstones in Nepal…………………………… 84
Figure 5.9 Distribution of garnets among different units and sections of
Gondwanan sandstones in Nepal………………………………………………….. 84
Figure 5.10 Variation in distribution of garnets and ZTR among different units
and sections of Gondwanan sandstones in Nepal…………………………………. 85
Figure 5.11 Possible source rock units for the Gondwanan sandstones of Nepal
from cratonic India………………………………………………………………... 85
Figure 6.1 Chemical composition of garnets of Gondwanan sequences of Nepal
(Tansen Group, western Nepal; Barahachettra and Katari groups in eastern
Nepal) plotted on (Sp+Gro)-Py-Alm……………………………………………… 94
Figure 6.2 Chemical composition of garnets of Gondwanan sequences of Nepal
(Tansen Group, western Nepal; Barahachettra and Katari groups in eastern
Nepal) plotted on (Py+Alm)-Gro-Sp…………………………………………… 94

xvii
Figure 6.3 Chemical composition of garnets of Gondwanan sequences of Nepal
(Tansen Group, western Nepal; Barahachettra and Katari groups in eastern
Nepal) plotted on (Alm+Sp)-Py-Alm…………………………………………… 95
Figure 6.4 Chemical composition of garnets of Gondwanan sequences of Nepal
(Tansen Group, western Nepal; Barahachettra and Katari groups in eastern
Nepal) plotted on Alm-Py-Sp……………………………………………………... 95
Figure 6.5 Grossular contents of garnets from Gondwanan sequences of Nepal
(Tansen Group, western Nepal; Barahachettra and Katari groups in eastern
Nepal) plotted on Alm-Py-Sp……………………………………………………... 96
Figure 6.6 Al-Fe (tot)-Mg plot (in molecular proportion) for tourmalines from
Gondwanan sequences of Nepal (Tansen Group, western Nepal; Barahachettra
and Katari groups in eastern Nepal)………………………………………………. 98
Figure 6.7 Ca-Fe(tot)-Mg plot (in molecular proportion) for tourmalines from
Gondwanan sequences of Nepal (Tansen Group, western Nepal; Barahachettra
and Katari groups in eastern Nepal)………………………………………………. 99
Figure 6.8 Ternary plot of major trivalent cations in chrome-spinels of the
Taltung Formation of the Tansen Group (Gondwanan sequences) of the Nepal
Himalaya with three major provenance fields (adapted after Nixon et. al, 1990)... 99
Figure 6.9 Plot of Mg/(Mg+Fe2+) vs Cr/(Cr+Al) for chrome-spinels of the
Taltung Formation of the Tansen Group (Gondwanan sequences) of the Nepal
Himalaya (adapted after Nixon et. al, 1990)……………………………………… 100
Figure 6.10 Plot of Mg/(Mg+Fe2+) vs the ratio of trivalent cations
Fe3+/( Fe3++Cr+Al) for chrome-spinels of the Taltung Formation of the Tansen
Group (Gondwanan sequences) of the Nepal Himalaya………………………….. 101
Figure 6.11 Petrographic grid for the KFMASH system contoured with isopleths
of XAlm in garnet (after Spear and Cheney, 1989) showing isopleth values for
garnets of Gondwanan sequences of Nepal……………………………………….. 103

xviii
Figure 6.12 Plot of TiO2 vs Cr# of Gondwanan sequences of Nepal (Tansen
Group, western Nepal; Barahachettra and Katari groups in eastern Nepal) relative
to spinels from various potential source rocks……………………………………. 105
Figure 6.13 Schematic diagram showing spinel composition from different
tectonic settings, including those of sea-floor and continental crust origins
(modified from Cookenboo et al., 1997)………………………………………….. 106
Figure 7.1 Chemical classification of Gondwanan sandstones of Nepal,
classification fields are taken from Herron (1988)………………………………... 113
Figure 7.2 Distribution pattern of major element oxides in Gondwanan sandstone
of Nepal. Data are normalized to Post Archean Australian Shale (PAAS) (Taylor
and McLennan, 1995)……………………………………………………………... 116
Figure 7.3 Distribution pattern of major element oxides in Gondwanan sandstone
of Nepal…………………………………………………………………………… 117
Figure 7.4 CIA values for the Gondwanan sandstones of Nepal…………………. 119
Figure 7.5 CIA plot of Gondwanan sandstones of Nepal (modified from Nesbit
and Young, 1984, 1989; and Soreghan and Soreghan, 2007)…………………... 120
Figure 7.6 Distribution patterns of trace elements in Gondwanan sandstone of
Nepal. Data are normalized to Post Archean Australian Shale (PAAS) (Taylor
and McLennan, 1995)……………………………………………………………... 125
Figure 7.7 Distribution patterns of rare earth elements (REE) in Gondwanan
sandstone of Nepal. Data are normalized to Post Archean Australian Shale
(PAAS) (Taylor and McLennan, 1995)…………………………………………… 126
Figure 7.8 Plot of TiO2 vs Zr content of the Gondwanan sandstones of Nepal.
Fields for source rocks are drawn from Hayashi et al. (1997)……………………. 127
Figure 7.9 Tectonic discrimination diagram for Gondwanan sandstones of Nepal 128

xix
Figure 7.10 Plot of elemental percentage of La-Th-Sc of Gondwanan sandstones
of Nepal Fields of tectonic setting are drawn from Bhatia and Crook (1986)……. 129
Figure 8.1 Some stable and radioactive isotopes related to 40Ar/39Ar dating
method…………………………………………………………………………….. 131
Figure 8.2 Probability plot for 40Ar/39Ar of single muscovite crystals from the
Eocene Bhainskati Formation (sample 15-8)……………………………………... 137
Figure 8.3 Probability plot for 40Ar/39Ar of single muscovite crystals from the
Permo-Carboniferous Sisne Formation (sample 16-3)……………………………. 138
Figure 8.4 Probability plot for 40Ar/39Ar of single muscovite crystals from the
Permo-Carboniferous Saptakoshi Formation (sample 22-8)……………………… 139
Figure 8.5 Probability plot for 40Ar/39Ar of single muscovite crystals from the
Permo-Carboniferous Katari Group (sample 26-8)……………………………….. 140
Figure 8.8 Possible source rock with the age given by the detrital muscovite
analyzed…………………………………………………………………………… 146
Figure 9.1 Correlation of stratigraphy of Gondwanan sequences in western part
of Nepal and proposed stratigraphy of eastern Nepal 151
Figure 9.2 Chondrite normalized REE pattern of Bengal Trap Basalt (from Baksi,
1995)………………………………………………………………………………. 154
Figure 9.3 40Ar/39Ar cooling ages of single grain muscovite from the Gondwanan
sandstone of Nepal……………………………………………………………...… 156
Figure 9.4 Paleotectonic setting of India from Permo-Carboniferous to Miocene
during deposition of Gondwanan and post-Gondwanan sequences (modified after
Sakai, 1989; Veevers and Tiwari, 1995; DeCelles et al., 1998)…………………... 158

xx
LIST OF TABLES
Page
Table 2.1 Generalized correlations of Gondwanan sequences of Nepal Himalaya…………………………………………………………………………... 25
Table 4.1 Recalculated modal parameters of sand and sandstone………………… 46
Table 4.2 Normalized modal compositions of Gondwanan sandstones in Nepal… 59
Table 5.1 Relative stability of heavy minerals for different sedimentary processes…………………………………………………………………………... 69
Table 5.2 Four fractions of different magnetic susceptibility (Hess, 1966)………. 72
Table 5.3 Heavy mineral data in Gondwanan sandstones from western Nepal (Tansen Group)……………………………………………………………………. 79
Table 5.4 Heavy mineral distribution in Gondwanan sandstones from eastern
Nepal (Barahachettra and Katari groups)…………………………………………. 80
Table 6.1 Electron microprobe standards used for this study…………………….. 91
Table 7.1 Results of whole-rock chemical analysis of Gondwanan sandstones from Nepal………………………………………………………………………… 110
Table 7.2 Ratios of some major oxides of Gondwanan sandstones from Nepal….. 114
Table 7.3 Ratios of some trace elements in Gondwanan sandstones of Nepal…… 122
Table 8.2 Isotopes produced during the irradiation process of muscovite………... 132
Table 9.1 Proposed Stratigraphy of Gondwanan and post- Gondwanan sequences
in the Barahachettra area (eastern Nepal) and its correlation with Gondwanan
sequences in other parts of Nepal…………………………………………………. 150

1
CHAPTER 1: INTRODUCTION
1.1 INTRODUCTION
Studies of petrofacies evolution are based on the assumption that the composition
of detrital sediments records the composition of the source rocks from which those
sediments were derived (Dickinson and Suczek, 1979). This theoretical relationship
enables interpretation of paleogeography, paleoclimate, ancient plate tectonic settings
(Graham et al., 1976; Dickinson and Suczek, 1979), and rock-uplift and exhumation
histories (Graham et al., 1976) from the sedimentary record. Sometimes sedimentary
rocks may provide the only source of this information particularly in cases of deeply
denuded source terranes. The validity of this assumption has been demonstrated for
numerous samples detrital sediments and sedimentary rocks (Dickinson, 1970; Dickinson
and Suczek, 1979). However, interpretation of provenance from sediment compositional
data also requires consideration of other controlling factors such as transport distance,
time, energy, and climate (Suttner, 1974; Johnsson, 1993).
Sandstone compositional studies are very important in tracing sediment
provenance (Dickinson and Suczek, 1979). Sandstone compositional analyses, in which
proportions of detrital framework grains within a sand (stone) sample are plotted on
various ternary plots (QtFL, QmFLt, etc.), can distinguish various tectonic settings of
source areas (Ingersoll et al., 1995). Composition of detrital sediments is controlled by

2
various factors, including source rocks, modes of transportation, depositional
environments, climate, and diagenesis (Suttner, 1974). Provenance studies that focus on
key attributes of detrital mineralogy provide important constraints on basin evolution and
unroofing history of orogenic belts.
The term “Gondwanaland’ was coined by Eduard Suess, referring to India as the
land of ‘Gond’, which was the name of a local Indian tribe. However, Gondwanaland is
now defined as southern supercontinent that existed from 550 Ma to 167 Ma (Fig. 1.1).
Figure 1.1 Configuration of continental masses in Gondwanaland (after Gray et al., in press)
Sedimentary sequences deposited from early Carboniferous to Late Jurassic in
peninsular India (Gondwanaland) are known as Gondwanan sequences (Wadia, 1919).
Most of these sequences were deposited in continental depositional environment with few
marine invasions. The name is also applied to the sequences deposited in other parts of

3
Gondwanaland during that period, including there now in Australia, Africa, South
America and Antarctica.
The Gondwanan system in the Indian subcontinent is not confined to peninsular
India. Outliers of Gondwanan sequences have been found in northern India across the
Indo-Gangetic plain in the western Himalayas (Punjab Salt Range, Afghanistan,
Kashmir) and the eastern Himalayas (Nepal, Sikkim, Bhutan, Assam, etc.). These are
known as extra-peninsular Gondwanan sequences. Gondwanan strata of peninsular India
are thick and relatively undisturbed, whereas the extra-peninsular occurrences are
incomplete and have been folded, compressed, and, in many cases, metamorphosed.
The provenance history of the Gondwanan sequences in the Nepal Himalaya
(Lesser Himalaya) has not been studied as thoroughly as the Gondwanan sequences of
peninsular India. Although parts of this sequence have been studied (Bashyal, 1980,
Sakai, 1983; Dhital, 1992; DeCelles et al., 2004; Najman et al., 2005) at different
localities along the Nepal Himalaya, a complete and comparative study has not been
done. The Tansen Group in western Nepal consists of relatively complete and thick
Gondwanan and post-Gondwanan sequences documenting sedimentation for an extended
period ranging from late Carboniferous to early Miocene (DeCelles et al., 2004).
However, the sequences in the eastern part (Katari and Barahchettra groups) are thinner
and incomplete and stratigraphy has received little attention. As the Gondwanan
sequences of the eastern part of Nepal are close to the Main Central and Main Boundary
thrust (MCT and MBT) zones, they are intensely deformed by numerous imbricate faults
(Dhital, unpublished). A thorough study comparing and contrasting Gondwanan

4
sequences from the Nepal Himalaya and India has not been done. Sakai (1983) made an
effort to correlate the Gondwanan sequences of the Tansen Group of Nepal with Indian
units. However, this correlation was based solely on lithology.
1.2 LOCATION OF THE STUDY AREA
The present study is focused on Gondwanan sequences preserved in three sections
within the Nepal Himalaya (Fig. 1.2).
Figure 1.2 Location map of study sites in Nepal. Map also shows the Damodar Basin of Peninsular India.

5
These selected sections are distributed from western part of Nepal to eastern part.
The Tansen Group is approximately 400 km west of Kathmandu valley in the Palpa
District and is easily accessible with motor vehicles. The Barahachettra and Katari groups
are exposed approximately 650 km and 500 km, respectively, to the east of Kathmandu
valley and are also easily accessible.
Damodar basin, type locality of peninsular Indian Gondwanan sequences, is
approximately 100 km southeast of New Delhi and only 300 km south of the
Barahachettra Group in eastern Nepal.
1.3 PREVIOUS WORK
Medlicott (1864) documented a tillitic horizon,--the Blaini Formation-- in the
Lesser Himalaya of the Simla area (India). Pilgrim and West (1928) carried out further
detailed lithostratigraphic studies of this and correlated it with the Lower Gondwanan
tillitic sequences of peninsular India. However, when Early Cambrian and late
Precambrian fossils were discovered from the Krol and Tal formations above the Blaini
Formation (Azmi and Pancholi, 1983), these tillitic beds were interpreted as a Proterozoic
sequences. Auden (1935) was the first to record Gondwanan sequences in eastern Nepal
based on mapping along the Lesser Himalaya.
In contrast with the tillitic beds in the western Himalaya, most of tillitic beds in
the eastern Himalaya are considered to be part of the Lower Gondwanan system based on
occurrence of plant fossils. However, Gansser (1983) introduced the Diuri Formation, a
6
boulder bed sequence lacking coal from the Bhutan Lesser Himalaya and correlated it
with the late Precambrian tilloids.
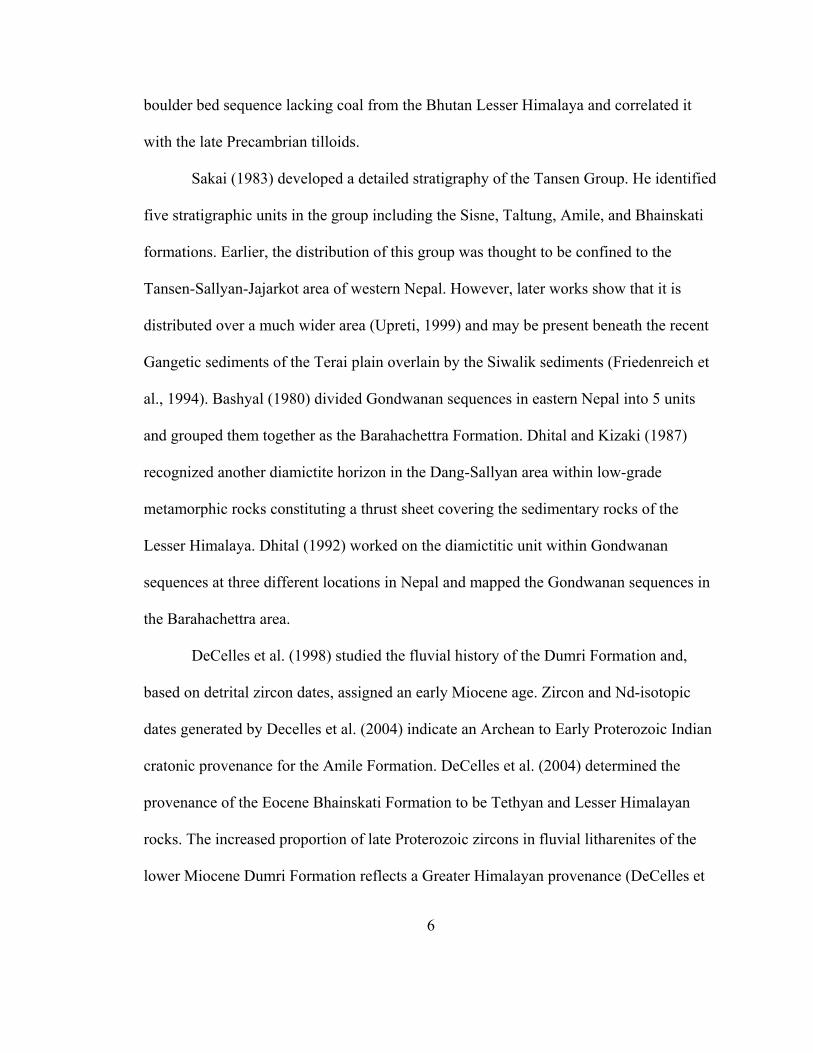
Sakai (1983) developed a detailed stratigraphy of the Tansen Group. He identified
five stratigraphic units in the group including the Sisne, Taltung, Amile, and Bhainskati
formations. Earlier, the distribution of this group was thought to be confined to the
Tansen-Sallyan-Jajarkot area of western Nepal. However, later works show that it is
distributed over a much wider area (Upreti, 1999) and may be present beneath the recent
Gangetic sediments of the Terai plain overlain by the Siwalik sediments (Friedenreich et
al., 1994). Bashyal (1980) divided Gondwanan sequences in eastern Nepal into 5 units
and grouped them together as the Barahachettra Formation. Dhital and Kizaki (1987)
recognized another diamictite horizon in the Dang-Sallyan area within low-grade
metamorphic rocks constituting a thrust sheet covering the sedimentary rocks of the
Lesser Himalaya. Dhital (1992) worked on the diamictitic unit within Gondwanan
sequences at three different locations in Nepal and mapped the Gondwanan sequences in
the Barahachettra area.
DeCelles et al. (1998) studied the fluvial history of the Dumri Formation and,
based on detrital zircon dates, assigned an early Miocene age. Zircon and Nd-isotopic
dates generated by Decelles et al. (2004) indicate an Archean to Early Proterozoic Indian
cratonic provenance for the Amile Formation. DeCelles et al. (2004) determined the
provenance of the Eocene Bhainskati Formation to be Tethyan and Lesser Himalayan
rocks. The increased proportion of late Proterozoic zircons in fluvial litharenites of the
lower Miocene Dumri Formation reflects a Greater Himalayan provenance (DeCelles et

7
al., 2004). The time lag between Eocene deposition in the western and eastern parts of
Nepal was determined to be 2 m.y. (Najman et al., 2005) suggesting that early
exhumation of the Himalayas was diachronous.
1.4 OBJECTIVES
This study focuses on evaluating the petrofacies evolution and paleotectonic
settings of Gondwanan sequences of Nepal, in order to reconstruct the paleogeographic
scenario of Gondwanaland, the late Paleozoic supercontinent of the southern hemisphere.
Several approaches were taken to carry out this study.
Petrographic studies of representative Gondwanan sandstone samples from three
different sections of Nepal were performed to picture characteristic modes of occurrence
and environments of deposition. Traditional heavy mineral studies and mineral chemistry
of representative heavy minerals of Gondwanan sandstones collected from the three study
sections were completed to evaluate the provenance and weathering history of the
sediments. Bulk whole-rock chemistry of major, trace, and rare-earth elements of selected
Gondwanan samples were performed to decipher their probable source rocks,
paleogeographic positions, and weathering history. Laser 40Ar/39Ar geochronology of
detrital muscovite grains from allegedly similar stratigraphic levels of Gondwanan
sequences at three localities was used to uncover temporal relationships and probable
tectonic histories of source terranes. Ultimately, this research sought to evaluate the long-
disputed along-strike stratigraphy of Gondwanan sequences of Nepal.

8
CHAPTER 2: GONDWANAN SEQUENCES OF NEPAL HIMALAYA
2.1 GENERAL GEOLOGICAL SETTING OF NEPAL HIMALAYA
Nepal occupies the central segment of the 2400-km-long Himalayan arc. Similar
to other parts of the Himalayas, from south to north, Nepal can be subdivided into the
following five major tectonic zones: (1) the Gangetic Plain, consisting of recent alluvial
deposits of Ganga river system; (2) the Siwaliks or sub-Himalayas are typically Miocene
deposits, deposited in the foreland depression developed after collision of the Indian plate
with the Tibetian block; (3) the Lesser Himalayas consist of a thick succession of
Precambrian to early Paleozoic low-grade and high-grade metamorphic rocks; (4) the
Higher Himalayas consist of high-grade metamorphic gneiss, schists, marble and
quartzite; and (5) the Tibetan or Tethys Himalayas are thick successions of fossiliferous
rocks deposited during Paleozoic and Mesozoic eras (Fig. 2.1).
These tectonic zones are separated from each other by thrust and fault boundaries.
The thrust system in the Nepal Himalaya includes the Main Frontal Thrust (MFT)
between Siwaliks and Gangetic Plain, the Main Boundary Thrust (MBT) between the
Lesser Himalaya and the Siwaliks, the Main Central Thrust (MCT) between the Higher
Himalaya and the Lesser Himalaya, and the South Tibetian Detachment System (STDS),
which is a gravity driven normal fault.

9
Figu
re 2
.1 G
eolo
gica
l map
of N
epal
show
ing
loca
tions
of G
ondw
anan
sequ
ence
s inv
estig
ated
in th
is st
udy
(afte
r Am
atya
and
Jnaw
ali,
1994
)

10
2.2 GONDWANAN STRATRIGRAPHY OF NEPAL
The Lesser Himalayas contain three units: (1) The lowermost Precambrian to
early Paleozoic low-grade metamorphic unit, (2) a late Paleozoic to early Cenozoic
Gondwanan sequence, and (3) a late Precambrian high-grade metamorphic unit. The
Gondwanan rocks occur in patches in the Lesser Himalayas. The lowermost unit is
considered as the equivalent of the Vindhyan Group of peninsular India, which is
unconformably underlain by Gondwanan sequences. The unconformity between these
two groups is known as the Great Lesser Himalayan Unconformity (Upreti, 1999) or Pan-
African Unconformity (Valdiya, 1997) and is contemporary with Late Pan-African
diastrophism. The late Precambrian high-grade metamorphic unit is actually an
allocthonus unit thrusted over other Lesser Himalayan rocks and likely has a root zone
within the Higher Himalaya.
2.2.1 TANSEN GROUP
The Tansen Group (type locality of Gondwanan sequences in Nepal) is a largely
continental deposit, with some periodic marine incursions. The lithological succession
and fossil content of Gondwanan sequences in the Tansen area have been very well
studied. The Tansen Group consists of the Sisne Formation (Lower Gondwana), the
Taltung and Amile formations (Upper Gondwana), and the Bhainskati and Dumri
formations (post-Gondwana) (Figs. 2.2, 2.3A, B).
Sisne Formation: The Sisne Formation unconformably overlies the Kerabari
Dolomite of the Kaligandaki Supergroup. This disconformity is the same as the Pan-
11
African disconformity. However, the base of the Sisne Formation cannot be defined in
Tansen area due to its fault relation with the Kerabari Dolomite. The reported maximum
thickness of this formation is 1020 m (Sakai, 1983). The Sisne Formation mostly consists
of diamictite and mudstone with some beds of sandstone and conglomerate. Diamictite
with both clayey matrix and sandy matrix are present in the area. The majority of the
clasts are granites, gneissic rocks, limestone, sandstone, and dolomite ranging in size
from sand to boulder. Though there is no direct evidence of a glacial origin for the
diamictite (e.g., striations), the deposit is considered as glacial based on poor sediment
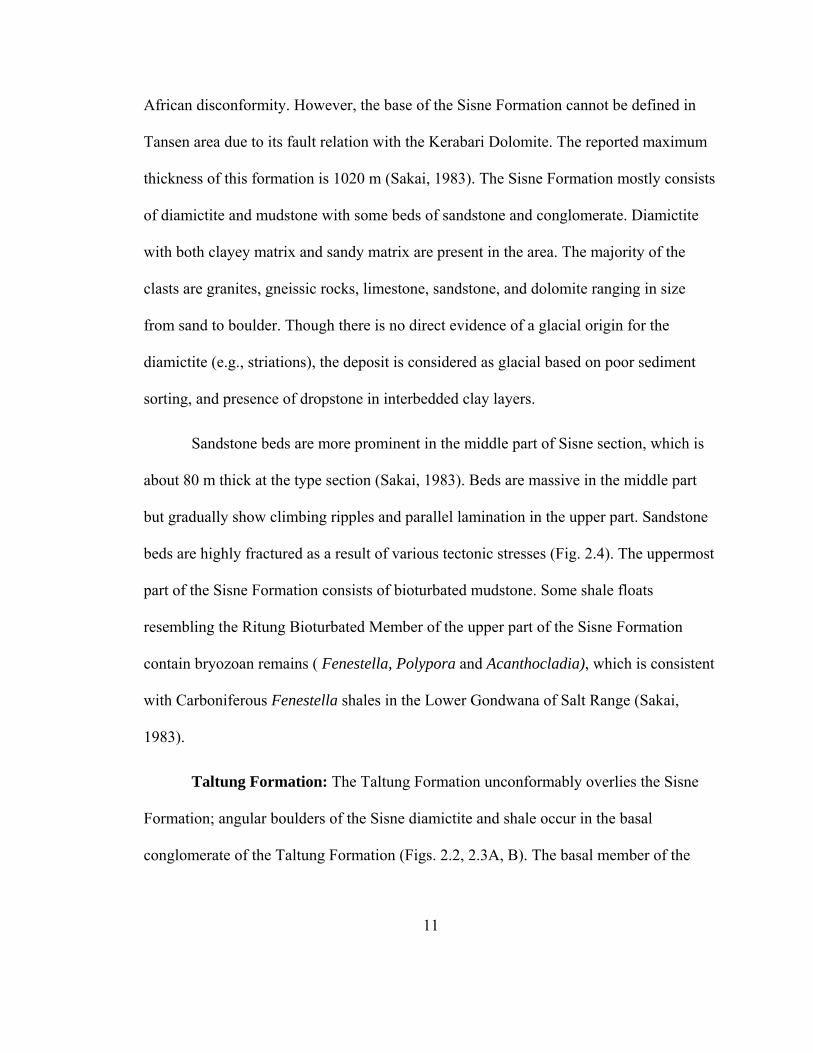
sorting, and presence of dropstone in interbedded clay layers.
Sandstone beds are more prominent in the middle part of Sisne section, which is
about 80 m thick at the type section (Sakai, 1983). Beds are massive in the middle part
but gradually show climbing ripples and parallel lamination in the upper part. Sandstone
beds are highly fractured as a result of various tectonic stresses (Fig. 2.4). The uppermost
part of the Sisne Formation consists of bioturbated mudstone. Some shale floats
resembling the Ritung Bioturbated Member of the upper part of the Sisne Formation
contain bryozoan remains ( Fenestella, Polypora and Acanthocladia), which is consistent
with Carboniferous Fenestella shales in the Lower Gondwana of Salt Range (Sakai,
1983).
Taltung Formation: The Taltung Formation unconformably overlies the Sisne
Formation; angular boulders of the Sisne diamictite and shale occur in the basal
conglomerate of the Taltung Formation (Figs. 2.2, 2.3A, B). The basal member of the
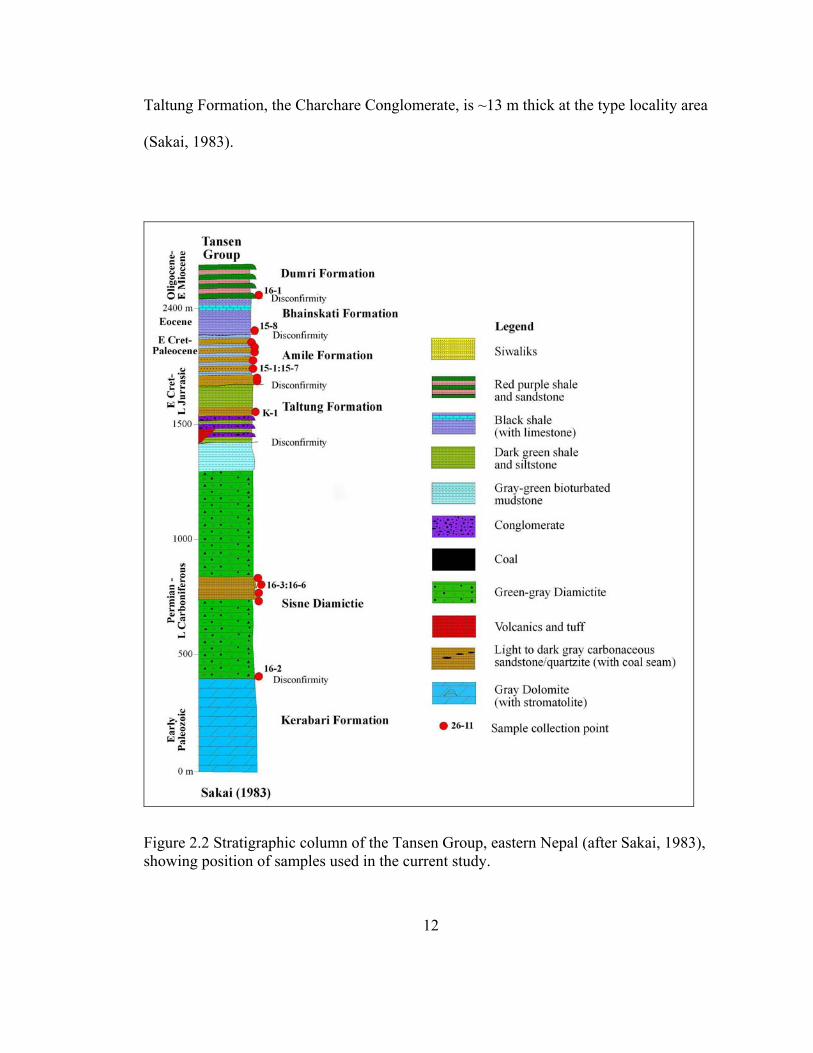
12
Taltung Formation, the Charchare Conglomerate, is ~13 m thick at the type locality area
(Sakai, 1983).
Figure 2.2 Stratigraphic column of the Tansen Group, eastern Nepal (after Sakai, 1983), showing position of samples used in the current study.

13
Figure 2.3 Geological map (A) of Tansen area (after Sakai, 1983) and geological cross section (B) of Tansen area.

14
The conglomerate beds fine upward and are capped by sandstone beds. Pebbles of
conglomerate are composed mostly of quartzite and volcanic rocks. Locally, the pebbles
are imbricated. Imbrications suggest that the flow direction during the deposition of
conglomerate was from SE to NW. Associated with the lower part of the Taltung
Formation and Charchare Conglomerate is the Aulis Basalt, which is present in the
southern part of Tansen area (Sakai, 1983). The basalt is porphyritic with plagioclase
phenocrysts and dark-green to gray.
Figure 2.4 Roadside outcrop of the Sisne Sandstone near Charchare area.
The lower member of the Taltung Formation consists of several upward fining
sequences, each of which consists of conglomerate, sandstone, and silty shale. Plant

15
fossils referable to Upper Gondwana are found in siltstone beds (Sakai, 1983). This
member is interpreted as meandering fluvial deposit.
Rhythmic sequences of sand and shale characterize the upper member of the
Taltung Formation. The thickness of each rhythm ranges from 8 – 20 m. The light green
sandstone beds are mostly massive but some are cross bedded and contain scour-and-fill
structures. Shales are characterized by hematite speckles and calcareous concretions. The
lower part of the Taltung Formation contains the fossil plant genera Ptillophyllum,
Pterophyllum, Cladophrebis and Elatocladus, which indicates a Jurassic-Cretaceous age
(Sakai, 1983).
Amile Formation: The total thickness of the Amile Formation is 230 m at the
type locality. The basal unit of the formation consists of conglomeratic quartz arenite
followed by white quartz arenite (Fig. 2.4) with interbedded shale.
The middle member of the Amile Formation is characterized by the presence of
fossiliferous argillaceous limestones, siltstones, and hematitic quartz arenite. Limestone
beds yield several types of marine fossils including bivalves, gastropods, echinoids, and
corals (Sakai, 1983).

16
Figure 2.5 Steeply dipping Amile Quartzite along Bhainskati Khola near the Charchare area, western Nepal.
The upper Member of the formation is characterized by an increase in mud
content in quartzose beds and the presence of calcareous muddy sandstones and
carbonaceous shales. The uppermost part of the formation consists of bioturbated
carbonaceous muddy sandstone containing coalified wood fragments. The Amile
Formation is considered as Cretaceous to Paleocene in age based on its stratigraphic
position and presence of scleractinian corals, which are also present in the Jurassic-
Cretaceous Tal Formation of the Kumaon Himalaya (Sakai, 1983) However, that part of
the Tal Formation is no longer considered as the Tal Formation (Valdiya, 1997).

17
Bhainskati Formation: The Bhainskati Formation is not considered as
Gondwanan deposits as it was deposited after the break up of Gondwanaland. However,
it was deposited in the same basin where Gondwanan sequences were deposited. The
contact between the Bhainskati Formation and the underlying Gondwanan sediments is
unconformable. The total thickness of the formation at the type locality is about 160 m.
The Bhainskati Formation consists of largely black shale, interbedded with calcareous,
fossiliferous, and greenish-reddish shale. The hematite beds are present at top part.
The fossiliferous beds of the Bhainskati Formation contain abundant bivalves,
gastropods, and larger foraminifera (Sakai, 1983). Black shale beds contain pyritized
wood fragments. The presence of Nummulites sp in the Bhainskati Formation indicates an
Eocene age for this formation and suggests correlation with the Subathu Formation of the
Kumaon Himalaya.
Dumri Formation: The Dumri Formation disconformably overlies the Bhainskati
Formation (Figs. 2.2 and 2.3). The formation consists of a thick succession of medium-
grained, bluish-gray quartzose sandstones interbedded with red and green shales. The
proportion of shale decreases towards the upper part of the formation. Sandstones are
quartzose wackes with little carbonaceous material. There are also several
intraformational shale-pebble conglomerates and conglomeratic sandstones. The age of
the Dumri Formation is not known. However, based on relationships with the underlying
Bhainskati Formation and correlation with the Murree Group of Pakistan and the Dagshai
Formation of Simla Himalaya, it is assigned an Early Miocene age.

18
2.2.2 BARAHACHETTRA AND KATARI GROUPS
Barahachettra Group: Bashyal (1980) identified Gondwanan sequences in the
eastern part of Nepal and referred to that that tectono-stratigraphic package as the
Barahachettra Formation. He divided the whole formation into five members and defined
the Main Boundary Thrust (MBT) as the southern boundary of the formation. The latter
was based on the consideration that the dolomite unit just north of the MBT is the
youngest unit of the package. Dhital (1992), however, did not include the Dolomite Unit
in that formation. He revised the stratigraphy and divided the sequences into the
Saptakoshi Formation, the Kokaha Diamictite and the Tamrang Formation. He assigned
the rank of ‘Group’ to the Barahachettra Formation of Bashyal (1979, 1980) (Figs. 2.6
and 2.7).
Quartzite unit of the Saptakoshi Formation unconformably overlies the dolomite
beds of the Precambrian Lukuwa Formation. Notably, quartzites are absent on top of
Precambrian basement in peninsular and in other extra-peninsular Gondwanan basins
(Bashyal, 1979, 1980). The formation consists of medium to thick bedded, gray and dark
gray, carbonaceous quartzite, carbonaceous shale, and conglomerate with lenses of coal.
Bashyal (1980) reported the occurrence of plant species Shizonera gondwanensis at
Takure Khola, which belongs to the Damuda flora of Permian age.
The Kokaha Diamictite consists of diamictite beds with clasts of quartzite,
dolomite, schist, granite, shale and sandstone. The formation sharply overlies the
Saptakoshi Formation. Some interbedded sandstones are also present in the formation

19
(Fig. 2.9). The Kokaha diamictite is overlain by calcareous sandstones of the Tamrang
Formation. These sandstones are composed of quartz, calcite, and plagioclase in an
argillo-calcareous matrix (Bashyal, 1980)
Katari Group: A small patch of Gondwanan sequence rocks is observed in the
Katari area, eastern Nepal. Along the Maruwa Khola section, Gondwanan sequences are
observed resting unconformably over stromatolitic dolomite (Figs. 2.7 and 2.8). In the
basal part, thin beds of diamictite with dolomite clasts embedded in a dark gray matrix
are overlain by a trachy-basalt (Dhital, unpublished). The latter rock consists of alkali
feldspar and potassium-rich laths of sanidine. The volcanic unit is overlain by
carbonaceous quartz arenite (Fig. 2.10) containing abundant coalified wood. The quartz
arenites are followed by 1-m-thick interval of volcanic tuff and thick-bedded
conglomerate. Greenish to bluish gray calcareous sandstones and dark gray shales are
present in the upper section.

20
Figu
re 2
.6 G
eolo
gica
l map
of t
he B
arah
ache
ttra
area
(afte
r Dhi
tal,
1992
and
200
6) a
nd sa
mpl
e co
llect
ion
loca
tions
.

21
Figu
re 2
.7 S
tratig
raph
ic C
olum
n of
the
Bar
ahac
hettr
a (D
hita
l, 19
92) a
nd K
atar
i gro
ups (
Dhi
tal
2006
), ea
ster
n N
epal
.

22
Figu
re 2
.8 G
eolo
gica
l map
of t
he K
atar
i are
a (D
hita
l, un
publ
ishe
d) a
nd sa
mpl
e-co
llect
ion
loca
tions
.

23
Figure 2.9 Outcrop of Kokaha Diamictite along Kokaha Khola, eastern Nepal.
Figure 2.10 Outcrop of sandstone along Maruwa Khola in Katari area, eastern Nepal.

24
2.3 GONDWANAN SEQUENCES IN OTHER PARTS OF NEPAL
Sharma et al. (1984) worked on the Daban Group of Jajarkot-Piuthan-Sallyan area
of western Nepal, which is equivalent to Gondwanan sequences. The lower unit
(Kochhap Formation) of the Daban Group is equivalent to the Sisne Group, whereas the
upper unit (Goyaltham Formation) is equivalent to the Taltung Formation.
Dhital and Kizaki (1987) worked on the Gondwanan section of the Dang area of
western Nepal. They described the Sallyan Formation as consisting of phyllitic
conglomerate and diamictite and the Phalabang Formation as consisting of phyllitic
slates. These formations are considered to be Lower Gondwanan sequences. The Sattim
Formation, characterized by alternating beds of quartzose sandstone and shale, is
considered to be Upper Gondwana. The overlying Durbing Formation is considered to be
a post-Gondwanan sequence.
In Surkhet area (Western Nepal), Shrestha et al. (1987) worked on the Surkhet
Group and divided it into three formations: Melpani, Swat, and Suntar. However, only
the Melpani Formation is considered to be part of an Upper Gondwanan sequence. The
Swat and Suntar formations are considered to be post-Gondwanan sequences.
The ages and stratigraphic positions of some of the Gondwanan sequences of
Nepal are doubtful due to the absence of fossils and tectonic complexities. However,
correlation is been done between these sequences primarily based on lithology (Table
2.1).

25
Bar
ahac
hett
ra
Gro
up
(Bas
hyal
, 19
80)
Bar
ahac
hettr
a G
roup
Kat
ari
Gro
up
(Dhi
tal,
2006
)
Kat
ari
Gro
up
Tan
sen
Gro
up
(Sak
ai,
1983
Dum
ri Fo
rmai
ton
Bha
insk
ati
Form
atio
n
Am
ile
Form
atio
n
Taltu
ng
Form
atio
n
Sisn
e Fo
rmat
ion
Shar
da
Gro
up
(Dhi
tal a
nd
Kiz
aki,
1987
)
Dur
bing
Fo
rmat
ion
Satti
m
Form
atio
n
Phal
aban
g Fo
rmat
ion
Sally
an
Form
atio
n
Sally
an-
Jaja
rkot
G
roup
(S
hres
tha,
19
87)
Dum
ri Fo
rmai
ton
Bha
insk
ati
Form
atio
n
Am
ile
Form
atio
n
Goy
alth
am
Form
atio
n
Koc
hhap
Fo
rmat
ion
Surk
het
Gro
up
(Kay
asth
a,
1989
)
Sunt
ar
Form
atio
n
Swat
Fo
rmat
ion
Mel
pani
Fo
rmat
ion
Post
G
ondw
ana
Upp
er
Gon
dwan
a
Low
er
Gon
dwan
a
Age
Mid
. Mio
ene
Eoc
ene
Lat
e C
ret-
Pale
ocen
e
L. J
uras
sic-
Ear
ly
Cre
tace
ous
Perm
o-C
arbo
nife
rous
Tabl
e 2.
1 G
ener
aliz
ed c
orre
latio
n of
Gon
dwan
an se
quen
ces o
f Nep
al H
imal
aya

26
2.3 DISTRIBUTION OF GONDWANAN BASINS IN PENINSULAR INDIA
The Carboniferous-Permian Gondwanan system occurs in a number of isolated
basins of peninsular India. Three large tracts have been identified (Wadia, 1919): (1) a
large linear tract in Bengal along the valley of the Damodar River, with sizeable
exposures in the Rajmahal Hills; (2) an extensive outcrop in Madhya Pradesh, which
follows the Mahanadi Valley; and (3) a series of more or less connected troughs forming
an elongated band along the Godavari River (Fig. 2.11).
The major Gondwanan basins in peninsular India are the Pranita Godavari Basin
(PGB), Mahanadi Basin (MB), Damodar Basin (DB), Son Basin (SB), Satpura Basin
(SPB), and Rajmahal Basin (RB). All these basins are aligned with three linear tracts of
India (Fig. 2.11).
The evolution of these basins is related to mountain building and other crustal
movements. Earlier crustal movements include the rejuvenation of the Aravalli and the
Eastern Ghat ranges, which caused the subsidence of large blocks between vertical or
slightly inclined normal faults (Wadia, 1919). However, normal faulting in extensional
lineaments between the cratonic blocks of India is also considered as the mechanism of
Gondwanan basin development in India (Dutta, 2002). Most of the Gondwanan basins are
half-graben basins bounded by a fault on one side. However, this mechanism does not
apply to all Gondwanan basins.

27
Figure 2.11 (A) Geological map of peninsular India (after Najman, 2005) and (B) distribution of Gondwanan basins in peninsular India (after Dutta, 2002)
A
B

28
The Gondwanan system of India is divided into three classic divisions-- the
Lower, Middle and Upper--corresponding in a general way to the Permian, Triassic, and
Jurassic of Europe, respectively (Wadia, 1919). These units have been further divided
into different formations. Lithological associations of the Gondwanan sequences that are
distinct are designated as facies. Veevers (1995) has provided a composite startigraphic
column for the Damodar Basin (DB) (Fig. 2.12)
Talchir Formation: The Talchir Formation refers to of the lowermost beds of
Gondwanan sequences that were first recognized in the Talchir district of Orissa,
southeast India. This series is quite homogenous and uniform in composition over
different basins and thus is considered as a valuable stratigraphic horizon. Boulder beds
characteristically contain glaciated, striated, and faceted blocks embedded in a fine
matrix, and, thus, suggest glacial action during the deposition. The formation is
approximately 300 m thick in the Damodar basin and is considered to have been derived
from a granitic source (Dutta, 2002)
Damuda Group: The Damuda Group is further divided into three formations: the
Raniganj, the Barren Measures, and Barkar formations.
Barakar Formation: The Barakar Formation rests conformably upon the Talchir
Formation and consists mostly of coarse-grained, white, massive sandstones and shales
with coal seams. The Barakar Formation contains a large quantity of coal in thick seams.
Sandstones of the Barakar Formation are more mature compared to the Talchir
Formation; sandstones are subarkosic, occasionally grading to quartz arenite (Dutta,
2002).

29
Figure 2.12 Stratigraphic column of Gondwanan sequences in the Damodar Basin (after Veveers and Tiwari, 1995).

30
Barren Measures: The Barren Measures is a thick sequence of carbonaceous
shales with concretions of impure iron carbonates and oxides. This unit varies in
thickness and composition among basins (Wadia, 1919). Towards the eastern part (in the
DB), shale is more predominant, while in the west sandstone is more common,
particularly in the PGB (Dutta, 2002).
Raniganj Formation: The Raniganj Formation consists of coal, carbonaceous
shale, siltstone, and sandstone. Coal seams of the Raniganj Formation are thinner than
those of the Barakar Fomation; sandstones, mostly arkosic and sub-arkosic, are finer than
the Barakar sandstones (Dutta, 2002). The thickness of this formation ranges from 700 m
to 900 m.
Panchet Formation: The Panchet Formation lies unconformably on the Raniganj
Formation, but in some places it directly overlies the Barakar Formation. The formation
contains alternations of red clay and coarse sandstone. However, greenish shale and
sandstone are abundant in the lower part of the formation, near the boundary with the
underlying Raniganj Formation (Dutta, 2002).
Mahadev Formation (Supra Panchet): The Mahadev Formation is well
developed in Madhya Pradesh where a section of approximately 1,300 m is exposed near
Nagpur. This formation contains of variegated, massive, coarse- to medium-grained
sandstones with ferruginous and micaceous clay. Sandstones are super-mature quartz
arenites with very little or no feldspar (Dutta, 2002). In the Damodar Basin, thick-bedded,
massive sandstones and shale beds of the Mahadev Formation are exposed. The thickness
of this formation is about 800 m at SB, but in some basins it just appears as a thin cover.
31
2.4 GONDWANAN STRATIGRAPHY OF OTHER PARTS OF EXTRA-
PENINSULAR INDIA AND PARTS OF GONDWANALANDS
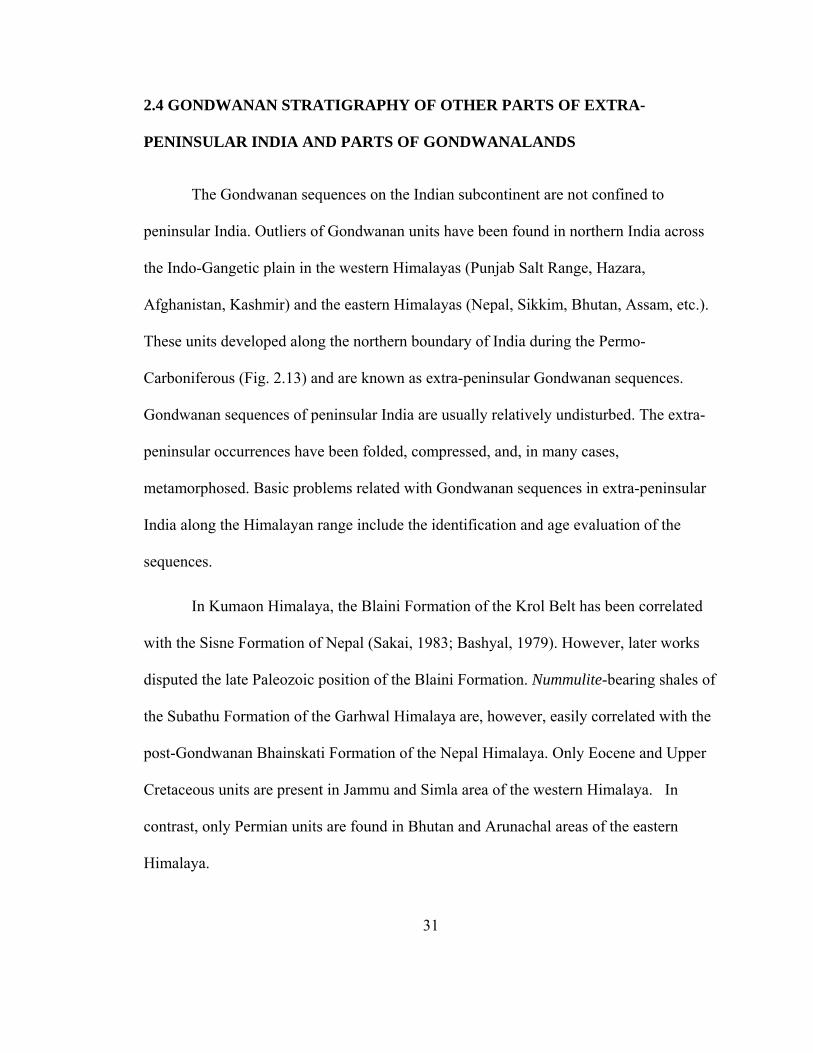
The Gondwanan sequences on the Indian subcontinent are not confined to
peninsular India. Outliers of Gondwanan units have been found in northern India across
the Indo-Gangetic plain in the western Himalayas (Punjab Salt Range, Hazara,
Afghanistan, Kashmir) and the eastern Himalayas (Nepal, Sikkim, Bhutan, Assam, etc.).
These units developed along the northern boundary of India during the Permo-
Carboniferous (Fig. 2.13) and are known as extra-peninsular Gondwanan sequences.
Gondwanan sequences of peninsular India are usually relatively undisturbed. The extra-
peninsular occurrences have been folded, compressed, and, in many cases,
metamorphosed. Basic problems related with Gondwanan sequences in extra-peninsular
India along the Himalayan range include the identification and age evaluation of the
sequences.
In Kumaon Himalaya, the Blaini Formation of the Krol Belt has been correlated
with the Sisne Formation of Nepal (Sakai, 1983; Bashyal, 1979). However, later works
disputed the late Paleozoic position of the Blaini Formation. Nummulite-bearing shales of
the Subathu Formation of the Garhwal Himalaya are, however, easily correlated with the
post-Gondwanan Bhainskati Formation of the Nepal Himalaya. Only Eocene and Upper
Cretaceous units are present in Jammu and Simla area of the western Himalaya. In
contrast, only Permian units are found in Bhutan and Arunachal areas of the eastern
Himalaya.

32
Permian Gondwanan units have been reported from the Khalaspur Basin. Here,
these are overlain by Miocene and younger deposits (Hossain et al., 2002). Gondwanan
sequences have been divided into six facies including coal lithofacies. However, unlike in
Nepal and India, marine successions have not been reported from this Bangladesh
Gondwanan basin in Bangladesh.
Figure 2.13 Distribution of Gondwanan basins on the Indian subcontinent (Frakes, 1975)

33
Fluvial conglomerates have been reported from this basin (Hossain et al., 2002).
However, Gondwanan sequences of this basin belongs to peninsular Indian Gondwanan
sequences based on paleo-tectonic reconstructions (Khan, 1994).
Figure 2.14 Main tectonic subdivision and relation of Indian Precambrian shield (after
Khan, 1994).

34
Based on gravity data, the eastward extension of Gondwanan basins extends up to
the Yilgarn craton of Western Australia (Fig. 2.14; Khan et al., 1994). This east-west
stretched basin is the northernmost Gondwanan sub-basin that was separated from
southern Gondwanan sub-basin by a northeast-southwest intra-cratonic high connecting
the Shillong Massif and the Chhotanagpur gneissic terrane. The southern Gondwanan
sub-basin was extended from Eastern Ghat palaeo-shelf to the western periphery of the
Shillong plateau through Ghatal- Behrampur.
Gondwanan basins were distributed on all continental blocks of Gondwanaland
including India, Australia, Antarctica, Africa, and South America. However, the
distributions of basins and facies were controlled by paleolatitude and topographic highs
(Fig. 2.15). Gondwanan sequences of peninsular India are usually correlated with the
Collie Basin of Australia and Karoo Basin of South Africa (Veevers, 2006)).
The Collie Basin lies within the Yilgarn craton and contains Permian coal-bearing
sequences (Veveers, 2006). The oldest unit of Collie Basin is the Stockton Formation,
which consists of sandstone, shale, and diamictite confirming a glaciogenic origin of
sediments. Three coal measures with varying thickness (Ewington, Premier, and Muja
Coal measures) overly the Stockton Formation (Veveers, 2006). These coal measures are
underlain by sandstones of the Cretaceous Nakina Formation.
The Karoo Basin of South Africa consists of several connected or isolated basins
that developed between the Carboniferous and Jurassic. The Karoo system in the south,
also known main Karoo system, includes the signature of a subduction environment. To
the west, the system reflects deposition associated with an extensional environment

35
(Catuneanu et al., 2005). The lowermost part of the Dwyka Formation consists of glacial
till. The overlying Volksrust Formation consists mostly of shale with sandstone. The
Estcourt, Belmont, Otterburn, Mol Teno, and Elliot formations contain varying amount of
sandstone and shale. The Estcourt Formation also contains several coal horizons. The
total thickness of the Karoo system at the Main Karoo Basin (South Africa) is 1100 m.
Figure 2.15 Distribution of Gondwanan basins in Gondwanaland in Early Permian (Veveers and Tiwari, 1995).

36
CHAPTER 3: EVOLUTION OF GONDWANAN BASINS
3.1 CONTINENTAL BREAK UP OF GONDWANALAND
The sedimentation cycle in the Purana Basin of peninsular India and its
equivalents, in the Lesser Himalaya was ended by early Cambrian time
contemporaneously with Pan-African mountain-building (Valdiya, 1997). However, due
to localized uplift, narrow fluvial depositional system developed in the Zanskar and
Hazara areas.
The break up of the Gondwanaland has been related with continental flood
volcanism that occurred since early Mesozoic (Segev, 2002). Several models have been
proposed to explain the mechanisms for the break up, but none of these are free from
controversy. However, the popular model involves lower mantle upwelling. The
Carboniferous Variscan (Hercynian) orogen has been related with the collision of several
Gondwanan plates and Laurasia during the final assembly of Pangaean supercontinent
and to post-convergent extension by crustal thinning, lowering of crustal viscosity,
formation of numerous sedimentary basins and widespread alkaline magmatism between
320- 240 ma (Segev, 2002). The load of accumulated sediments in these rifted basin
caused normal faulting that resulted in the famous half-graben Gondwanan basins.
The Gondwana supercontinent was bounded on its southern side until Early
Jurassic by an active subduction zone responsible for the fold belts of South Africa,

37
South America, and southwest Antarctica. During the Jurassic, the Karoo area was
uplifted and subsequent Karoo plume activity resulted in proto oceanic rifting between
East Gondwana (India, Antarctica, and Australia) and West Gondwana (Africa and South
America) (Segev, 2002).
Extensional movement between East Antarctica, India, and the western Australian
margin was reactivated during the Early Cretaceous. The break up between India and
Western Australia along the Cuvier and Gascyone Abyssal Plains started between 132-
130 Ma (Segev, 2002). During that period, a variety of igneous rocks were emplaced in
the northeast Indian graben along with seaward dipping flows forming the Rajmahal,
Bengal and Sylhet traps (Fig. 3.1 A). After break up and initial drifting, the space
between India and Antarctica was filled by Kerguelen plateau basalts. During the Upper
Cretaceous, the rifting between Madagascar and Seychelles-India occurred, along with
basaltic volcanism in Madagascar and Seychelles, and gabbroic intrusions in India.
The breakup between Seychelles and India was followed by rifting along the Goa,
Narmada-Son, which resulted in the extrusion of the Deccan Trap basalts between 70-61
Ma (Segev, 2002) (Fig. 3.1B).

38
Figure 3.1 Generalized reconstructions of (A) Early Cretaceous and (B) Tertiary Gondwanaland (from Segev, 2002)
3.2 EVOLUTION OF PASSIVE MARGIN ALONG THE NORTHERN
BOUNDARY OF PENINSULAR INDIA
The character of the northern margin of peninsular India prior to collision with
Tibet remains controversial. What was the total length of India subducted beneath Tibet?
In the various models and mechanism proposed, the length has been estimated to be as
little as a few kilometers and as high as 2800 km. The latter estimate involves the concept
of a ‘Greater India’. India was a part of Gondwanaland from the Precambrian to Jurassic,
A B

39
before it became isolated from Africa, Australia, and Antarctica. India remained a passive
margin during its northeast-directed movement from the Cretaceous to the Eocene when
it collided with Asia (Brookfield, 1993).
The Tibetian block was separated from India during the Permian, which resulted
in subsidence of the High Himalaya and deposition of a very thick sedimentary
succession on oceanic crust in the North Himalaya (Brookfield, 1993). Some still believe
that a proto-Himalayan range and Himalayan micro-continent existed between the Lesser
Himalaya and Tethys Himalayan zones between the Cambrian and late Paleozoic. Such a
high would have an important role as a sedimentary and faunal barrier between the basins
of both zones (Sakai, 1989) (Fig. 3.2). However, this hypothesis cannot be proved with
existing stratigraphic, sedimentological, and paleomagnetic field data. Rather, spatial and
environmental differentiation between the Lesser Himalayan and the Tethys Himalayan
basins with separation of about 5,000 km is proposed as the probable cause of different
sedimentary facies development in these two domains (Jain and Kunwar, 1970).
Generally, the classification of ‘extra-peninsular Gondwanan sequence’ is given
only to the sequences developed in the Lesser Himalayan terrains that have more or less
similar depositional environment and source rocks as peninsular Indian Gondwanan
sequences.

40
Figure 3.2 Schematic reconstruction of micro continent barrier supposed to have existed between the Lesser Himalayan and the Higher Himalayan terrains.
3.3 EVOLUTION OF FACIES AND CLIMATIC CONTROL DURING
DEPOSITION OF GONDWANAN SEQUENCES
Variation of paleoclimate was an important factor controlling sedimentation in
Gondwanan basins. The separations of eastern Gondwanaland from western
Gondwanaland, then separation of India from Australia and later from Madagascar were
accompanied by the northward movement of India. Hence, the distributions of lithologies
on these basins are related with paleolatitudes (Fig. 3.3) of the basins and ongoing
tectonic activity.
The composition of sand and clay minerals in shale, and the presence of coal in
these different facies was controlled by climatic conditions during deposition (Dutta,
2002).

41
Figure 3.3 Paleogeography of Gondwanaland (www.paleoportal.com, 2009).

42
Dutta (2002) inferred that initial embryonic basins started to receive glacial
deposits, when the Gondwanan basins were situated along southern high latitudes.
Afterwards, glacial outwash plains and glacial lakes gave rise to a meandering fluvial
system with well-defined channels and broad flood plains. The latter were filled with
coal, carbonaceous shale, gray shale and siltstone (Dutta, 2002) during the Permian when
the climate was humid. After sometime, climate became less humid and deposition of
coal was reduced; sand, carbonaceous shale, and gray shale-siltstone became more
abundant. However, coal-forming environments returned during the Late Permian, but
were not as extensive as earlier (Dutta, 2002). Although this facies formed mainly in
meandering fluvial systems, some marine signatures have been identified by some
workers, reflecting, periodic incursion of the sea (Valdiya, 1997) (Fig 3.4). During the
Triassic, coal-bearing facies were replaced by red-bed sequences (Dutta, 2002).
Alternating sequences of bright colored red shale and feldspar-rich sandstones beds
comprise the major thickness during this period. However, Triassic deposits are not
present in extra-peninsular Gondwanan sequences.
Subsequently, a major tectonic event caused the entire source area throughout
India to uplift due to rifting. This tectonic uplift was coupled with a change of climate
from arid to warm humid conditions. Climatic change resulted in deposition of super-
mature sediments, while tectonic uplift caused river systems to change from meandering
to braided (Dutta, 2002). The overall change caused deposition of coarse-grained
conglomerates, pebbly sandstones, and sandstones. These sediments covered the entire
landscape and overlapped on to older sediments and basement rocks (Dutta, 2002).

43
Extra-peninsular Gondwanan sequences were being deposited in meandering-
braided fluvial systems but also reflect periodic marine incursion. Few extra-peninsular
Gondwanan successions consist of volcanic clasts and volcanic flows that show the proof
of syn- or pre-depositional volcanic activities (Fig 21 B). During deposition of the Amile
Formation, which is dominated by sandstones, the environment was shallow marine. The
Eocene Bhanskati Formation not only shows the change in depositional environment
from marine to continental but also a change in provenance from cratonic India to the
Himalayan orogenic belt. Deposition of Gondwanan sequences in eastern and western
parts of Nepal was not synchronous; sequences are older towards the west (Bashyal,
1980).
Figure 3.4 Marine incursion in Gondwanaland during the Permian (Valdiya, 1998).
44
CHAPTER 4: SANDSTONE PETROGRAPHY
4.1 INTRODUCTION
Sandstone petrography is a classical method of provenance study. Sandstone
petrology is based on the assumption that sandstones from similar tectonic settings will
have similar composition. The ratios of major clastic components (e.g., quartz, feldspar,
and lithic fragments) from known tectonic settings have been plotted by several workers
to discrminate various provenance fields (Dickinson and Suczek, 1979; Ingersoll and
Suczek, 1979; Dickinson, 1985). Besides rock types in source areas, sediments are also
influenced by climate, relief, transporting agent, weathering and diagenesis. Hence,
sandstone composition can help to reconstruct paleogeography, paleotectonics, and
paleoclimate (Suttner, 1977; Ingersoll et al., 1984; Johnson, 1993).
Provenance studies based on mineralogical abundance are based on the
assumption that detrital composition has not been altered significantly by sedimentary
processes including, transportation, weathering, and diagenesis. However, tectonic
discrimination based on mineralogical analysis will not be that effective to trace
provenance if there is mixing detritus derived from different source areas (Velbel, 1985).
Multiple basin analytical techniques, including mineral chemistry, bulk-rock chemistry,
detrital thermochornology, and traditional modal analysis, are generally required to
identify the influence of multiple provenances or source terranes (Morton and
Hallsworth, 1999).

45
4.2 METHODS
A total of twenty-three sandstone samples were collected from three different
Gondwanan sequences of Nepal; the Tansen (western Nepal), Katari (eastern Nepal), and
Barahachettra (eastern Nepal) groups. After preparation in the rock cutting lab of
Department of Geology and Geography at Auburn University, samples were sent to
Spectrum Laboratories in Vancouver, WA for preparation of petrographic thin sections.
Half of each thin section was stained to assist in the identification of various feldspar
grains. Mineralogical compositions of the samples were determined by compositional
modal analysis following the Gazzi-Dickinson point-count convention which minimizes
the control of grain size on sand composition (Dickinson, 1970; Ingersoll et al., 1984). A
minimum of 300 framework grains were counted from each sample. Different end-
members were recalculated from the point-count data to plot different ternary diagrams
for the discrimination of tectonic setting (Dickinson, 1970; Dorsey, 1988; Uddin and
Lundberg, 1998). The following compositional parameters (Table 4.1) were calculated:
Qt = total quartz; Qm = monocrystalline quartzose grains; Qp = polycrystalline quartz
grains, including chert grains; F = total feldspar grains; P = plagioclase feldspar grains; K
= potassium feldspar grains; L = lithic fragments; Lt = total lithic fragments; Ls =
sedimentary lithic fragments; Lv = volcanic lithic fragments; Lm =metamorphic lithic
fragments.
Polycrystalline quartz is included at the Qt end member for QtFL plot to keep
plutonic polycrystalline quartz grains distinct from the metaquartzite fragments. All
quartzose grains are plotted at Qt end member for QtFL plots. This is intended to provide

46
emphasis to the stability of grains during various processes of sedimentary cycles
including weathering, transport, etc. In contrast, chert and polycrystalline quartz are
included in the Lt end-member on QmFLt plots. Details of the normalized modal
compositional calculations are given in Table 4.2 .
Table 4.1 Recalculated modal parameters of sand and sandstone.
Primary parameters (after Graham et al., 1976; Dickinson and Suczek, 1979; Dorsey, 1988; Uddin and Lundberg, 1998) Qt = Qm + Qp, where Qt = total quartzose grains Qm = monocrystalline quartz (> 0.625 mm) Qp = polycrystalline quartz (or chalcedony) Feldspar Grains (F = P + K), where F = total feldspar grains P = plagioclase feldspar grains K = potassium feldspar grains Unstable Lithic Fragments (Lt = Ls + Lv +Lm), where Lt = total unstable lithic fragments Lv = volcanic/metavolcanic lithic fragments Ls = sedimentary/metasedimentary lithic fragments
Lm1= very low- to low grade metamorphic lithic fragments Lm2= low-to intermediate grade metamorphic lithic fragments

47
4.2 PETROGRAPHY
The Gondwanan and post-Gondwanan sequences of the Lesser Himalaya in Nepal
are mostly continental and shallow marine deposits. The Gondwanan sequence was
deposited on an eroded surface of Precambrian basement of the Lesser Himalaya. Like in
all other peninsular and extra-peninsular Gondwanan sequences, Gondwanan stratigraphy
of Nepal begins with a diamictite bed except for the Barahachettra Group.
4.2.1 TANSEN GROUP
4.2.1.1 Sisne Formation
The Sisne Formation is composed of a thick pile of diamictite and rthymite beds.
However, there are few sandstone beds between the diamictites. Pale-green, medium-
grained Sisne sandstones are highly fractured and consist of numerous quartz veins. Four
sandstone samples were collected from the Sisne Formation: 16-3, 16-4, 16-5, and 16-6.
Sandstones of the Sisne Formation are composed mostly of quartz and feldspar.
The average modal composition of the Sisne sandstone is Qt56F42L2. Quartz grains are
rounded to angular. Plagioclase, K- feldspar, and perthite are abundant and variably
altered to clay minerals. A few low-medium grade metamorphic rock fragments are
observed in the samples. Mica flakes are also abundant. The Sisne sandstone also
contains common garnets (Fig. 4.1A), some of which are very well preserved.
The Sisne sandstones contain approximately 20% matrix, which consists of
organic-rich and calcareous clay. Clay matrix resulted from alteration of feldspars. The

48
distribution of the matrix is not uniform in the formation. Sutured framework grain
contacts are observed where matrix contents are low.
4.2.1.2 Taltung Formation
The Taltung Formation, which has been divided into two members, consists of
cyclic deposits of conglomerate, sandstone, and shale in the lower member and rhythmic
beds of sandstone and shale in the upper member (Sakai, 1983). The Aulis Basalt is also
included in the Taltung Formation. In the absence of good outcrop during fieldwork for
this study, only one sample (K-1) of sandstone from the lower member was collected
from this formation.
The Taltung Formation sandstone sample consists mostly of quartz, feldspars, and
volcanic fragments. The modal composition of the Taltung Formation is Qt32F36L32.
Monocrystalline quartz grains are subrounded to angular. A few grains of polycrystalline
quartz are also present. Feldspar grains are highly altered and replaced by calcite.
Volcanic fragments contain euhedral plagioclase crystals (Fig. 4.1B). Numerous irregular
grains of organic material are also present in the sample. Rare metamorphic rock
fragments variably altered to sericite are present in the thin section. The framework
grains have been cemented and locally replaced by sparry calcite.
The Aulis Basalt is associated with lower member of the Taltung Formation in the
Aulis area of Tansen. Sample 15-2 collected from that area shows the interstitial
groundmass of lath-shaped plagioclase microlites (Fig. 4-5B).

49
4.2.1.3 Amile Formation
The Amile Formation consists of alternating layers of shale and quartzose
sandstone. The middle part of the Amile Formation consists of calcareous beds, which
according to Sakai (1983), yield several types of marine fossils. Five samples 16-12, 16-
8, 16-9, 15-5 and 15-6 were collected from quartzose sandstone beds of the Amile
Formation. The modal composition of the Amile Formation is Qt100F0L0. Quartz grains
are mostly monocrystalline.
The matrix content of the samples is very low. Some of the samples with very low
matrix contents exhibit concavo-convex contacts between quartz grains (4.2 A), although
interstitial space is locally filled with clay minerals. Samples from the lower part of the
formation are cemented by hematite. Samples from the upper part of the formation
contain common carbonaceous materials. Some heavy minerals like zircon, tourmalines
are observed in all samples.
4.2.1.3 Bhainskati Formation
The Bhainskati Formation is dominated by black shale in the lower part with red
purple shales and hematite bands in the upper part. Few sandstones beds are present
within the upper part. One sample, 15-8 was collected from the Bhainskati Formation.
The Bhainskati sandstone is dark gray. The modal composition of the sandstone is
Qt63F13L24. Quartz grains are very angular to angular. Feldspar grains are highly altered
to clay minerals. Lithic fragments include high-grade metamorphic, low-grade
metamorphic and sedimentary lithic grains.

50
The sample is characterized by fair amount of clay minerals. However, concavo-
convex sutures between grains are also present locally (Fig. 4.2 B). Alteration of
feldspars grains to sericite was observed which is more prominent along grain
boundaries.
4.2.1.3 Dumri Formation
The Dumri Formation, the top most unit of the Tansen Group, is a thick series of
medium-grained, bluish gray quartzose sandstones interbedded with red and green shales.
As the objective of this work was initially focused on the Gondwanan sequences only one
sample (sample 16-1) was collected from the Dumri Formation from the Makhlo Dumri
area.
The Dumri sandstone (sample 16-1) is pale green. The modal composition of the
sample is Qt73F5L22. The sample consists of immature and various sized quartz grains.
Most of the polycrystalline quartz grains are angular and irregular, whereas most of the
monocrystalline grains are moderately- to well-rounded. The percentage of feldspar is
very low. The few feldspar grains observed are plagioclase grains that show various
degrees of alteration. Lithic fragments include low- to medium-grade metamorphic, chert,
and volcanic clasts (Fig. 4.3 A).
Clay matrix makes up more than 25% of the total composition of this sample. The
framework grains contacts vary from floating to sutured. Most of the framework grains
show alteration along the grain boundaries.
51
4.2.2 KATARI GROUP
The entire Katari Group is considered to be a Permo-Carboniferous unit. It
consists of diamictites, volcanic rocks, and quartzites. In the Katari Group, three types of
quartzites are found in outcrops; white, carbonaceous, and calcareous. White quartzites
are dominant in the lower part of the section, while carbonaceous and calcareous
quartzites are dominant in the upper part. White quartzites are highly fractured,
weathered and altered. As such, fresh sample collection was not possible from this unit.
Two samples, 26-6 and 26-8, of carbonaceous-calcareous quartzites were collected from
the Maruwa Khola section.
The average composition of the Katari Group sandstones is Qt100F0L0, Samples
contain ~ 65% monocrystalline grains. The sample consists of various sized quartz
grains. Some of the grains are deformed following particular direction of deformation
indicating post depositional deformation into polycrystalline quartz. However, some of
them are not significantly distorted and preserve their rounded shapes (Fig. 4.3 B). Some
of the quartz grains are altered along boundaries and fractures.
Matrix materials consist of mica and calcite in roughly equal abundance (~15%).
Calcite is also present as the cement.

52
4.2.2 BARAHACHETTRA GROUP
The Barahachettra Group consists of diamictites, quartzites, calcareous
sandstones, and volcanic tuffs. All these units were previously considered to have been
deposited during the same geological age (Permo-Carboniferous). However, Dhital
(1992) has proposed that the Group includes two temporally distinct formations; the
Permo-Carboniferous Saptakoshi Formation and the Cretaceous Tamrang Formation.
4.2.2.1 Saptakoshi Formation
The Saptakoshi Formation consists of quartzites, diamictites, and volcanic
materials. Four samples were collected from the Saptakoshi Formation; samples 22-7
(volcanic tuff) and 22-9 were collected along the Kokaha Khola, and samples 23-5 and
23-7 were taken along the Saptakoshi River. Sample 23-5 collected from sandstone
interbed between diamictites, differs significantly from samples 23-7 and 22-9 which are
mostly quartzites.
Sample 23-5 has the modal composition of Qt60F37L2, with abundant various sized
quartz clasts. Quartz grains are rounded to angular in shape. Plagioclase and potassium
feldspars are abundant and are variably altered to clay minerals (4.4 A). A few chert
grains were observed in the sample. Micas are also common. This sandstone is similar in
composition to the Sisne sandstone of the Tansen Group of the western Nepal. Not only
are feldspar contents high, but sample also contains common garnets as seen in the Sisne
Formation.

53
Samples 22-9 and 22-7 have an average modal composition of Qt100F00L00. Sixty
five percentage of the quartz is monocrystalline. The quartz grains are deformed along
particular direction indicating post depositional deformation (4.4 B). Matrix present in
the samples is composed of micritic calcite and mica.
4.2.2.1 Tamrang Formation
The Tamrang Formation consists mostly of calcareous sandstones. Seven samples
were collected from the Tamrang Formation along the Saptakoshi River (23-2, 23-3, 23-
4) and along the Kokaha Khola (22-4, 22-5, 22-6). The modal composition of the
Tamrang Sandstone is Qt61F29L19. Tamrang sandstone consists of various sized and
immature quartz grains. Feldspars are slightly smaller than quartz and are highly altered.
The samples consist of various types of lithic fragments, including metamorphic (various
grades) and sedimentary (chert and dolomite).
The matrix observed present in the samples are of two types; calcite and mica.
The percentage of mica is higher in samples 22-4, 22-5, 23-2, and 23-3. However, in the
samples 22-6 and 23-4, the proportion of micritic calcite matrix is higher. The framework
grain contacts vary from concavo-convex to floating (4.5 A).

54
(A)
(B)
Figure 4.1 Representative photomicrographs of Gondwanan sandstones, western Nepal. (A) Sisne Formation; (B)Taltung Formation (Qp = polycrystalline quartz, Qm = monocrystalline quartz, Plag = plagioclase, K-spar = potassium feldspar, Grt= garnet, Lm1= low-grade metamorphic lithics, Lm2= low- to intermediate-grade metamorphic lithics, Ls = sedimentary lithic fragments, Lv = volcanic fragments, Cal = Calcite).

55
(A)
(B)
Figure 4.2 Representative photomicrographs of Gondwanan sandstones, western Nepal. (A) Amile Formation; (B) Bhainskati Formation (Qp = polycrystalline quartz, Qm = monocrystalline quartz, Plag = plagioclase, K-spar = potassium feldspar, Ls = sedimentary lithic fragments, Lm2 = high-grade metamorphic fragments, Lm1= low-grade metamorphic fragments).

56
(A)
(B)
Figure 4.3 Representative photomicrographs of Gondwanan sandstones, (A) Dumri Formation, western Nepal. (B) Katari Group, eastern Nepal (Qp = polycrystalline quartz, Qm = monocrystalline quartz, Plag = plagioclase, K-spar = potassium feldspar, Ls = sedimentary lithic fragments, Lm2 = low- to intermediate-grade metamorphic fragments, Lm1= very low- to low-grade metamorphic fragments).

57
(A)
(B)
Figure 4.4 Representative photomicrographs of the Gondwanan sandstones, (A) Saptakoshi Formation, eastern Nepal, sample 23-5; (B) Saptakoshi Formation, eastern Nepal, sample 22-7 (Qp = polycrystalline quartz, Qm = monocrystalline quartz, Plag = plagioclase, K-spar = potassium feldspar, Ls = sedimentary lithic fragments, Lm2 = low- to intermediate-grade metamorphic fragments, Lm1= very low- to low-grade metamorphic fragments).

58
(A)
(B)
Figure 4.5 (A) Representative photomicrograph of the Tamrang sandstone, eastern Nepal (Qp = polycrystalline quartz, Qm = monocrystalline quartz, Plag = plagioclase, K-spar = potassium feldspar, Ms = muscovites, Lm2 = low- to intermediate grade metamorphic fragments, Lm1= very low- to low-grade metamorphic fragments); (B) Photomicrograph of Aulis Basalt (Tansen, western Nepal) with abundant plagioclase laths.

59
Table 4.2 Normalized modal compositions of Gondwanan sandstones in Nepal
Qt F L Qm F Lt Qm P K Ls Lv Lm Rock Unit/Sample No. Dumri Fm 16-1 73 5 22 65 5 30 92 6 2 27 0 73 Bhainskati Formation 15-8 63 13 24 38 13 49 74 21 5 15 7 78 Amile Quartzite 16-12 100 0 0 76 0 24 100 0 0 0 0 0 16-8 100 0 0 58 0 42 100 0 0 0 0 0 16-9 100 0 0 70 0 30 100 0 0 0 0 0 15-5 100 0 0 40 0 60 100 0 0 0 0 0 15-6 100 0 0 48 0 52 100 0 0 0 0 0 Mean 100 0 0 58 0 42 100 0 0 0 0 0 Standard Deviation 0 0 0 15 0 15 0 0 0 0 0 0 Taltung Fm K-1 32 36 32 15 26 59 15 37 48 43 40 17 Sisne Fm 16-3 57 43 0 27 43 30 39 30 31 0 0 0 16-4 52 45 3 33 45 22 42 27 31 0 0 100 16-5 56 41 3 30 41 29 42 27 31 0 0 100 16-6 60 40 0 27 40 33 40 28 22 0 0 0 Mean 56 42 2 29 42 29 41 28 29 0 0 50 Standard Deviation 3 2 2 3 2 5 2 1 5 0 0 58 Katari Group 26-6 100 0 0 68 0 32 100 0 0 0 0 0 26-8 100 0 0 62 0 38 100 0 0 0 0 0 Mean 100 0 0 65 0 35 100 0 0 0 0 0 Standard Deviation 0 0 0 4 0 4 0 0 0 0 0 0 Tamrang Formation 22-4 57 16 27 27 16 57 63 9 28 0 0 100 22-5 58 20 22 27 20 53 57 17 26 13 0 87 22-6 66 18 18 31 18 51 53 10 37 0 0 100 23-2 63 27 8 29 27 42 51 5 46 0 0 100 23-4 59 19 22 33 19 48 64 13 23 0 0 100 22-10 60 19 21 22 19 59 46 15 39 14 0 86 22-6 66 18 18 31 18 51 53 10 37 0 0 100 Mean 61 20 19 29 20 52 55 11 34 4 0 96 Standard Deviation 4 4 6 4 4 6 6 4 8 7 0 7 Saptakoshi Formation 23-5 60 37 3 22 37 41 37 32 31 0 0 3 Saptakoshi Formation (Quartzite) 23-7 100 0 0 63 0 37 100 0 0 0 0 0 22-9 100 0 0 67 0 33 100 0 0 0 0 0 Mean 100 0 0 65 0 35 100 0 0 0 0 0 Standard Deviation 0 0 0 2.8 0 2.8 0 0 0 0 0 0

60
4.2 SANDSTONE MODES
A vertical profile is constructed to show the distribution of major framework
grains used for modal analysis (Fig. 4.6). The Tansen Group (western Nepal) shows that
the percentage of feldspar is relatively higher in the Permo-Carboniferous Sisne
Formation than the younger units. The percentage of lithic fragments is higher in the
Jurassic-Cretaceous Taltung Formation, Eocene Bhainskati Formation and early Miocene
Dumri Formation. In the Cretaceous-Paleocene Amile Formation Quartz percentages are
higher than other units.
The percentage of quartz in the Permo-Carboniferous Katari Group is higher than
the Tansen Group of western Nepal. Further east, in the Barahachettra area, the quartz
dominated during the initial phases of Permo-Carboniferous deposition. However, lithic
fragments became more significant in the upper sections. The percentage of lithic
fragments increases in the Tamrang Formation than in the underlying Barahachettra
Formation.

61
Figu
re 4
.6 V
aria
tion
of m
odal
min
eral
ogic
al c
ompo
sitio
n of
the
Gon
dwan
an sa
ndst
ones
of N
epal
.

62
4.2 PETROFACIES EVOLUTION Tectonic discrimination plots of Gondwanan sandstone from the three different
sections of Nepal were prepared on the basis of modal compositional analyses of
sandstone framework grains. Tectonic discrimination plots of Gondwanan sandstones
from three different sections of Nepal were prepared based on modal compositional
analysis of sandstone framework grains. The QtFL plot (Fig. 4.7) shows that the Sisne
Formation sandstones are intermediate between “basement uplift” and “transitional
continental” deposits. All diamictites of the Permo-Carboniferous in peninsular India
were deposited in half-graben basins along major lineaments (Veevers and Tiwari, 1995).
The high percentage of feldspars and low amount of lithic fragments (Qt56F42L2) reflect
that tectonic setting. Moreover, another controlling factor during the Permo-
Carboniferous was climate; the area was situated at high southern latitude which inhibited
intensive weathering. As the central part of the India was blocked by the Satpura-
Bundhelkhand-Aravali mountain series (Naqvi, 2005), the northern part of peninsular
India, which could have changed gradually from continental to shallow marine
environments, was receiving sediments from the orogenic belts. However, in the QmFLt
diagram, the Sisne Formation plots in the “dissected arc” due to concentration of
monocrystalline quartz (Fig. 4.8). Plagioclase contents are almost equal to potassic
feldspars (Fig. 4.9). Most point-count data plots at the Lm end of Ls-Lm-Lv triangular
diagram (Fig. 4.10).
The Taltung Formation, with a modal composition of Qt32F36L32, plots in
“dissected arc” field (Fig. 4.7). The Taltung Formation consists mostly of continental

63
deposits and contains common volcanic fragments associated with the rifting of Australia
from India and associated volcanic eruption (Sakai, 1989). The Taltung sandstones are
dominated by volcanic and sedimentary fragments. They contain very few metamorphic
lithic fragments. On the QmFLt plot, these sandstones fall in “transitional arc” field.
During deposition of the Amile Formation (Late Cretaceous to Paleocene), the sea
level was falling globally (Vail, 1977) probably resulting in land barriers for sediment
transport from source areas to the basins. Moreover, at that time India was characterized
by humid and tropical climate in which intensive chemical weathering may have
produced mature sands. The Amile Formation with modal composition of Qt100F0L0 is a
“craton interior” deposit (Fig. 4.7). However, presence of polycrystalline quartz pulls the
Amile Formation down to the “Quartzose recycled” provenance field at the QmFLt plot
(Fig. 4.8).
The Bhainskati Formation has higher lithic fragments than the underlying Amile
Formation. The QtFL modal composition of the formation is Qt63F13L24. Bhainskati
deposition took place during the Eocene when India began colliding with Tibet (Sakai,
1983). DeCelles et al. (1998) suggested a back bulge setting for deposition of the
Bhainskati Formation. The source rock for the sediment could be the Indian craton and
also the Higher Himalaya and Tibetan Tethys sediments. The Bhainskati Formation has
very low feldspar contents and plots in the “recycled orogenic” provenance field in the
QtFL diagram (Fig. 4.7). But it falls in “transitional recycled” field on the QmFLt plot
(Fig. 4.8).

64
The Dumri Formation, which has even higher lithic fragment contents than the
Bhainskati Formation falls, in the “recycled orogenic” provenance field on the QtFL plot
and in “the quartzose recycled” field on the QmFLt plot (Fig. 4.8). The modal
composition of the Dumri Sandstone is Qt73F5L22. As the Indian continent already had
collided with Tibet before deposition of the Dumri Formation, the source terranes shifted
from cratonic India to the Himalayan orogenic belt. The Higher Himalaya could have
provided high-grade metamorphic fragments, while the Lesser Himalaya could be the
source areas for the low-grade metamorphic and sedimentary grains.
The modal composition of the Permo-Carboniferous unit of the Katari Group is
Qt100F0L0, which fall in the “cratonic interior” provenance field on the QtFL plot (Fig.
4.8) and “quartzose recycled” field in the QmFLt plot (Fig. 4.9). However, it is unlikely
to get major change in climatic conditions during same geological time interval between
the depositional basins of the Tansen Group and the Katari groups, as both were part of
the northern passive margin of the Indian peninsula aligned almost in the same latitude.
Further east, the Barahachettra section shows more problems to validate the
present stratigraphy based on paleogeographic position of the Indian peninsula and
stratigraphy of other contemporaneous Gondwanan units deposited in similar tectono-
climatic domain (Tansen Group). The change in composition from Qt60F37L2 for
sandstone of the Saptakoshi Formation to Qt100F00L00 of Saptakoshi quartzite and
Qt61F29L19 of the Tamrang Formation is unlikely to have occurred within Permo-
Carboniferous when Gondwanaland was situated in southern high latitudes. The QtFl plot
of the Tamrang Formation indicates a similarity to the Eocene Bhainskati Formation (Fig.

65
4.8). The Saptakoshi quartz arenite shows affinity to the late Cretaceous-early Paleocene
Amile Formation and the Saptakoshi arkosic sandstone shows alikeness to the Permo-
Carboniferous Sisne sandstone.
Figure 4.7 QtFL plot of Gondwanan sandstones of Nepal showing mean and standard deviation polygons (provenance fields are taken from Dickinson, 1985).

66
Figure 4.8 QmFLt plot of Gondwanan sandstone of Nepal showing mean and standard deviation polygons (provenance fields are taken from Dickinson, 1985).
Figure 4.9 QmPK plot of the Gondwanan sandstones of Nepal showing mean and standard deviation polygons.

67
Figure 4.10 LsLvLm plot of the Gondwanan sandstones of Nepal showing mean and standard deviation polygons.
68
CHAPTER 5: HEAVY MINERAL ANALYSIS
5.1 INTRODUCTION
Detrital heavy minerals are powerful indicators of provenance. Analysis of heavy
minerals from sediments can provide important information on provenance and help to
discriminate distinct source rocks even within same tectonic unit (Morton, 1985; Najman
and Garzanti, 2000; Garzanti et al., 2007). As wide ranges of heavy minerals are
available in sandstones and the effects of sedimentation processes on heavy minerals
have been comprehensively evaluated, high resolution provenance study is feasible with
the analysis of heavy mineral assemblages (Uddin and Lundberg, 1998b; Morton and
Hallsworth, 1999). Heavy minerals, which have a specific gravity of 2.9 or more, are
usually present in sandstones in proportions of less than 1% (Tucker, 1988). More than
30 translucent heavy minerals are suggested as indicator of characteristics source terranes
(Morton, 1985; Mange and Maurer, 1992).
Heavy mineral assemblages reflect the petrology of the source area, particularly in
the case of proximal synorogenic sediments that have been transported relatively for short
distances. However, various sedimentary processes operating from the source rock area
to depositional basin can remarkably overprint the original assemblages of heavy
minerals. These processes include weathering of the source rock, alluvial storage,
mechanical breakdown and hydraulic processing during transport, and diagenesis during
burial (Morton and Hallsworth, 1994; 1999). The stability of some key heavy minerals
for major sedimentary processes is given in Table 5.1. Morton and Hallsworth (1999)

69
proposed that the effects of overprinting of these sedimentary processes can be overcome
by relative abundances of minerals with similar hydraulic and diagenetic behaviors.
Table 5.1 Relative stability of heavy minerals for different sedimentary processes
Stability in weathering profiles (source rocks) (Grimm, 1973; Bateman & Catt, 1985; Dryden & Dryden, 1946) #
Mechanical stability during transport (Freise, 1931) #
Burial persistence North Sea (Morton. 1984, 1986)
Chemical weathering (Pettijohn, 1941)
Zircon, Rutile Tourmaline, Andalusite, Kyanite, Staurolite Epidote* Garnet Calcic Amphibole** Clinopyroxene Orthopyroxene Apatite
Tourmaline Corundum Chrome-spinel Spinel Rutile Staurolite Augite Topaz Garnet Epidote Apatite Zircon Kyanite Olivine Andalusite Diopside Monazite
Apatite, Monazite, Spinel, TiO2 minerals, Tourmaline, Zircon Chloritoid Garnet Staurolete Kyanite Titanite Epidote Calcic Amphibole Andalusite, Silimanite Pyroxene Olivine
TiO2 minerals Zircon Tourmaline Sillimanite Andalusite Kyanite Staurolite Topaz Titanite Monazite Garnet Epidote Calcic amphibole Orthopyroxene Clinopyroxene Olivine Apatite
[Stability of mineral increases towards the top part of the table; *Epidote has lower ranking than garnet and **Calcic Amphibole has lower ranking than clino- and ortho-pyroxene for eolian cover deposits in Bateman and Catt (1985)’s work; # doesn’t include the opaque minerals]
Heavy mineral analysis has been used for in several provenance studies of
peninsular India and also the adjoining Himalayan domain. The study of heavy mineral
suites in the Barakar sandstone (Gondwanan sequence) of the Moher sub-basin in

70
peninsular India was done by Aslam et al. (1991). The method has been applied to paleo-
tectonic and provenance studies of Himalayan foreland sequences (Chaudhri, 1972; Sinha
and Sastri, 1973; Cerveny et al., 1989, Uddin and Lundberg, 1998a; Najman and
Garzanti, 2000; Uddin et al., 2007) and on deep-sea cores from the Bengal fan
(Yokoyama et al., 1990; Amano and Taira, 1992). These studies have been proved
powerful in evaulating the nature of source rocks, in reconstructing the course of
ancestral fluvial systems, and in establishing associations of source rocks to the unroofing
of the Himalayas and Indo-Burman Ranges.
Further advances in heavy mineral analysis has led to the method of varietal
studies that concentrates on relative abundances of minerals that are stable during
diagenesis and have similar hydraulic behavior (Morton and Hallsworth, 1994). The
hydraulic parameter is controlled by grain size, density, and shape. Morton and
Hallsworth (1994) formulated several mineral ratios, pairs and indexes of heavy minerals
comprising similar hydraulic behavior (e.g. index ATi with mineral pair apatite and
tourmaline, GZi with mineral pair Garnet and Zircon, CZi with mineral pair chrome
spinel and zircon). However, these methods are only applicable to the sedimentary rocks
containing abundant heavy minerals.
In the absence of a full range of heavy minerals, study can be accomplished by
determining the relative abundance of all important heavy mineral species preserved in
each stratigraphic unit, recognizing dominant members of mineral groups, identifying the
first key minerals indicative of certain levels of metamorphism, evaluating associations or

71
paragenesis of specific heavy minerals, and establishing index minerals from
stratigraphic levels in selected sections (Rahman, 2008).
5.2 METHODS
Due to similar hydraulic behaviors, heavy minerals remain in certain grain-size
fractions. Samples were disintegrated by drying in an oven and then sieving to extract 0-
4 phi the size fractions. The samples were then treated with high-density liquids to
separate the heavy minerals. As there is sharp difference in the density of heavy minerals
with regular framework minerals, the heavy fraction gets settled first due to gravity. The
liquid used for heavy mineral separation in this study was tetrabromoethane (C2B2Br4,
density 2.89-2.96 gm/cc). The samples were weighed and added to the heavy liquid in a
separating funnel. The mixture was stirred three times to ensure that the grains were
thoroughly wetted and not coagulated. As time passed, the heavy minerals settled down
to the bottom of the funnel and the lighter fractions appeared floating above the heavy
liquid at the top of the separating funnel. After 24 hours, the stopcock was opened slowly
and the liquid bearing the heavy mineral fraction in the bottom part of the separating was
allowed to flow slowly through a filter paper. The separated heavy fractions were washed
carefully with acetone and dried in the open air and oven for 2 hours. The lighter fraction
of the samples were also cleaned with acetone, dried, and stored. The heavy mineral
fractions of samples were weighed and processed for magnetic separation. Magnetic
separation of heavy minerals was carried out using a Frantz magnetometer at the
Department of Geology and Geography at Auburn University. Four fractions of different
magnetic susceptibility (Hess, 1966) were separated, including Group-1: Strongly

72
Magnetic (SM); Group-2: Moderately Magnetic (MM); Group-3: Weakly Magnetic
(WM); and Group-4: Poorly Magnetic (PM). The separation of four groups of mineral
was done by applying different slide slope angle and current values in the magnetic
separator (Table 5.2).
Table 5.2 Four fractions of different magnetic susceptibility (Hess, 1966)
Side slope 15o Side slope 5o Strongly magnetic Moderately magnetic Weakly
magnetic Poorly magnetic
Hand magnet 0.4 Amps 0.8 Amps 1.2 Amps 1.2 Amps
Magnetite Pyrrhotite
Fe-oxides
Illmenite Garnet Olivine
Chromite Chloritoid
Hornblende Hypersthene
Augite Actinolite Staurolite Epidote Biotite
Chlorite Tourmaline
(dark)
Diopside Tremolite Enstatite Spinel
Staurolite (light)
Muscovite Zoisite
Clinozoisite Tourmaline
(light)
Sphene Leucozxene
Apatite Andalusite Monazonite
Xenotine
Zircon Rutile
Anatase Brookite
Pyrite Corundum
Topaz Fluorite Kyanite
Silimanite Anhydrite
Beryl Group 1 Group 2A Group 2B Group 3 Group 4
Group-1 consists of strongly magnetic minerals including magnetite, pyrrhotite
and Fe-oxides. However, this group was not separated using a hand magnet. Rather, it
was separated along with Group 2A minerals including illmenite, garnet, olivine,
chromite and chloritoid using a 15o side slope and a 0.4-Amp current.
Group 2B minerals include of hornblende, hypersthene, augite, actinolite,
staurolite, epidote, biotite, chlorite, and tourmaline. These were separated from weakly to
poorly magnetic minerals using a 0.8-Amp current and a 15º side slope. Group 3

73
minerals, including diopside, tremolite, enstatite, spinel, staurolite (light), muscovite,
zoisite, clinozoisite, and tourmaline (light), were separated from Group 4 using a 1.2-
Amp current and a 15º side slope. The rest of the heavy minerals were classified as Group
4 (poorly magnetic) which was not separated further due to presence in small amount.
This group includes slightly magnetic minerals, such as sphene, leucoxene, apatite,
andalusite, monazite, and xenotine, and other non-magnetic minerals like zircon, rutile,
pyrite, corundum, fluorite, kyanite, sillimanite and beryl. However, separation of heavy
minerals belonging to all four groups was not achieved for each sample due to the
absence or rarity of minerals from certain groups.
Separated heavy minerals were sent to Spectrum Laboratories in Vancouver, WA
to prepare polished thin sections. Fourteen polished thin sections were prepared from
fourteen samples. Each of the magnetically separated heavy mineral fractions were
segregated in different areas (holes) of each thin section. Identification of minerals was
carried out using a petrographic microscope and a modified Fleet method (Fleet, 1926).
Numbers of grains from each holes were counted and then added together to calculate the
percentage of different species of heavy minerals.

74
5.3 RESULTS
Heavy mineral assemblages of Gondwanan sandstones of Nepal are not very
diverse. Only four to five minerals specimens dominate in all samples (Tables 5.3 and
5.4).
Heavy mineral suites in the Permo-Carboniferous Sisne sandstones (samples 16-3
and 16-5) differ markedly those of younger units (the Taltung and Amile formations of
the Tansen Group). Highly stable minerals (ZTR) are present in very small numbers, and
moderately stable garnets are abundant (Table 5.3) (Fig. 5.3). The abundance of opaque
minerals is less than in overlying other units. A possible explanation for this major
difference in heavy mineral assemblage is due to change of provenance in younger units.
The garnets are irregular in shape and highly fractured (Fig. 5.3). Some of the grains also
show corroded surfaces. These surface features suggest a burial dissolution for the Sisne
heavy minerals letting only garnets to survive among all heavies contributed by source
rocks.
The heavy mineral assemblage of Cretaceous-Jurassic Taltung sandstone (sample
K-1) mostly consists of zircon, chrome-spinel, rutile, tourmaline, garnet, and dolomite as
well as common opaque minerals (Table 5.3). Tourmaline grains are highly fractured and
also show the effects of corrosion (Fig. 5.2). Chrome-spinel grains are in variable sizes
and shapes. Garnets are rare and are irregular in shape. Abundant opaque grains present
in this sample could have contributed from source rocks or formed as authigenic iron-
oxide coating is the basin.

75
The Paleocene-Cretaceous Amile Formation of the Tansen Group in western
Nepal is dominated by tourmaline, zircon and rutile, as well as opaque grains. Three
samples from the Amile Formation were subjected to heavy mineral analysis (samples
15-6, 16-8, and 16-9) (Table 5.3).
Figure 5.1 Representative photomicrograph of tourmalines in Amile sandstone (sample 15-6) of the Tansen Group, western Nepal.
Tourmaline grains are easy to identify with their strong pleochroism and low
relief. Tourmalines from the Amile Formation are highly fractured (both primary and
secondary fractures are present). The shape and size of the grains are variable (Fig. 5.1).
Some of the grains are corroded. The zircon crystals are rounded and a little smaller than
the tourmalines. The rutile grains are deep red and rounded. The presence of numerous

76
opaque minerals could have contributed from authigenic coating of iron oxides on
mineral grains as well as a contribution from source rocks.
Figure 5.2 Representative photomicrograph of heavy mineral assemblage in the Taltung sandstone (sample K-1) of the Tansen Group, western Nepal (Cr- Chromium, Rt-Rutile, Tr-Tourmaline).
The Permo-Carboniferous Katari Group in eastern Nepal also shows variations in
heavy mineral assemblage. Besides common heavy minerals present in other Gondwanan
samples, this unit also contains biotite and chlorite/chloritoid (Table 5.4). The garnet
grains are more irregular in shape than the zircons which are mostly rounded. As
expected based on hydraulic equivalence, biotite and chlorite grains are larger than other
types of heavy minerals (Morton and Hallsworth, 1999). However, the mica grains are
deformed and folded (Figs. 5.4 and 5.5). This likely is related to some kind of

77
deformation in the source rocks rather than in the depositional basin as petrographic
analyses of the thin section of this sample does not reflect post depositional deformation.
The Saptakoshi and Tamrang formations of the Barahachettra Group, another
Permo-Carboniferous unit in eastern Nepal, show quite different heavy mineral
assemblages. However, these assemblages are correlatable with assemblages of some
units of the Tansen Group, albeit of different age.
The Tamrang sandstones (samples 22-6, 22-10, 23-4) from eastern Nepal are
primarily dominated by highly stable minerals like zircon, tourmaline and rutile (Table
5.4) (Fig. 5.6) as well as opaque grains. However, the Tamrang Formation also contains
common micas and a large number of unidentified heavy minerals.
The Saptakoshi sandstone (sample 23-5) contains few highly stable heavy
minerals (i.e. zircon, rutile and tourmaline) but large numbers of less stable garnets
(Table 5.4). This dominant assemblage of garnets in the Saptakoshi sandstone is similar
to that of the Sisne sandstone of western Nepal. However, the sizes of garnets are smaller
than that in the Sisne Formation. The Saptakoshi sandstones contain fewer opaque grains
than the Sisne Formation.

78
Figure 5.3 Representative photomicrograph of heavy mineral assemblage in the Sisne sandstone (sample 16-3) of the Tansen Group, western Nepal, showing abundance of garnets.
Figure 5.4 Representative photomicrograph of heavy mineral assemblage in the Permo-Carboniferous sandstone (sample 26-8) of the Katari Group, eastern Nepal. (Bt—Biotite; Chl- Chlorite; Gt—Garnet).
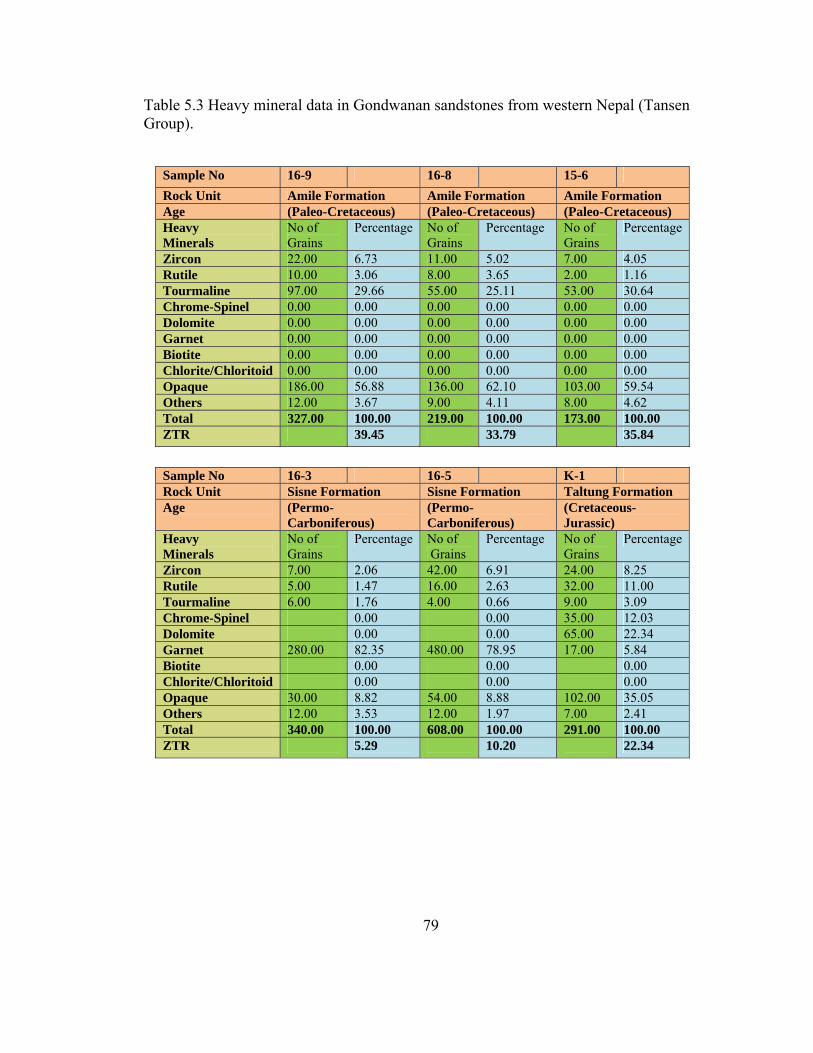
79
Table 5.3 Heavy mineral data in Gondwanan sandstones from western Nepal (Tansen Group).
Sample No 16-9 16-8 15-6 Rock Unit Amile Formation Amile Formation Amile Formation Age (Paleo-Cretaceous) (Paleo-Cretaceous) (Paleo-Cretaceous) Heavy Minerals
No of Grains
Percentage No of Grains
Percentage No of Grains
Percentage
Zircon 22.00 6.73 11.00 5.02 7.00 4.05 Rutile 10.00 3.06 8.00 3.65 2.00 1.16 Tourmaline 97.00 29.66 55.00 25.11 53.00 30.64 Chrome-Spinel 0.00 0.00 0.00 0.00 0.00 0.00 Dolomite 0.00 0.00 0.00 0.00 0.00 0.00 Garnet 0.00 0.00 0.00 0.00 0.00 0.00 Biotite 0.00 0.00 0.00 0.00 0.00 0.00 Chlorite/Chloritoid 0.00 0.00 0.00 0.00 0.00 0.00 Opaque 186.00 56.88 136.00 62.10 103.00 59.54 Others 12.00 3.67 9.00 4.11 8.00 4.62 Total 327.00 100.00 219.00 100.00 173.00 100.00 ZTR 39.45 33.79 35.84 Sample No 16-3 16-5 K-1 Rock Unit Sisne Formation Sisne Formation Taltung Formation Age (Permo-
Carboniferous) (Permo-Carboniferous)
(Cretaceous-Jurassic)
Heavy Minerals
No of Grains
Percentage No of Grains
Percentage No of Grains
Percentage
Zircon 7.00 2.06 42.00 6.91 24.00 8.25 Rutile 5.00 1.47 16.00 2.63 32.00 11.00 Tourmaline 6.00 1.76 4.00 0.66 9.00 3.09 Chrome-Spinel 0.00 0.00 35.00 12.03 Dolomite 0.00 0.00 65.00 22.34 Garnet 280.00 82.35 480.00 78.95 17.00 5.84 Biotite 0.00 0.00 0.00 Chlorite/Chloritoid 0.00 0.00 0.00 Opaque 30.00 8.82 54.00 8.88 102.00 35.05 Others 12.00 3.53 12.00 1.97 7.00 2.41 Total 340.00 100.00 608.00 100.00 291.00 100.00 ZTR 5.29 10.20 22.34

80
Table 5.4 Heavy mineral distribution in Gondwanan sandstones from eastern Nepal
(Barahachettra and Katari groups).
Sample No 26-8 23-5 22-6 Rock Unit Katari Group Saptakoshi
Formation Tamrang Formation
Age (Permo-Carboniferous)
(Permo-Carboniferous)
(Permo-Carboniferous)
Heavy Minerals No of Grains
Percentage No of Grains
Percentage No of Grains
Percentage
Zircon 12.00 4.63 5.00 2.38 33.00 7.91 Rutile 12.00 4.63 2.00 0.95 43.00 10.31 Tourmaline 15.00 5.79 3.00 1.43 90.00 21.58 Chrome-Spinel 0.00 0.00 0.00 Dolomite 0.00 0.00 0.00 Garnet 123.00 47.49 182.00 86.67 0.00 Biotite 9.00 3.47 0.00 0.00 Chlorite/Chloritoid 17.00 6.56 0.00 55.00 13.19 Opaque 56.00 21.62 13.00 6.19 174.00 41.73 Others 15.00 5.79 5.00 2.38 22.00 5.28 Total 259.00 100.00 210.00 100.00 417.00 100.00 ZTR 15.06 4.76 39.81 Sample No 22-10 23-4 Rock Unit Tamrang
Formation Tamrang Formation
Age (Permo-Carboniferous)
(Permo-Carboniferous)
Heavy Minerals No of Grains
Percentage No of Grains
Percentage
Zircon 25.00 7.00 18.00 9.63 Rutile 18.00 5.04 15.00 8.02 Tourmaline 99.00 27.73 34.00 18.18 Chrome-Spinel 0.00 2.00 1.07 Dolomite 0.00 0.00 Garnet 0.00 0.00 Biotite 0.00 0.00 Chlorite/Chloritoid 22.00 6.16 28.00 14.97 Opaque 180.00 50.42 72.00 38.50 Others 13.00 3.64 18.00 9.63 Total 357.00 100.00 187.00 100.00 ZTR 39.78 35.83

81
Figure 5.5 Representative photomicrograph of heavy mineral assemblage in the Permo-Carboniferous sandstone (sample 26-8) of the Katari Group, eastern Nepal (Bt-Biotite; Rt-Rutile; Zr-Zircon).
Figure 5.6 Representative photomicrograph of heavy mineral assemblage in the Permo-Carboniferous sandstone (sample 23-4) of the Barahachettra Group, eastern Nepal (Tr-Tourmaline).

82
5.3 PROVENANCE
The weight percentage of heavy minerals of the Gondwanan sandstones in eastern
Nepal is less than that of western Nepal (Fig. 5.7). The presence of numerous faults in the
eastern part could have played a significant role by allowing acid water to leach the
heavy minerals (Morton and Hallsworth, 1999). Among individual units, the Taltung
Formation (Cretaceous-Jurassic) of the Tansen Group contains the highest amount of
heavy minerals, which may reflect sediment contribution from nearby lava flows (Sakai,
1983). The overall signature of heavy minerals in Gondwanan sequences of Nepal is the
dominant contribution of garnet in Permo-Carboniferous units in western and eastern
Nepal (Fig. 5.8). Assemblages dominated by highly stable minerals ( zircon, rutile and
tourmaline) characterize the Cretaceous-Paleocene Amile Formation of western Nepal
(Tansen Group) and purported Permo-Carboniferous unit (Bashyal, 1979) of western
Nepal (Fig. 5.9).
Presence of abundant chrome-spinel in the Jurassic-Cretaceous Taltung Formation
of the western Nepal indicates a volcanic source. The puported Permo-Carboniferous
Katari Group does not show similarities in heavy mineral contents with the Permo-
Carboniferous units of Tansen and Barahachettra groups.
The garnet and tourmaline contents of Gondwanan units of Nepal show strong
negative correlation (Fig. 5.10), which suggests a change in source rocks rather than
some other control. Moreover, during the Permo-Carboniferous, India together with
other masses of Gondwanaland, was situated in high southern latitudes (Veever and
Tiwari, 1995). However, during Jurassic to Cretaceous deposition, India was already

83
positioned in an equatorial area, which resulted in intense weathering of source rocks and
destruction of unstable heavy minerals. The possible provenance of garnet contributing
sediments for the Gondwanans sequences of Nepal could be the Chotnagpur Gneissic
terrain of peninsular India (Fig. 5.11). However, the Aravali-Delhi Supergroup and the
Bundelkhand Gneiss could have also contributed garnets depending on the paleodirection
of northerly flowing rivers from central India (e.g. Chambal, Betawa, and Son Rivers).
The highly stable heavy minerals in Jurassic to Cretaceous units could have been
supplied from Proterozoic sedimentary sequences of the Vindhyan Group.
Figure 5.7 Distribution of heavy minerals among different units and sections of Gondwanan sandstones in Nepal.
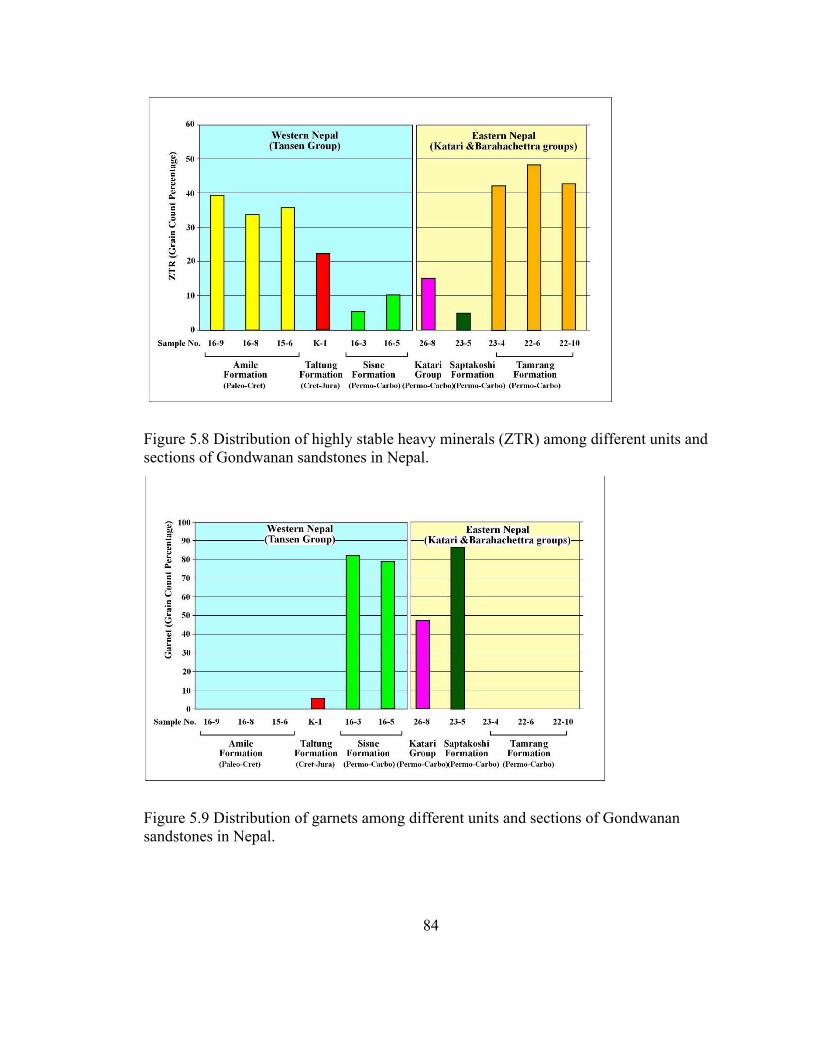
84
Figure 5.8 Distribution of highly stable heavy minerals (ZTR) among different units and sections of Gondwanan sandstones in Nepal.
Figure 5.9 Distribution of garnets among different units and sections of Gondwanan sandstones in Nepal.

85
Figure 5.10 Variation in distribution of garnets and ZTR among different units and sections of Gondwanan sandstones in Nepal.
Figure 5.11 Possible source rock units for the Gondwanan sandstones of Nepal from cratonic India.

86
CHAPTER 6: MICROPROBE ANALYSIS
6.1 INTRODUCTION
Heavy mineral studies have been used as one of the most powerful tools in
provenance analysis in the past and are gaining more recognition recently. Sandstones are
easy to collect in the field and to process and analyze in the lab and hence are the
materials utilized for heavy mineral analysis.
Mineral chemistry of some heavy minerals are very good indicators on
discriminating source rock types. Chrome-spinel chemistry is useful in differentiating
various types of mafic igneous rocks. The supply of sediment from different-grade
metamrophic rocks can be tracked down with the help of garnet chemistry. Tourmaline
chemistry is valuable in distinguishing types of plutonic source rocks.
Mineral chemistry analysis on some selected heavy minerals has been carried out
with an objective to fingerprint provenance of Gondwanan sequences distributed in
several patches along the Nepal Himalaya.
6.2 MINERAL CHEMISTRY
Three mineral groups were chosen for microprobe analysis: garnet, tourmaline,
and chrome-spinel. Several workers have used these minerals to determine provenance of
sediments (e.g., Kumar, 2004; Zahid; 2005; Rahman, 2008). The compositional variation
of these mineral can be linked to different source rocks (Henry and Guidotti, 1985;

87
Morton, 1985; Henry and Dutrow, 1990; Morton and Taylor, 1991; Nanayama, 1997,
Zhu et. al, 2004).
Garnet [X3Y2(Si04)3], found commonly in metamorphic rocks and also in some
igneous rocks, has proven to be a good indicator of pressure and temperature conditions
during the formation of the source rock. The X-site is occupied by Fe2+, Mg2+, Ca2+ , and
Mn2+. As the metamorphic grade of the source rock will increases, the ratio of (Fe2+ +
Mg2+)/(Ca2+ + Mn2+) also increases (Sturt, 1962; Nandi, 1967). With an increase in
metamorphic grade, pelitic schists will show an increase in Mg concentration with
respect to Fe2+ (Spear, 1993). The Y-site is occupied by trivalent cations like Fe3+, Cr3+
except Al3+ . The cations occupancy of this site can also be related to the type of source
rock.
Compositional analysis of chrome-spinel has also been used by several workers
for sediments provenance analysis. Chrome-spinel is a good indicator of provenance,
particularly for discriminating different types of mafic and ultramafic rocks (Irvine,
1973, 1977; Dick and Bullen, 1984; Nixon et al., 1990). Chrome-spinel [AB2O4], found
mostly in mafic igneous rocks, gives a good indication of source rocks based on
variations of elements in cation sites. There are 4 oxygen ions and 3 cations in the unit
cell (Brady and Perkins, 2009). The A-site is occupied by Fe2+, Mg2+, Ca2+ , Mn2+ and
the B-site is occupied by Al3+, Cr3+, Ti4+, Si4+. Different end members can be calculated
based on the occupancy of these two sites. In most cases, there will be presence of solid
solutions rather than true end members (Deer et al., 1992).

88
Tourmaline generally has very complex compositional structure. The general
structural formula of tourmaline is XY3Z6(BO3)Si6O18(OH)4. The X-site is usually
occupied by Na+, Ca2+, the Y-site is by Mn2+, Fe2+, Al3+, Li2+, Mg2+, and the Z-site by
Al3+, Cr3+, Mn2+or Mg2+ (Deer et. al, 1992). This mineralogical structure provides the
opportunity for a wide range of cation substitutions during crystallization of tourmalines.
Plots of tourmaline composition, Al-Fe(tot)-Mg and Ca-Fe(tot)-Mg, have been used for
provenance analysis by many authors (e.g., Henry and Guidotti, 1985; Henry and
Dutrow, 1990).
6.3 SAMPLE PREPARATION
Heavy minerals were separated from disintegrated samples using a heavy liquid.
The separation process is described in the heavy mineral chapter (Chapter 5). Thin
sections used for normal microscopic study of heavy mineral were also used for the
microprobe analysis. The polished thin sections were carbon-coated to ensure proper
conduction of the electron beam on the surface of the thin sections. Along with the
desired samples, one standard sample was also coated to the same thickness. The carbon
coating was carried out by carbon evaporation under vaccum, and the thickness of the
carbon coat was monitered with the reference of its color on polished brass block. As the
thickness of coat increases on the brass, its color will change from orange (150 Å) to
indigo red (200 Å), then to blue (250 Å) and then to bluish green ( 300 Å).

89
6.4 THE ELECTRON MICROPROBE
An electron microprobe (EMP) is an analytical tool used for nondestructive
micron-scale quantitative chemical analysis of small volumes of solid materials. It is also
referred to as an electron probe microanalyser (EPMA) or electron micro probe analyser
(EMPA).The working method of EMP is similar to the scanning electron microscope
(SEM). The method utilizes characteristic x-rays excited by the bombardment on the
surface of sample with an electron beam. When the electron beam hits on the surface of
the sample it creates two different kinds of response. Some of the electrons of the
incident beam will be scattered backward elastically multiple times carrying the energy
between 0 and Eo (the incident beam energy). These back-scattered electrons carry
information about the chemical composition of the sample. As the electron beam hits the
sample, electron beam will loses its energy which will be received by the electrons in the
shell of atoms of the sample. These electrons of the sample will be excited and jump from
one shell to another shell throwing certain amount of energy. That energy transforms to
x-rays that are very characteristic of the compositon of the sample. Secondary electrons
from the sample are also mobilized by the beam through inelastic scattering. These have
energies in the range of 0-50 eV (most probable energy 3-5 of eV). Different detector
setups are required to detect these different types of electron signal.
The basic purposes of EPM are: (1) to get a complete quantitative chemical
analysis of a small sample through x-ray emission spectral analysis without destroying
the samples; and (2) to get high-resolution scanning electron and concentration maps
(scanning x-ray). Among the scanning electron images, backscattered electron (BSE) will

90
show compositional contrast, while secondary electron (SE) will enhance surface and
topographic features.
For this research, a JEOL JXA 8600 Superprobe was utilized at the Department
of Geology, University of Georgia. The probe is automated by a Geller Micro analytical
laboratory dQANT with the an accelerating voltage of 15 KV and a beam current of 15
nanno amps. Both natural and synthetic standards were used to calibrate the data.
Standard Intensity Calibration:
Before starting the actual microprobe analysis of samples, the standard x-ray
intensities of the elements to be measured were obtained on appropriately chosen
standards. These standards were also verified for the reproduction by analyzing
secondary standards that were run as unknowns. The analytical environment (e.g.,
accelerating voltage, beam current, etc.) was remained fixed throughout the lab session.
The list of the standards used during this analysis is given in Table 6.1. Most of
the standards came from C.M. Taylor Corporation. The USNM standards came from the
National Museum of Natural History, a branch of the Smithsonian Institution. Standards
from University of Oregon Microprobe Laboratory and an almandine standard obtained
from the Harvard Mineral Museum were also used. Calbration for each analysis session
was checked using the Kakanui Hornblende (USNM) and Pyrope # 39 (C.M. Taylor)
standards.

91
Table 6.1 Electron microprobe standards used for this study
Electron Microprobe Standards
Element Standard Source Comment
Cr Chromite#5 C M Taylor Corp
Mn Spessartine#4b C M Taylor Corp
TiO2 Rutile C M Taylor Corp
Ca Sphene#1A C M Taylor Corp
Fe Hematite#2 C M Taylor Corp Used for oxide (spinel) analysis
Fe Syn. Fayalite Ol-11
Univ. of Oregon Used for silicate analyses
Ni Ni metal C M Taylor Corp
Si Diopside 5A C M Taylor Corp Si standard for all phases except garnet
Mg Olivine #1 C M Taylor Corp
Al Syn. Spinel C M Taylor Corp
K Orthoclase MAD-10
C M Taylor Corp
Na Ameila Albite USNM This is ubiquitous Na
Standard
Si Almandine Harvard Mineral Museum oxygen standard # 112140
Si standard for garnet
analyses
F Syn. Fluoro-Phlogopite
University of Oregon M-6
Cl Scapolite USNM R 6600-1

92
6.5 RESULTS
A total of 45 grains were analyzed under the supervision of Mr. Chris Fleisher.
These included garnets, tourmalines, and chrome-spinels.
6.5.1 Garnet
Garnet grains are abundant in the Sisne Formation of the Tansen Group and also
in the Barahachettra and Katari groups. However, garnets are rare to absent in younger
units (Taltung and Amile formations ) of the Tansen Group. Calculated endmembers and
their variations of 20 garnet grains are plotted in figures 6.1 through 6.6. The end-
member calculation was done for four endmembers-- almandine, pyrope, grossular and
spessartine-- among which almandine is the dominant end-member. The average and
maximum content of almandine in garnet grains is 65.49% and 81.88%, respectively.
The average pyrope content is 14.44% with a maximum of 35.80%. Higher pyrope
contents are found in the Taltung Formation of the Tansen Group. The average grossular
content is 13.70% with a maximum of 32.83%. The average spessartine content is 6.35%.
However, this average usually reflects high spessartine contents in just a few grains.
The (Sp+Gro)-Py-Alm plot (Fig. 6.1) shows that most of the garnets have high
almandine content. Almost all of the grains from the Katari Group have very low pyrope
content. Similary, the (Py+Alm)-Gro-Sp plot (Fig. 6.2) shows that most of the grains
have high Py+Alm, particularly garnets from the Taltung Formation. Garnet grains from
the Barahachettra Group show low spessartine contents of except one grain. The
(Alm+Sp)-Py-Gro plot (Fig. 6.3) shows that all the garnets from the Katari Group fall in

93
field I with almandine and grossular and pyrope < 10%. Most of the garnets from the
Barahachettra Group fall in field III with both pyrope and grossular >10%. The garnets
from the Taltung Formation falls in field II with grossular <10%. The plot of Sp-Alm-Py
(Fig. 6.4) shows that most of the garnet grains from all rock units fall in the amphobolite
facies. Only one grain of the Sisne Formation falls in granulite facies. However, the
grains from the Taltung Formation fall in the overlapping field between granulite facies
and amphioblite facies.
The plot of grossular content (mol %) with the number of grains from each rock
unit (Fig. 6.5) also shows that most of the grains fall in low- to medium-grade
metamorphic pressure regimes. The only one grain from the Sisne Formation falls in
eclogite facies. Garnet from the Taltung Formation reflects a low-grade metamorphic
regime.

94
Figure 6.1 Chemical composition of garnets of Gondwanan sequences of Nepal (Tansen Group, western Nepal; Barahachettra and Katari groups in eastern Nepal) plotted on (Sp+Gro)-Py-Alm (adapted after Nanayama, 1997).
Figure 6.2 Chemical composition of garnets of Gondwanan sequences of Nepal (Tansen Group, western Nepal; Barahachettra and Katari groups in eastern Nepal) plotted on (Py+Alm)-Gro-Sp (adapted after Nanayama, 1997).

95
Figure 6.3 Chemical composition of garnets of Gondwanan sequences of Nepal (Tansen Group, western Nepal; Barahachettra and Katari groups in eastern Nepal) plotted on (Alm+Sp)-Py-Gro (adapter afted Nanayama, 1997).
Figure 6.4 Chemical composition of garnets of Gondwanan sequences of Nepal (Tansen Group, western Nepal; Barahachettra and Katari groups in eastern Nepal) plotted on Alm-Py-Sp (adapted after Nanayama, 1997).

96
Figure 6.5 Grossular contents of garnets from Gondwanan sequences of Nepal (Tansen Group, western Nepal; Barahachettra and Katari groups in eastern Nepal) plotted on Alm-Py-Sp (adapted after Nanayama, 1997).
6.5.2 Tourmaline
Tourmaline has very complex structure and is commonly considered in terms of
end-members. There is a complete solid solution between two end-member series: schorl-
elbaite and schorl-dravite. However, there is a large miscibility gap between elbaite and
dravite. Hence, tourmalines are usually described by their positions in the schorl-elbaite
series or in the schorl-dravite series. Two different plot have been prepared using Al-
Al50Fe50(tot) -Al50Mg50 ( Fig. 6.6) and Ca-Fe(tot)-Mg (Fig. 6.7). These plots Al-
Al50Fe50(tot) -Al50Mg50 show that all tourmaline grains from three different sections of
Nepal (the Tansen, Barahachettra and Katari groups) fall between Li-poor granitiods and
pegmatites and aluminous meta-pelites and meta-psammites.

97
On the Ca-Fe(tot)-Mg plot (Fig. 6.7), tourmalines from the Katari Group fall in
three different fields: Li-rich granitoids pegmatites, Li-poor granitoids pegmatites, and
Ca-poor metapelites, metapsammites. Samples from Barahachettra and Tansen groups
have fallen only between the Li-poor granitoids pegmatites and Ca-poor metapelites,
metapsammite fields. As the compositon of grains are fallen in different rock group
types, there should be different sources of rocks for these units.
6.5.3 Chrome-spinel
Chrome-spinel was only found in the Taltung Formation of the Tansen Group.
Five grains of chrome-spinel from this unit were analyzed. The average elemental
percentage of chormium in these grains is 24.17%, with the maximum of 33.02%.
Various plots have been prepared from the compositional data of these chrome-
spinel grains to judge the source rock of the sediment. A ternary plot of Al3+-Cr3+-Fe3+
suggests Alpine-type peridotite source rock (Fig 6.8). Alpine-type peridotites have
compositions of > 95% harzburgite and originate as depleted residues of partial melting.
The lower concentration of Fe3+ also supports this scenario.
The possibility that chrome-spinels from the Taltung Formation were derived
from Alpine-type peridotite is also supported by a plot of Cr/(Cr+Al) with
Mg/(Mg+Fe2+) (Fig. 6.9). The low value of Cr# makes the grains fall in the Alpine-type
peridotite field.
The plot of Mg/(Mg+Fe3+) versus Fe3+/(Fe3++Al+Cr) (Fig. 6.10) also shows the
Alpine-type peridotite as the possible source rock. However, the plots also overlap with

98
the field of stratiform complexes. Hence, derivation of these sediments from stratiform
complex source terranes is also possible.
Figure 6.6 Al-Fe (tot)-Mg plot (in molecular proportion) for tourmalines from Gondwanan sequences of Nepal (Tansen Group, western Nepal; Barahachettra and Katari groups in eastern Nepal) plotted on Al-Al50Fe(tot)50-Al50Mg50 (adapted after Henry and Guidotti, 1985).

99
Figure 6.7 Ca-Fe(tot)-Mg plot (in molecular proportion) for tourmalines from Gondwanan sequences of Nepal (Tansen Group, western Nepal; Barahachettra and Katari groups in eastern Nepal) plotted on Ca-Fe(tot)-Mg, (adapted after Henry and Guidotti, 1985).
Figure 6.8 Ternary plot of major trivalent cations in chrome-spinels of the Taltung Formation of the Tansen Group (Gondwanan sequences) of the Nepal Himalaya with three major provenance fields (adapted after Nixon et al., 1990).

100
Figure 6.9 Plot of Mg/(Mg+Fe2+) vs Cr/(Cr+Al) for chrome-spinels of the Taltung Formation of the Tansen Group (Gondwanan sequences) of the Nepal Himalaya (adapted after Nixon et al., 1990).

101
Figure 6.10 Plot of Mg/(Mg+Fe2+) vs the ratio of trivalent cations Fe3+/( Fe3++Cr+Al) for chrome-spinels of the Taltung Formation of the Tansen Group (Gondwanan sequences) of the Nepal Himalaya (adapted after Irvine, 1974). Note that all grains fall in the overlap between Alpine and stratifrom peridotite fields.

102
6.6 DISCUSSION
6.6.1 Garnets
Garnet composition of samples from different Gondwanan sequences in Nepal
suggest different source terranes. The Katari Group, with low pyrope contents, belongs to
the amphibolite regime, while the Taltung Formation, with low grossular and spessartine
contents reflects low metamorphic grade (Figs 6.4 and 6.11). Most of the grains from the
Barahachettra Group contain both grossular and pyrope (Fig. 6.3) but have low
spessartine content. The most probable source of garnet could be the Bihar Mica Belt, the
Ranchi Supracrustal Belt and the Munger Belt of Chotanagapur Gneissic Terrain.
However, different igneous bodies, including the Malani Granite of the Delhi Supergroup
and the Vindhyan System of peninsular India also could have supplied garnets to the
Gondwanan basins of Nepal (Sakai, 1983).
6.6.2 Tourmaline
Microprobe data for tourmaline supports that the source rock for these
tourmalines are Li-poor granitoids and aluminous meta-psammities and meta-pelites (Fig.
6.6). However, the plot of Ca, Fe(tot) and Mg, suggests different types of source rocks
(Fig 6.7). The Amile Formation, which is basically rich in quartz arenite, shows a
granitoid provenance, whereas other formations show a mixed provenance of granitioids
and meta-psammites and meta-pelites. Hence, different granitic bodies of the Indian
craton as well as pelites, from Vindhyan could have contributed tourmaline.

103
Figure 6.11 Petrographic grid for the KFMASH system contoured with isopleths of XAlm in garnet (after Spear and Cheney, 1989). The isopleths are constructed assuming that garnet formed in equilibrium with biotite in a rock of pelitic bulk composition. The blue region shows the range of isopleth values for garnets from Gondwanan sequences of Nepal while solid color lines show the average of isopleth value for different rock units.

104
6.6.3 Chrome-spinel
The TiO2% versus Cr# in chrome spinels shows that these grains were derived
from mid-oceanic, island arc and alkaline basaltic sources (Fig. 6.11). However, as TiO2
contents of these chrome-spinel grains are very low which is charecteristic of alkaline
basalts, these chrome-spinel grains could have been contributed by the alkaline Aulis
Basalt considered to be equivalent to the Rajmahal Traps (Sakai, 1983; Segev, 2002).
The Cr# value for the peridotites and basalts of mid-ocean ridges is less than 0.06
with Mg# between 0.55 -0. 85 (Dick and Bullen, 1984). This tectonic setting has been
classified as Type I. Another type of tectonic setting that is also regarded as Type I
setting is depleted marginal seafloor basalts which show slightly lower value for Mg# and
narrower range of Cr# than mid-oceanic ridge basalts (MORB). The Cr# and Mg# of the
Taltung Formation indicate mid oceanic ridge type basalts or peridotite as the source of
chrome-spinels. The Cr# and Mg# for island arc basalts (Types III setting) are 0.6-0.9,
and 0.4-0.69, respectively (Cookenboo et al., 1997). Ophiolites, which have compositions
transitional between Type I and Type III are regarded as Type II settings (Dick and
Bullen, 1984).
The high aluminium and high chromium contents of the Taltung Formation also
suggest a mid-oceanic type of source rock.

105
.
Figure 6.12 Plot of TiO2 vs Cr# of Gondwanan sequences of Nepal (Tansen Group, western Nepal; Barahachettra and Katari groups in eastern Nepal) relative to spinels from various potential source rocks. MORB=Mid-oceanic ridge basalt (after Nanayama, 1992).

106
Figu
re 6
.13
Sche
mat
ic d
iagr
am sh
owin
g sp
inel
com
posi
tion
from
diff
eren
t tec
toni
c se
tting
s, in
clud
ing
thos
e of
sea-
floor
and
con
tinen
tal c
rust
orig
ins (
mod
ified
from
Coo
kenb
oo e
t al.,
19
97).

107
CHPATER 7: WHOLE ROCK CHEMISTY
7.1 INTRODUCTION
The whole rock chemistry of a sedimentary rock can provide an improved
understanding of provenance of sediments and contemporaneous and subsequent
sedimentary and weathering processes that impacted the sediments or the rock.
Composition of sedimentary rock is primarily controlled by the composition of the source
rocks and to some extent also by weathering and diagenetic processes (Dickinson, 1985;
McLennan et al., 1993,).
It is necessary to understand the weathering process and climatic conditions
during deposition of sedimentary rocks before making final interpretations on the source
rock. The chemistry of sedimentary rocks is significantly influenced by weathering of the
source rock and also post depositional diagenetic processes after the deposition of
sediments (Nesbitt and Young, 1992). The ‘Chemical Index of Alteration’ (CIA) and
ternary plot of Al2O3-(CaO+Na2O)-K2O are valuable tools to evaluate the degree of
weathering and diagenetic processes. All chemical constituents present in a source rock
do not behave in same way under a given weathering regime. When source rocks are
exposed to weathering, they become depleted in oxides that are not resistant to
weathering. Other more resistant oxides remain almost in the same amount that they were
in parent rock. The proportions of some of the major oxides, such as SiO2, Al2O3 and
K2O, have been found to be constant from source rock to the basin (Bhatia, 1983; Roser

108
and Korsch, 1988). Some trace elements (Zr, Th, Sc, Nb, Ga) and rare earth elements
(REE) are generally remain constant from source rocks to the sediment because of their
low solubility in water during weathering (McLennan et al. 1985; Bhatia and Crook,
1986). Relative concentration of resistant major oxides and trace elements present in
sedimentary rocks are valuable indicators of source rocks.
One major limitation of using whole-rock chemistry alone is the inability to detect
the mixing of different kinds of source rocks. Hence, chemical analyses should be
supported by other methods of provenance study (e.g., traditional petrography, heavy
mineral analysis, detrital geochronology, etc.). Representative sandstone samples have
been subjected to whole-rock geochemical study to aid in the interpretation of
paleotectonics and sediment provenance of Gondwanan sequences from Nepal.
7.2 METHODS
Nine representative sandstone samples were selected for the whole-rock
geochemical analysis. The selected samples representing the Gondwanan sequence
(Tansen Group) in the western part of Nepal include sample 16-1 from the Dumri
Formation, sample 15-8 from the Bhainskati Formation, sample 15-5 from the Amile
Formation, sample K-1 from the Taltung Formation, and sample 16-6 from the Sisne
Formation. Samples from the eastern part of Nepal include samples 26-3 and 26-8 from
the Katari Group, and sample 23-5 from the Tamrang Formation, and sample 22-9 from
the Saptakoshi Formation of the Barahachhetra Group.

109
Selected samples were crushed in the rock-preparation lab of the Department of
Geology and Geography, Auburn University. The size of the samples was further reduced
with a mortar and pestle to the 200 mesh. Subsamples of ~10 gm from each sample were
sent to ACME Laboratories Limited. Each sample was analyzed for 58 parameters
including major oxides, minor elements, trace elements (rare earth and refractory
elements), and precious and base metals. Major oxides, minor, rare earth and refractory
elements were determined by ‘Inductively Coupled Plasma’ (ICP) mass spectrometry
following lithium metaborate/tetraborate fusion and nitric acid digestion of 0.2-gm sub-
samples. Precious and base metals were analyzed by ICP mass spectrometer after
digesting separate 0.5-gm splits in Aqua Regia. Loss of ignition was calculated by
weighing the difference after ignition at 1000oC.

110
7.3 RESULTS
The results of geochemical analysis of 9 samples for 58 parameters including major
oxides, minor elements, and trace elements are given in Table 7.1.
Table 7.1 Results of whole-rock chemical analysis of Gondwanan sandstones from Nepal
S. No Unit MDL 16-1 15-8 15-5 K-1 16-6 23-5 22-9 26-3 26-8 SiO2 % 0.01 70.09 85.01 89.79 35.4 70.19 70.98 76.99 95.8 85.19 Al2O3 % 0.01 8.09 5.64 4.38 14.48 10.37 8.52 5.03 2.14 5.61 Fe2O3 % 0.04 20.97 2.58 4.72 13.66 13.16 16.81 18.3 0.32 2.32 MgO % 0.01 0.57 0.79 0.05 3.22 0.88 0.99 0.28 0.05 0.93 CaO % 0.01 0.1 1.47 0.04 12.56 0.84 0.55 0.07 0.09 1.17 Na2O % 0.01 1.42 0.04 0.11 1.06 2.11 1.63 0.04 0.02 0.07 K2O % 0.01 1.53 1.36 0.08 2.1 2.82 2.07 0.73 0.03 1.21 TiO2 % 0.01 0.69 0.47 0.35 2.38 0.33 0.21 0.51 0.08 0.41 P2O5 % 0.01 0.06 0.07 <0.01 0.77 0.08 0.07 0.03 0.01 0.07 MnO % 0.01 0.13 0.04 0.02 0.44 0.1 0.09 0.07 <0.01 0.04 Cr2O3 % 0.002 0.008 0.003 0.006 0.118 0.007 0.007 0.01 0.002 0.004 Ni PPM 20 57 <20 <20 282 30 29 42 <20 <20 Sc PPM 1 6 5 4 27 8 4 5 1 5 LOI % -5.1 -3.9 2.4 0.4 13.3 -1.1 -2.1 -2.2 1.4 2.8 Ba PPM 1 363 179 25 1352 604 357 148 358 247 Be PPM 1 1 <1 <1 2 1 <1 1 <1 <1 Co PPM 0.2 12 4.5 3 50.5 9.2 8.6 10.1 1.3 6.5 Cs PPM 0.1 2.8 2.1 0.2 3.7 1.8 3.2 1.3 <0.1 1.8 Ga PPM 0.5 10.8 6.6 6.7 16.3 12.1 10.1 8.5 3.2 7.7 Hf PPM 0.1 11.4 9.3 3.5 8 7.2 5.7 6.9 0.7 7.2 Rb PPM 0.1 69 55.4 3.3 74.8 96.9 76.9 36.7 1 45.1 Sn PPM 1 6 3 2 4 4 4 5 <1 2 Sr PPM 0.5 47.3 51.8 23.6 568 122.8 85.4 38.2 11.9 20.4 Ta PPM 0.1 1.2 0.9 0.4 8 0.6 0.4 0.9 0.2 0.8 Th PPM 0.2 18.9 13.2 3.7 27.4 6.5 4.5 10 2.1 12 U PPM 0.1 3.2 2.2 1.6 5.1 1.2 1 2 0.8 2.4 V PPM 8 35 28 43 217 43 26 30 14 28 W PPM 0.5 2 1.5 <0.5 3.7 0.7 0.8 2.3 <0.5 1.5
Contd. (MDL = Minimum Detection Limit)

111
Table 7.1 Results of whole-rock chemical analysis of Gondwanan sandstones from Nepal
Contd.
S. No Unit MDL 16-1 15-8 15-5 K-1 16-6 23-5 22-9 26-3 26-8 Zr PPM 0.1 375.7 318.8 114.4 333.5 246.6 201.9 266 25.5 270.8 Y PPM 0.1 36.6 25.2 6 28.7 19.1 13.7 14.8 3.1 20.3 La PPM 0.1 48.8 40 20.4 142.4 22.3 14 33.6 7.3 30.7 Pr PPM 0.02 12.25 9.61 3.68 26.33 5.2 3.53 8.4 1.98 7.54 Nd PPM 0.3 46.2 35.8 11.4 90.2 19.4 13.6 30.1 7.3 27.1 Sm PPM 0.05 8.45 6.26 1.78 12.09 3.24 2.48 4.85 1.29 5.17 Eu PPM 0.02 1.4 1.03 0.3 3.18 0.82 0.7 0.86 0.28 0.89 Gd PPM 0.05 7 5.19 1.32 9.02 2.94 2.32 3.59 1.01 4.38 Tb PPM 0.01 1.08 0.76 0.19 1.12 0.52 0.39 0.49 0.17 0.66 Dy PPM 0.05 6.27 4.38 1.12 5.76 3.15 2.33 2.6 0.71 3.84 Ho PPM 0.02 1.21 0.86 0.2 1 0.67 0.46 0.51 0.14 0.72 Er PPM 0.03 3.38 2.5 0.63 2.72 1.99 1.43 1.52 0.32 2.21 Tm PPM 0.01 0.47 0.34 0.08 0.35 0.29 0.21 0.22 0.08 0.34 Yb PPM 0.05 3.33 2.58 0.61 2.3 2.02 1.38 1.41 0.32 2.18 Lu PPM 0.01 0.48 0.37 0.09 0.34 0.31 0.22 0.23 0.07 0.34 Mo PPM 0.1 9.2 0.4 2.8 1.4 5.3 7.2 7.2 0.1 0.2 Cu PPM 0.1 160.6 56.6 64.1 42.1 84.9 121.7 114.9 7 6.1 Pb PPM 0.1 18.8 11.5 5.5 14.2 11.8 15 12.2 2.4 9.5 Zn PPM 1 41 30 42 94 31 19 46 8 24 Ni PPM 0.1 50.9 9.3 14.6 245.5 31.2 36.2 44.7 1.8 10.1 As PPM 0.5 4 1.4 1.5 7.3 5 4.5 18.8 0.7 5 Cd PPM 0.1 0.2 <0.1 <0.1 <0.1 <0.1 <0.1 <0.1 <0.1 0.1 Sb PPM 0.1 0.9 0.2 0.3 0.3 0.6 0.9 1.2 0.1 0.2 Bi PPM 0.1 0.3 0.1 <0.1 0.1 0.1 <0.1 0.3 <0.1 0.1 Ag PPM 0.1 <0.1 <0.1 <0.1 <0.1 <0.1 <0.1 <0.1 <0.1 <0.1 Au PPB 0.5 0.8 0.7 1 1.8 0.7 1 0.9 1.3 0.7 Hg PPM 0.01 <0.01 <0.01 <0.01 0.03 <0.01 <0.01 0.03 <0.01 0.02 Tl PPM 0.1 <0.1 <0.1 <0.1 <0.1 <0.1 <0.1 <0.1 <0.1 <0.1 Se PPM 0.5 <0.5 <0.5 <0.5 <0.5 <0.5 <0.5 <0.5 <0.5 <0.5
(MDL = Minimum Detection Limit)

112
7.3.1 Major Elements
Major elements, which are generally measured in the form of oxides, are not
generally considered as good source rock indicators. Some of the major oxides leach out
during the weathering process. Additionally, diagenetic processes also contaminate and
alter detrital grains. However, some of elements are immobile and remain in the sediment
almost in the same amount as in the source rocks. Ratios of major oxides have been used
as an indicator of provenance (Bock et al., 1998; Gotze, 1998, Rahman and Suzuki,
2007). Different discrimination functions have been developed by adding or subtracting
the amount of major oxides that will be depleted or enriched in sediments during
weathering to fabricate the proportions of major oxides similar to the parent rocks
(Bhatia, 1983; Roser and Korsch, 1988). The effect of weathering and diagenetic
processes on the concentration of major elements in sedimentary rocks has been clearly
depicted in the chemical classification of the Gondwanan sandstones (Fig. 7.1).
The Amile sandstones, with its abundant well-rounded quartz grains are supposed
to fall in the field of quartz arenite of figure 7.1. However, Al2O3 contents of the Amile
sandstone are a little too high and the K2O contents are somewhat too low to put this unit
in the quartz arenite field. High iron oxide contents due to weathering, or presence of
mica and other iron minerals made samples from the Dumri and Sisne formations, sample
23-5 from the Saptakoshi Formation, and sample 26-3 from the Katari Group to fall in the
Fe-sandstone field.

113
Figure 7.1 Chemical classification of Gondwanan sandstones of Nepal, classification
fields are taken from Herron (1988).
Some major oxide ratios have been used to evaluate tectonic setting of source
rocks. The Taltung sandstones (sample K-1) have SiO2/Al2O3 ≤5 (Table 7.2), which is
typical for active margins. The remainder of the other samples, except for 26-3 from the
Katari Group, has ratios between 5.2-28.2, which are typical for modern passive-margin
settings (McLennan et al., 1990; Roser and Korsch, 1998). Sample 26-3 from the Katari
Group has an anomalously high ratio of 44.
K2O/Na2O ratios for all samples, except those from the Amile sandstones, are
higher than 1 which is expected for passive margin setting (McLennan et al., 1990). The
lower values of Al2O3/TiO2 in the Taltung sandstone reflect a mafic source rock signature
(Sugitani et. al., 1996), while values for other samples indicate derivation from felsic
terranes.
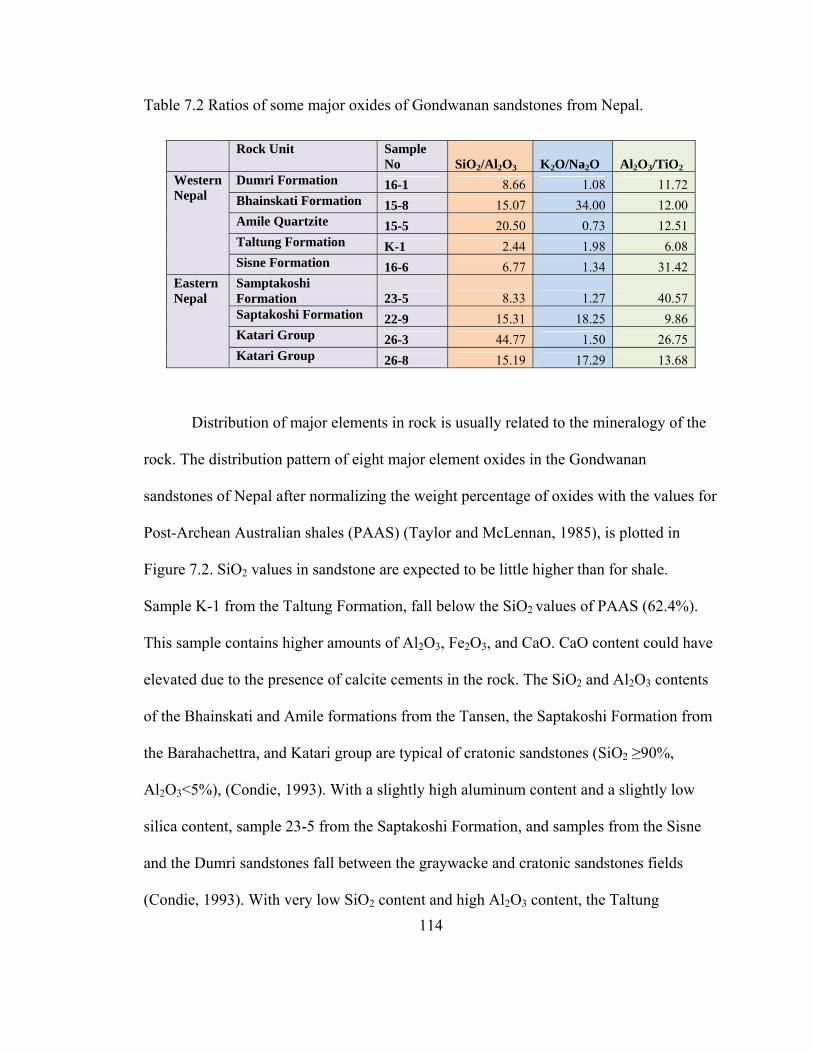
114
Table 7.2 Ratios of some major oxides of Gondwanan sandstones from Nepal.
Rock Unit Sample No SiO2/Al2O3 K2O/Na2O Al2O3/TiO2
Dumri Formation 16-1 8.66 1.08 11.72 Bhainskati Formation 15-8 15.07 34.00 12.00 Amile Quartzite 15-5 20.50 0.73 12.51 Taltung Formation K-1 2.44 1.98 6.08
Western Nepal
Sisne Formation 16-6 6.77 1.34 31.42 Samptakoshi Formation 23-5 8.33 1.27 40.57 Saptakoshi Formation 22-9 15.31 18.25 9.86 Katari Group 26-3 44.77 1.50 26.75
Eastern Nepal
Katari Group 26-8 15.19 17.29 13.68
Distribution of major elements in rock is usually related to the mineralogy of the
rock. The distribution pattern of eight major element oxides in the Gondwanan
sandstones of Nepal after normalizing the weight percentage of oxides with the values for
Post-Archean Australian shales (PAAS) (Taylor and McLennan, 1985), is plotted in
Figure 7.2. SiO2 values in sandstone are expected to be little higher than for shale.
Sample K-1 from the Taltung Formation, fall below the SiO2 values of PAAS (62.4%).
This sample contains higher amounts of Al2O3, Fe2O3, and CaO. CaO content could have
elevated due to the presence of calcite cements in the rock. The SiO2 and Al2O3 contents
of the Bhainskati and Amile formations from the Tansen, the Saptakoshi Formation from
the Barahachettra, and Katari group are typical of cratonic sandstones (SiO2 ≥90%,
Al2O3<5%), (Condie, 1993). With a slightly high aluminum content and a slightly low
silica content, sample 23-5 from the Saptakoshi Formation, and samples from the Sisne
and the Dumri sandstones fall between the graywacke and cratonic sandstones fields
(Condie, 1993). With very low SiO2 content and high Al2O3 content, the Taltung

115
sandstone falls in the oceanic island arc tectonic field (Bhatia, 1983). Usually,
sandstones are more depleted in K2O, Fe2O, and TiO2 than shales. The excessive iron
oxide in the Dumri, Sisne, and Saptakoshi formations is related to daigenesis. However,
the Taltung Formation not only contains high amount s of iron oxide, but also contains a
range of Al2O3, Fe2O3 and TiO2 values that are consistent with derivation from oceanic
island arc settings. Na2O content is higher in the Sisne sandstones in comparison to other
units.
The Harker Variation diagram (Fig. 7.3) shows no correlation between SiO2 and
other oxides except for Al2O3. A negative correlation between SiO2 with Al2O3 is due to
sequestration of most of silica in quartz (Osman, 1996). The percentages of particular
oxides in different samples do not change in accordance with SiO2 percentage, indicating
various source terranes for different Gondwanan sequences. Moreover, the Taltung
sandstones show major shifts in composition from other analyzed samples, suggesting a
significant difference in source rocks.

116
Figu
re 7
.2 D
istri
butio
n pa
ttern
of m
ajor
ele
men
t oxi
des i
n G
ondw
anan
sand
ston
e of
Nep
al. D
ata
are
norm
aliz
ed to
Pos
t A
rche
an A
ustra
lian
Shal
e (P
AA
S) (T
aylo
r and
McL
enna
n, 1
995)
.

117
Figure 7.3 Distribution patterns of major element oxides in Gondwanan sandstone of Nepal.

118
7.3.2 Source Area Weathering and Diagenesis
The composition of sedimentary rocks can vary significantly based on the
influence of the weathering through the whole sedimentary process starting with initial
disintegration of the source rock to deposition in basin followed by diagenesis. The effect
of weathering processes on sedimentary rocks can be measured quantitatively in terms of
the molecular percentage of four major oxides (Nesbitt and Young, 1982). These
percentages allow the determination of the chemical index of alteration (CIA), which is
calculated as
CIA = 100 X Al2O3/ (Al2O3+CaO*+K2O+Na2O),
where CaO* is the amount of CaO in silicate minerals only. If CaO weight percent for an
analysis appears greater than Na2O weight percent then CaO* is fixed by taking value
equal to Na2O. A CIA value of 50 is considered for the fresh rocks whereas 100 is the
value for extremely weathered rock which includes weathering of both the source rock
and sedimentary deposit. In comparison to mudstones, sandstones generally show lower
values for CIA (McLennan et al., 1990). CIA plots of the Gondwanan sandstones of
Nepal show significant variations in CIA values (Fig. 7.4). Generally, the Amile
Formation of the Tansen Group, the Saptakoshi Formation of Barahachettra Group, and
the Katari Group (sample 26-3) show high values of CIA, which is consistent with their
quartzose compositions. The ternary plot of Al2O3-(CaO+Na2O) + K2O (Fig. 7.5) shows
that most of the Gondwanan sandstone samples are following usual weathering trends.
The sample from the Amile Formation and sample 26-3 from the Katari Group fall very
close to Al2O3 corner, affirming the highest degree of weathering. The slight offset of the

119
Taltung Formation samples towards CaO-Na2O can be attributed to contribution by of
volcanic rock fragments.
Figure 7.4 CIA values for the Gondwanan sandstones of Nepal. The reference values are
given from average shale (AS), North America Quaternary loess (NAQL), Colorado
Plateau crustal model (CPCM), and upper continental crust (UCC) (after Soreghan and
Soreghan, 2007) where green bars represent the CIA value and yellow bars represent the
ranges of maximum CIA values.

120
Figure 7.5 CIA plot of Gondwanan sandstones of Nepal (modified from Nesbit and
Young, 1984, 1989; and Soreghan and Soreghan, 2007). The average composition of
upper continental crust (UCC) is taken from Taylor and McLennan (1985)
7.4.4 Trace Elements
Trace element concentrations in sediments result from the competing influence of
provenance, weathering, diagenesis, sediment sorting, and the aqueous geochemistry of
the individual elements (Rollinson, 1993). The highest concentration of trace elements is
found in clay-rich sediments rather than sand-sized sediments. However, several studies
have been carried out on trace elements present in sand-sized sediments (Willan, 2003;
Osae et al., 2006; Rahman and Suzuki, 2007).

121
Trace elements usually enter silicate structures replacing the major elements
during fractional crystallization (Krauskopf and Bird, 1995). Large ion lithophile
elements (LILE) like Rb, Cs, Ba, and Sr, usually replace K due to similarities in their
ionic radii and are concentrated in rock in the late stages of crystallization. Transition
trace elements (TTE), like Ni, Cr, Mn, V, and Ti, substitute for Fe and Mg during early
stages of crystallization. High field strength elements (HFSE) including, Zr, Nb, Hf and
Y, are partitioned into melts during crystallization and anatexis. Hence, they usually enter
into felsic rocks rather than mafic rocks. Generally, compatible elements (TTE) are
enriched in mafic rocks while incompatible elements (LILE, HFSE) are enriched in felsic
rocks. Moreover, trace elements and rare earth elements (REE) remain essentially
constant in abundance during weathering because of their low solubility in aqueous
solutions at surface conditions (Taylor and McLennan, 1985).
The ratios of some trace elements in sedimentary samples have proven useful in
tracing sediment provenance.

122
Table 7.3 Ratios of some trace elements in Gondwanan sandstones of Nepal. Reference
values are taken from (a) Cullers et al. (1988) for ranges in sediments from felsic and
mafic sources, and (b) McLennan (1981) for upper continental crust
Sample No Eu/Eu* La/Sc Th/Sc La/Co Th/Co Cr/Th Western Nepal 16-1 (Dumri Fm) 0.56 8.13 3.15 4.07 1.58 2.9015-8 (Bhainskati Fm) 0.55 8.00 2.64 8.89 2.93 1.5615-5 (Amile Fm) 0.60 5.10 0.93 6.80 1.23 11.10K-1 (Taltung Fm) 0.93 5.27 1.01 2.82 0.54 29.4816-6 (Sisne Fm) 0.81 2.79 0.81 2.42 0.71 7.37Eastern Nepal 23-5 (Saptakoshi Fm) 0.89 3.50 1.13 1.63 0.52 10.6522-9 (Saptakoshi Fm) 0.63 6.72 2.00 3.33 0.99 6.8426-3 (Katari Gp) 0.75 7.30 2.10 5.62 1.62 6.5226-8 (Katari Gp) 0.57 6.14 2.40 4.72 1.85 2.28
Ranges in sediments from felsic sources (a)
0.40-0.94
2.50-16.3
0.84-20.5
1.80-13.8
0.04-3.25
4.00-15.00
Ranges in sediments from mafic sources (a)
0.71-0.95
0.43-0.86
0.05-0.22
0.14-0.38
0.04-1.40 25-100
Upper Continental Crust (b) 0.63 2.21 0.79 1.76 0.63 0.76
Most of the trace element ratios of trace elements support that all Gondwanan
sandstones are supplied from mixed sources of felsic and mafic igneous rocks (Table
7.3). The Eu/Eu* ratio shows possible mafic source rock for the Taltung sandstone. La/Sc
values for all samples support the supply from felsic igneous rocks. Th and Sc being
incompatible and compatible respectively are used widely in provenance studies. The
calculated ratio supports a mafic igneous source only for the Sisne Formation. La/Co
ratios show that all the Gondwanan sandstones received sediment from felsic igneous
sources, while Th/Co ratio indicates the possibility of mafic igneous source for the

123
Taltung and Sisne formations. Cr/Th ratio strongly supports a mafic source for the
Taltung sandstone. The calculated Zr/Nb value of 1.95 indicates possible derivation from
alkali-olivine basalt (Rollinson, 1993).
The distribution pattern (Fig. 7.6) of trace elements of the Gondwanan sandstones
shows enrichment of some elements and depletion of others. The high value of Sr in the
samples form the Taltung Formation correlates with Eu distribution (Fig. 7.7), which is
probably due to high concentration of plagioclase. Also high Zr and Hf can be related
with zircon content of this sample. Another major departure in the distribution pattern of
trace elements is the high contents of Sr in many of samples. This also supports an
alkaline source rock where Sr can replace K. The copper content of the Taltung sandstone
is notably lower than other samples.
The distribution pattern of rare earth elements (REE), (Fig. 7.7) shows that
sample K-1 from the Taltung Formation has high LREE (Light REE, La-Sm) than HREE
(Heavy REE, Gd-Y). However, Eu value is significantly high in this sample. Generally,
initial partial melting of mantle generates magma enriched in LREE (incompatible) and
depleted in HREE (relatively compatible) (Rollinson, 1993). However, Eu is usually
incorporated in Ca-plagioclase. Very high value of Eu and also LREE in any particular
type of source rock is unusual and suggests for the mixing of source rocks or enrichment
of plagioclase by sedimentary sorting (Nance and Taylor, 1977). In comparison to
Archean basalts, post-Archean basalts are enriched in LREE (Condie, 1993). Hence, the
REE pattern of the Taltung Formation can be explained by a post-Archean basalt source
rock and sedimentary enrichment of plagioclase. Sample 26-3 from the Katari Formation

124
and the sample from the Amile Formation show relatively lower values of REE than
PAAS which is expected for quartz-rich sandstones (McLennan, 1989). The Amile
Formation is comparatively enriched LREE. Several samples, including samples from the
Dumri, Bhainskati, Sisne, Saptakoshi formations and sample 26-8 from the Katari Group,
show patterns similar to PAAS, although a few of them have slightly little lower values.
This is typical for a provenance consisting of recycled sedimentary debris and/or older
plutionic/metamorphic material with a relatively small volcanic component (Potter, 1978)

125
Figu
re 7
.6 D
istri
butio
n pa
ttern
s of t
race
ele
men
ts in
Gon
dwan
an sa
ndst
one
of N
epal
. Dat
a ar
e no
rmal
ized
to P
ost
Arc
hean
Aus
tralia
n Sh
ale
(PA
AS)
(Tay
lor a
nd M
cLen
nan,
199
5).

126
Figu
re 7
.7 D
istri
butio
n pa
ttern
s of r
are
earth
ele
men
ts (R
EE) i
n G
ondw
anan
sand
ston
e of
Nep
al. D
ata
are
norm
aliz
ed
to P
ost A
rche
an A
ustra
lian
Shal
e (P
AA
S) (T
aylo
r and
McL
enna
n, 1
995)
.

127
The relationships among some major oxides and trace elements also have been used to
trace source-rock types and tectonic setting. The immobile oxide TiO2 and immobile
trace element Zr have been used to infer the type of igneous source rock (Hayashi et al.
1997). The TiO2-Zr plot (Fig. 7.8) shows that, except for the sample from the Taltung
Formation, all units are derived from felsic igneous source rocks. Data for the Taltung
Formation suggests derivation from an intermediate source rock.
Figure 7.8 Plot of TiO2 vs Zr content of the Gondwanan sandstones of Nepal. Fields for
source rocks are drawn from Hayashi et al. (1997).

128
7.4.5 Tectonic Setting and Source Rocks
The K2O/Na2O-SiO2 discrimination diagram of Roser and Korsh (1986) is plotted
in figure 7.9. The plot suggests that Dumri sandstone of the Tansen Group fall in active
margin setting. The sample K-1 of the Taltung Formation falls in the volcanic arc setting
(Fig. 7.9). All other samples including Eocene Bhainskati sandstone fall in passive
margin setting.
Figure 7.9 Tectonic discrimination diagram for Gondwanan sandstones of Nepal.
Tectonic fields are from Roser and Korsh (1986). Tectonic setting: ARC = Volcanic Arc;
ACM = Active Continental Margin; PM = Passive Margin.

129
The trace element plot of La-Th-Sc (Fig. 7-10, adopted from Bhatia and Crook,
1986) also shows that most of the samples fall in the passive and active continental
margin fields. However, the Taltung Formation samples fall in the continental island arc
field, and the Sisne Formation samples unexpectedly falls into continental island arc
field.
Figure 7.10 Plot of elemental percentage of La-Th-Sc of Gondwanan sandstones of
Nepal. Fields of tectonic setting are drawn from Bhatia and Crook (1986).

130
CHAPTER 8
40Ar/39Ar DETRITAL MUSCOVITE DATING
8.1 INTRODUCTION
Argon is a naturally occurring noble gas occupying 0.94% of the total
atmospheric volume of the earth. The main isotopes of argon found in the earth are 40Ar
(99.6%), 36Ar (0.34%), and 38Ar (0.06%). Naturally occurring 40K, with a half-life of
1.25 × 10⁹ years, decays to stable 40Ar (11.2%) by electron capture and positron emission,
and also to stable 40Ca (88.8%) via beta decay (Scherer, 2007). As 40K in rock decays into
40Ar through the time, the ratio of 40Ar to its other isotopes will increase. The 40Ar/36Ar in
the atmospheric air is 295.5, which is taken as reference to compare with 40Ar/36Ar in
rock (McDougall and Harrison, 1999). 38Ar forms by the radioactive decay of 38Cl, 37Ar
formed from 40Ca, and 36Ar forms by the radioactive decay of 40Ca (Dickin, 1995) (Fig.
8.1).
The 40K/40Ar method of dating is based on the decay of 40K to 40Ar with a half life
of 1.25 Ga (McDougall and Harrison, 1999). This method was first applied by Wanke
and Konig (1959). The 40K/40Ar dating method and the 40Ar/39Ar method differ. In
40K/40Ar method, K is determined by independent analysis, while in the 40Ar/39Ar dating
method, 40Ar and 39Ar, produced by neutron irradiation of sample, are measured

131
simultaneously. The abundance of 39Ar in the irradiated sample is a measure of the K
content of that sample. The nuclear reaction that takes place during the irradiation is
where n denotes neutron capture and p proton emission (Faure, 1986).
In addition to 39Ar several other beneficial and undesirable isotopes are produced
during irradiation in nuclear reactors. The effects of these interference reactions are
corrected by using laboratory salt and glasses (Scherer, 2007). Table 8.1 shows the
isotopes produced during the irradiation process.
Figure 8.1 Some stable and radioactive isotopes related to 40Ar/39Ar dating method. The isotopes in yellow box are unstable isotopes. The blue arrow shows the natural decay reaction of 40K→40Ar. The red arrow shows the 39K (n,p)39ArK reaction during irradiation.
39 19 K (n, p) 39
18 Ar

132
Table 8.1 Isotopes produced during the irradiation process of muscovite.
Argon Produced Calcium Potassium Argon Chlorine 36Ar 40Ca 37Ar 40Ca 39K 36Ar 38Ar 42Ca 39K
40K 40Ar 37Cl
39Ar 42Ca 43Ca
39K 40K
38Ar 40Ar
40Ar 43Ca 44Ca
40K 41K
The age equation for 40Ar/39Ar dating (e.g., McDougall and Harrison, 1999) is as
follows:
t = (1/λ)ln(40Ar*/39ArK(J)+1),
where λ is the decay constant for 40K→40Ar, which is 5.543 X 10⁻¹⁰/year. 40Ar* is the
40Ar formed due to radioactive decay in the phase of interest. 39ArK is the 39Ar formed
artificially by bombardment with fast, high-energy neutrons in a nuclear reactor during
the irradiation process (Merrihue and Turner, 1966; McDougall and Harrison, 1999) and
is used as a proxy for measurement of the parent potassium. The parameter J reflects the
neutron flux (fluence) in the reactor and is determined from a standard sample (monitor)
with a known age that is irradiated at the same time as the sample of interest (Scherer,
2007).
The 40Ar/39Ar method is equally applicable for igneous, metamorphic, and
sedimentary systems. However, for intrusive igneous rocks, the 40Ar/39Ar method does
Beneficial reactions Insignificant reactions
Undesirable reactions

133
not provide the date of intrusion; rather, it will provide the age when the K-bearing
mineral cooled through its closing temperature. The closing temperature varies among
minerals. For example, it is approximately 300oC for biotite, 400oC for muscovite and
550oC for hornblende. An igneous rock containing all three of these minerals will have
three different ages for three separate cooling temperatures and will not give the true age
of intrusion. However, it is helpful to know the thermal history of the rock. In the case of
metamorphic rocks, minerals crystallized through their cooling temperatures during any
metamorphic event will record the age of that metamorphic event. The 40Ar/39Ar dating
method has been widely used also in the field of sedimentary research, with muscovite
being the primary mineral for the analysis. When muscovite grains are transported from a
source rock unit to a sedimentary basin, the 40Ar/39Ar dates of these grains can provide a
measure of the time of cooling of its source through the closure temperature interval
(typically 300-400°C; Hames and Bowring, 1994), with the consideration that no
additional 40Ar is added or lost during the transportation and deposition (Hodges et al.
2005).
Detrital minerals usually will show a range of ages related to different sediment
source terranes. The stronger relative probability of a particular age suggests greater
contribution of detritus from the source rock having that age. The age of the sediment
source rock and the depositional age of the sample represent the maximum time gap that
is required for sediment transport. To the extent that rapid transport is related to high
relief in the source region, this phenomenon may indicate that a well-developed

134
Himalayan orogenic ‘front’ existed, and uplifted and unroofing ages may come closer to
the depositional age of the clastic wedge (Hodges et al., 2005).
The northern passive margin of India has evolved through different tectonic
settings through geological time and has contributed sediment to its northern margin in
the Tethys Sea. After the collision with the Tibetian block, the depositional environments
changed from marine to continental accompanied by a change in drainage patterns.
Previous workers have used 40Ar/39Ar method for age-dating sediments accumulated in
the Tethys Sea and attempted to identify their provenance (e.g., Gizbert et al., 2008).
8.2 METHODOLOGY
Muscovite crystals from four sandstone samples from three different Gondwanan
sections of Nepal were selected for analysis. Two samples, sample 15-8 from the
Bhainskati Formation and sample 16-3 from the Sisne Formation of the Tansen Group,
were selected from western Nepal. The other two samples, sample 22-8 from the
Tamrang Formation of the Barahachettra Group and sample 26-8 from the Katari Group,
are from eastern Nepal.
Samples were prepared in the Himalayan Research Laboratory at Auburn
University. Sandstone samples were crushed and sieved to extract grains in 0-4 phi size
range. Afterwards, samples were processed for heavy mineral separation using a heavy
liquid (tetrabromoethane). Lighter fractions of the samples were collected after washing
carefully with acetone. From each sample, approximately 100 muscovite grains were
separated using binocular microscope and packed into an irradiation disc. The samples

135
were sent to the McMaster University Research Reactor in Hamilton, Ontario, Canada for
irradiation produce to 39Ar from 39K.
The Gondwanan sandstones of Nepal were analyzed at the Auburn Noble Isotope
Mass Analysis Laboratory (ANIMAL) at Auburn University. ANIMAL is equipped with
a low-volume, high-sensitivity, 10-cm radius sector mass spectrometer and automated
sample extraction system (based on CO2 laser) for analysis of single crystals (Uddin et
al., 2007). Analyses are typically made using a filament current of 2.240 Amp, and
potentials for the source and multiplier of 2000 V and –1300 V, respectively. The high
sensitivity and low blank of the instrument permits measurement of 10-14 mole samples to
within 0.2% precision. The GA-1550 biotite (9.879 Ma; Renne et al., 1998) was used as a
flux monitor for this study.
Twenty-five irradiated muscovite grains from each sample were placed in a
copper holding disc and analyzed by fusing single muscovite crystals with a CO2 laser.
Data were reduced using Isoplot 3 (Ludwig, 2003). All samples were corrected for
atmospheric argon contamination and inferring nuclear reactions. Mass fractionation was
evaluated by measuring multiple air aliquots daily and procedural blanks were measured
after every sample analyses.
8.3 40Ar/39Ar RESULTS
The distribution of age populations provided by the 40Ar/39Ar method for each
sample is plotted in relative probability plots (Figs. 8.2 through 8.5). The data used for
these plots are given in Appendix E. All samples show polymodal distributions of

136
muscovite age. However, some samples show fewer modes than others. Sample 15-8
from the Eocene Bhainskati Formation of the Tansen Group shows several modes in age
distribution. Significant age distributions are found approximately at 50 Ma, 140 Ma, 300
Ma, 800 Ma and 900 Ma (Fig. 8.2). These multiple age distributions and wide range of
age indicate contribution of muscovites from multiple source terranes. Sample 16-3 from
the Permo-Carboniferous Sisne Formation of the Tansen Group also shows multiple age
distributions with signification age distributions at 30 Ma, 135 Ma, 300 Ma, 500 Ma, 800
Ma, 1300 Ma and 1700 Ma (Fig. 8.3). Unlike other samples, sample 26-8 from the Katari
Group shows only three modes in age distributions: 18 Ma, 24 Ma, and 290 Ma (Fig.
8.4). Sample 22-8 from the Permo-Carboniferous Saptakoshi Formation of the
Barahachettra shows a wide range of age distribution modes at 20 Ma, 32 Ma, 220 Ma,
290 Ma, 580 Ma, 790 Ma, 900 Ma, 1050 Ma and 1180 Ma (Fig. 8.5)
The results for the sample from the Eocene Bhainskati Formation are consistent
with the stratigraphic age assignment to this unit. The Cenozoic ages of other samples in
this study, however, are dramatically younger than the Permo-Carboniferous stratigraphic
ages assigned to them. The ages of ca. 18-30 Ma determined for them, in contrast, are
suggestive of Himalayan orogenesis.

137
Figure 8.2 Probability plot for 40Ar/39Ar of single muscovite crystals from the Eocene
Bhainskati Formation (sample 15-8) (A) all data (B) ages less than 150 Ma of the Tansen
Group, western Nepal.
A
B

138
Figure 8.3 Probability plot for 40Ar/39Ar of single muscovite crystals from the Permo-
Carboniferous Sisne Formation (sample 16-3) (A) all data (B) ages less than 200 Ma, of
the Tansen Group, western Nepal.
A
B

139
Figure 8.4 Probability plot for 40Ar/39Ar of single muscovite crystals from the Permo-
Carboniferous Saptakoshi Formation (sample 22-8) (A) all data (B) ages less than 200
Ma of the Tansen Group, eastern Nepal.
A
B

140
Figure 8.5 Probability plot for 40Ar/39Ar of single muscovite crystals from the Permo-
Carboniferous Katari Group (sample 26-8) (A) all data (B) ages less than 50 Ma, eastern
Nepal.
B
A

141
The fact that some detrital muscovite ages from the Sisne and Saptakoshi
formations as determined in this study appear younger than expected o the basis of
stratigraphic age assignment could be explained in several ways. Possible causes of the
age discrepancy are raised and discussed below:
1. Laboratory error in the measurement, including incorrect J-value, or mass
spectrometer parameters (ratio measurement, etc.).
Laboratory analytical errors listed in the appendices (Appendix –F) represent the
precision of argon isotopic measurements for the individual muscovite crystals, and
generally result in an uncertainty of about 1% in the single-crystal ages. The J-values
were constrained by placing monitor minerals in close proximity to the samples of this
study and are reproducible to within 0.5%. Combining all sources of laboratory and
monitor mineral uncertainty a resulting accuracy for the ages determined would be within
2% (or, about 200,000 years for the Miocene ages determined in this study). Thus, it is
certain that laboratory errors cannot be responsible for producing the Miocene ages in
samples of this study.
2. Sample misidentification, and mislabeling, or contamination in the field or in
the laboratory.
Samples 15-8, 16-3, and 22-8 contain muscovite with ages of calculated 500-1700
Ma that are compatible with Gondwanan source terranes in the Indian craton, and ages
less than ~ 17 Ma are not found in these samples or in sample 26-8. In contrast,
muscovite samples collected and processed for laboratory analysis in the same general

142
time frame as samples of the present study are from the Bengal Basin (with typical
muscovite ages of 14-20 Ma, and a large proportion of micas that are 15-16 Ma) and the
Appalachians (with ages of 300-450 Ma). Considerable care was taken in handling
samples, both in the field and laboratory, and sample contamination is very unlikely to be
a cause of the ages that are younger than stratigraphic assignment. Furthermore, the
modes of 19-22 Ma (see samples 26-8, 22-8, and 16-3), and the pre-500 Ma ages, are not
compatible with other laboratory samples. Therefore, there is no basis to infer sample
mishandling or laboratory contamination could be responsible for the Miocene ages
determined for these presumably pre-Cretaceous stratigraphic units.
3. Incorrect assessment of geology including (3a) stratigraphy and (3b) tectonics
of the study area.
3a. Wide-ranging and polymodal age distributions for the Bhainskati Formation
(sample 15-8) of the Tansen Group was expected. Post-Gondwanan fossils like
Nummulites beaumonti d’ARCHAIC and HEIME, and Assilina papillata NUTTLE are
reported from the Eocene Bhainskati Formation (Sakai, 1983). The Bhainskati Formation
is considered as the record of sediment source switching from Indian craton to the
Himalayan orogenic belt (Najman, 2003).
The depositional age of the Sisne Formation has been suggested to be Permo-
Carboniferous based on discovery of Fenestella, Polypora and Acanthocladia from the
Tansen area (Sakai, 1983). Sakai (1983) has suggested that this formation was supplied
sediment from cratonic India. However, muscovite dating of sample 16-3 from the Sisne
Formation unexpectedly yields few much younger age of 30 Ma and other expected older

143
ages correlatable to Indian source rocks. Notably, the Sisne Formation is overlain by the
Taltung Formation. The latter unit contains basalt flows considered to be equivalent of
Rajmahal Traps (Sakai, 1983). The age of the Rajmahal Traps is considered to be 118 Ma
(Kent et al., 2002). Thus, the Permo-Carboniferous ages inferred for regional Gondwanan
sequences in the Tansen area seem well supported.
The age distribution of sample 22-8 from the Saptakoshi Formation of the
Barahachettra Group poses a similar problem. The Gondwanan plant fossils, Schizoneura
gondwanesis FEISTM of Permian age, have been reported from the black slate of the
Barahachettra Group (Bashyal, 1980). However, occurrence of plant fossils in that area
has not been reported afterwards. The quartzite unit of the Saptakoshi Formation, which
also includes fossiliferous slate, has been kept below the diamictic beds and above
Precambrian basement rock (Bashyal, 1980, Dhital 1992). Everywhere else, diamictite
beds are reported above Precambrian basement in the Gondwanan sequences. Moreover,
the contact between the quartzite beds and Precambrian basement rocks is not an
unconformity but a normal fault. So, all these controversies make the stratigraphy of the
Barahachettra difficult to understand. The younger muscovite ages for sample 22-8 (~17
Ma) would be compatible with the Miocene Dumri Formation. However, the latter is a
litharenite and is lithologically very different than the Barahachettra quartzite unit.
Sample 26-8 of Katari Group poses similar problem. Muscovite grains from this sample
are not giving significant older age modes representing source rocks from the India
except one 290 Ma. The major age modes occur at 18 and 24 Ma (Fig. 8.5).
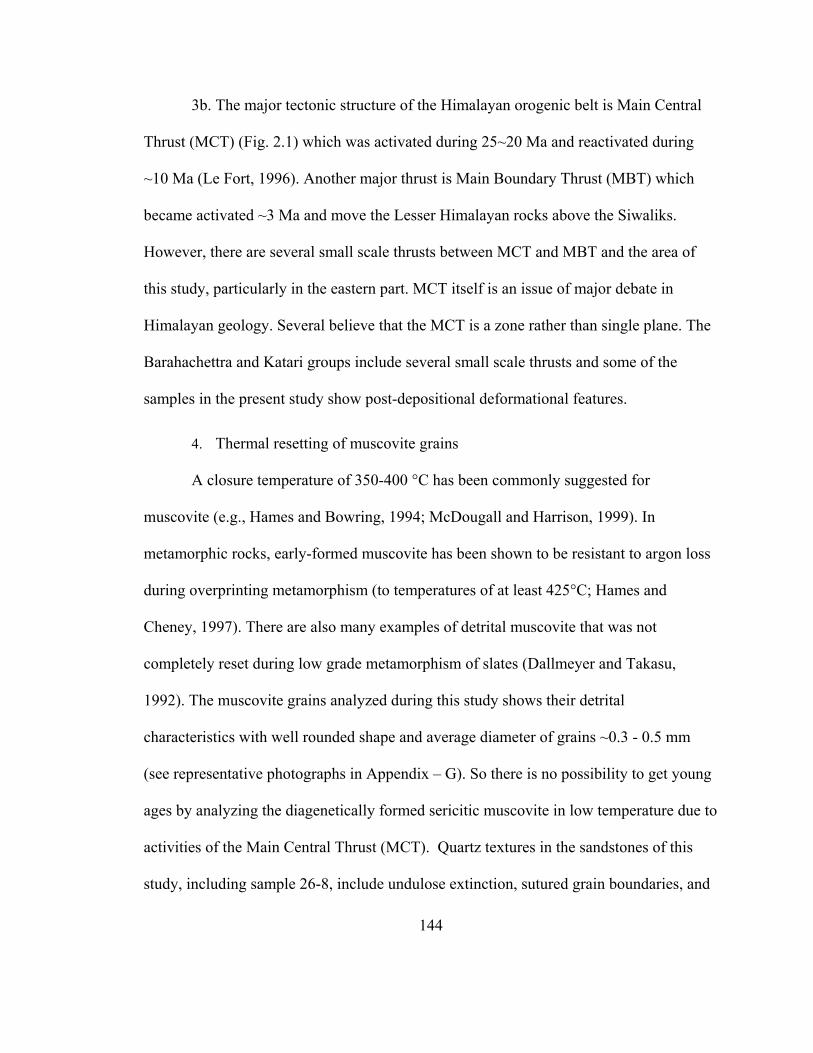
144
3b. The major tectonic structure of the Himalayan orogenic belt is Main Central
Thrust (MCT) (Fig. 2.1) which was activated during 25~20 Ma and reactivated during
~10 Ma (Le Fort, 1996). Another major thrust is Main Boundary Thrust (MBT) which
became activated ~3 Ma and move the Lesser Himalayan rocks above the Siwaliks.
However, there are several small scale thrusts between MCT and MBT and the area of
this study, particularly in the eastern part. MCT itself is an issue of major debate in
Himalayan geology. Several believe that the MCT is a zone rather than single plane. The
Barahachettra and Katari groups include several small scale thrusts and some of the
samples in the present study show post-depositional deformational features.
4. Thermal resetting of muscovite grains
A closure temperature of 350-400 °C has been commonly suggested for
muscovite (e.g., Hames and Bowring, 1994; McDougall and Harrison, 1999). In
metamorphic rocks, early-formed muscovite has been shown to be resistant to argon loss
during overprinting metamorphism (to temperatures of at least 425°C; Hames and
Cheney, 1997). There are also many examples of detrital muscovite that was not
completely reset during low grade metamorphism of slates (Dallmeyer and Takasu,
1992). The muscovite grains analyzed during this study shows their detrital
characteristics with well rounded shape and average diameter of grains ~0.3 - 0.5 mm
(see representative photographs in Appendix – G). So there is no possibility to get young
ages by analyzing the diagenetically formed sericitic muscovite in low temperature due to
activities of the Main Central Thrust (MCT). Quartz textures in the sandstones of this
study, including sample 26-8, include undulose extinction, sutured grain boundaries, and

145
polycrystalline grains. Such intercrystalline strain textures and disequilibrium grain
boundaries would presumably anneal if sandstone were heated to ~ 300 °C or higher for a
geologically significant length of time. MCT, which could be the only possible
deformational agent, was suggested to be active around 24 Ma (Le Fort, 1996) that may
not provide sufficient heat and time period of high temperature for resetting of muscovite.
In metamorphic rocks younger ages of muscovite has been recorded from the overgrown
muscovite due to polymetamorphism rather than the lattice diffusion due to temperature
increase (Hames and Cheney, 1997). But none of these Gondwanan samples show any
attribute of metamorphism. The loss of argon along deformed edges and cracks of
muscovite has been also reported. However, the relationship of detrital muscovite
behavior to that of metamorphic muscovite is unclear. The older, Precambrian ages
determined in this are compatible with Gondwanan sources and do not seem ‘reset’ by
younger events. Thus, on the basis of preserved detrital mineral texture (e.g., quartz
undulose extinction) and previous studies of muscovite, it is not easy to explain younger
ages by thermal resetting.
8.4 PROVENANCE INTERPRETATION
The older muscovite age mode for the Gondwanan sandstone samples can be
correlated with the ages of possible source rocks in Pennisular India, primarily the
Aravalli-Delhi Supergroup, the Malani Igneous Suite, the Bundelkhand Massif, and the
Chotnagpur Gneissic Terrain (Fig. 8.8). In addition to these igneous and metamorphic
units; the Vindhyan Supergroup, equivalent to the Lesser Himalaya, also may have been
a major contributor of sediments for the Gondwanan sequences of Nepal (Sakai, 1983).
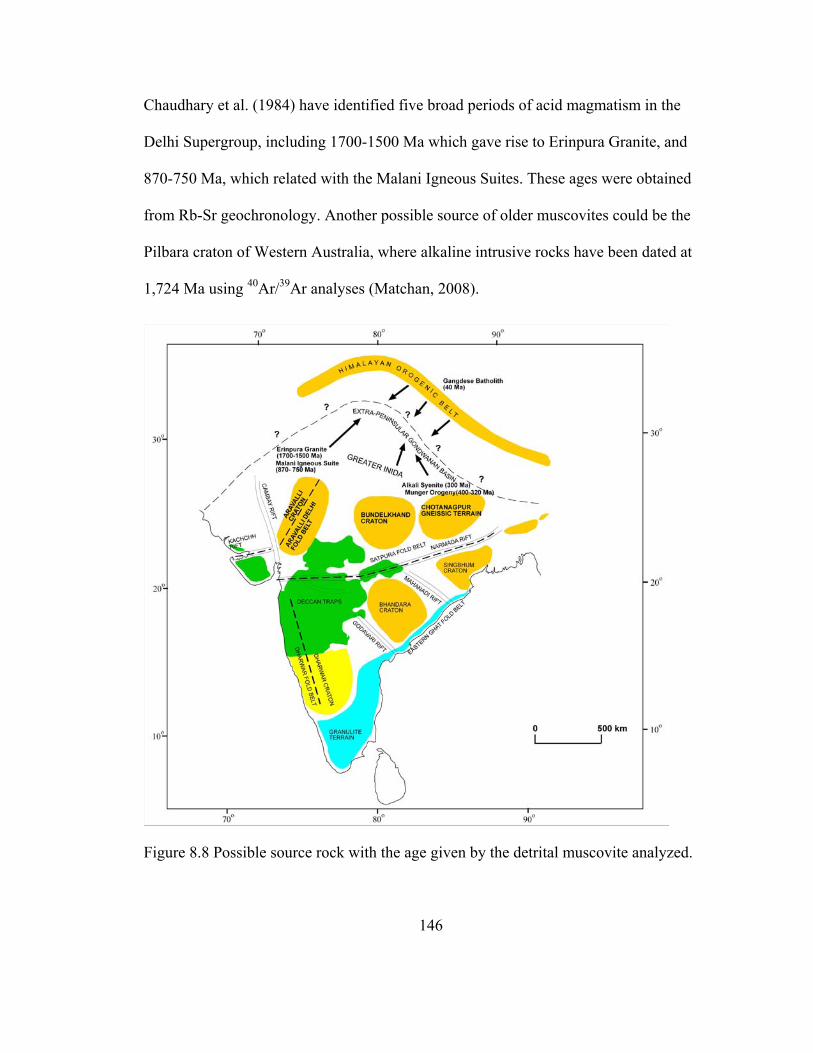
146
Chaudhary et al. (1984) have identified five broad periods of acid magmatism in the
Delhi Supergroup, including 1700-1500 Ma which gave rise to Erinpura Granite, and
870-750 Ma, which related with the Malani Igneous Suites. These ages were obtained
from Rb-Sr geochronology. Another possible source of older muscovites could be the
Pilbara craton of Western Australia, where alkaline intrusive rocks have been dated at
1,724 Ma using 40Ar/39Ar analyses (Matchan, 2008).
Figure 8.8 Possible source rock with the age given by the detrital muscovite analyzed.

147
CHAPTER 9: DISCUSSION
9.1 SYNTHESIS
Permo-Carboniferous Gondwanan sequences of the Nepal Himalaya are mostly
continental deposits developed along a passive-margin setting. However, sequences also
include some marine beds and have been influenced by at least one event of rifting. The
setting gradually changed to a foreland basin when the Indian plate collided with the
Tibetan plate. Post-Gondwanan sequences preserve the history of this collision. The
research carried on the petrography; heavy minerals, whole-rock geochemistry, mineral
chemistry, and detrital muscovite dating of sandstones has generated two important types
of information regarding the provenance and the correlation of the Gondwanan sequences
in different sections of Nepal Himalaya.
9.2 SANDSTONE PETROGRAPHY AND STRATIGRAPHY
The Tansen Group, the type section of the Gondwanan sequence and post-
Gondwanan sequences, shows very sharp compositional variation between different time-
stratigraphic units. The Permo-Carboniferous Sisne Formation contains abundant
feldspars in sandstones that are interbedded with daimictitic beds (Sakai, 1983). Another
important character of the Sisne sandstones is common garnets. Clasts of the diamicite
are believed to have come from the Malani Granite and other associated rock units,
including the Vindhyan Group (Sakai, 1983). The depositional environment can be

148
inferred to be glacial with intervals of glacio-fluvial deposits. The Chotanagpur Gneissic
terrain of peninsular India could have been the main source for providing garnets. The
300 Ma alkaline syenite intrusive rocks in the Chotanagapur Terrain (Mahadevan, 2000)
may have been a source for the feldspars in the Sisne Formation (Fig. 4.1A).
A major shift is observed in the depositional environment of Jurassic- Cretaceous
Taltung Formation. The fluvial depositional basin was not only receiving detritus from
the southern highland in India but also accumulating volcanic rock fragments from the
rift volcanics, which are believed to be contemporary with the Rajmahal Basalt (Sakai,
1983). Diagenetic replacement of quartz and feldspars by calcite is very strong in the
Taltung Formation (Fig. 4.1B). The Late Cretaceous-Paleocene Amile Formation is
shallow-marine deposit that is dominated by mature quartz (Figure 4.2 A). Besides quartz
arenite, the sequence contains shale and limestone, which likely reflect sea-level changes
rather than shifts in source terranes.
The Eocene Bhainskati Formation contains abundant lithic fragments (Fig. 4.2B).
The Bhainskati Formation has been suggested to receive sediments from both the
Himalayan orogenic belts and as well as the Indian craton (DeCelles, 1998). The lower
Miocene Dumri Formation is considered to be a foreland deposit. It is distinguished from
other units based on low abundance of feldspar contents (DeCelles, 1998).
The Permo-Carboniferous Gondwanan sequence of the Katari area in the eastern
Nepal has not been studied well (Dhital, 2006). Petrographic study of the carbonaceous
quartzite from the Katari area shows mature quartz grains cemented by calcite. The
quartzites are deformed but the degree of deformation is variable. From perspective of

149
petrology only, the quartzite beds of the Katari section can be correlated with the Amile
Formation of western Nepal.
Dhital (1992) revised the stratigraphy of the Barahachettra area of eastern Nepal.
The Saptakoshi Formation of the Barahachettra Group consists of diamictite, quarzites,
and volcanic materials. Quartzites are carbonaceous and interbedded with gray shale.
Petrographic studies of quartzites show that these are pure quartz arenites with mature
quartz grains. However, the quartz grains are deformed in many instances. The
petrography of these quartzites as well as the alternation with the gray shale strongly
suggests correlation with the Amile Formation of the Tansen Group (western Nepal). The
sandstone beds, interbedded in diamictites, contain abundant plagioclase and garnet (Fig.
4.4 A), which suggests that the Saptakoshi Formation may be correlated with the Sisne
sandstones.
The Tamrang sandstone contains of angular to subrounded grains of quartz,
feldspar, and metamorphic rock fragments. Abundant mica is present. The matrix consists
of calcite and clay. This formation was earlier proposed to be Cretaceous-Paleocene by
Dhital (1992). However, based on high percentages of metamorphic fragments; it could
be correlated with the Bhainskati Formation of western Nepal.
The occurrence of quartzite beds below the diamictite in the Saptakoshi
Formation which is below the diamictite makes the finding of the Gondwanan fossils in
these beds suspicious. Elsewhere, in peninsular India and in extra-peninsular basins,
Gondwanan sequences always begin with a diamictite directly above the Precambrian
basement which is not consistent in the Barahachettra Group (Sakai, 1983; Dhital, 1992,

150
Veevers, 1995, Dhital, 2006). The fossils reported from the Barahachettra Group have
been never reported in that area by other workers after their first discovery by Bashyal
(1980, 1981). The unconformity considered contact between the quartzites of the
Saptakoshi Formation and the underlying Precambrian basement is actually a normal
fault.
Based on a recent communication with Dr. Meghraj Dhital, a leading expert in
Gondwana sequences of Nepal, a new stratigraphic framework for eastern Nepal is
proposed (Table 9.1) (Fig. 1).
Table 9.1 Proposed Stratigraphy of Gondwanan and post- Gondwanan sequences in the Barahachettra area (eastern Nepal) and its correlation with Gondwanan sequences in other parts of Nepal.
Age Tansen Group Katari Group Barahachettra Group
Early Miocene Dumri Formation Yellow Sandstone -
Eocene Bhainskati Formation disconformity Tamrang Formation
Paleocen-L. Cretaceous Amile Formation Carbonaceous
Quartzite Saptakoshi Formation
Cretaceous-Jurassic
Taltung Formation Volcanics Volcanic Tuffs
Permo-Carboniferous Sisne Formation Diamictite Kokaha Diamictite

151
Figu
re 9
.1 C
orre
latio
n of
stra
tigra
phy
of G
ondw
anan
sequ
ence
s in
wes
tern
par
t of N
epal
and
pro
pose
d st
ratig
raph
y of
eas
tern
Nep
al

152
9.3 HEAVY MINERAL STUDY
Heavy minerals in Gondwanan sandstones are dominated by two assemblages;
garnet rich and ZTR (zircon, tourmaline, and rutile) rich. The Sisne and Kokaha
(Saptakoshi Formation of Dhital, 1992) sandstones contain abundant garnet grains, which
not only require garnet-rich source rocks as well as preservation of those grains.
Subordinate amounts of ZTR are also present in the samples where garnet dominates. In
contrast, the samples that are rich in ZTR contain few garnets, reflecting their relatively
low preservation potential. The Amile Formation does not contain unstable minerals. The
Taltung Formation consists of high number of garnets as well as ZTR. The Tamrang
Formation of the Barahachettra contains abundant micas. The probable provenance for
the garnets could be the Bihar Mica Belt and the Munger Belt of the Chotanagpur
Gneissic terrain of eastern peninsular India. The recycled Vindhyan systems, the Aravalli
Belt and the Bundhelkhand Granite could be potential sources of the ZTR grains.
9.4 MICROPROBE ANALYSIS
Garnets
Garnets are found mostly in the Sisne and Taltung formations in the western part
of Nepal, and the Saptakoshi Formation and Katari Group in the eastern part of Nepal.
The garnets are mostly almandine rich. Pyrope is significantly high in garnet from the
Taltung Formation. Grossular content is high for some samples from the Saptakoshi
Formation. As most of the garnet grains are rich in almandine, these grains were derived

153
from a low-grade metamorphic source rocks. The high pyrope contents in the Taltung
Formation may reflect high grade metamorphic source rock.
Tourmaline
On the Ca-Fe(tot)-Mg plot, the Katari Group tourmaline show high variations
reflecting three different source rock types: Li-rich granitoid pegmatites, Li-poor
granitoid pegmatites, and Ca-poor metapelites, metapsammites. Tourmaline from the
Barahachettra (the Tamrang Formation) and Tansen group fall in within the Li-poor
granitoid pegmatites and Ca-poor metapelites, and metapsammite fields.
Chrome Spinel
Chrome spinels are not very common in the Gondwanan sequence of the Nepal
Himalaya. Chrome-spinel was found only in the Taltung sandstones. These chrome
spinels contain high aluminum and high chromium, suggesting a source from an Alpine-
type peridotite. Low percentages of TiO2 contents suggest that alkaline basalts were the
source of volcanic clasts.
9.5 GEOCHEMICAL ANALYSIS
The Taltung Formation differs geochemically from other samples, which could be
due to sediment supply from the volcanic source rocks. Various ratios of major oxides
and trace elements like Al2O3/TiO2, TiO2/Zr also show that Taltung Formation is derived
from igneous sources. The Harker plot does not show any evolutionary trends. Hence, the
rock units supplying sediments to the Gondwanan basins likely were not genetically
related.

154
Discrimination analysis of the tectonic setting diagrams (Figs. 7. 9 and 7.10) show
that the Taltung Formation belongs to arc or rift zones, the Dumri and the Bhainskati
formations deposited in active continental margins, and other formations deposited
passive margin setting. Basaltic materials commonly have lower HREE, but if the basalt
is alkaline, HREE can be significantly high and contain high Eu value. The REE pattern
of the Taltung Formation is similar to the Bengal Trap alkali basalts (Fig. 9.2) (Baksi,
1995).
Figure 9.2 Chondrite normalized REE pattern of Bengal Trap Basalt (from Baksi, 1995).
9.6 40Ar/39Ar MUSCOVITE GEOCHRONOLOGY
The 40Ar/39Ar muscovite dating of the Gondwanan sandstones carried for this
study has provided two types of ages. The older ages (>40 Ma) provide cooling ages of
muscovite crystals from igneous intrusions or metamorphic events that took place in the
Indian craton. Hence, this gives the approximate ages of source rocks. In contrast,

155
younger ages (<24 Ma) given by muscovites could have one of the reasons including
misunderstanding of stratigraphy or loss of argon from the detrital muscovites. Several
older ages of detrital muscovite grains from the Gondwanan sandstone samples may be
related with the cooling ages of the Malani igneous suites (870-750 Ma), the Erinpura
granite (1700 – 1500 Ma), the Munger orogeny (400 – 320 Ma) and or alkali syenite
intrusions ( 300 Ma) in the Chotanagpur Terrain (Fig. 9.3).
The 40 Ma age found from muscovite grains in the Eocene Bhainskati Formation
(sample 15-8) indicates the source rocks from the Himalayan orogenic belt and other
older ages going up to 900 Ma indicates source rocks from Indian craton as well. 40 Ma
could refers to the cooling ages may also be related to the Gangdese batholith (Copeland
et al., 1995).
9.7 PALEOTECTONIC SETTING During the Permo-Carboniferous, West Gondwanaland had already separated
from East Gonwananland. India together with East Gonwanaland was in the southern
hemisphere around 60o S (Fig. 9.4A). Due to initial stretching along a major lineament,
the half graben basins were created in peninsular India. At the same time, towards the
northern margin of India, glacial diamictite and glacio-fluvial deposits were being
deposited.

156
Figu
re 9
.3 40
Ar/39
Ar c
oolin
g ag
es o
f sin
gle
grai
n m
usco
vite
from
the
Gon
dwan
an sa
ndst
one
of N
epal
. The
thic
k ho
rizon
tal b
ars r
epre
sent
pub
lishe
d ge
ochr
onol
ogic
al d
ata
for p
oten
tial s
ourc
e ro
cks i
n pe
nins
ular
Indi
a an
d H
imal
ayas
.

157
During the Cretaceous, Gondwanaland was positioned around 30oS latitude and
deposition was in fluvial environments. As Australia rifted from India toward east,
several hot spots formed in India (Fig. 9.4 B), including the well-known Rajmahal Trap.
Further west, more volcanic activities were taking place, including the eruption of the
Aulis Trap, which contributed volcanic clasts to the Taltung Formation.
Due to global fall of sea level during the Late Cretaceous-Paleocene, sediments
eroding from the central region of India had to cover a longer distance. Moreover, as the
Indian continent was already in a temperate zone at that time, weathering was extreme
resulting in deposition of the Amile Formation (Fig. 9.4 C).
The collision between India and Tibet occurred by the Eocene. However, there
was still a shallow sea at the backbulge of the foreland basin (DeCelles, 1998). Sediment
derived from the Himalayan belt as well as from the Indian craton towards the south were
deposited in these shallow sea (Fig. 9.4 D).
The India-Tibet collision was complete by the early Miocene, resulting in the
complete retreat of the sea. A thick pile of sediment resulting from the rapid unroofing of
the Himalayan belt was deposited in the forebulge of the foreland (Fig. 9.4 E).

158
Figure 9.4 Paleotectonic setting of India from Permo-Carboniferous to Miocene during deposition of Gondwanan and post-Gondwanan sequences (modified after Sakai, 1989; Veevers and Tiwari, 1995; DeCelles et al., 1998) (1= Delhi-Aravalli Supergroup, 2= Bundelkhand Granite, 3= Chotanagapur Gneissic Terrain).

159
9.8 CONCLUSIONS
Based on the results of Analysis done for this research following conclusions can been
drawn:
1. Gondwanan and post-Gondwanan sequences were deposited along the northern
passive margin of India from Late Carboniferous to Early Miocene.
2. In the Barahachettra area, quartzites of the Saptakoshi Formation are not Permo-
Carboniferous in age. These quartzites are equivalent to the Paleocene-late
Cretaceous Amile Formation of western Nepal. The contact between quartzites of
the Saptakoshi Formation and underlying Precambrian basement is a fault, not an
unconformity.
3. The carbonaceous quartzite beds of the Katari area also do not belong to the
Permo-Carboniferous age. Rather, based on sandstone petrography, whole-rock
geochemistry, heavy mineral analysis and mineral chemistry of this unit suggest
that they are equivalent to the Amile Formation of western Nepal.
4. The Tamrang Formation, which contains high percentage of the lithic fragments,
could be equivalent to the Eocene Bhainskati Formation of western Nepal.
5. The older detrital muscovite ages are sensibly correlated to the source rocks in the
Aravali-Delhi Supergroup, Bundelkhand Granite, and Chotanagpur Gneissic
Terrain. Source rocks from the Himalayan orogenic belts have been inferred for
the ~40 Ma ages from the Eocene Bhainskati Formation. However, the younger
muscovites ages (< 30 Ma) are difficult to explain given our present

160
understanding and the argon-retention characteristics of muscovite along with the
regional stratigraphic and tectonic constraints for the study area.
6. Further sampling from the study area is suggested to address the problem related
with younger ages. Dating of basalt flow units from all three units may give a
better control on stratigraphy. The fossil study on the Cretaceous-Paleocene units
will be also helpful to clarify the stratigraphy.

161
REFERENCES
Amatya, K.M., and Jnawali, B.M., 1994, Geological map of Nepal: Department of Mines
and Geology, Nepal, Scale 1:1000000, 1 sheet
Acharya, S.K., 2000, Coal and lignite resources of India: an overview: Geological
Society of India, Banglore, 50 p.
Amano, K., and Taira, A., 1992, Two-phase uplift of Higher Himalayas since 17 Ma:
Geology, v. 20, p. 391-394.
Auden, J. B., 1935, Traverses in the Himalaya, Record of Geological Survey of India, v.
69, p. 123–169.
Aslam, M., Arora, M., and Tewari, R.C., 1991, Heavy mineral suite in the Barakar
sandstone of Moher sub-basin, Singrauli coalfield, central India: Journal of the
Geological Society of India, v. 29, p. 66-75.
Baksi, A.K., 1995, Petrogenesis and timing of volcanism in the Rajmahal flood basalt
province, north eastern India: Chemical Geology, v. 121, p 73-90
Azmi, R.J., and Pancholi, V.P., 1983, Early Cambrian (Tommotian) conodonts and other
shelly microfauna from the Upper Krol of Mussoorie Syncline, Garhwal Lesser
Himalaya, with remarks on the Precambrian-Cambrian boundary: Himalayan
Geology, v. 11, p. 360-372.
Bateman, R.M., and Catt, J.A., 1985, Modification of heavy mineral assemblages in
English coversands by acid pedochemical weathering: Catena, v. 12, p. 1-21.
Bashyal, R.P., 1980, Phosphatic rocks of Barakhsetra Formation: 3rd International field
workshop and seminar, Khubsugul, Ulan-bator, p. 1-9.
Bashyal, R.P., 1979, The Gondwana type of formation with phosphatic rocks in
southeastern Nepal: Report Published by Department of Mines and Geology, p. 4-
18.

162
Bhatia, M., 1983, Plate tectonics and geochemical composition of sandstones: Journal of
Geology, v. 91, p. 611-627.
Bhatia, M. R., and Crook, K. A. W., 1986, Trace element chracteristics of graywacke and
tectonic setting discrimination of sedimentary basins: Contributions to
Mineralogy and Petrology, v. 92, p. 181-193.
Bock, Barbara, McLennan, S.M., and Hanson, G.N., 1998, Geochemistry and provenance
of the Middle Ordovician Austin Glen Member (Normanskill Formation) and the
Taconian Orogeny in New England: Sedimentology, v. 45, p. 635-655.
Brookfield, M.E., 1993, The Himalayan passive margin from Precambrian to Cretaceous
times: Sedimentary Geology, v. 84, p. 1-35.
Catuneanu, O., Wopfner, H., Eriksson, P.G., Carincross, B., Rubidge, B.S., Smith,
R.M.H., and Hancox, P.J., The Karoo basins of south-central Africa: Journal of
African Earth Sciences, v. 43, p. 211-253.
Clark, M.K., and Bilham, R., 2009, Miocene rise of Shilong Plateau and the beginning of
the end for the Eastern Himalaya: Earth and Planetary Science Letters, v. 269, p.
337-351.
Cookenboo, H.O., Bustin, R.M., and Wilks, K.R., 1997, Detrital chromian spinel
compositions used to reconstruct the tectonic setting of provenance: Implications
for orogeny in the Canadian Cordillera: Journal of Sedimentary Research, v. 67, p
116-123.
Condie, K. C., 1993, Chemical composition and evolution of the upper continental crust:
Contrasting results from surface samples and shale: Chemical Geology, v. 104, p.
1-37.
Cerveny, P.F., 1986, Uplift and Erosion of the Himalaya over the past 18 Million years:
Evidence from Fission Track Dating of Detrital Zircons and Heavy Mineral
Analysis, unpublished MS thesis, Dartmouth College, 198 p.

163
Cerveny, P.F., Johnson, N.M., Tahirkheli, R.A.K., and Bonis, N.R., 1989, Tectonic and
geomorphic implications of Siwalik Group heavy minerals, Tectonics of western
Himalayas: Geological Society of America Special Paper, v. 232, p. 129-136.
Chaudhary, A.K., Gopalan, K., and Sastry, C.A., 1984, Present status of the
geochronology of the Precambrian rocks of Rajasthan: Tectonophysics, v. 105,
pp. 131-140.
Chaudhri, R.S., 1972, Heavy minerals from Siwalik formations of the northwestern
Himalayas: Sedimentary Geology, v. 8, p. 77-82.
Copeland, P., Harrison, T.M., Yun, P., Kidd, W.S.F., Roden, M., and Yuquan, Z., 1995,
Thermal evolution of the Gangdese batholith, southern Tibet: A history of
episodic unroofing: Tectonics, v.14, p.223-236.
Cullers, R.L., Basu, A., and Suttner, L.J., 1988, Geochemical signature of provenance in
sand-size material in soils and stream sediments near the Tobacco Root Batholith,
Montana, U.S.A: Chemical Geology, v. 70, p. 335-348.
Dallmeyer, R.D., and A. Takasu., 1992, 40Ar/39Ar ages of detrital muscovite and whole-
rock slate/phyllite, Narragansett Basin, RI-MA, USA: implications for
rejuvenation during very low-grade metamorphism: Contributions to Minearlogy
and Petrology, v. 110, p. 515-527.
Decelles, P.G., Gehrels, G.E., Quade, J., and Ojha, T., 1998, Eocene-early Miocene
foreland basin development and the history of Himalayan thrusting, western and
central Nepal: Tectonics, v.17, p. 741-765.
Decelles, P.G., Gehrels, G.E., Najman, Y., Martin, A.J., Carter, A., Garzanti., E., 2004,
Detrital geochronology and geochemistry of Cretaceous-Early Miocene strata of
Nepal: implications for timing and diachroneity of initial Himalayan orogenesis:
Earth and Planetary Science Letters, v. 277, p. 313-330.
Deer, W.A., Howie, R.A., and Zussman, J., 1992, An introduction to the rock-forming
minerals: Longman Scientific Technical, Harlow, United Kingdom, 696 p.

164
Dhital, M.R., and Kizaki, K., 1987, Lithology and Stratigraphy of The Northern Dang,
Lesser Himalaya: Bulletin of College Sciences, University of Ryukus, v. 45, p.
183-244.
Dhital, M. R., 1992, Lithostratigraphic comparison of three diamictite successions of
Nepal Lesser Himalaya: Journal of Nepal Geological Society, v. 8, p. 43–54.
Dhital, M.R., unpublished, The study of Gondwana type of rock in eastern Nepal Lesser
Himalaya, (report submitted to Nepal Academy of Science and Technology), 38
p.
Dickin, A.P., 1995, Radiogenic Isotope Geology: New York, Cambridge Press, 452 p.
Dickinson, W.R., 1970, Interpreting detrital modes of greywacke and arkose: Journal of
Sedimentary Petrology, v. 40, p. 695-707.
Dickinson, W.R., and Suczek, C., 1979, Plate Tectonics and Sandstone compositions:
American Association of Petroleum Geologists Bulletin, v. 63, p. 2164-2182.
Dickinson, W.R., 1985, Interpreting provenance relations from detrital modes of
sandstones, in Zuffa, G.G., ed., Reading Provenance from Arenites: Dordecht,
The Netherlands, Riedel, p. 333-361.
Dick, H.J.B., and Bullen, T., 1984, Chromian spinel as a petrogenetic indicator in abyssal
and alpine-type peridotites and spatially associated lavas: Contributions to
Mineralogy and Petrology, v. 86, p. 54-76.
Dorsey, R. J., 1988, Provenance evolution and unroofing history of a modern arc-
continent collision: Evidence from petrography of Plio-Pleistocene sandstones,
eastern Taiwan: Journal of Sedimentary Petrology, v. 58, p. 208-218.
Dryden, A.L., and Dryden, C., 1946, Comparative rates of weathering of some common
heavy minerals: Journal of Sedimentary Petrology, v. 16, p 91-96.
Dutta, P., 2002, Gondwana lithostratigraphy of Peninsular India: Gondwana Research
(Gondwana Newsletter Sec), v. 5, p. 540-553.

165
Dutta, P.K., and Ghosh, S.K., 1993, The century old problem of the Pali–Parsora –Tiki
stratigraphy and its bearing on the Gondwana classification of Peninsular India.
Journal Geological Society of India, v. 42, p. 17–31.
Faure, G., 1986, Principles of Isotope Geology, second edition: New York, John Wiley
and Sons, 589 p.
Fleet, W.F., 1926, Petrological notes on the Old Red Sandstones of the West Midlands:
Geological Magazine, v. 63, p. 505-516.
Frakes, L.A., Kemp, E.M., and Crowell, J.C., 1975, Late Paleozoic Glaciation: Part VI,
Asia, Geological Society of America Bulletin, v. 86, p. 454-464
Freise, F.W., 1931, Untersuchung von Mineralen auf Ab-nutzbarkeit bei Verfrachtung im
Wasser: Tschermaks Mineralogy of Petrology, v. 41, p. 1-7
Friedenreich, O.R., Slind, O.L., Pradhan, U. M.S. and Shrestha, R.B., 1994, Petroleum
Geology of Nepal; Canadian Journal of Exploration Geophysics, v. 30, p. 103-
114.
Gansser, A., 1983, The morphogenic phase of mountain building, in Hsu, K.J., eds.,
Mountain building processes: Academic Press, London, p. 221-28.
Garzanti, E., Vezzoli, G., Ando, S., Lave, J., Attal, M., France-Lanord, C., and DeCelles,
P., 2007, Quantifying sand provenance and erosion (Marsyandi River, Nepal
Himalaya): Earth and Planetary Science Letters, v. 258, p. 500-515.
Gizbert,, C.S., Burchfiel, B.C., Li, Z., and Chen, Z., Early Tertiary Gonjo basin, eastern
Tibet: Sedimentary and structural record of the early history of India-Asia
collision: Geosphere, v. 4, p. 713-735
Graham, S.A., Ingersoll, R.V., and Dickinson, W.R., 1976, Common provenance for
lithic grains in Carboniferous sandstones from Ouachita Mountains and Black
Warrior Basin: Journal of Sedimentary Petrology, v. 46, p. 620-632.

166
Gray, D.R., Foster, D.A., Meert, J.G., Goscombe, B.D., Armstrong, R.,Truow, R.A.J.,
and Passchier, C.W., (in press), A Damaran perspective on the assembly of
southwestern Gondwana: Geological Society of London, special publication,
Grimm, W.D., 1973, Stepwise heavy mineral weathering in the resiudal quartz gravel,
Bavarian Molasse (Germany): Contribution to Sedimentology, v. 1, p 103-125
Gotze, J., 1998, Geochemistry and provenance of the Altendorf feldspathic sandstone in
the Middle Bunter of the Thuringian basin (Germany): Chemical Geology, v. 150,
p. 43-61.
Hames, W.E., and Bowring, S.A., 1994, An empirical evaluation of the argon diffusion
geometry in muscovite: Earth and Planetary Science Letters, v. 124, p. 161-167
Hames, W.E., and Cheney, J.T., 1997, On the loss of 40Ar* from muscovite during
polymetamorphism*: Geochimica et Cosmochemica Acta, v. 61, p. 3863-3872
Hayashi, K. I., H.Fujisawa, Holland, H. D., and H.Ohmoto, 1997b, Geochemistry of 1.9
Ga sedimentary rocks from northeastern Labrador, Canada: Geochimica et
Cosmochimica Acta, v. 61, p. 4115–4137.
Henry, D.J., and Dutrow, B.L., 1992, Tourmaline as a low grade clastic metasedimentary
rock: an example of the petrogenetic potential of tourmaline: Contributions to
Mineralogy and Petrology, v. 112, p. 203-218.
Henry, D.J., and Guidotti, C.V., 1985, Tourmaline as a petrogenetic indicator mineral: an
example from the staurolite grade metapelites of NW Maine: American
Mineralogists, v. 70, p. 1-15.
Hess, H.H., 1966, Notes on operation of Frantz isodynamic magnetic separator, Princeton
University: User manual guide, 6 p.
Hodges, K.V., Rhul, K.W., Wobus, C.W., and Pringle, M.S., 2005, 40Ar/39Ar
thermochronology of the detrital minerals, in Thermochronology, Reviews in
Mineralogy and Geochemistry, Reiners, P.W., and Ehlers, T.A., eds.,
Mineralogical Society of America, Washington, D.C., v. 58, p. 235-257.

167
Hossain, H.M.Z., Islam, M.S.U., Ahmed, S.S., and Hossain, I., 2002, Analysis of
sedimentary facies and depositional environemnts of the Permian Gondwana
sequence in borehole GDH-45, Khalaspir Basin, Bangladesh: Geosciences
Journal, v. 6, n. 3, p. 227-236
Hubbard, M., and Harrison, T.M., 40Ar/39Ar Age Constraints on the Deformation and
metamorphism in the Main Central Thurst zone: Tectonics, v. 8, p 865-880
Ingersoll, R.V., Bullard, T.F., Ford, R.L., Grimm, J.P., Pickle, J.D., and Sares, S.W.,
1984, The effect of grain size on detrital modes: A test of the Gazzi-Dickinson
point-counting method: Journal of Sedimentary Petrology, v. 54, p. 103-116.
Ingersoll, R.V., and Suczek, C.A., 1979, Petrology and provenance of Neogene sand
from Nicobar and Bengal Fans, DSDP sites 211 and 218: Journal of Sedimentary
Research, v. 49, p. 1217-1228.
Ingersoll, R.V., Graham, S.A., and Dickinson, W.R., 1995, Remnant ocean basins, in
Busby, C.J., and Ingersoll, R.V., eds., Tectonics of sedimentary basins: Blackwell
Science, Cambridge, p. 363-391.
Irvine, T.N., 1974, Petrology of the Duke Island ultramafic complex, southern Alaska:
Geological Society of America Bulletin, v. 138, p. 240.
Irvine, T.N., 1977, Origin of chromite layers in the Muskox Intrusion and other stratiform
intrusions; a new interpretation: Geology, v. 5, p. 273-277.
Jain, S.P., and Kanwar, R.C., 1970, Himalayan ridge in the light of the theory of
continental drift: Nature, v. 227, p. 829
Johnsson, M.J., 1993, The system controlling the composition of clastic sediments, in
Johnsson, M.J. and Basu, A., eds., Processes controlling the composition of
clastic sediments: Geological Society of America Special Paper 284, p. 1-19.
Kayastha, N.B., 1992, Stratigraphy of the lower Tertiary rocks of Nepal Himalaya:
Journal of Nepal Geological Society, v. 8, p. 21-30

168
Kent, R.W, Pringle, M.S., Muller, R.D., Saunders, S.D. , Ghose, N.C., 40Ar/39Ar
Geochronology of the Rajmahal Basalts, India, and their Relationship to the
Kerguelen Plateau: Journal of Petrology, v. 43, p. 1141-1153
Khan, A.A., Sattar, G.S., Rahman, T., 1994, Tectogenesis of the Gondwana rifted basins
of Bangladesh in the so-called Garo-Rajmahal gap and their pre-drift regional
tectonic correlation: Ninth International Gondwana Symposium, p 647-655.
Krauskopf, K. B., and D. K. Bird, 1995, Introduction to geochemistry: McGraw-Hill,
New York, 647 p
Kumar, P., 2004, Provenance history of Cenozoic sediments near Digboi-Margherita
area, eastern syntaxis of the Himalayas, Assam, northeast India [M.S. Thesis]:
Auburn University, Auburn, Alabama, 131 p.
Kumar, R., 1998, Fundamental of historical geology and stratigraphy of India, New Age
International Publishers, p. 176-188
Le Fort, P., 1996, Evolution of the Himalaya, in Yin, A., and Harrison, M., eds., The
tectonic evolution of Asia: New York, Cambridge University Press, World and
Regional Geology Series, p. 95-109.
Ludwig, K.R., 2003, User’s manual for Isoplot, v. 3.0, a geochronological toolkit for
Microsoft Excel: Berkeley Geochronological Center, Special Publication no. 4.
Mahadevan, T.M., 2002, Geology of Bihar and Jharkhand: Geological Society of India,
Bangalore, 563 p.
Mange, M. A., and Maurer, H. F. W., 1992, Heavy minerals in color.: London, Chapman
& Hall, London, 147 p.
Matchan, E., 2008, The age, geochemisty and petrogenesis of an unusual alkaline
intrusion in the western Pilbara craton, Western Australia: 9th International
Kimberlinte Conference Extended Abstract
McDougall, I., and Harrison, M.T., 1999, Geochronology and thermochronology by the 40Ar/39Ar method: New York, Oxford University Press, 269 p.

169
McLennan, S.M., Taylor, S.R., McCulloch, M.T., Maynard, J.B., 1990, Geochemical and
Nd-Sr isotopic composition of deep-sea turbidites: Crustal evolution and plate
tectonic associations, Geochemica et Cosmochemica Acta, v. 54. p. 2015-2050.
McLennan, S. M., Hemming, S., McDaniel, D. K., and Hanson, G. N., 1993,
Geochemical approaches to sedimentation, provenance and tectonics. in Johnson,
M. J., Basu, A., eds, processes controlling the composition of the clastic
sedimemts: Geological Society of America., Boulder, Colorado, Special Paper, v.
284, p. 21-40.
Medlicott, H. B., 1864, On the geological structure and relations of the southern portion
of the Himalayan ranges between the rivers Ganges and the Ravee: Memoire of
Geological Survey of India, v. 3, p. 1–212.
Merrihue, C., and Turner, G., 1966, Potassium-argon dating by activation with fast
neutrons: Journal of Geophysical Research, v. 71, p. 2852-2856.
Morton, A.C., 1984, Stability of detrital heavy minerals in Tertiary sandstones of the
North Sea Basin: Clay Mineralogy, v. 19, p 287-308.
Morton, A.C., 1985, Heavy minerals in provenance studies, in Zuffa, G.G., eds.,
Provenance of Arenites: Boston, D. Reidel Publishing Company, p. 249-277.
Morton, A.C., 1986, Dissolution of apatite in North Sea Jurassic sandstone: implications
for the gengeration of secondary porosity: Clay Mineralogy, v. 21, p 711-733.
Morton, A. C., and Hallsworth, C., 1994, Identifying provenance-specific features of
detrital heavy mineral assemblages in sandstones: Sedimentary Geology, v. 90, p.
241-256.
Morton, A.C., and Hallsworth, C.R., 1999, Processes controlling the composition of
heavy mineral assemblages in sandstones: Sedimentary Geology, v. 124, p. 3-30..
Morton, A.C., and Taylor, P.N., 1991, Geochemical and isotopic constraints on the nature
and age of basement rocks from Rockall Bank, NE Atlantic: Journal of the
Geological Society, London, v. 148, p. 630-634.

170
Najman, Y., and Garzanti, E., 2000, Reconstructing early Himalayan tectonic evolution
and paleogeography from Tertiary foreland basin sedimentary rocks, northern
India: Geological Society of America Bulletin, v. 112, p. 435-449.
Najman, Y., Carter, A., Oliver, G., Garzanti, E., 2005, Provenance of Eocene foreland
basin sediments, Nepal: Constraints to the timing and diachroneity of early
Himalayan orogenesis: Geology, v. 33, p. 309-312.
Najman, Y., 2005, The detrital record of orogenesis: A review of approaches and
techniques used in the Himalayan sedimentary basins: Earth Science Reviews, v.
74, p. 1-72.
Nanayama, F., 1997, An electron microprobe study of the Amazon Fan: Proceedings of
the Ocean Drilling Program, Scientific Results, v. 155, p. 147-168.
Nance, W.B., and Taylor, S.R., 1977, Rare earth element patterns and crustal evolution-II
Archean sedimentary rocks from Kalgoorlie, Australia: Geochemicia et
Cosmochimica Acta, v. 41. p 225-231.
Nandi, K., 1967, Garnets as indices of progressive regional metamorphism:
Mineralogical Magazine, v. 36, p. 89-93.
Naqvi, S.M., 2005, Geology and Evolution of the Indian Plate: Capital Publishing
Company, 450 p.
Nesbitt, H.W., and Young, G.M., 1984, Prediction of some weathering trends of plutonic
and volcanic rocks based on thermodynamic and kinetic considerations:
Geochimcia Cosmochimcia Acta, v. 48, p.1523–1548.
Nixon, G.T., Cabri, L.J., and Laflamme, J.H.G., 1990, Platinum-group-element
mineralization in lode and placer deposits associated with the Tulameen
alaskantype complex, British Columbia: The Canadian Mineralogist, v. 28, p.
503-535.
Osae, S., Asiedu, D.K., Yakubo, B.B., Koeberl, C., and Dampare, S.B., 2005, Provenance
and tectonic setting of Late Proterozoic Buem sandstones of southeastern Ghana:
171
Evidence from geochemistry and detrital modes: Journal of African Earth
Sciences, v. 44, p. 85-96.
Pettijohn, F.J., 1941, Persistence of heavy minerals and geologic age: Journal of Geology,
v. 49, p 610-625.
Pilgrim, G.E., West, W.D., 1928, The structure and correlation of the Simla rocks:
Memoire of the Geological Survey of India 53, 140 p.
Potter, P.E., 1978, Petrology and Chemistry of Modern Big River Sands: Journal of
Geology, v. 86, p. 423-449.
Le Fort, P., 1996, Evolution of Himalaya, in Yin, A., and Harrison, M., eds., Tectonic
Evolution of Asia: World and regional geology series, Cambridge University
Press, p. 95-107.
Rahman, M. J. J., and Suzuki, S., 2007, Geochemistry of sandstones from the Miocene
Surma Group, Bengal Basin, Bangladesh: Implications for Provenance, tectonic
setting and weathering: Geochemical Journal, v. 41, p. 415-428
Rahman, M.W., 2008, Sedimentation and tectonic evolution of Cenozoic sequence from
Bengal and Assam foreland basin, Eastern Himalayas [Unpublished M.S. Thesis]:
Auburn, Auburn University, 180 p.
Renne, P.R., Swisher, C.C., Deino, A.L., Karner, D.B., Owens, T.L., and DePaolo, D.J.,
1998, Intercalibration of standards, absolute ages, and uncertainties in 40Ar/39Ar dating:
Chemical Geology, v. 145, p. 117-152.
Rollinson, 1993, Using geochemical data: evaluation, presentation, interpretation:
Longman Scientific and Technical and J. Wiley & Sons, 352 p.
Roser, B. P., and Korsch, R. J., 1988, Provenance signatures of sandstone-mudstone
suites determined using discriminant function analysis of major-element data
Chemical Geology, v. 67, p. 119-139.

172
Sakai, H., 1983, Geology of the Tansen Group of the Lesser Himalaya in Nepal: Memoirs
of the Faculty Science, Kyushu University, Series D, v. XXV (1), p. 27-74.
Sakai, H., 1989, Rifting of the Gondwanaland and uplifting of the Himalayas recorded in
Mesozoic and Tertiary fluvial in the Nepal Himalayas in Taira, A. and Masuda,
F., eds., Sedimentary Faceis in the Active Plate Margin, p. 723-732.
Sakai, H., 1999, Inverted metamorphism in the Pre-Siwalik foreland basin sediments
beneath the crystalline nappe, western Nepal Himalaya: Journal of Asian Earth
Sciences, v. 17, p. 727-739.
Scherer, A., 2007, 40Ar/39Ar dating and errors, www.geoberg.de, (June, 2009)
Segev, A., 2002, Flood basalts, continental breakup and the dispersal of Gondwana:
evidence for periodic migration of upwelling mantle flows (plumes): EGU
Stephen Mueller Special Publication Series, v. 2, p. 171-191.
Selley, R.C., 1998, Elements of Petroleum Geology: 2nd edition, Academic Press,
London, 470 p.
Sharma, T., Kansakar, D.R., Kizaki, K., 1984, Geology and tectonics of the region
between Kali Gandaki and Bheri rivers in central west Nepal: Bulletin of the
College of Science University of the Ryukyus, v. 38, p. 57-102.
Shrestha, S.B., Shrestha, J.N., Sharma, S.R., 1987, Geological map of mid-western Nepal
(scale: 1250,000): Department of Mines and Geology, Kathmandu.
Singh, S.P., 1998, Precambrian stratrigraphy of Bihar-An overview in The Indian
Precambrian. Paliwal, B.S., eds., Scientific Publication of India, p. 376-408
Sinha, R.N., and Sastri, V.V., 1973, Correlation of the Tertiary geosynclinal sediments of
the Surma Valley, Assam, and Tripura state (India): Sedimentary Geology, v. 10,
p. 107-134.
Spear, F.S. and Cheney, J.T., 1989, A petrogenetic grid for pelitic schists in the system
SiO2 - Al2O3 - FeO - MgO - K2O - H2O: Contributions to Mineralogy and
Petrology, v. 101, p. 149-164.

173
Soreghan, M. J., and Soreghan, G. S. L., 2007, Whole-rock geochmistry of upper
Paleozoic loessite, western Pangaea: Implication for paleo-atmospheric
circulation: Earth and Planetary Science Letters, v. 255, p. 117-132.
Strut, B.A., 1962, The composition of garnets from pelitic schists in relation to the grade
of regional metamorphism: Journal of Petrology, v. 3, p. 181-191.
Sugitani, K., Yamashita, F., Nagako, T., Yamamota, K., Minami, M., Mimura, K., and
Suzuki, K., 2006, Geochemistry and sedimentary petrology of Archean clastic
sedimentary rocks at Mt. Goldsworthy, Pilbara Craton, Western Australia:
Evidence for the early evolution of continental crust and hydrothermal alteration:
Precambrian Research, v. 147, p. 124-147
Suttner, L.J., 1974, Sedimentary petrologic provinces: An evaluation, in Ross, C.A., eds.,
Paleogeographic Provinces and Provincialtiy, Society of Economic
Paleontologists and Mineralogists, special publication, v. 21, p. 75-84.
Taylor, S. R., and McLennan, S. M., 1985, The continental crust: Its composition and
evolution: Oxford, Blackwell Scientific Publication, 312 p.
Tucker, M., 1988, Techniques in Sedimentology: Blackwell Scientific Publications,
London, 395 p.
Uddin, A., Hames, W.E., Rahman, M.W., and Zahid, K.M., 2007, Rapid middle Miocene
denudation of the eastern Himalayas: Laser 40Ar /39Ar age constraints on Miocene
sequences from the Bengal basin: Geological Society of America, Abstracts with
Programs, v. 39, p. 592.
Uddin, A., and N., Lundberg, 1998, Cenozoic history of the Himalayan-Bengal system:
Sand composition in the Bengal basin, Bangladesh: Geological Society of
America Bulletin, v. 110, p. 497-511.
Upreti, B.N., 1999, An overview of the stratigraphy and tectonics of the Nepal Himalaya:
Journal of Asian Earth Sciences, v. 17, p. 577-606.
174
Vail, P.R., Mitchum, R.M. and Thompson, S., 1977, Seismic stratigraphy and global
changes of sea-level, Part 4: Global cycles of relative changes of sea-level:
American Association of Petroleum Geologists Memoir, v. 26, p. 83-97.
Valdiya, K.S., 1997, Himalaya, the Northern Frontier of East Gondwanaland: Gondwana
Research, v. 1, no, 1, p. 3-9.
Veevers, J.J., and Tiwari, R.C., 1995, Gondwana Master Basin of peninsular India
between Tethys and the interior of the Gondwanaland province of Pangea:
Memoir of Geological Society of America, v. 187, 71 p.
Veevers, J.J., 2006, Updated Gondwana (Permian-Cretaceous) earth history of Australia:
Gondwana Research, v. 9, p. 231-260.
Velbel, M.A., 1985, Mineralogically mature sandstone in accretional prisms: Journal of
Sedimentary Petrology, v. 55, p. 685-690.
Wadia, D.N., 1919, Geology of India, 3rd edition, Macmillan and Co Ltd., London, 536
p.
Wanke, H., and Konig, H., 1959, Eine neue Methode zur Kalium-Argon-
Altersbestimmung und ihre Anwendung auf Steinmeteorite: Z. Naturforschung, v.
14a, p. 860 – 866.
Willan, R.C.R., 2003, Provenance of Triassiac-Cretaceous sandstones in the Antartic
peninsula: implications for terrance models during Gondwana breakup: Journal of
Sedimentary Research, v. 73, p. 1062-1077
Yokoyama, K., Taira, A., and Saito, Y., 1990, Mineralogy of silts from the Bengal Fan:
Proceedings of Ocean Drilling Programs, Scientific Results, v. 116, p. 59-73.
Zahid, K.M., 2005, Provenance and basin tectonics of Oligocene-Miocene sequences of
the Bengal Basin, Bangladesh [M.S. Thesis]: Auburn University, Auburn,
Alabama, 142 p.
Zhu, B., Delano, J.W., and Kidd, S.F.W., 2005, Magmatic compositions and source
terranes estimated from melt inclusions in detrital Cr-rich spinels: An example

175
from mid-Cretaceous sandstones in the eastern Tethys Himalaya: Earth and
Planetary Science Letters, v. 233, p. 295-309.
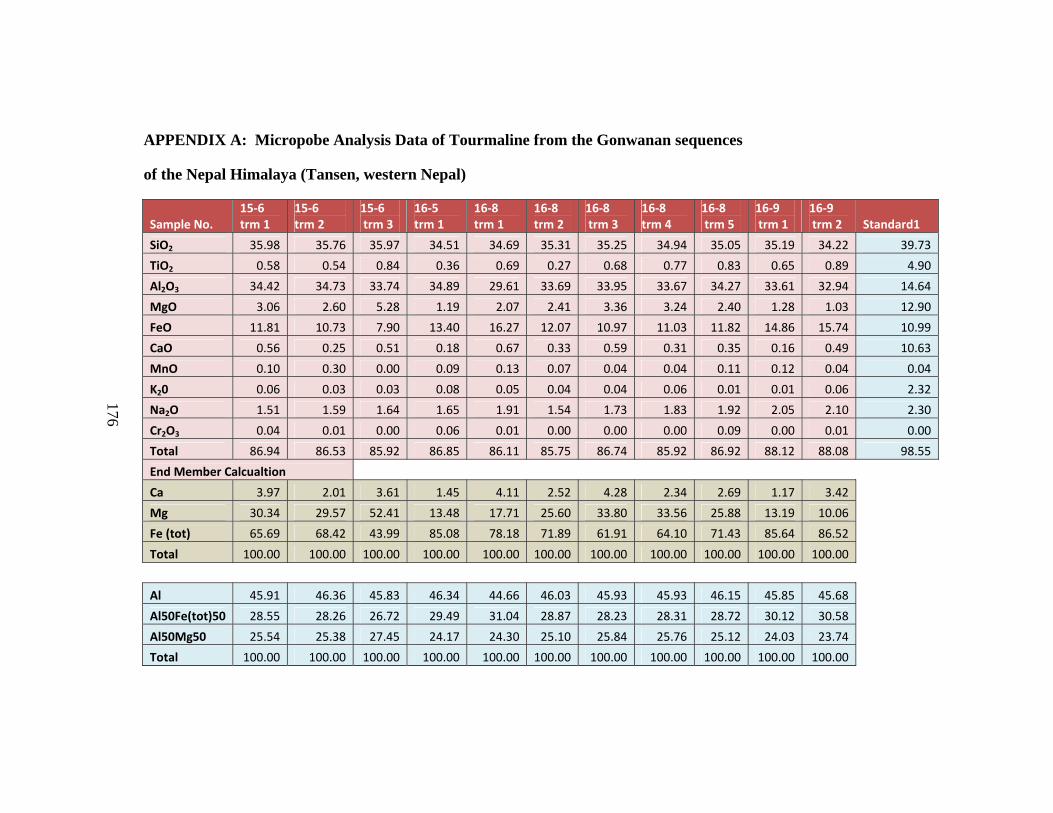
176
APPENDIX A: Micropobe Analysis Data of Tourmaline from the Gonwanan sequences
of the Nepal Himalaya (Tansen, western Nepal)
Sample No. 15‐6 trm 1
15‐6 trm 2
15‐6 trm 3
16‐5 trm 1
16‐8 trm 1
16‐8 trm 2
16‐8 trm 3
16‐8 trm 4
16‐8 trm 5
16‐9 trm 1
16‐9 trm 2 Standard1
SiO2 35.98 35.76 35.97 34.51 34.69 35.31 35.25 34.94 35.05 35.19 34.22 39.73
TiO2 0.58 0.54 0.84 0.36 0.69 0.27 0.68 0.77 0.83 0.65 0.89 4.90
Al2O3 34.42 34.73 33.74 34.89 29.61 33.69 33.95 33.67 34.27 33.61 32.94 14.64
MgO 3.06 2.60 5.28 1.19 2.07 2.41 3.36 3.24 2.40 1.28 1.03 12.90
FeO 11.81 10.73 7.90 13.40 16.27 12.07 10.97 11.03 11.82 14.86 15.74 10.99
CaO 0.56 0.25 0.51 0.18 0.67 0.33 0.59 0.31 0.35 0.16 0.49 10.63
MnO 0.10 0.30 0.00 0.09 0.13 0.07 0.04 0.04 0.11 0.12 0.04 0.04
K20 0.06 0.03 0.03 0.08 0.05 0.04 0.04 0.06 0.01 0.01 0.06 2.32
Na2O 1.51 1.59 1.64 1.65 1.91 1.54 1.73 1.83 1.92 2.05 2.10 2.30
Cr2O3 0.04 0.01 0.00 0.06 0.01 0.00 0.00 0.00 0.09 0.00 0.01 0.00
Total 86.94 86.53 85.92 86.85 86.11 85.75 86.74 85.92 86.92 88.12 88.08 98.55
End Member Calcualtion
Ca 3.97 2.01 3.61 1.45 4.11 2.52 4.28 2.34 2.69 1.17 3.42
Mg 30.34 29.57 52.41 13.48 17.71 25.60 33.80 33.56 25.88 13.19 10.06
Fe (tot) 65.69 68.42 43.99 85.08 78.18 71.89 61.91 64.10 71.43 85.64 86.52
Total 100.00 100.00 100.00 100.00 100.00 100.00 100.00 100.00 100.00 100.00 100.00
Al 45.91 46.36 45.83 46.34 44.66 46.03 45.93 45.93 46.15 45.85 45.68
Al50Fe(tot)50 28.55 28.26 26.72 29.49 31.04 28.87 28.23 28.31 28.72 30.12 30.58
Al50Mg50 25.54 25.38 27.45 24.17 24.30 25.10 25.84 25.76 25.12 24.03 23.74
Total 100.00 100.00 100.00 100.00 100.00 100.00 100.00 100.00 100.00 100.00 100.00

177
APPENDIX B: Micropobe Analysis Data of Tourmaline from the Gonwanan sequences
of the Nepal Himalaya (Katari and Brahachettra groups, eastern Nepal)
Sample No. 22‐10 trm 1
22‐10 trm 2
22‐10 trm 3
23‐4 trm 1
23‐4 trm 2
23‐4 trm 3
23‐4 trm 4
23‐4 trm 5
26‐8 trm 1
26‐8 trm 2
26‐8 trm 3 Standard
SiO2 34.90 36.12 34.98 35.98 35.21 35.98 35.25 34.73 36.20 34.13 35.82 39.73
TiO2 0.92 0.11 0.74 0.65 0.82 0.51 0.31 0.10 0.19 0.28 0.16 4.90
Al2O3 35.01 34.56 34.84 33.45 31.88 31.12 34.22 34.03 36.23 32.86 35.67 14.64
MgO 4.58 0.99 3.12 4.12 6.45 5.46 2.12 0.70 2.57 0.12 2.47 12.90
FeO 8.95 13.32 11.30 9.60 8.17 10.25 11.87 14.26 11.05 16.69 11.28 10.99
CaO 0.61 0.03 0.53 0.13 0.60 0.69 0.22 0.19 0.15 0.14 0.08 10.63
MnO 0.05 0.00 0.07 0.02 0.07 0.05 0.16 0.10 0.00 0.15 0.16 0.04
K20 0.04 0.00 0.01 0.04 0.00 0.04 0.02 0.03 0.02 0.09 0.02 2.32
Na2O 1.74 1.27 1.61 1.93 2.21 1.98 1.61 1.63 1.35 1.92 1.34 2.30
Cr2O3 0.00 0.00 0.02 0.05 0.01 0.06 0.00 0.00 0.00 0.10 0.02 0.00
Total 86.81 86.41 87.22 85.97 85.44 86.16 85.78 85.76 87.77 86.65 87.03 98.55
End Member Calcualtion
Ca 4.36 0.26 3.86 0.95 3.74 4.23 1.75 1.50 1.21 1.08 0.61
Mg 45.62 11.68 31.71 42.93 56.28 46.65 23.75 7.95 28.94 1.28 27.87
Fe (tot) 50.02 88.06 64.43 56.12 39.99 49.12 74.49 90.55 69.85 97.64 71.52
Total 100.00 100.00 100.00 100.00 100.00 100.00 100.00 100.00 100.00 100.00 100.00
Al 46.01 46.41 46.05 45.88 45.07 44.89 46.25 46.26 46.45 45.82 46.38
Al50Fe(tot)50 27.18 29.55 28.32 27.61 26.63 27.69 28.81 30.01 28.25 31.17 28.40
Al50Mg50 26.81 24.04 25.63 26.51 28.30 27.42 24.94 23.73 25.31 23.02 25.22
Total 100.00 100.00 100.00 100.00 100.00 100.00 100.00 100.00 100.00 100.00 100.00

178
APPENDIX C: Micropobe Analysis Data of Garnet from the Gonwanan sequences
of the Nepal Himalaya (Tansen, western Nepal)
Sample No. K‐1 Gt1
K‐1 Gt2
16‐3 Gt1
16‐3 Gt2
16‐3 Gt3
16‐5 Gt1
16‐5 Gt2
16‐5 Gt3
16‐5 Gt4 Standard
SiO2 36.45 37.13 37.77 36.85 36.89 36.01 36.57 36.28 38.61 38.58TiO2 0.28 0.24 0.01 0.02 0.00 0.04 0.00 0.02 0.00 0.1168
Al2O3 21.56 21.84 21.93 20.75 21.89 21.04 21.39 20.98 22.87 22.73MgO 6.45 6.73 7.27 1.54 7.31 1.01 2.37 1.06 9.72 10.4FeO 31.90 30.61 31.64 32.70 31.78 28.31 37.12 32.96 22.07 21.08
CaO 1.33 1.01 1.19 5.54 2.25 1.58 1.66 6.83 6.24 7.45MnO 1.14 1.02 0.95 2.75 0.33 11.78 1.84 1.44 0.99 0.6193Cr2O3 0.02 0.05 0.00 0.03 0.08 0.10 0.00 0.01 0.00 0
Total 99.14 98.63 100.77 100.19 100.53 99.88 100.96 99.57 100.51 100.97End Members
Pyrope 24.85 26.70 27.52 6.04 27.13 4.10 9.31 4.18 35.80
Almandine 68.95 68.13 67.18 72.15 66.17 64.23 81.89 73.16 45.60
Grossular 3.69 2.88 3.25 15.66 6.00 4.60 4.68 19.42 16.52
Spessartine 2.50 2.29 2.05 6.14 0.70 27.07 4.12 3.23 2.07
Total 100.00 100.00 100.00 100.00 100.00 100.00 100.00 100.00 100.00
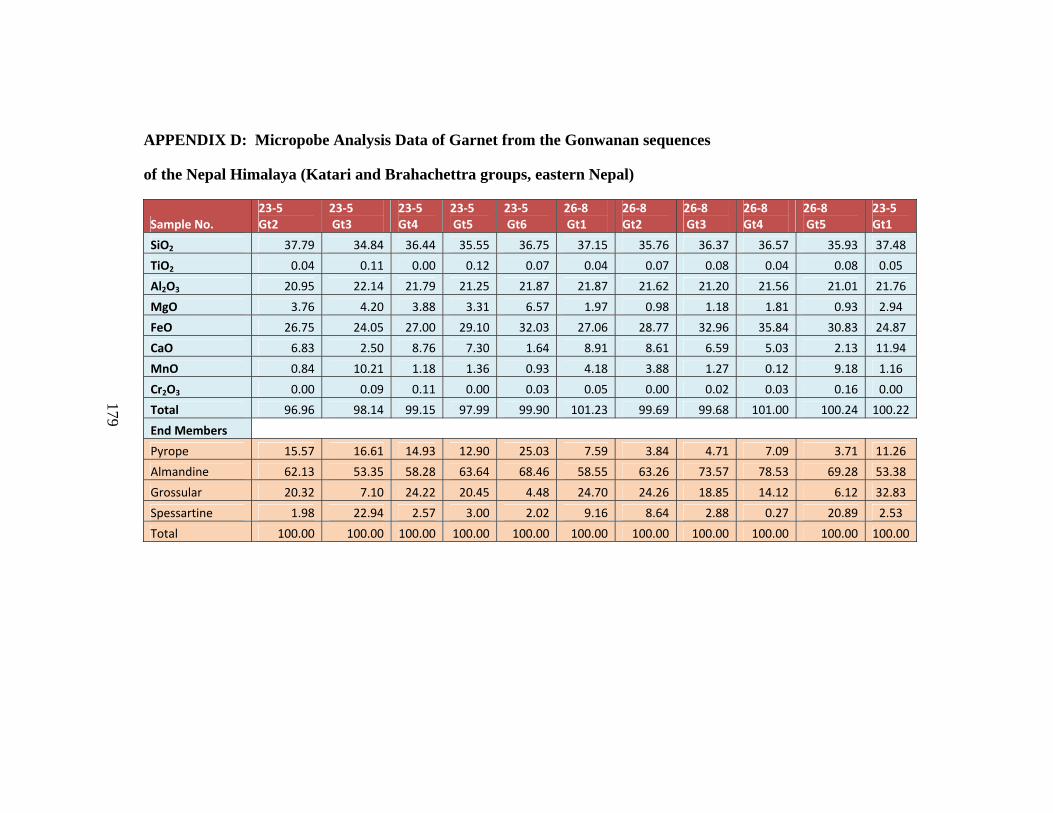
179
APPENDIX D: Micropobe Analysis Data of Garnet from the Gonwanan sequences
of the Nepal Himalaya (Katari and Brahachettra groups, eastern Nepal)
Sample No. 23‐5 Gt2
23‐5 Gt3
23‐5 Gt4
23‐5 Gt5
23‐5 Gt6
26‐8 Gt1
26‐8 Gt2
26‐8 Gt3
26‐8 Gt4
26‐8 Gt5
23‐5 Gt1
SiO2 37.79 34.84 36.44 35.55 36.75 37.15 35.76 36.37 36.57 35.93 37.48
TiO2 0.04 0.11 0.00 0.12 0.07 0.04 0.07 0.08 0.04 0.08 0.05
Al2O3 20.95 22.14 21.79 21.25 21.87 21.87 21.62 21.20 21.56 21.01 21.76
MgO 3.76 4.20 3.88 3.31 6.57 1.97 0.98 1.18 1.81 0.93 2.94
FeO 26.75 24.05 27.00 29.10 32.03 27.06 28.77 32.96 35.84 30.83 24.87
CaO 6.83 2.50 8.76 7.30 1.64 8.91 8.61 6.59 5.03 2.13 11.94
MnO 0.84 10.21 1.18 1.36 0.93 4.18 3.88 1.27 0.12 9.18 1.16
Cr2O3 0.00 0.09 0.11 0.00 0.03 0.05 0.00 0.02 0.03 0.16 0.00
Total 96.96 98.14 99.15 97.99 99.90 101.23 99.69 99.68 101.00 100.24 100.22
End Members
Pyrope 15.57 16.61 14.93 12.90 25.03 7.59 3.84 4.71 7.09 3.71 11.26
Almandine 62.13 53.35 58.28 63.64 68.46 58.55 63.26 73.57 78.53 69.28 53.38
Grossular 20.32 7.10 24.22 20.45 4.48 24.70 24.26 18.85 14.12 6.12 32.83
Spessartine 1.98 22.94 2.57 3.00 2.02 9.16 8.64 2.88 0.27 20.89 2.53
Total 100.00 100.00 100.00 100.00 100.00 100.00 100.00 100.00 100.00 100.00 100.00

180
APPENDIX E: Micropobe Analysis Data of Chrome-spinel from the Gonwanan sequences
of the Nepal Himalaya (Tansen Group, western Nepal)
Sample No. K‐1 CrSp1
K‐1 CrSp2
K‐1 CrSp3
K‐1 CrSp4
K‐1 CrSp5 Standard
SiO2 0.11 0.20 0.15 0.15 0.14 0.00
TiO2 0.80 0.21 0.29 0.89 0.68 0.11
Al2O3 36.95 40.10 42.72 35.55 41.89 23.65MgO 17.76 18.74 17.66 18.01 17.31 16.08FeO 15.99 13.57 16.29 17.04 16.78 12.65CaO 0.03 0.01 0.03 0.04 0.04 0.01MnO 0.16 0.21 0.16 0.18 0.23 0.17
Cr2O3 28.15 24.39 21.09 27.74 23.08 46.47NiO 0.21 0.20 0.20 0.14 0.02 0.14Total 100.16 97.63 98.59 99.73 100.17 99.28End Member Calculation Al3+ 64.32 69.12 72.99 63.09 71.27 Cr3+ 32.87 28.20 24.17 33.03 26.34 Fe3+ 2.80 2.68 2.83 3.88 2.39 Total 100.00 100.00 100.00 100.00 100.00 Fe3+/Fe3++Cr+Al 0.03 0.03 0.03 0.04 0.02 Mg#(Mg/Mg+Fe2+) 0.70 0.75 0.69 0.70 0.68 Cr#(Cr/Cr+Al) 0.34 0.29 0.25 0.34 0.27 TiO2 (wt%) 0.80 0.21 0.29 0.89 0.68

181
APPENDIX F: 40Ar/39Ar GEOCHRONOLOGY
Sample Name: Raju Situala Date Run: 4/3/09
Irradiation Packages: AU-12, 13
Date of
Irradiation: 1/30/2009 Monitor Age 9.879E+07 Air 40Ar/36Ar: 293.0 + 1.5 Single crystal, total fusion analyses of muscovite crystals, obtained with automated laser extraction in the ANIMAL facility. Data are in Moles; samples generally run with a sensitivity of 5.1x10⁻¹⁵ moles/volt Data are corrected for interfering nuclear reactions and blanks. Errors are the standard deviation in precision, obtained by regression or averaging of measurements (8 cycles).

182
APPENDIX F (1): 40Ar/39Ar Age data of detrital muscovite from the Katari Group (eastern Nepal, sample 26-8; Permo-Carboniferous)
n 40Ar(*+atm) 39ArK 38Ar(atm+Cl) 37ArCa 36Ar(atm) %Rad R
Age (Ma)
%-sd
11 2.9983E-15 + 1.2E-17 2.898E-15 + 6.31E-18 5.5E-18 + 1.11E-19 2.6E-18 + 6.5E-19 6.2E-19 + 1.4E-19 93.9% 0.9717 24.7 + 0.4 2%
12 1.3742E-15 + 1E-17 1.553E-15 + 5.61E-18 2.8E-18 + 7.97E-20 -1.9E-19 + 8.3E-19 4.3E-19 + 1.4E-19 90.7% 0.8026 20.4 + 0.7 3%
13 3.2175E-15 + 1.4E-17 4.056E-15 + 1.36E-17 7.5E-18 + 1.44E-19 3.3E-18 + 6.8E-19 5.1E-19 + 1.3E-19 95.3% 0.7563 19.2 + 0.3 1%
14 1.3373E-15 + 1E-17 1.119E-15 + 4.32E-18 1.8E-18 + 4.75E-20 -5.9E-19 + 5.1E-19 1.6E-18 + 1.2E-19 65.0% 0.7773 19.8 + 0.9 4%
15 8.9989E-16 + 1E-17 7.975E-16 + 3.28E-18 1.4E-18 + 5.33E-20 3.8E-18 + 1.3E-18 8.4E-19 + 1.5E-19 72.3% 0.8158 20.7 + 1.5 7%
16 2.0129E-15 + 9.4E-18 2.088E-15 + 9.31E-18 4.4E-18 + 8.7E-20 9.3E-19 + 9.5E-19 5.5E-19 + 1.1E-19 91.9% 0.8859 22.5 + 0.4 2%
17 1.486E-14 + 1.6E-17 1.212E-15 + 3.88E-18 2.2E-18 + 3.42E-20 9.3E-19 + 3.3E-19 1.9E-19 + 3.8E-20 99.6% 12.2172 290.6 + 1.0 0%
18 2.2236E-15 + 9.6E-18 2.836E-15 + 5.82E-18 6.6E-18 + 1.6E-19 2.5E-18 + 5.5E-19 8.5E-19 + 1.1E-19 88.6% 0.6949 17.7 + 0.3 2%
19 3.5085E-15 + 6.3E-18 4.670E-15 + 1.38E-17 7.4E-18 + 1.43E-19 3.9E-18 + 9.8E-19 5.8E-19 + 1.1E-19 95.1% 0.7148 18.2 + 0.2 1%
20 1.4732E-15 + 8.3E-18 1.524E-15 + 6.91E-18 3.2E-18 + 5.37E-20 4.4E-18 + 1.1E-18 1.1E-18 + 1.2E-19 77.3% 0.7474 19.0 + 0.6 3%
21 7.3014E-16 + 3.9E-18 8.25E-16 + 2.74E-18 1.4E-18 + 4.55E-20 2.1E-18 + 4.9E-19 2.6E-19 + 4.8E-20 89.5% 0.7923 20.3 + 0.5 2%
23 8.0824E-16 + 3.4E-18 1.057E-15 + 4.96E-18 4.1E-18 + 2.46E-19 2.1E-18 + 7.5E-19 1.1E-19 + 4.5E-20 95.8% 0.7322 18.8 + 0.3 2%
24 6.9889E-16 + 1.5E-18 9.637E-16 + 2.87E-18 1.7E-18 + 4.24E-20 -6E-19 + 4.6E-19 -3.6E-20 + -5E-20 101.5% 0.7362 18.9 + 0.4 2%
25 4.4652E-16 + 4.7E-18 5.955E-16 + 2.74E-18 1.6E-19 + 2.01E-20 -1.7E-18 + 9.1E-19 6.7E-20 + 5.2E-20 95.6% 0.7167 18.4 + 0.7 4%
26 3.3196E-16 + 2E-18 4.194E-16 + 1.64E-18 1E-18 + 4.71E-20 -8.9E-19 + 4.3E-19 -2.3E-20 + -4E-20 102.1% 0.8081 20.7 + 0.8 4%
27 3.511E-16 + 5.1E-18 4.472E-16 + 4.68E-18 8.5E-20 + 8.42E-21 -8.5E-19 + 6.4E-19 -1.4E-19 + -8E-20 112.0% 0.8796 22.6 + 1.4 6%
28 1.1392E-15 + 2.3E-18 1.042E-15 + 2.9E-18 2.6E-18 + 5.12E-20 2.9E-19 + 4.9E-19 1.2E-18 + 6.1E-20 68.3% 0.7464 19.2 + 0.5 2%
30 5.2395E-16 + 4.7E-18 5.584E-16 + 5.32E-18 8.9E-19 + 3.76E-20 -1.3E-18 + 4.1E-19 2.2E-21 + 4.4E-20 99.9% 0.9372 24.0 + 0.7 3%
31 9.4041E-16 + 3.2E-18 1.214E-15 + 4.06E-18 2.1E-18 + 4.22E-20 1.4E-18 + 4E-19 3.1E-19 + 4E-20 90.3% 0.6996 18.0 + 0.3 1%
32 3.032E-16 + 2.6E-18 4.023E-16 + 1.92E-18 1.2E-18 + 3.66E-20 9.8E-19 + 3.7E-19 5.6E-20 + 4E-20 94.5% 0.7124 18.3 + 0.8 4%
33 7.7194E-16 + 3.5E-18 9.039E-16 + 4.72E-18 1.6E-18 + 5.77E-20 4.9E-19 + 4.8E-19 5.7E-20 + 3.7E-20 97.8% 0.8353 21.4 + 0.3 2%
34 8.4182E-16 + 1.7E-17 8.385E-16 + 2.01E-17 1.1E-18 + 3.25E-20 9E-19 + 3.3E-19 6.1E-20 + 5.8E-20 97.9% 0.9826 25.2 + 1.0 4%
35 3.0781E-16 + 2.2E-18 3.288E-16 + 1.05E-18 7.5E-19 + 3.26E-20 9E-20 + 3.4E-19 3.1E-19 + 4.4E-20 70.1% 0.6564 16.9 + 1.0 6%

183
APPENDIX F (2): 40Ar/39Ar Age data of the detrital muscovite form the Barahachettra Group (eastern Nepal, sample 22-8, Permo-Carboniferous)
51 2.7939E-13 + 4.5E-16 6.005E-15 + 2.31E-17 1.7E-17 + 1.08E-19 4.3E-17 + 1.8E-18 5.9E-18 + 2.1E-19 99.4% 46.2327 908.9 + 3.8 0.4%
52 5.2428E-14 + 5.7E-17 5.616E-15 + 2E-17 1.3E-17 + 1.55E-19 7.2E-18 + 7.5E-19 2.1E-18 + 1.4E-19 98.8% 9.2251 221.6 + 0.9 0.4%
53 3.754E-16 + 2.3E-18 3.412E-16 + 2.5E-18 9E-19 + 2.44E-20 4.5E-19 + 2.3E-19 3E-19 + 3.5E-20 76.4% 0.8405 21.6 + 0.8 3.8%
54 3.1709E-14 + 7E-17 7.991E-16 + 5.18E-18 2.1E-18 + 7.69E-20 1.3E-18 + 4.4E-19 5.5E-19 + 9.4E-20 99.5% 39.4806 801.5 + 5.6 0.7%
55 1.5678E-15 + 4.9E-18 1.067E-15 + 7.9E-18 4.1E-18 + 2.28E-19 -6.3E-19 + 4.9E-19 8E-19 + 1E-19 84.9% 1.2483 31.6 + 0.8 2.4%
56 6.8798E-14 + 3.8E-17 1.278E-15 + 4.38E-18 4E-18 + 1.16E-19 3.7E-18 + 3.1E-19 2.8E-19 + 3.6E-20 99.9% 53.7632 1029.3 + 3.6 0.3%
57 5.8735E-15 + 9.1E-18 1.537E-15 + 2.99E-18 3.3E-18 + 6.26E-20 1.1E-18 + 6.9E-19 3.6E-19 + 8.5E-20 98.2% 3.7512 93.4 + 0.5 0.5%
58 3.665E-15 + 7.1E-18 2.881E-16 + 1.89E-18 5.5E-19 + 1.76E-20 1.7E-19 + 2.8E-19 1.8E-19 + 2.5E-20 98.6% 12.5422 297.7 + 2.1 0.7%
59 1.3314E-14 + 1.2E-17 1.082E-15 + 6.18E-18 3.6E-18 + 1.04E-19 2.2E-18 + 2.8E-19 4.6E-19 + 3.7E-20 99.0% 12.1800 289.8 + 1.7 0.6%
60 1.0247E-14 + 2.3E-17 2.818E-16 + 1.96E-18 5.6E-19 + 1.79E-20 3.3E-19 + 3E-19 1.6E-19 + 2.9E-20 99.5% 36.1982 752.9 + 5.6 0.7%
61 1.1048E-14 + 1.1E-17 2.61E-16 + 2.08E-18 3.8E-19 + 2.9E-20 1.1E-19 + 3.7E-19 4.8E-19 + 4.6E-20 98.7% 41.7783 845.4 + 7.0 0.8%
62 4.6771E-14 + 3.7E-17 1.243E-15 + 4.19E-18 3.9E-18 + 7.99E-20 4.8E-18 + 6.5E-19 5.5E-19 + 6E-20 99.7% 37.4848 774.6 + 2.7 0.3%
63 2.6937E-14 + 2E-17 5.833E-16 + 4.55E-18 2.1E-18 + 6.93E-20 4E-18 + 6.2E-19 8.1E-19 + 5.5E-20 99.1% 45.7698 908.7 + 7.2 0.8%
64 6.4939E-14 + 3E-16 1.28E-15 + 1.71E-17 4.1E-18 + 8.55E-20 5.7E-18 + 7.7E-19 9.7E-19 + 2.3E-19 99.6% 50.5106 981.2 + 14.0 1.4%
65 7.4333E-14 + 2.8E-16 1.691E-15 + 9.79E-18 3.8E-18 + 6.34E-20 1.1E-17 + 5.8E-19 4E-19 + 5.5E-20 99.8% 43.8922 879.2 + 6.1 0.7%
66 3.1208E-14 + 6.2E-17 7.521E-16 + 1.83E-18 2.4E-18 + 4.59E-20 4.4E-18 + 4.9E-19 4E-19 + 5.6E-20 99.6% 41.3403 838.3 + 2.7 0.3%
67 5.2662E-16 + 3.4E-18 1.372E-17 + 4.17E-19 -1E-19 + -5.54E-
19 3.7E-20 + 3.3E-19 -6.8E-21 + -5E-20 100.4% 38.5234 792.0 + 31.9 4.0%
68 3.1468E-14 + 3.6E-17 4.789E-16 + 1.56E-18 2.3E-18 + 6.9E-20 7.5E-18 + 6.3E-19 1.1E-18 + 6.6E-20 99.0% 65.0374 1186.7 + 4.2 0.4%
69 3.1042E-16 + 3.4E-18 2.436E-16 + 2.3E-18 9.1E-19 + 3.84E-20 2.9E-18 + 2.5E-19 4.6E-19 + 2.9E-20 56.2% 0.7161 18.4 + 1.0 5.6%
70 4.2647E-14 + 2.4E-17 8.639E-16 + 4.81E-18 4E-18 + 1.49E-19 8.3E-18 + 8.5E-19 9.4E-19 + 7.4E-20 99.3% 49.0422 959.0 + 5.4 0.6%
71 4.6713E-14 + 3.9E-17 1.079E-15 + 4.5E-18 3.3E-18 + 8.94E-20 5.2E-18 + 6.3E-19 2.6E-18 + 7.2E-20 98.4% 42.5710 858.1 + 3.7 0.4%
72 6.3681E-14 + 3.8E-17 1.658E-15 + 6.92E-18 4.2E-18 + 6.25E-20 5.7E-18 + 5E-19 2.4E-19 + 5.2E-20 99.9% 38.3750 789.5 + 3.3 0.4%
73 3.5047E-14 + 4.6E-17 9.924E-16 + 7.34E-18 3.2E-18 + 9.59E-20 5.1E-18 + 4.5E-19 3.5E-19 + 1.3E-19 99.7% 35.2096 736.0 + 5.6 0.8%
74 1.2338E-14 + 4.8E-17 4.602E-16 + 4.38E-18 1.9E-18 + 1.19E-19 4.7E-18 + 5.2E-19 5.5E-19 + 1.3E-19 98.7% 26.4552 579.1 + 6.3 1.1%

184
APPENDIX F (3): 40Ar/39Ar Age data of detrital muscovite from the Tansen Group (western Nepal, sample 16-3, Permo-Carboniferous)
76 4.8053E-15 + 6.1E-18 3.444E-16 + 4.13E-18 -1E-20 + -1.34E-21 4.7E-18 + 6.6E-19 5.7E-20 + 8.4E-20 99.7% 13.9051 327.3 + 4.3 1.3%
77 4.0994E-16 + 4E-18 4.896E-16 + 2.85E-18 6.9E-19 + 5.08E-20 7.3E-19 + 6.7E-19 1.2E-19 + 8E-20 91.4% 0.7657 19.7 + 1.3 6.4%
78 2.9399E-15 + 1.3E-17 5.36E-16 + 3.58E-18 1.3E-18 + 7.62E-20 9.5E-19 + 6E-19 1E-19 + 7.8E-20 99.0% 5.4279 134.9 + 1.5 1.1%
79 9.1023E-15 + 1.7E-17 2.587E-16 + 2.21E-18 9.8E-19 + 9.8E-20 2.2E-20 + 7.3E-19 -6.8E-20 + -8E-20 100.2% 35.2580 736.8 + 6.7 0.9%
80 6.7013E-16 + 3.7E-18 8.825E-16 + 4.01E-18 2.2E-18 + 1.08E-19 2.7E-18 + 7.1E-19 1.3E-19 + 8.8E-20 94.3% 0.7164 18.4 + 0.8 4.2%
81 5.109E-16 + 3.9E-18 3.765E-16 + 2.51E-18 3.8E-19 + 2.56E-20 -1E-19 + 6.3E-19 -1.7E-20 + -9E-20 101.0% 1.3702 35.0 + 1.8 5.1%
82 3.447E-15 + 9E-18 1.689E-16 + 1.4E-18 -2E-20 + -3.88E-21 1.2E-18 + 5.6E-19 3.5E-20 + 9.1E-20 99.7% 20.3522 461.0 + 5.4 1.2%
83 2.0933E-14 + 2.9E-17 9.185E-16 + 5.41E-18 1.9E-18 + 6.89E-20 1.9E-18 + 5.4E-19 4.7E-19 + 1E-19 99.3% 22.6374 506.2 + 3.2 0.6%
84 3.5185E-14 + 3.5E-17 3.145E-16 + 1.38E-18 3.9E-19 + 4.16E-20 1.2E-18 + 5.4E-19 5.1E-19 + 1E-19 99.6% 111.3972 1719.5 + 7.9 0.5%
85 9.8256E-17 + 8.2E-19 9.895E-17 + 5.46E-19 1.6E-19 + 2.09E-20 -2.3E-19 + 2.3E-19 5.6E-21 + 3.4E-20 98.3% 0.9762 25.0 + 2.6 10.4%
86 8.9053E-14 + 9.3E-17 1.164E-15 + 4.69E-18 4.6E-18 + 1.46E-19 1.3E-17 + 6.4E-19 2.5E-18 + 8.1E-20 99.2% 75.8617 1325.9 + 5.6 0.4%
87 1.3632E-15 + 4.4E-18 1.481E-15 + 2.1E-18 3.3E-18 + 3.75E-20 -7.3E-19 + 6.3E-19 3.1E-19 + 4.5E-20 93.3% 0.8590 22.0 + 0.2 1.1%
88 9.2332E-16 + 3.1E-18 8.69E-16 + 3.19E-18 1.9E-18 + 2.91E-20 -2E-19 + 4.4E-19 4.6E-19 + 4.4E-20 85.2% 0.9056 23.2 + 0.4 1.7%
89 2.5189E-14 + 2.1E-17 5.947E-16 + 1.04E-18 1E-18 + 3.28E-20 -5.6E-19 + 4.5E-19 1.4E-19 + 4.5E-20 99.8% 42.2863 853.5 + 1.7 0.2%
90 7.8196E-16 + 5E-18 5.74E-16 + 3.74E-18 1.2E-18 + 2.59E-20 5.3E-18 + 6.6E-19 3.4E-19 + 4.8E-20 87.1% 1.1866 30.4 + 0.7 2.4%
91 9.9713E-14 + 8E-17 9.254E-16 + 3.05E-18 3.2E-18 + 7.42E-20 6E-18 + 5.2E-19 4.5E-19 + 5.7E-20 99.9% 107.6054 1681.3 + 5.7 0.3%
92 1.0431E-14 + 6.6E-18 7.741E-16 + 2.04E-18 1.5E-18 + 4E-20 2.1E-17 + 4.5E-19 4.2E-19 + 5E-20 98.8% 13.3165 314.6 + 1.0 0.3%
93 2.6471E-16 + 6E-18 2.674E-16 + 1.34E-18 6.4E-19 + 3.04E-20 -1.4E-19 + 3.2E-19 5.4E-21 + 7.4E-20 99.4% 0.9840 25.2 + 2.2 8.6%
94 1.7893E-14 + 3E-17 1.275E-15 + 4.88E-18 2.5E-18 + 4.7E-20 1.8E-17 + 3.5E-19 7E-19 + 4.9E-20 98.8% 13.8769 326.7 + 1.4 0.4%
95 2.4941E-14 + 2.2E-17 2.248E-16 + 8.26E-19 1.5E-18 + 1.27E-19 5.8E-19 + 2.6E-19 5.5E-19 + 3.9E-20 99.4% 110.2149 1707.7 + 6.5 0.4%
96 8.8812E-14 + 5.3E-17 8.599E-16 + 3.76E-18 2.4E-18 + 5.91E-20 5.5E-18 + 4.8E-19 1.2E-18 + 7.2E-20 99.6% 102.8641 1632.5 + 7.3 0.4%
97 1.1838E-15 + 2.8E-18 9.55E-16 + 2.34E-18 1.9E-18 + 3.18E-20 6.2E-19 + 5.3E-19 1.1E-18 + 6.2E-20 73.4% 0.9093 23.3 + 0.5 2.1%
98 4.7833E-15 + 1.1E-17 3.343E-16 + 1.69E-18 9.9E-19 + 3.07E-20 3.7E-18 + 3.7E-19 4.8E-19 + 4.2E-20 97.0% 13.8845 326.9 + 2.1 0.6%
99 7.0591E-15 + 8.9E-18 6.278E-16 + 2.6E-18 1.5E-18 + 3.15E-20 2E-17 + 6.2E-19 6.5E-19 + 4.6E-20 97.3% 10.9373 262.3 + 1.3 0.5%
100 8.4636E-14 + 4.8E-17 2.131E-15 + 7.73E-18 5.9E-18 + 8.14E-20 6.1E-18 + 5.7E-19 1.6E-18 + 7.5E-20 99.4% 39.4861 807.9 + 3.0 0.4%

185
APPENDIX F (4): 40Ar/39Ar Age data of detrital muscovite from the Tansen Group (western Nepal, sample 15-8, Eocene)`
1 6.7706E-15 + 7.9E-18 6.16E-17 + 4.48E-19 6.3E-19 + 7.37E-20 8E-19 + 3.8E-19 7.7E-20 + 4.2E-20 100% 109.5987 492.7 + 3.8 0.76%
2 6.3919E-15 + 1.2E-17 1.02E-16 + 3.96E-19 6E-19 + 4.93E-20 -4.8E-19 + 5E-19 2.4E-19 + 4.5E-20 99% 62.1894 295.8 + 1.4 0.49%
3 2.89E-15 + 3.2E-18 2.75E-17 + 3.8E-19 3.4E-19 + 7.52E-20 -1.6E-18 + 3.5E-19 -5.2E-20 + -4E-20 101% 105.4777 476.4 + 6.8 1.42%
4 3.5787E-15 + 4.3E-18 3.15E-17 + 2.52E-19 3.9E-19 + 8.79E-20 -1.1E-18 + 3.2E-19 -7.2E-20 + -4E-20 101% 114.3535 511.3 + 4.4 0.86%
5 2.4316E-14 + 3.7E-17 1.27E-16 + 4.55E-19 1.3E-18 + 8.37E-20 3.7E-18 + 5.5E-19 1.8E-19 + 5E-20 100% 191.0953 787.7 + 3.1 0.40%
6 9.3613E-15 + 1.9E-17 4.00E-17 + 5.99E-19 4.5E-19 + 3.27E-20 4.8E-19 + 6.5E-19 -4.9E-20 + -5E-20 100% 234.2799 926.5 + 14.0 1.52%
7 9.2501E-15 + 9.4E-18 8.60E-17 + 8E-19 4.2E-19 + 2.43E-20 -4.7E-20 + 3.5E-19 1E-19 + 4.2E-20 100% 107.2100 483.2 + 4.6 0.95%
8 4.9712E-15 + 9.2E-18 2.25E-17 + 2.54E-19 3.1E-19 + 4.49E-20 6.5E-19 + 5.7E-19 1.3E-19 + 3.6E-20 99% 219.5829 880.4 + 10.3 1.17%
9 1.4737E-14 + 1.3E-17 6.62E-17 + 4.07E-19 5E-19 + 2.64E-20 9.3E-19 + 5.4E-19 1.7E-19 + 4.3E-20 100% 221.8770 887.7 + 5.6 0.63%
10 5.9933E-15 + 9E-18 4.31E-17 + 4.18E-19 6E-19 + 4.67E-20 9.7E-19 + 4.7E-19 8.8E-19 + 4.1E-20 96% 133.1298 582.9 + 6.1 1.05%
11 1.5281E-14 + 1.8E-17 6.71E-17 + 7.86E-19 3.2E-19 + 2.54E-20 -2.9E-19 + 4.6E-19 1.4E-19 + 4.3E-20 100% 227.1964 904.4 + 10.7 1.18%
12 8.4694E-15 + 1E-17 6.58E-17 + 5.37E-19 3.7E-19 + 3.19E-20 -9.8E-19 + 4E-19 9.6E-20 + 4.1E-20 100% 128.3320 564.9 + 4.7 0.84%
13 1.9595E-15 + 2.3E-18 2.50E-17 + 3.21E-19 2.3E-19 + 3.48E-20 -5.6E-19 + 3.9E-19 7.9E-20 + 4.1E-20 99% 77.5755 362.1 + 5.3 1.45%
14 9.5745E-15 + 9.6E-18 8.65E-17 + 5.43E-19 2.2E-19 + 1.75E-20 1.7E-19 + 4.4E-19 6.9E-20 + 4.1E-20 100% 110.4149 495.9 + 3.2 0.65%
15 2.3154E-15 + 2.2E-18 2.12E-17 + 1.68E-19 1.6E-19 + 3.06E-20 -6.6E-19 + 5.4E-19 4.6E-20 + 3.8E-20 99% 108.5661 488.6 + 4.6 0.94%
16 3.7531E-15 + 6E-18 3.39E-17 + 3.12E-19 3.9E-19 + 9.76E-20 -4.3E-19 + 5.6E-19 2.4E-19 + 6.8E-20 98% 108.5554 488.5 + 5.4 1.10%
17 1.1116E-14 + 6.7E-18 5.15E-17 + 2.82E-19 2.3E-19 + 2.6E-20 -6.6E-19 + 3.4E-19 6E-20 + 4.1E-20 100% 215.5280 867.5 + 4.9 0.56%
18 2.8996E-16 + 3E-18 3.10E-17 + 2.97E-19 5.7E-20 + 1.03E-20 8.6E-19 + 4.7E-19 3.8E-20 + 4.1E-20 96% 8.9806 45.8 + 2.1 4.64%
19 1.7357E-15 + 3.5E-18 1.76E-17 + 2.29E-19 2E-19 + 3.92E-20 9E-19 + 3.9E-19 5.4E-19 + 3.8E-20 91% 89.6522 412.4 + 6.7 1.62%
20 3.6205E-15 + 6.5E-18 3.22E-17 + 3.51E-19 1.9E-19 + 3.32E-20 1.1E-19 + 5E-19 1.8E-20 + 3.6E-20 100% 112.1908 502.8 + 5.8 1.15%
21 1.0792E-15 + 4E-18 1.07E-16 + 3.63E-19 3.2E-19 + 3.08E-20 1.6E-18 + 5.2E-19 1.4E-19 + 4.3E-20 96% 9.6949 49.4 + 0.7 1.33%
22 6.9677E-15 + 7.6E-18 2.54E-16 + 6.7E-19 7.4E-19 + 2.34E-20 9.8E-19 + 4.7E-19 1.2E-19 + 3.7E-20 100% 27.2805 135.8 + 0.4 0.33%
23 7.6207E-15 + 1.1E-17 6.12E-17 + 7.6E-19 5.1E-19 + 2.85E-20 6.3E-19 + 3.9E-19 1.3E-19 + 3.8E-20 99% 123.8114 547.7 + 6.9 1.26%
24 2.4564E-15 + 2.6E-18 2.39E-17 + 2.85E-19 2.3E-19 + 3.46E-20 2.1E-18 + 4.8E-19 2E-19 + 4.4E-20 98% 100.2078 455.3 + 6.1 1.34%
25 2.522E-14 + 2E-17 1.14E-16 + 1.01E-18 1.7E-18 + 1.9E-19 6.5E-18 + 5E-19 5.5E-19 + 6.4E-20 99% 219.8737 881.4 + 7.9 0.90%

186
APPENDIX G: Photographs of detrital muscovite grains analyzed for argon dating.
Sample 26-8 (Katari Group, eastern Nepal)
Sample 16-3 (Sisne Formation, western Nepal)
Sample 15-8 (Bhainskati Formation, western Nepal)
Top Related