


Languages
Pages
Legal


NURSES-The key to health workforce reform
Peter Brooks
AHWI
University of Melbourne

• What constitute the workforce
• Why does it need to change
• How can nurses assist in that change
• How do we help the system work together
• How do we pay for it

THE RIGHT PEOPLE
IN THE RIGHT JOB
WITH THE RIGHT SKILLS
AT THE RIGHT TIME

Australia – Health Workforce
Health and social assist 1.3 mill.-largest segment
60% fulltime
78% female
Growing – 12% increase (95-2000)

Why nurses
• Largest group
2005 2009
Clinician 222974 259786
Education 7226 9570
Researcher 1970 2325
Total 244760 276751
Over 50yrs 35.8% 36.3%

FINDINGS: Medical workforce results
Scenario 2016 (Head count) 2025 (Head count)
Supply Demand Gap Supply Demand Gap
Doctors
Comparison 93,687 89,903 3,784 109,225 111,926 -2,701
Productivity gain 93,687 87,966 5,720 109,225 106,413 2,811
Low demand 93,687 80,655 13,032 109,225 90,536 18,690
Medium self-
sufficiency 91,956 89,903 2,053 102,626 111,926 -9,300
High self-
sufficiency 90,398 89,903 495 96,686 111,926 -15,240
High demand 93,687 100,019 -6,333 109,225 135,349 -26,124
Undersupply of 5% 93,687 94,430 -744 109,225 117,615 -8,389
Capped working
hours 91,687 89,863 1,824 106,781 111,960 -5,178

FINDINGS: Nursing workforce results
Scenario 2016 (Head count) 2025 (Head count)
Supply Demand Gap Supply Demand Gap
Nurses
Comparison 296,552 316,632 -20,079 280,442 389,932 -109,490
Productivity gain 296,552 309,705 -13,153 280,442 370,435 -89,993
Low demand 296,552 282,551 14,002 280,442 311,797 -31,355
Workforce retention 318,578 316,715 1,863 367,240 392,086 -24,846
Medium self-sufficiency 292,370 316,632 -24261 260,114 389,932 -129,818
High self-sufficiency 288,606 316,632 -28,025 241,819 389,932 -148,113
High demand 296,552 353,109 -56,557 280,442 473,565 -193,122
Undersupply of 5% 296,552 329,657 -33,105 280,442 402,997 -122,555
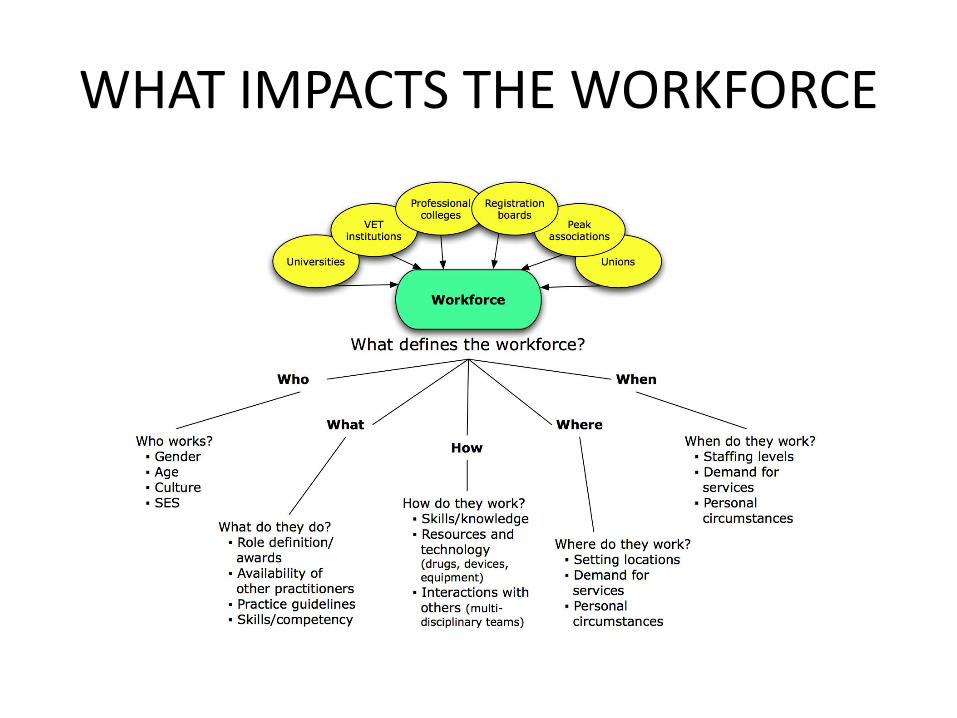
WHAT IMPACTS THE WORKFORCE

Health 20-25% of GDP by 2025 (Source: R Fogel 2004)
US doubling health expenditure by 2016 to 4.1 trillion dollars p.a.
(Source: US Medicaid Report 2007)
7 trillion dollars global
Australia – 10% GDP - $100 billion
Doubling to $200 billion by 2018

What drives health service demand
• Ageing
• Chronic disease- 30-40% of which is caused by obesity
• Unrealistic expectations from community
• Medical/ industrial complex
• Un necessary ( avoidable )care

What ‘drives ‘ the health system
• Incentives – financial / non financial
• Uncapped fee for service
• Encourages activity
• Not outcomes based ( clinical )
• Professional not patient centric
NHS- No decision about me without me -

• 1970 7.5 AT WORKING AGE PER 65+
• 2010 5
• 2050 2.7 AGED 65 OR LESS PER 65+
Intergenerational report 2010
States spending 30% annual new spend on health

The Sustainability Funnel (Coiera 2010)
• The problem of sustainability

Health system
• Hospital focused
• Driven by technology
• Little incentive for team care
• Naturally ‘conservative ‘
• Vested interests
• Has lost its ‘caring ‘
• ‘Rolls –Royce – but many just require a Mazda’
Focus on ‘Illth’ rather than health
• Hospitals
• Beds
• Acute medicine
• Waiting lists
• Issues of equity and access
• Politicians alter the structures but no real reform

Hospital beds • Aus--- 3.5/1000 pop
• OECD- 3.82/1000 pop
9.35% hosp admissions preventable
Number of procedures in hosp
162 discharges/ 1000 pop - Aus
158 OECD
138 NZ
126 US/UK
84 Canada
Gregory G 2010


CHALLENGES
• HOW DO WE USE THE NEW TECHNOLOGY EFFECTIVELY
• HEALTH APPS
• MONITORING / PATIENTS/ ENVIRONMENTS
• CARE IN AGED CARE FACILITIES
• WORKING AS TEAMS
• ROLE EXPANSION
Future Technology Trajectory
• Smaller
• Less invasive
• Convenient
• Faster
• Cheaper
• Earlier in disease cycle

• Innovation Think tank opportunity to identify new issues relating to health workforce facilitate translation of research planning into innovative practice develop position papers and then involve stakeholders Exemplar – Non Medical prescribing

Health Informatics
• Communication Technology to acquire, store, analyse, communicate and display health information
– To facilitate understanding
– To improve decision making

HEALTH WORKFORCE
• AGEING
• FEMINISED
• PARTIME
• WORKLIFE BALANCE – GENERATIONAL ISSUE
• SAFE HOURS


WHO / WHAT CONSTITUTES THE WORKFORCE
• IS IT JUST THE PROFESSIONALS
• HOW DO WE WANT TO ENGAGE PATIENTS
• PATIENT CENTRED CARE – OR IS IT HEALTH PROFESSIONAL FOCUSSED
• HOW DO WE PUT THE PATIENT AT THE CENTRE OF THE HEALTH SYSTEM

• WHAT ARE WE GOING TO BE DOING
• WHAT SKILLS DO WE NEED FOR THE 21ST C

What is the health professional of the 21st Century going to deal with?
Chronic disease
Ageing
New interventions
Communication
Cost issues
Information

What is the health professional of the 21st Century going to deal with?
Need to ‘network’
Participation of non-medical groups
in healthcare
Ambulatory vs hospital care
Patient pressure
Changing work ethos
Team care

Basic Competencies of Health
Professional for 21 Century
• Patient centred care
• Partnering
• Quality improvement
• Information and communication technology
• Public health perspective
Pruitt and Epping-Jordan
BMJ 2007, 330, 637-9
TOMORROW IS THE FIRST DAY OF THE REST OF YOUR LIFE
• What did I do yesterday that could have been done by some one else ?
• How can I prevent this referral ( hosp admission ) ?
• What could I have done to prevent this exacerbation/ disease

Health Professional Training
Core Competencies
How to evaluate (national exam)
Training for (independent) practice
Insight to limitations
Team care
Competency based rather than time based


Behaviours of high performing teams
• Shared vision
• Temporal situation awareness
• Standardised procedures
• Formalised communication
• Structured check lists
• Extensive reporting systems
• Preempt problems
• Acknowledge and address errors

HOW ARE WE GOING TO TRAIN THE FUTURE WORKFORCE
• ‘APPRENTICE ‘ MODEL
• TEACHING INSTITUTIONS OR DIFFERENT NOW
• USE MODELS FROM OTHER INDUSTRIES

Simulation
• Verbal (role playing)
• Actor/Trained Patients
• Computer based – virtual world
• Mannequins
• High end Skills Training
• Virtual hospital/environment
• Technique - Evaluate


• Does Performance integrated into practice
• Shows How Demonstration of Learning
• Knows How Interpretation Application
• Knows Fact Gathering


• TELL ME, AND I WILL FORGET
• SHOW ME, AND I MAY REMEMBER
• INVOLVE ME, AND I WILL UNDERSTAND
• CONFUCIOUS, 450BC

Models of Care
PA’S – Delegated – Generalist
NP’s – Autonomous – Specialist
Assistants
Carers
Health system ‘facilitators’/navigators
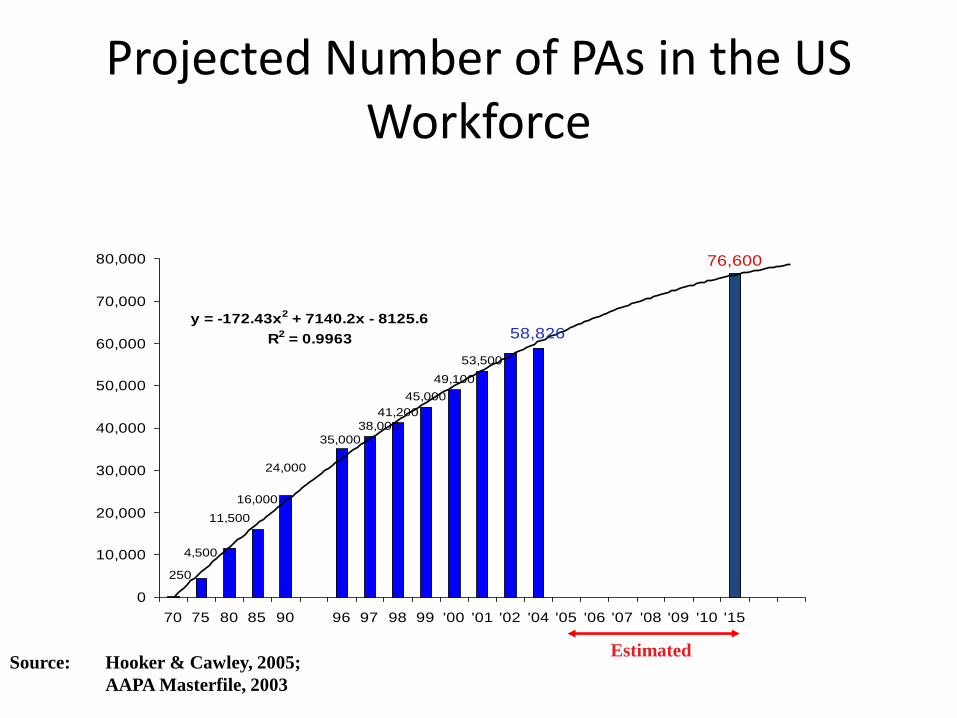
Projected Number of PAs in the US Workforce
41,200
45,000
49,100
53,500
58,826
76,600
38,000
35,000
24,000
16,000
11,500
4,500
250
y = -172.43x2 + 7140.2x - 8125.6
R2 = 0.9963
0
10,000
20,000
30,000
40,000
50,000
60,000
70,000
80,000
70 75 80 85 90 96 97 98 99 '00 '01 '02 '04 '05 '06 '07 '08 '09 '10 '15
Estimated Source: Hooker & Cawley, 2005;
AAPA Masterfile, 2003

Specialists Vs Generalists
- Need to create incentives –
Financial / kudos
To drive generalism
Training in ‘uncertainty’

THE RIGHT PEOPLE
IN THE RIGHT JOB
WITH THE RIGHT SKILLS
AT THE RIGHT TIME
• What services do we deliver
• Who delivers them
• Where /how are these services delivered
• How are we going to train
• NEED TO GET SERIOUS ABOUT PRIMARY CARE
• ISSUES OF INEQUALITY
• SOCIAL DETERMINANTS
PUT PATIENT AND PRIMARY CARE AT THE CENTRE OF THE HEALTH SYSTEM

Health workforce shortages in Australia
• DRIVEN BY AN AGEING WORKFORCE
• SUGGESTIONS OF 20000 NURSES
• ALLIED HEALTH PROFESSIONALS
• CARERS
NEED TO RECRUIT 400,000 TO HEALTH WORKFORCE BY 2025 JUST TO MAINTAIN STAFF LEVELS

• Nano Medicine
• Smart Living
• Mind/Body Bionics
• Virtual Reality Surgery
• Remote Teletreatment
• Games for Health Education
WE KNOW WHAT TO DO
• SO WHY CANT WE DO IT
• RISK AVERSE
• CONSERVATISM
• CAPTIVE TO ‘INDUSTRY/ TECHNOLOGY

Research
Teaching Service
Health Care

Top Related