


Languages
Pages
Legal

DOCONPNT RESUME
ED 185 658 EA 012 587
AUTHOR Ragan, Stephen W.TITLE PERT and CPM.: A Comparison with Implications for
Education.PUB DATE 76NOTE 25p.
EDRS PRICE MF01/PC01 Plus Postage.DESCPIPTORS *Critical Path Method; *Diagrams; *EdUcational
Planning; Long Range Planning; *Management Systems;Networks; School Districts; Systems Analysis;*Systems Approach; *Systems Development
IDENTIFIERS *Program !valuation and Review Technique
ABSTRACTTwo systematic ways of analyzing and planning the
components of a program or prolect, both used extensively by industryand government, are discussed in this paper. The methods are ProgramEvaluation and Review Technique (PERT) Networks and Critical PathMethod (CPM) Arrow Diagrams. The purooses of this paper are (1) toexplore the need for systematic planning in education,--(2) to compareCPM and PERT both in the past and in the present, (3) tc explain thecritical rules for developing PERT Networks and CPM Arrow Ciagrams,(4) to list the implications:for education that may be seen in eactof these methods, and (5) to explore the future of systehs planningin education. This paper is intended to be used by any educator whowants to improve his or her school district, building, or classroomthrough effective planning and systematic development cf specifiedObjectives. (Author)
t;
************************************************************************ Reproductions supplied by EDRS are the best that can be made *
* from the original document. ************************************************************************

PERT AND CPM: A COMPARISON
WITH IMPLICATIONS FOR EDUCATION
'by
Stephen W. Ragan
1976
Utah State University
Logan, Utah
S DEPARTMENT OF HEALTH.EDUCATION &WELFARENATIONAL INSTITUTE OF
EDUCATION
THIs DOcumENT HAS BEEN REPRO-DUCED EXAc Tt y AS RECEIVED PROM
THE PERSON OR ORGANIZATION ORIGIN-AT INC IT POINTS OF VIEW OR OPINIONSVIA TED DO NOT NECESSARILY REPRE-SENT OTFICIAL NATIONAL INSTITUTE OF
EDUCATION POSITION OR POt ICY
"PERMISSION TO REPRODUCE THISMATERIAL HAS BEEN GRANTED BY
S CL.
TO THE EDUCATIONAL RESOURCESINFORMATION CENTER (ERIC)."

TABLE OF CONTENTS
Page
Table of Contents0
Table of Figures and Tables ii4Introduction 1
The Need for Systematic Planning 1
CPM and PERT: Past and Present 3
Developing a PERT Network 6
Rules for Network Construction 6
Computing Time Estimates 8
Developing a CPM Arrow-Diagram 9
The Steps in Drawing fkrrow-Diagrams 9
Determining the Critical Path 10
Implications for Education 12
Central Administration 12
Building Administration 13
Teacher/Student Planning 14
The Future 15
Glossary 17
Bibliography 20
fi
TABLE OF FIGURES AND TABLES
Figure 1. Evolution of the Network Plan
Page
3
Table 1. Early CPM and PERT 4
Table 2. CPM and PERT Today 5 4'
Figure 2. Example PERT Network 7
,Figure 3. Example Arrow-Diagram 11
ek.
I.
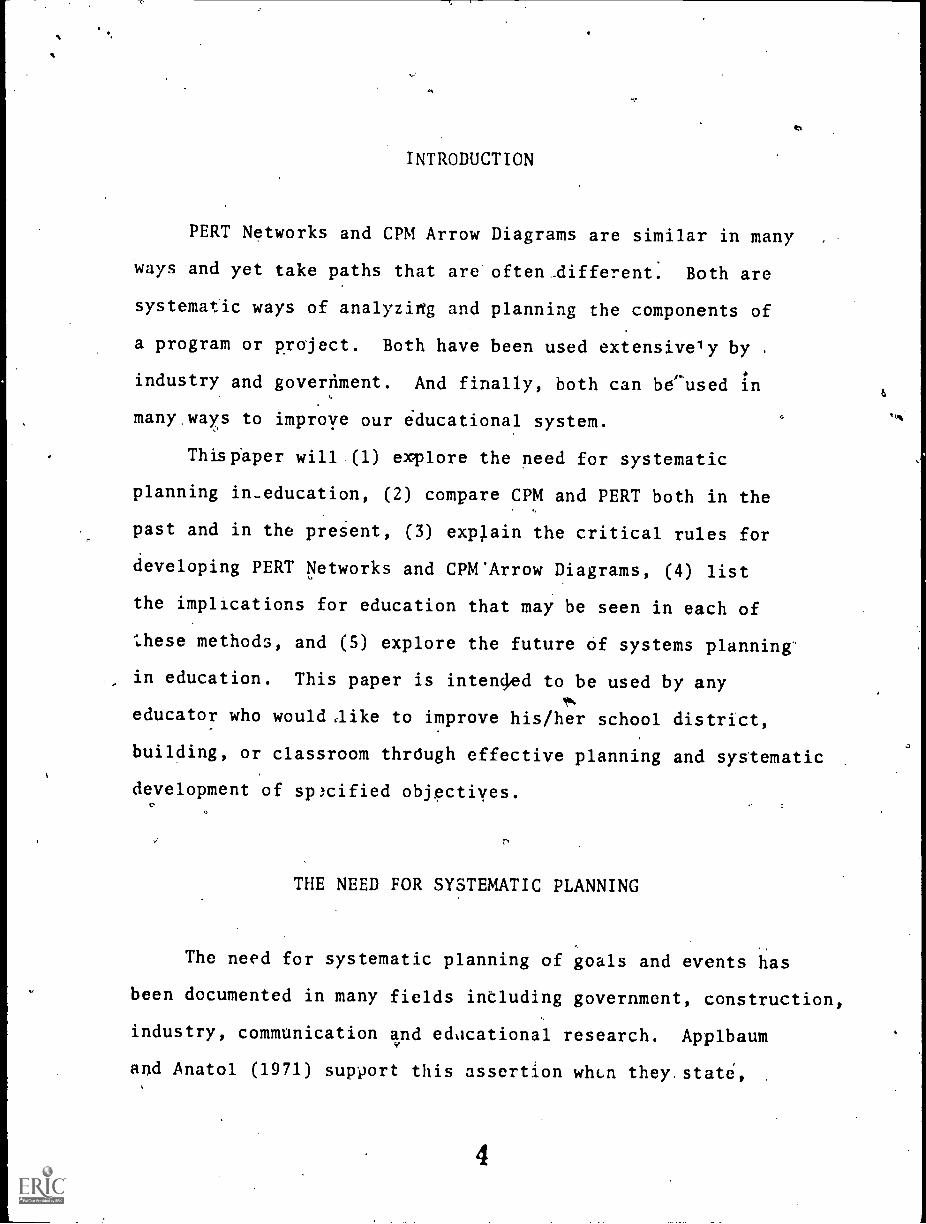
INTRODUCTION
PERT Networks and CPM Arrow Diagrams are similar in many
ways and yet take paths that are often-different: Both are
systematic ways of analyzing and planning the components of
a program or project. Both have been used extensively by .
industry and government. And finally, both can beused in
many ways to improye our educational system.
Thisliaper will (1) explore the need for systematic
planning in-education, (2) compare CPM and PERT both in the
past and in the preSent, (3) exNain the critical rules for
developing PERT Networks and CPM'Arrow Diagrams, (4) list
the implications for education that may be seen in each of
hese methods, and (5) explore the future Of systems planning-
in education. This paper is intenoled to be used by any
educator who would like to improve his/her school district,
building, or classroom thrdugh effective planning and systematic
development of sp:cified objectives.
THE NEED FOR SYSTEMATIC PLANNING
The need for systematic planning of goals and events has
been documented in many fields intluding government, construction,
industry, communication and educational research. Applbaum
and Anatol (1971) support this assertion wia.n they,state,
4

Ragan,
"Early experimental research in the field of communication
proceeded rather inefficiently because the necessary experiment4,1
tools for complex behavioral analysiS were nonexistent" (p. 368).
Applbaum and Anatol go on to say, " . . . (but) little attention
has been given to the methods (PERT) advantages for the
behavioral sciences." This demonstrates not only a need for
the behavioral sciences (e.g., communication, psychology,
education) but a serious area of neglect since Desmond Cook
and others have written a series of both articles and books
relating the use of these methods to the behavioral stiences.
Two other areas (government and indusp.y) have seen the
need for systematic planning and have undertaken to fill the
gap. Both Horowitz (1967) and Archibald and Villoria (1967)5
report the development of CPM and PERT almost simultaneously
by the government and private industry. The government in
the form of the United States Navy developed the early form
o,4 PERT in 1958 in order to more efficiently manage and control
the Fleet Ballistic Missile Program (FBM) which developed
the Polaris missile system. PERT was credited by the Navy
with having taken two years off of the successful completion
time of this program.
'Almost simultaneously in late 1957, a group of engineers
from Sperry Rand and Dupont developed what mas to become CPM.
Their goal was to develop a system for more efficiently
designing, constructing and maintaining the physical plants
of large industries. Ovel the years these two forms of systems
management have become more and more alike.
5

Ragan, 3
CPM AND PERT: PAST AND PRESENT
Figure 1 shows the evolution of the network plan. A
superficial analysis of this diagram will show two things.
Firs.t, both CPM and PERT were preceded by the Gantt bar chart
as the major means of systematically managing and monitoring
te;si
Cont.trothon andprorA...:. Industries
(ku-e7iporpmted)
1
#.
1 Ii
/CPM,agrain
-VS-47)
711
N.
7
PERT
Military and spaceresearch and develop.
(Event-oriented)Detailed baslharts ,
rob-ortented
Milestone chartsevent-oriented
*AA,VAio A A~MAW A A
AM...1..4.1#4
11110104A1 A
Combined bar andmilestone chart
2--
PERT network
oditi*V.
Next generation
Network -biced projectrnanagement systems
will be both activ.ty hob)and event oriented
at.
Figure 1. Evolution of the Network Plan °
(Archibald and Villoria (1967), p. 15)
6
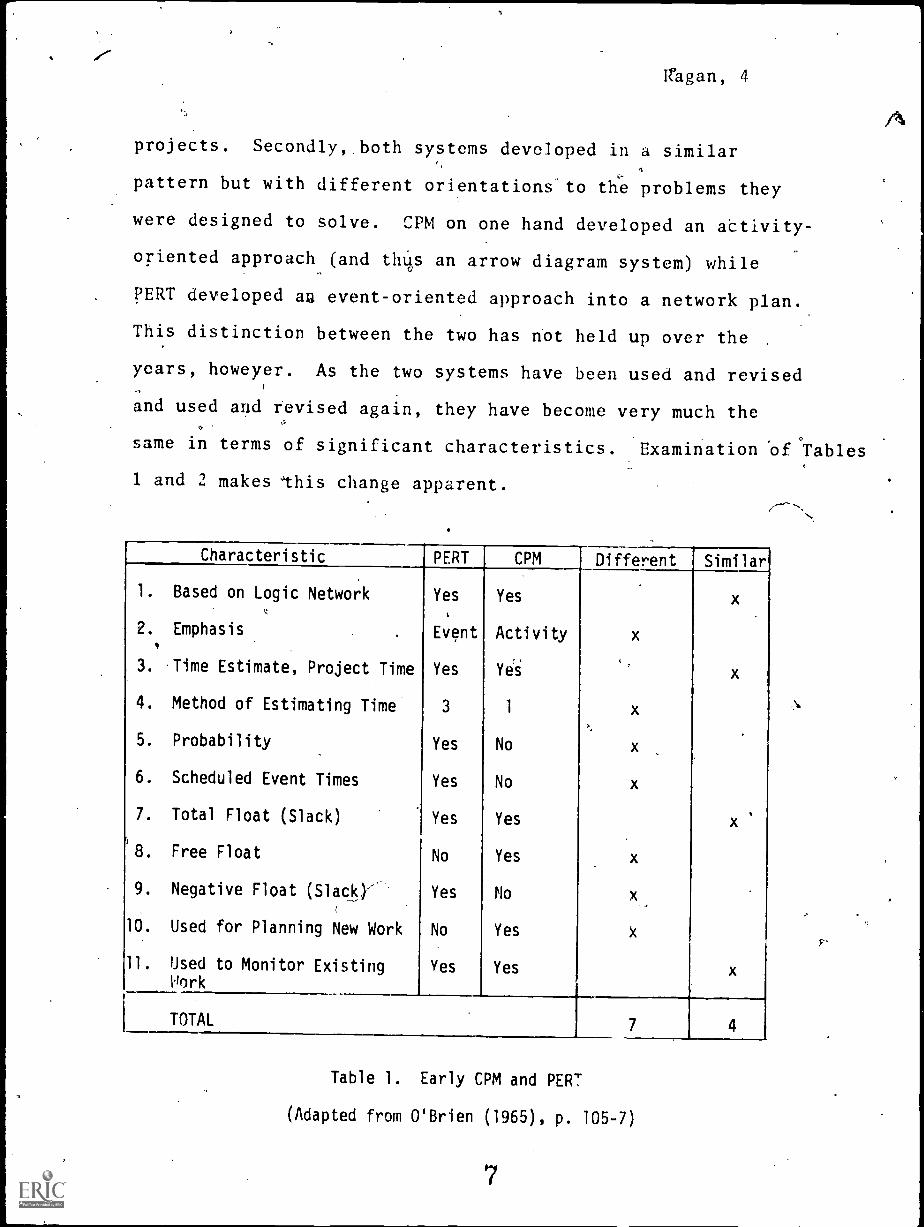
Pragan, 4
projects. Secondly, both systems developed in a similar
pattern but with different orientations to the problems they
were designed to solve. CPM on one hand developed an attivity-
oriented approach,(and thqs an arrow diagram system) while
pERT developed aa event-oriented approach into a network plan.
This distinction between the two has not held up over the.
years, howeyer. As the two systems have been used and revised
and used aud revised again, they have become very much the
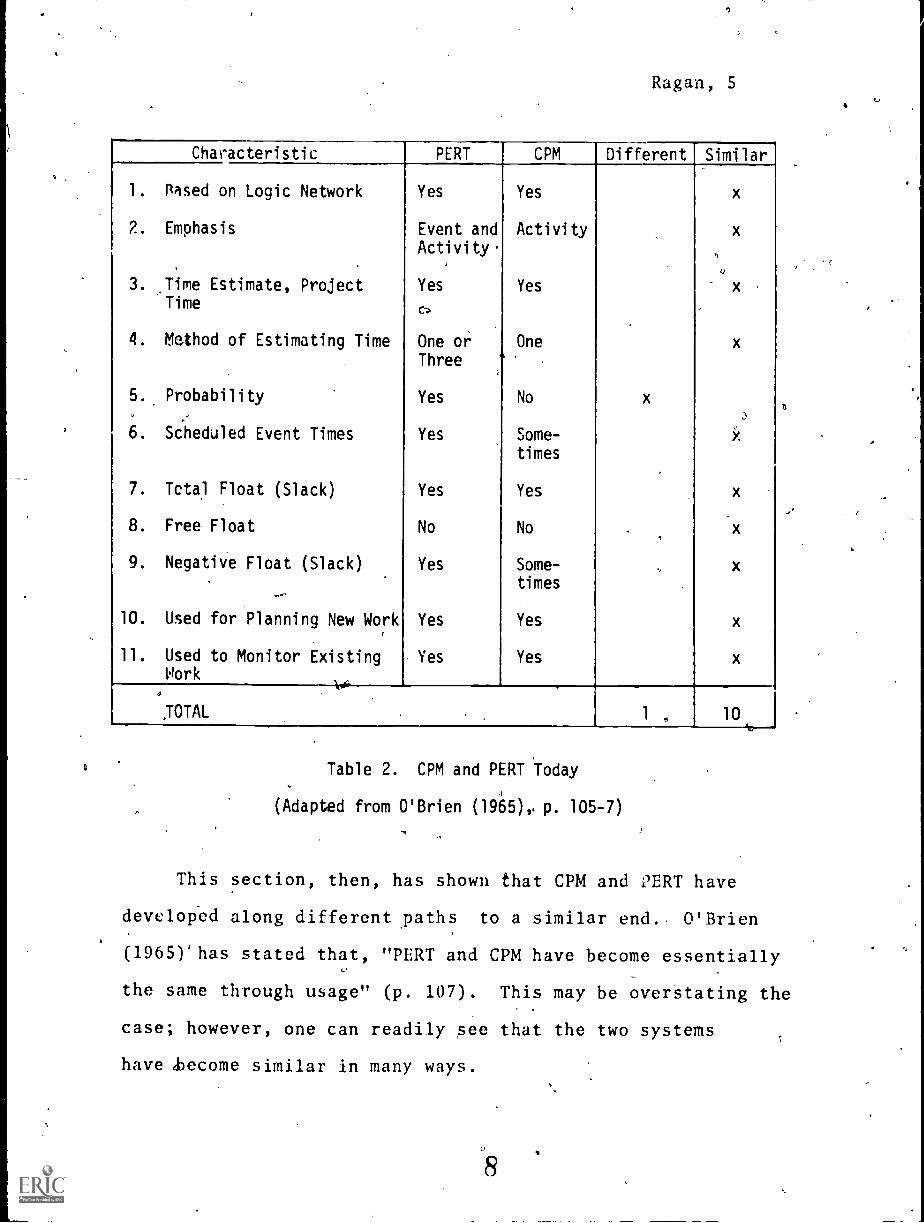
same in terms of significant characteristics. Examination 'of Tables
1 and 2 makes this change apparent.
..
Characteristic PERT CPM Different Similar
1. Based on Logic Network Yes Yes x
2. Emphasis . Event Activity xI
3. Time Estimate, Project Time Yes YeS x
4. Method of Estimating Time 3 1 x
5. Probability,
6. Scheduled Event Times
Yes
Yes
No
No
x,
x
7. Total Float (Slack) Yes Yes x,
8. Free Float No Yes x
9. Negative Float (Slac4" Yes No x,
10. Used for Planning New Work No Yes k
11. Used to Monitor Existing Yes Yes xWork
TOTAL 7 4
Table 1. Early CPM and PERT
(Adapted from O'Brien (1965), p. 105-7)
Ragan, 54
Characteristic PERT CPM Different Similar
1. Rised on Logic Network
2. Emphasis
3. Jime Estimate, ProjectTime
4. Method of Estimating Time
5.. Probability
6. Scheduled Event Times
7. Total Float (Slack)
8. Free Float
9. Negative Float (Slack)
10. Used for Planning New Work
11. Used to Monitor ExistingWork
Yes
Event andActivity.
Yes
c-
One oi.
Three
Yes
Yes
Yes
No
Yes
Yes
Yes
Yes
Activity
Yes
One
No
Some-
times
Yes
No
Some-times
Yes
Yes
x
,
,
x
x
,
0
x
x
.)
x
x
x
x
x
x
, 14._
JOTAL 1 , 10
a Table 2. CPM and PERT today
(Adapted from O'Brien (1965), p. 105-7)
This section, then, has shown that CPM and PERT have
develop.ed along different j)aths to a similar end. O'Brien
(1965)shas stated that, "PERT and CPM have become essentially
the same through usage" (p. 107). This may be overstating the
case; however, one can readily ,see that the two systems
have (become similar in many ways.
,Ita.gan, 6
DEVELOPING A ..PERT NETWORK
The development of a.PERT network for monitoring a project
follows specific rules. These rules are designed to make the
final network logical, accurate Ad readable.
Rules for sletwork Construction
A PERT Net k" consists.of,a series of arrows (activities)
which connect a series of circles or rectangles (events).
Arrows may be solid (which indicates an' activity that take
time) or dashed--"dummy arrows" (which do not take time and
only indicate that one_event is dependent upon another).
Rules of Network Logic:
1. Before an activity may begin, all activitiespreceding it must be completed.
2. Arrows imply logical precedence only. Neither thelength of the arrow nor its direction on.the diagramhave any significance.
3. Any two events may be connected directly by no morethan one activity.
4. Event numbers must not be duplicated in a network.
5. Networks may have only one initial event and onlyone final event.
6. Time estimates for completion of each event arcstated on the diagram in common units (e.g., days,hours).
Figure 2 below will be used to illustrate these rules for
network planning. In thia diagram it should be apparent that--
event one must be completed prior to beginning activities A,
Q4
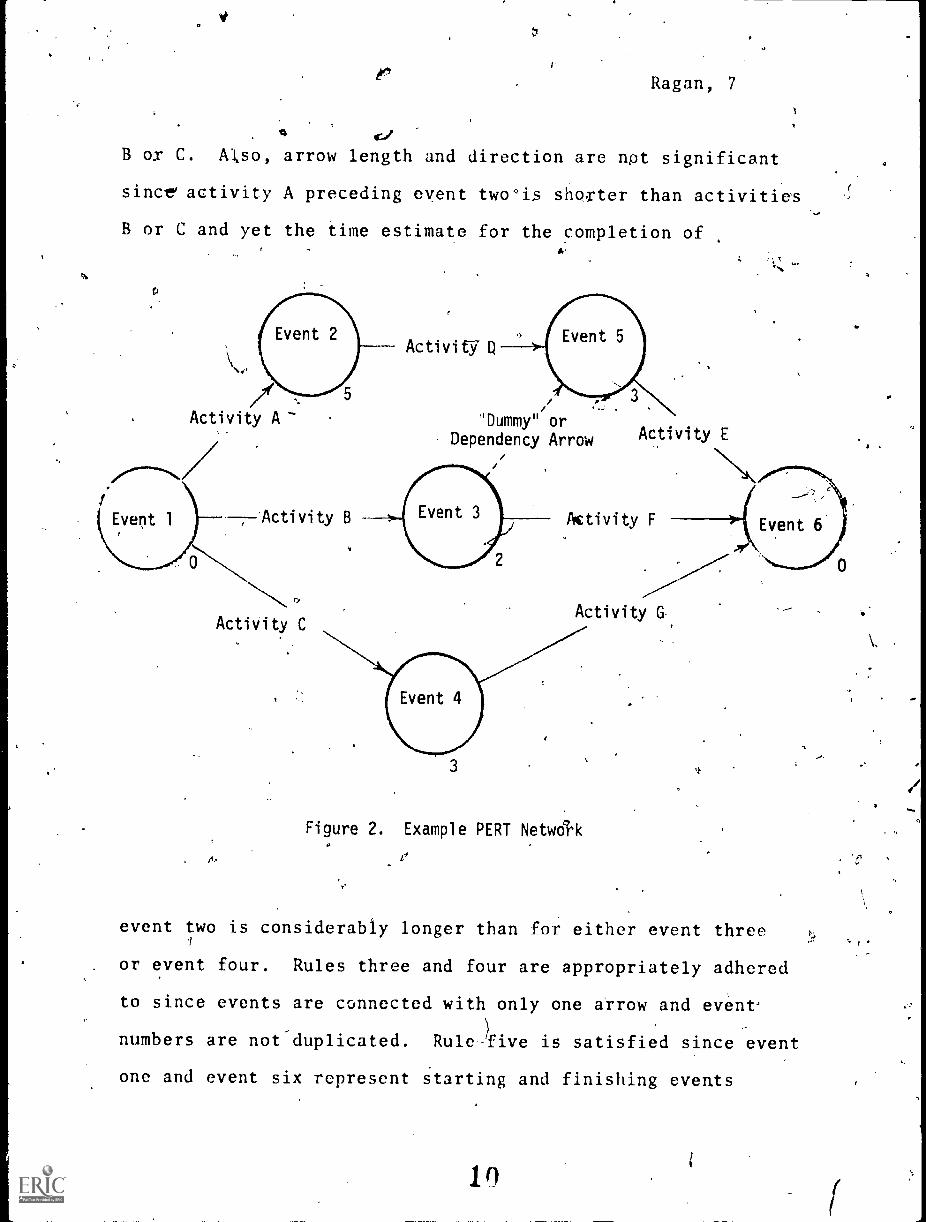
Ragan, 7
%
B ox C. Alkso, arrow length and direction are npt significant
sincto activity A preceding event two'is shoxter than activities
B or C and yet the time estimate for the completion of
Activity A
Event 1 Activity B
Activity C
Activiti
"Dummy" orDependency Arrow
Activity F
Activity G,
Figure 2. Example PERT Netwd4
t4
..
'e
event two is considerably longer than for either event three
or event four. Rules three and four are appropriately adhered
to since events are connected with only one arrow and event.
numbers are not duplicated. Rule-five is satisfied since event
one and event six represent starting and finishing events
1 0

44
Ragan, 8
respectively. And, finally rule six is met by the time units
stated.below and to the right of each event circle.
An additional characteristic of thisc,netwpr* not (necified
in the numbered rules is evident between event ihree and
event five. This arrow is called a "dummy" pr dependency
arrow and is used to show that the completion of event three
must precede the initiation of event five. There is no,time
factor involved with this arrow. It simply indicates that
event five "dependsV upon the completion of event thrte.
Computing Time Estimates
. In computing the time estimate for each subgoal (or event)
tithe PERT network, three time intervals are designated for
each ask. The first is called the most likely time (m); the
second an optdmistic estimate (a); and, the third a pessimistic
estimate (b) .The following formula is then used to compute
the expected time (te):
=a + 4m + b t
e= expected timet
ea = optimistic timem = most likely time
= pessimistic time
Thus, the optimistic and pessimistic times are taken as the
end points of the distribution,,and the'most likely time as
the mode:: Finally, a standard deviation etlual to one-sixth
the rege-is assumed. 10
The, advantages of this method of obtaining expected timemlo
are (1) that the planner obtains probability data which can
then be fed into a computer in order to calculate the probability

Ragan,
of finishing the project on time and (2) it enables the
planner to anticipate and rediTect resources to avoid costly
delays (Cochran, 1969).
DEVELOPING A CPM ARROW-DIAGRAM
As previously ihdicated, a CPM arrow liagram is much like1a
a PERT network i.11 terms of .construction technique. The rules
for construction are very much the same. The major differences
center around (1) the usUal omission of circles for events
(and hence, the orientation toward activities), and (2) the
time estimate of the duration of the activity rather than the
147
completion of an event.
The Steps in Drawing Arrow-Diagrams'
Horowitz,(1967) listed seven basic steps in the planning
of a project using an arrow-diagram approach. These steps are:
1. Analyze the project. Determtne the individual tasks
or operations that are required.
2. Show the sequence of these operations on a chart
called an (arrow-diagram).
3. Estimate how long it will take to do each operation.
4. Perform simple cdmputations to locate the critical
path (the chain of interdependent operations that
determines th 'duration of the entire project). This
step also prOvides other information that is useful
in schedu4ing,the project.
12

Ragan, 10
5. Use this information to develop the most economical
and efficient schedule for thc project.
G. Use the schedule,to control and monitor job progress.
7. Revise and update the schedule frequently throughout
the execution of the project.
(p. 9-10)
In addition to the above steps in constructing an arrow
diagram, Horowitz provides a summary of the rules.for arrow
diagrams. These rules are:
1. Each operation is shown by a single arrow'.
2. The diagram i not drawn to scale.
3. No operation can start until all preceding operationshave been completed.
Consider the three basic questions:a) What jobs must precede this one?b) What jobs, can follow this one?c) What jobs can be done simultaneously? -
5. Every operation must have a preceding and a follow-ing operation, except the first and last.
6. .Use dummies to show the correct dependencies betweenevents and to avoid having more than one operationwith the same set of event numbers,
7. Number the (arrow-diagram) in such a way so that thenumbers always increase as you go from the start tothe finish.
8. Use only one starting event and one ending event.
(p. 20)
0
Determining the Critical Path
The critical path is thar chain of activities or operations
whose durations summed determ ne the overall length of the project.

Ragan, 11
A change in any activity on the critical path will change the
total time or duration of the project. Parallel critical
paths may exist but they must have the same total duration and
this total time must be longer than any other path. In the
arrow diagram below (sec Figure 3) the critical path is
designated by the double-lined.arrows. The reader will notice
that the critical path marked is the path which takes the most
time from start to finish. Another way to conceptualize the
critical path, for a critical operation, is that critical
operations along the critical path always have zero total float.
In summing the time units for each path, path A has a total
duration of 14, path B a total of 23, and path C a total of
22. Thus, it should be obvious that path. B (with the longest
duration) is the critical path even though the two other paths
appear to be longer in the diagram.
5
Path A2 1
-4-
3
Path C
5
Figure 3. Example Arrow-Diagram
14
Ragan, 12
IMPLICATIONS FOR EDUCATION
t
Cochran (1969) listed experimental research, survey
research, historical research, and curriculum projects as the
major applications of PERT to'education. Applbaum and Anatol
(1971) used PERT with communication research planning and1'
declared it to have several (eight) significant advantages.
Case (1969) found'PERT to be applicable both to educational
research and educational evaluation studies. Finally, Garlock
(1968) supports the use of PERT systems in application to
educational research and curriculum development projects. This
support for the use of systematic planning in these areas of
education is commendable. However, nowhere in the literature
that this author has been able to find is there any mention
of using a systematic approach (PERT, CPM or an adaptation)
to managing and monitoring the ongoing programs and projects
encountered in a public school system. The following three
sections will list some of, the advantages that might accrue
to educators willing to try a systematic approach to administering
their programs.
Central Administration
The advantages logically attributable to PERT/CPM based
district-wide plans for/Ateren.tral administration are as
follows:
Ragan, 13
1. The creation of a realistic, detailed, easy-to-
communicate (to both staff and the community) district-
wide plan of operations.
2. The utilization of all possible community and district
resourc,ls.
3. A procedure that enhances common understanding at
all decision-making levels.
4. Reporting procedures that allow for a thorough
assessment of the sequence of activities, schedules,
and costs.
S. Reporting procedures that assist in forecasting or
isolating potential problems.
These advantages and perhaps more can accrue to the school
district central administration that employs a,systematic
approach to managing a school district.
Building Administration
On a smaller but no less important scale, the application
of systematic management and monitoring schemeshas even more
advantages. Amohg these are:
1. A single network portrayal of all the operations
conducted within the auspices of the school.
2. A basis for a unified standard of communication among
staff members.
3. A basis for effective mtilization of all resources
available within and without the school.
16
Ragan, 14 d
4. A means for specifically defining all tasks that
need completion.
5. A means to determine where resources should be
applied to best achieve the desired objectives.
6. A means for self-correction.
These advantages for the building administrations ate applicable111
not only to projec-s and curriculum development, but to the
ongoing maintenance f the plant, the educational program, the
extracurricular activities and all the other programs that a
school may be involved in.
Teacher/Student Planning
This area is perhaps potentially the most-fruitful area
of all. The application of systematic management to the class-
room has any number of advantages for enhancing learning (which
is, after all, what schools are about). These advantages are
listed below:
1. A means of clear communication of goals and objectives
'to parents as well as students.
A means of planning and scheduling activities for
individual students.
3. A means of monitoring and reporting individual
student progress toward established goals and
objectives.
4. A means to assist in identifying potential delays.
)5. A means to assist in the effective use of resources
available within and without the classroom.
17

Ragan, 15
6. A means for permitting data-based decision making in
changing student programs.
7. A means for record keeping.
8. A means for simulating alternate plans.
And finally, an advantage that is available at all levels is
the fact that the installation of a CPM/PERT system is easy.to
learn and inexpensive.
THE FUTURE
ss,
The future forsystematic planning has been projected by
Archibald and Villoria (1967). As indicated in Figure .1, the
next generation will see network-based plans which will be
both activity and event oriented. This in some ways has
already occurred. The intermarriage of CPM and PERT has come
about in a p'roject specific way. Cochran (1969), for example,
shows both activities and events (as in Figure 2 of this
paper) in his sample network. The application of computers
in large scale operations and the addition of cost and scheduling
factors add complexity that is also already here. Thus, the
future is with us today. This is not to say'that the future
will not bring further advances. It'ls only to say that
advances are coming so rapidly that a projection into the
future would be virtually guesswork.
8
Ragan, 16
In terms of the future of education, however, some things
may be said and need to be said. If our educational "system"
is to survive (and survive it must) then the present chaotic
state and haphazard planning must be interrupted. Currently
criticism of our schools is at a peak. Everyone including
the communities, the media and many of the nation's leaders
are accusing our schools of failing to provide an adequate
education. W. James Popham in an article titled, "Getting
Damned Tired of Failing" calls for a rational planning model
that wi,11 reverse this criticism. This author sees the
application of PERT/CPM procedures as one step in the right
direction. 'It might quite clearly be one small step for our
schools and one giant step for our school children.
10
GLOSSARY
Ragan, 17
Activity. An individual element of a project, having a definitebeginning and a definite end. An activity always requiresa certain amount of time for its accomplishment, andusually requires some kind of resources.
Activity-Oriented Network. A network that emphasizes theactivities, rather than the events.
Arrow. A directed line used to show the accomplishment of anoperation in the network (arrow) diagram. In most CPMwork the length of the arrow has no significance.
Arrow Diagram. A graph showing the'sequence and dependenciesbetween the elements of the project. As used in'thistext, same as network diagram.
Arrow Notation. A.form of network diagram used in CPM inwhich the activities are shown by arrows and the eventsby the intersections of the arrowsTiiirlilly shown as circles).
Crash Cost. The minimum direet cost required to complete theoperation (or project) inithe least possible time (the
,crash time).
Crash Point. The point on a time-cost curve marking theintersection of the crash cost and crash duration.
Crash Time. (Duration): The shortest time in which it ispossible to ,pomplete the operation or project, regardless
- of cost.
Crashing. (1) Shortening an operation by adding additionalresources. (2) Shortening a project by shortening thecritical operations in such a manner that each resultingschedule is the most economical one possible at thatduration. See Least-Cost Scheduling.
Critical Operation. An operation whose duration cannot beincreased without increasing completion time of theoverall project.
Critical Path. The chain of.operations in the network havingthe longest total'duration. The durations of theseactivities determine the projett,duration.
Dependency. A relationship between activities such that onecannot start until the other is finished.
2 0
Ragan, 18
Dummy or Dummy Arrow. A fictitious activity, requiring zerotime and no resources for its accoMplishment, used toshow proper network relationships. Dummies are usuallyshown by dotted lines on the arrow diagram.
Duration. An estimate oZ how long an operation will take inhours, days, working days, or other time units.
Early Finish. The day an operation will be completed if itis started at its early start time. This is the earliestdate on which the operation can be finished.
Early Start. The day preceding the first day an operation canbegin.
Event. A point in time that marks the start or completion ofone or more operations. Events do not.require time orresources.
Event-Oriented Network, A network that emphasizes the eventsrather than the activities.
Expected Time (t'). In TERT, the expected time is the weightedaverage of bie optimistic, most likely, and pessimistictimes for an activity:
Te
= a + 4m + b6
Float Time.. A measure of the leeway available in completingan operation. Various kinds of float measure how muchthe operation can be delayed without affecting otheroperations, total project completion time, etc. See alsoTotal Float, Free Float, Interfering Float.
Free Float. The amount of time an operation may be delayedwithout affecting any following operations.
Interfering Float. The difference between total float and freefloat for any operation. Use of the interfering floatdoes affect subsequent pperations.
Latest Finish. The day on which the operation must be complete-1if the overall project is not to be delayed.
Latest Start Time. The last day on which the operation can'begin without delaying the project completion time.
Logic. In CPM, the'relationships and dependencies amongthe activities that make up a project, as shown by thearrow diagram; the planned sequence of work. ,

e
Ragan, 19
Milestone. An important event in a project, such as completionof a major component or phase.
Most Likely Time (m). In PERT, this is the estimator's opinion'of the most likely time for completion of the activity.This is what he would give if her were asked for only onetime estimate.
Network. See Arrow Diagram.
Operation. Any element of a project having a definitebeginning and end and requiring time for completion.
Optimistic rime (a). In PERT, the shortest time in which theactivity could be completed if everything goes exceptionallywell. The activity has only one chance in a hundredof being completed within the optimistic time.
Optimum Schedule (Duration). That schedule resulting in thesmallest total project cost.
PERT (Program Evaluation and Review Technique). A'projectplanning and reporting technique that makes use of thenetwork diagram, and uses a probabilistic approach todetermining operation durations.
Pessimistic Time (b). In PERT, the longest time that the activitycould possibly take (barring acts of God), if everythinggoes badly. The eactivity might be expected to exceedthis time only once in a hundred times.
Simuration. 'Testing a proposed course of action by means ofa mathematical model.
Slippage. Delay in accomplishing one or more operations.
Total Float. The amount of time an operation may be delayedwithout affecting the duration of the proj,ect.
0
r.
1IBLIOGRAPHY
Rooks
Ragan, 20
Archibald, Russell D., amd Villoria, Richard L. Network-BasedManagement Systems (PERT/CPM). New York: John Wiley andSons, Inc., 1967.
Cook, Desmond. An Introduction to PERT. Columbus, Ohio:Ohio State University Press, 1964.
Horowitz, Joseph. Critical Path Scheduling: ManagementControl Through 'CPM and PERT. New York: The RonaldPress Company, 1967.
Miller, R. W. Schedule, Cost, and Profit Control with PERT.New York: McGraw-Hill Book Company, 1963.
Moder, J. J., and' Phillips, Cecil R. Project Management withCPM and PERT. New York: Reinhold Publishing Corporation,1964.
'O'Brien, James J. CPM in Construction Mana ement: Schedulinby the Critical at Met o . ew or : c raw-Yook Company, 1965.
Articles
Applbaum, Ronald L.,-and Anatol, Karl. PERT: A Tool for"Communication Research Planning. The Journal ofCommunication, 1971, 21, 368-380.
Case, C. Mirston. The Application of PERT to Large-ScaleEducational Research and 'Evaluation Studies. tducationalTechnology, October,'1969, 79-83.
Cochran, Leslie H. PERT: A Technique in Educational Research.The Journal of Educational Research, 1969, 63, 19-25.
Garlock, Jerry C. PERT: A Technique for Education. EducationalLeadership, January, 1968, 345+.
Moder, Joseph J. How to do CPM Scheduling without a Computer.Engineering News-Record. March 14, 1963, 30-36.
Popham, W. James. Getting Damned Tired of Failing. IOX FallAlmanac, Fall, 1975, p. 1.
23
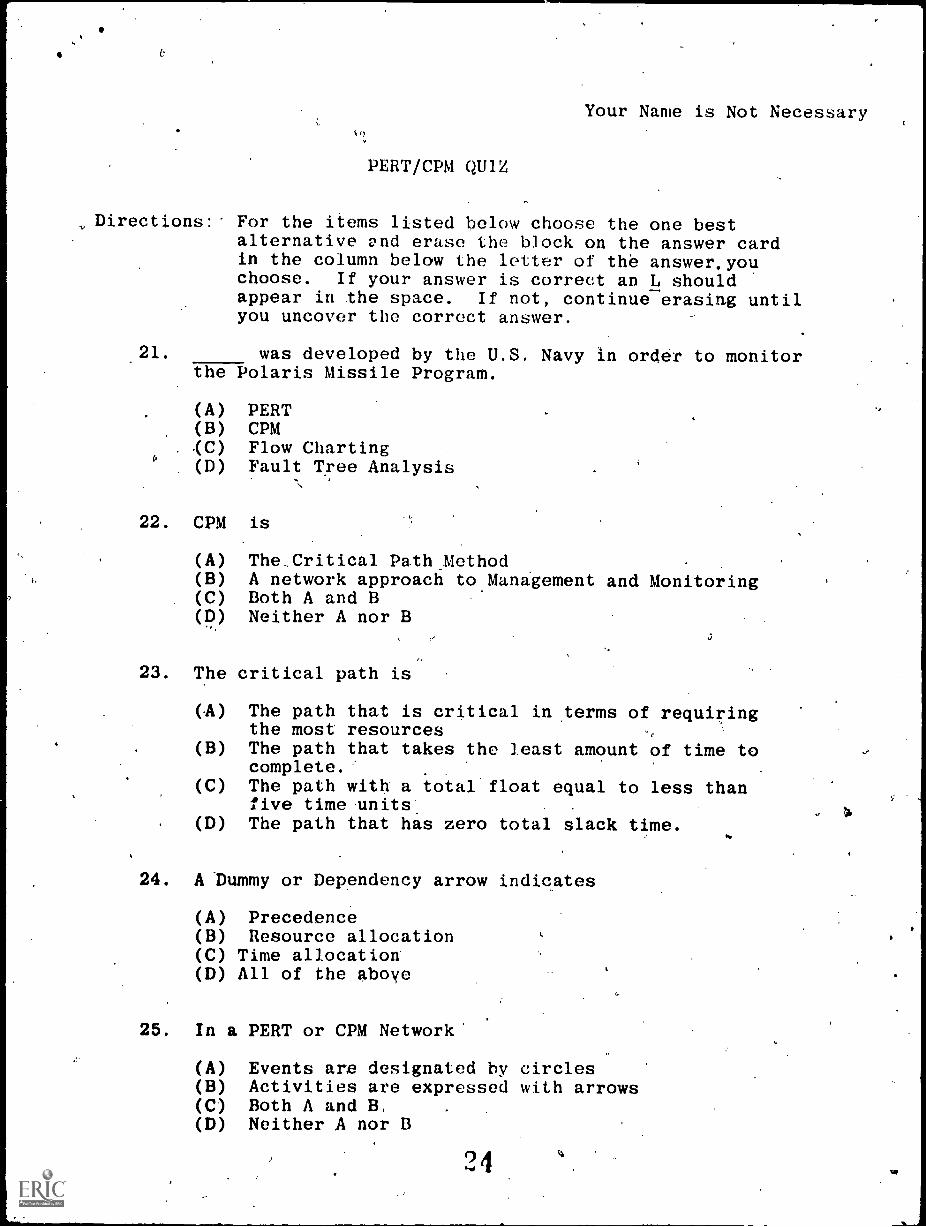
PERT/CPM QUiZ
Your Name is Not Necessary
,Directions: For the items listed below choose the one bestalternative vild erase the block on the answer cardin the column below the letter of the answer,youchoose. If your answer is correct an L shouldappear in the space. If not, continue erasing untilyou uncover the correct answer.
.21. was developed by the U.S. Navy in order to monitorthe Polaris Missile Program.
(A) PERT(B) CPM,(C) Flow Charting
0
(D) Fault Tree Analysis
22. CPM is
(A) The Critical Path Method(B) A network approacfi to Management and Monitoring(C) Both A and B(D) Neither A nor B
23. The critical path is
(A) The path that is critical in terms of requiringthe most resources
(B) The path that takes the least amount of time tocomplete.
(C) The path with a total float equal to less thanfive time units,
(D) The path that has zero total slack time.
24. A 'Dummy or Dependency arrow indicates
(A) Precedence(B) Resource allocation(C) Time allocation(D) All of the above
25. In a PERT or CPM Network
(A) Events are designated by circles(B) Activities are expressed with arrows(C) Both A and B,(D) Neither A nor B

26. IN a'CPM Network p_rojected time is arrived at
(A) .By using the most-likely time--(B) 6Through a three stage estimate
-(C) ,Through a one or three stage estimate(D) ,In a one.stage estimate
27. Computation, of a+4m+b will result in
9 6
..
,
(A) The pessimistic tillie(B) The'most-likely time(C) The optimistic time'J(D) The .expecte'd time
28. CPM 'Was developed py
(A) Sperry Rand and Dupont(B) Lockheed(C) Sperry Rana Corporation(D) Dupont and the U.S. 'Navy
V
29. Which one of the following is NOT a rule for PERTNetwork Construction
(A) Before an activity may begin, all activities.preceding it must be completed.
(B) Two events must be connected by one activity(C) Networds have only one initial event and only one
final event.(D) 'Event numbers must not be duplicated in a network
e,
3T:), In computiog tiMe estimates the optimistic andpessimistic times are taken as.the end points of thedistribution, and the most-likely.tinie as the
J
9
*4
(A) Mean(B) Median(C) Mode(D) Standard deviation
051.1