


Languages
Pages
Legal

Running head: SELECTION FINAL PROJECT 1
Personnel Selection Final Project
Samuel Dunham
Valdosta State University

SELECTION FINAL PROJECT 2
Abstract
This paper will discuss the conscientiousness scale that was developed by Dr. Jeremy Bauer’s
Personnel Selection graduate level class. Conscientiousness is defined and then expounded upon.
Then the reliability statistics were examined. Overall, they were acceptable, but some items were
removed to improve the scale. The results of the EFA provided factorial validity for the scale,
but the correlation matrix did not provide convincing evidence of convergent or discriminant
validity. There was also evidence of multicollinearity possibly affecting scores on the scale. The
hiring statistics also indicate that the scale may not be helpful in preventing adverse impact or
reverse discrimination for the company. Considering the evidence and the financial situation of
the company, the official recommendation is for the organization to not use the scale unless
efforts will be made to improve it.
SELECTION FINAL PROJECT 3
Section 1
For the purposes of this paper, conscientiousness is a series of constructs that explain the
individual differences in tendencies to exhibit orderliness and self-control; in being hardworking,
responsible, and rule-abiding (Roberts, Jackson, Fayard, Edmonds, & Meints, 2009).
Conscientious individuals are likely to give the maximum effort they can at all times, be
responsible with the resources that they have at their disposal, and follow the rules and
procedures that are in place. The trait is relatively stable across time, though it can be somewhat
developed throughout an individual’s life (Eisenburg, Duckworth, Spinrad, & Valiente, 2012).
The attitudinal components that describe conscientiousness individuals include: orderly,
disciplined, highly driven, detail-oriented, and more guilt prone (Fayard, Roberts, Robins, &
Watson, 2012). Each of these attitudinal components will be discussed in turn.
Order is a key component of conscientiousness in that structured things make more
logical sense than things done out of order. Order also plays into the disciplined portion of
conscientiousness because structure is what drives the conscientious individual. The
conscientious person also is highly driven and motivated and uses those traits to excel in their
endeavors. Details are also important because they give the structure that is needed to
successfully complete tasks. Finally, they may be more guilt-prone because they value their
performance level very highly and may even take it as a reflection of themselves personally. Any
perceived failures may be attributed to the conscientious person not being structured enough in
some area.
In the Conscientiousness Scale, evidence of content validity will come from subject
matter experts (SMEs) who will rate the items in terms of being essential to the
conscientiousness construct. Through these ratings, validity coefficients will be calculated and
examined appropriately.

SELECTION FINAL PROJECT 4
The content of the scale appears to cover every aspect of the definition presented above
(See Appendix A for a complete listing of all items on all three scales). However, there may be
some contamination produced by two particular items. Item 5 is problematic because the
operationalized definition being used does not distinguish the motivation behind a conscientious
individual; it is likely that there is not just one motivation behind being conscientious. As a
result, it appears unlikely that this item measures conscientiousness. Also problematic is Item 23.
The item does not appear to be of major relevance for a conscientious person. In fact, the
argument could be made that other factors are of more importance in answering this item (i.e. the
person who created the last minute event is someone whom the conscientious person is fond of).
There seems to be a deficiency in the attitudinal component of more guilt prone. The argument
could be made that a few items are indirectly covering the guilt prone component, but I would
not feel comfortable saying that the component is covered in the questions.
In regards to content validity, I would consider changing the response options to anchors
that are more temporally based. For example, instead of using “Strongly Disagree”, I would use
“Not Very Often” instead. I would also look to remove Items 5 and 23 because I believe they are
contaminating the scale. As mentioned earlier, they are not capturing the essence or underlying
constructs behind conscientiousness. The contamination produced by Items 5 comes from the
motivation behind the construct. There is no literature that suggests that conscientious people
look to be efficient and hardworking because they want to gain an advantage. I am not
comfortable making that claim in this paper. Item 23 produces contamination because it is not
covered within the definition being used in this paper. The definition only states the traits that a
conscientious person would possess, not how they react to conscientious (or non-conscientious)
traits in others. I do not believe that it would be appropriate to make that claim at this time
SELECTION FINAL PROJECT 5
because it has not been supported anywhere else. With those changes, I would feel confident that
the scale has a good degree of content validity because the possible contaminations would be
removed, which would strengthen the scale.
Section 2
I would expect to see three factors extracted from the scale. I believe that the orderliness
and self-control will combine to account for some variance and form one factor. Then, I see the
hardworking descriptor forming another factor by itself. Finally, I believe that the responsible
and rule-abiding descriptors will form their own factor to create a total of three factors.
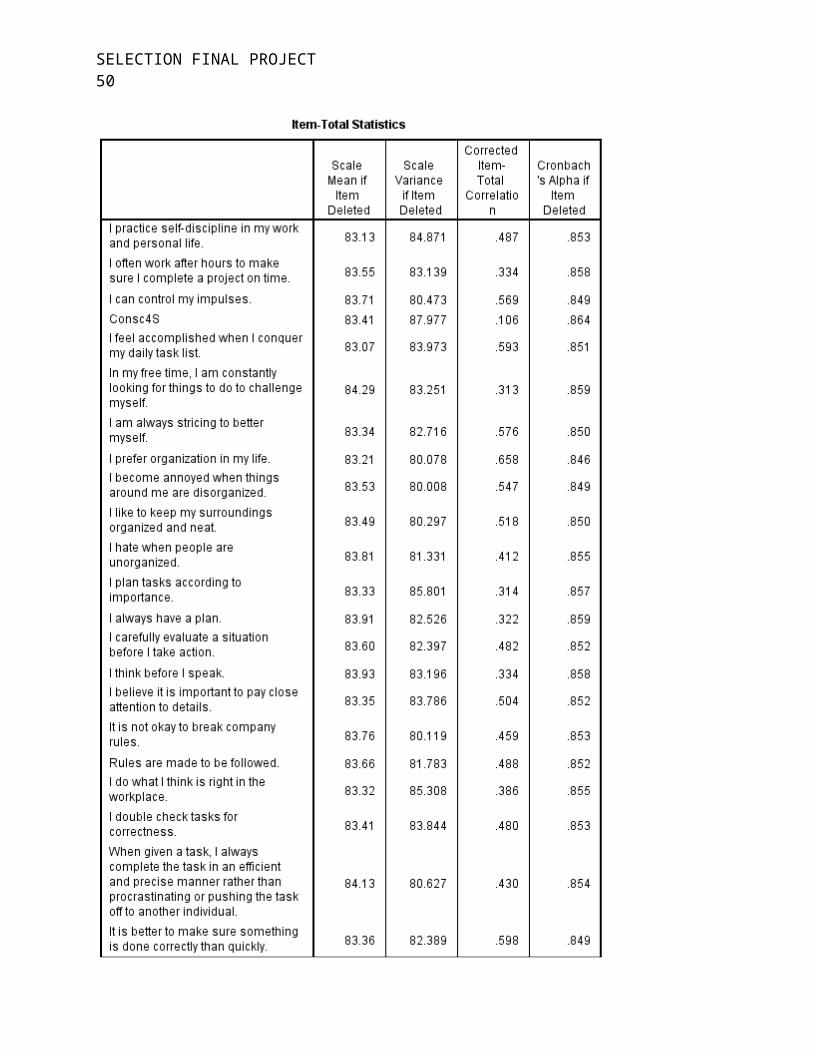
In examining the reliability analyses, the reliability for the Conscientiousness Scale was
determined to be .857, which is definitely acceptable. The items where the reliability was
estimated to go up if removed were the following: Consc4S, Consc5, and Consc23. Keeping that
considered, I believe that the scale would be at its strongest if Consc4S was kept while Consc5
and Consc23 are removed (See Section 1 for explanations). Knowing that reverse scored items
typically act psychometrically different than other items; I am comfortable keeping the item in
the scale because I believe that it touches on the hardworking aspect of the conscientiousness
definition being used for this paper. It should also be noted that with Consc4S being a reverse
scored item, I would make the argument that the reliability increase that appear to come from its
exclusion would not be as large as it appears or may even be practically false.
With that in mind, I decided to remove Consc5 and Consc23 from the scale because I felt
that those items were producing some contamination that was taking away from the scale’s
validity. In section 1, I mentioned that Consc5 implies a motivation behind conscientiousness
that I do not believe is warranted. The motivation of being recognized is neither consistent with
the published literature nor with my own expectations of the conscientiousness construct. As

SELECTION FINAL PROJECT 6
mentioned in section 1, the problem with Consc23 is that it does not fit with the definition being
used in this paper. There is nothing in the definition that specifies how a conscientious individual
will react to the actions of others (especially for actions that are non-conscientious). There is a
possibility that this covers an important aspect of conscientiousness, but I am not comfortable
making that claim without seeing more evidence through literature.
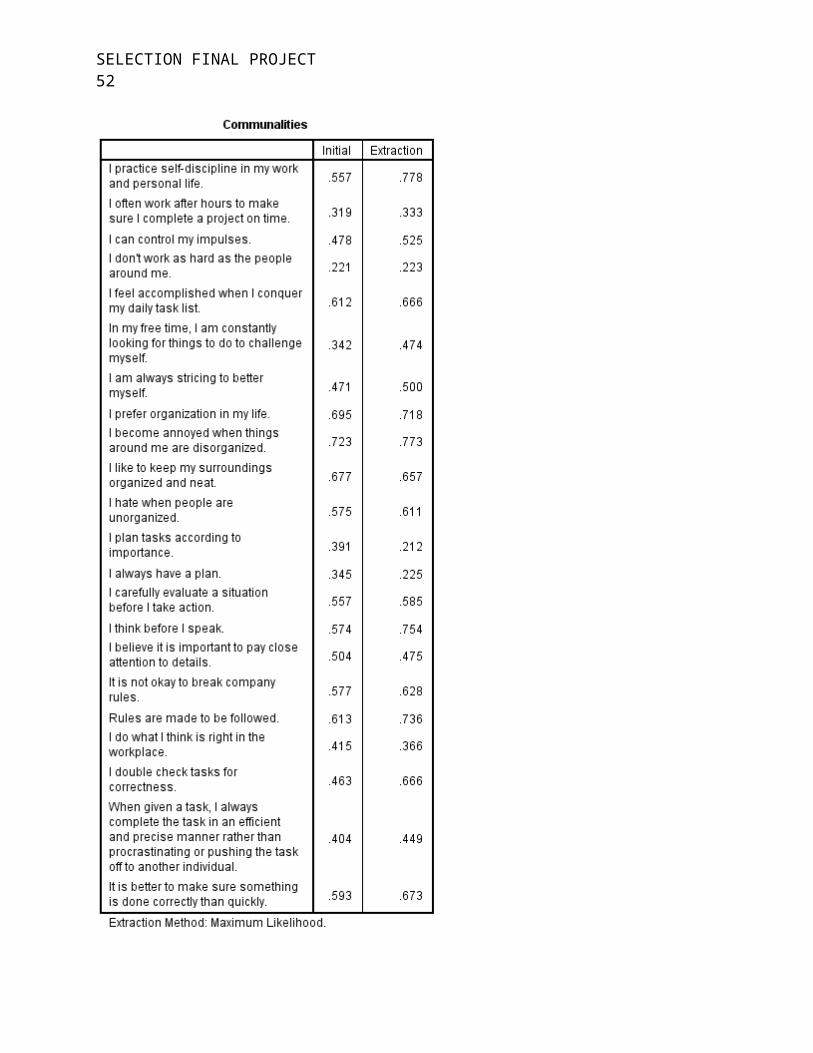
There appear to be three factors contained in the Conscientiousness scale. I have decided
to term the three factors: “productivity,” “organization,” and “self-control/ restraint.” In
determining a strong factor loading, I made the decision to set the minimum at .3 because of the
nature of the data. Primarily since the scale was created for the project and it has not been tested
elsewhere, I felt that a considerable amount of items would have to be removed if the minimum
used was a factor loading of .4. The items that load strongly on “productivity” include: Consc1,
Consc2, Consc4S, Consc5, Consc8, Consc13, Consc21, Consc22, and Consc25. The items that
load strongly on “organization” include: Consc9, Consc10, and Consc11. The items that load
strongly on “self-control/ restraint” include: Consc3, Consc14, Consc15, Consc16, and Consc18.
I believed that items that loaded either on multiple or no factors strongly should be
removed because they may not actually give any legitimate data to determine conscientiousness.
Items that fit those criteria were Consc5, Consc20, Consc23. Through the reliability analysis and
the EFA, these three items had some psychometric problems that could indicate that they are not
adding to the validity of the scale and may be taking away from the validity of the scale, which
would hurt its utility. I believe that the exclusion of these items will make scores on the scale
more meaningful in terms of validity.
The scale was found to be heterogeneous because the Exploratory Factor Analysis (EFA)
extracted three factors from the scale. If more than one factor is extracted from a scale, then it is

SELECTION FINAL PROJECT 7
heterogeneous. It should be noted that just because the scale was heterogeneous does not
necessarily mean that the construct itself is heterogeneous.
Though there are some concerns with the factor loadings found in a few of the items, I
would feel fairly comfortable with the factorial validity found in the data if I had no particular
ties to the data because the best factor model fit is consistent with my initial expectations. I
anticipated three factors would come from the scale and the EFA presents evidence that would
support that conclusion. As a result, there is no detriment for using this test on a theoretical basis.
Section 3
Considering the definition of conscientiousness being used for this particular paper, there
were some relationship expectations that were anticipated through the correlation matrix. I
expected that the conscientiousness would find concurrent validity to the following variables:
integrity, interview, task performance, and organizational citizenship behaviors (OCBs). I
believed that the following factors would be relatively unrelated to conscientiousness: GMA
(general mental ability) and mechanical ability. I also expected conscientiousness to be
negatively related to the following variables, providing evidence of discriminant validity:
counterproductive work behaviors (CWBs) and turnover intentions.
Looking at the correlation matrix, there were some unexpected results that came from the
analysis. The following variables did not meet my expectations: GMA, Interview, CWB,
Mechanical Ability, and Turnover Intentions. In other words, the majority of the variables had
correlations (with conscientiousness) that were unexpected. Each variable relationship will be
examined in the following paragraph.
I was surprised to see GMA have a significant effect with Conscientiousness because it
seemed to me that Conscientiousness is more “nurture” based, in that the factors of
SELECTION FINAL PROJECT 8
conscientiousness are more developed. I did not believe Conscientiousness would be related to
GMA (which should be more “nature” based). I did not expect GMA to provide any statistically
significant evidence of either concurrent or discriminant validity, but it did. I expected a larger
correlation between the Interview variable and Conscientiousness. My reasoning was that
conscientious individuals would be more likely to prepare effectively for an interview, which
would produce better interview performance perceptions. It should be noted that the reliability
estimate is at the minimum acceptable Cronbach’s Alpha value of .70. In the matrix, it is
significant but I expected that it would have a correlation magnitude similar to the one that was
observed between GMA and Conscientiousness. I was completely surprised at the magnitude of
the relationship between Conscientiousness and CWB because one facet of conscientiousness is
the rule abiding factor and that would be inconsistent with CWB. This variable should have
produced strong discriminant validity, but failed to do so. In fact, it actually was harmful to the
scale in terms of validity because of the inconsistency between the expected and observed
correlations. However, it should be noted that the results of this relationship may be a bit skewed
because the reliability estimate for the CWB scale is unacceptably low with Cronbach’s Alpha
being less than .70. The Mechanical Ability variable is surprising for the same reason that the
GMA variable was unexpected. Finally, the relationship that Conscientiousness has with
Turnover Intentions was unexpected because I was anticipating a strong inverse relationship
similar to the magnitude found in the CWB x Integrity correlation. This would seem to suggest
that conscientious individuals are likely to leave to leave the organization. It would be wise for
the organization to place their focus on their conscientious workers and let them know that they
are valued.

SELECTION FINAL PROJECT 9
Overall, I believe that the scale still does have some value, but that it does not really
show great evidence of concurrent validity or discriminant validity. The correlations almost
appear to be random which could be evidence that the scale is not reliably measuring
conscientiousness. However, some of the expected relationships could really just be the result of
lower levels of reliability in the scales of the other variables.
The other variables were in line with my initial expectations. As mentioned earlier, the
relationship between conscientiousness and the following variables are problematic: GMA,
Interview, CWB, Mechanical Ability, and Turnover Intentions. I am bothered by the results of
the correlation matrix and I am not sure that I feel comfortable with the use of the scale because
of the problems associated with providing meaningful evidence of concurrent validity and
discriminant validity.
Section 4
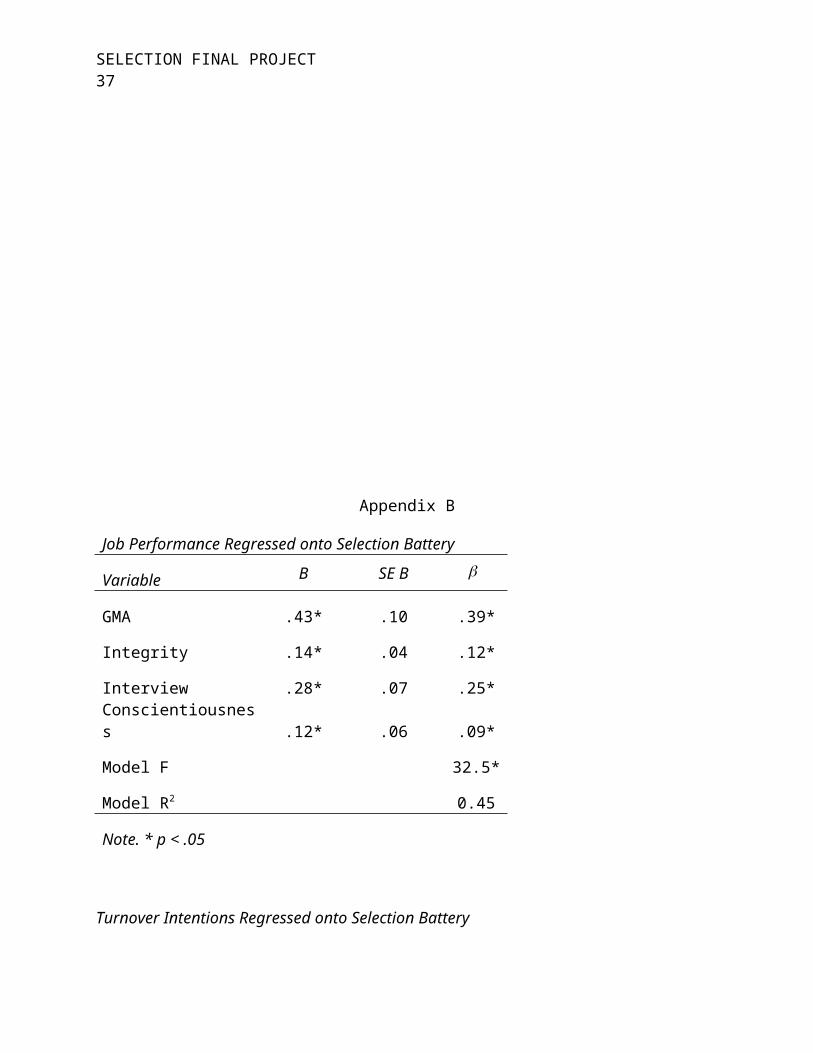
In looking at the regression tables, it appears that conscientiousness is not the best
predictor of job performance, but it may be a fairly good indicator of turnover intentions in
relation to the other variables (See Appendix B). I believe that the conscientiousness measure
does not share a lot of unique variance with the criterion domain in predicting job performance
because it has a β value of .09, meaning that it is only accounting for nine percent of the unique
variance in predicting job performance. The majority of the unique variance that predicts job
performance comes the GMA measure (β = .39) and the interview component (β = .25). Though
the conscientiousness scale β value is still significant at the .05 level, it explains the least amount
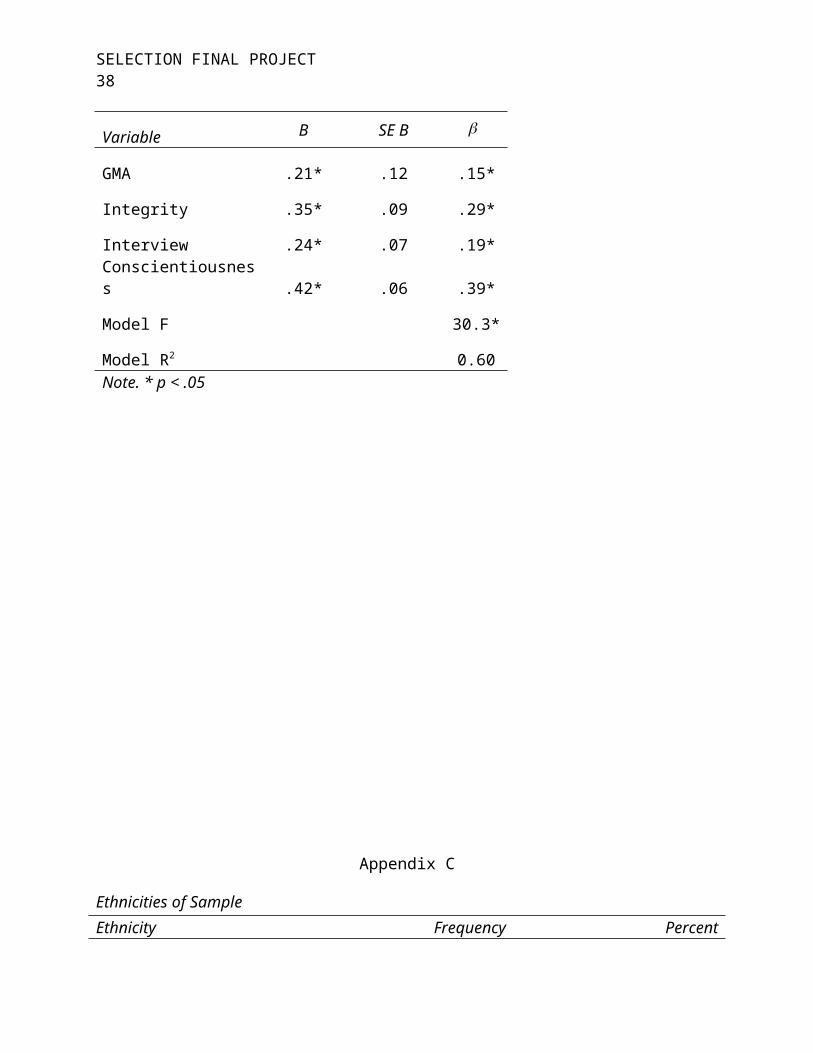
of unique variance in predicting job performance. In examining the regression table for the
measures in relation to turnover intentions, I believe that conscientiousness does share a great
deal of unique variance with the criterion domain in predicting turnover intentions, which is

SELECTION FINAL PROJECT 10
encouraging. With a β value at .39, it is accounting for a much larger percentage of the unique
variance in predicting turnover intentions than any other measure is. It is the best individual
predictor of turnover intentions because of the high percentage of unique variance that it
accounts for in turnover intentions.
In looking at the correlation tables, there are some variables that appear to provide
evidence of multicollinearity with the Conscientiousness variable. As a disclaimer, it is important
to remember that multicollinearity occurs in virtually every variable relationship to a certain
degree. Because of that, multicollinearity is not necessarily a “yes or no issue.” The magnitude is
what truly matters. Though there is not a consensus cutoff value for evidence of
multicollinearity, I will set a subjective minimum value for multicollinearity at .40. The most
obvious evidence of multicollinearity is with the Mechanical Ability variable. With a correlation
of .70 with conscientiousness, it is virtually impossible to tell whether scores on the
conscientiousness scale are the result of the individual’s actual level of conscientiousness or if it
the result of their mechanical ability. With such high Mechanical Ability Scale reliability, it
seems that the correlation is more likely to be the result of multicollinearity associated with the
construct. I am a bit concerned with the multicollinearity that Conscientiousness possibly has
with Mechanical Ability.
In examining evidence of multicollinearity, I am a bit concerned with the utility of the
conscientiousness scale. Any correlation at the .70 value or above should be worrisome because
it may not actually be providing any useful information. In general, multicollinearity creates the
problem of not knowing what construct is driving the scores of individuals on a scale. If
multicollinearity exists with other variables, then we have no way of knowing whether the
differences in scores are the result of the construct of interest or some other factor that is

SELECTION FINAL PROJECT 11
considered irrelevant. In looking at the correlation matrix in general, I am concerned about some
of the correlations in the data.
Section 5
It is appropriate to revisit the evidence that will determine the utility of the
conscientiousness scale at this time. The expectation was that there would be a three factor
model structure and the EFA seems to be consistent with that. There were some factor loading
issues, but overall the model works fairly well with the data. The reliability estimate of the scale
with all items included was a respectable .857. The results of the correlation matrix were
acceptable as a whole, but there were some surprising variable correlations found. For example,
the correlation between the conscientiousness and CWB variables was surprising. However,
some of the correlations that were not consistent with expectations were also associated with the
measure having a lower level of reliability (.60 - .75 range). Others were harder to explain and
are worrisome going forward. According to the regression tables, conscientiousness is not a great
predictor of job performance in comparison to the other variables included in the regression table
(GMA, Integrity, and Interview). It is, however, the best predictor of turnover intentions among
the included variables. Finally, there is some evidence of multicollinearity that could be
troubling in terms of making claims that certain variables are what are causing the differences
between individuals. Adding the scale does seem like it is capable of helping the organization
determine individuals who are more likely to be lost through voluntary turnover. It is a good
predictor of turnover intentions and there is a positive correlation between Conscientiousness and
Turnover Intentions. That seems to suggest that more conscientious individuals are more likely
to leave the organization which is information that should really be helpful in the organizational
retention strategy.
SELECTION FINAL PROJECT 12
The baserate difference between the old and new batteries was encouraging. Higher
baserates are ideal because they represent the proportion of current employees who are
successful in their jobs based on a set Human Resources criterion. The old baserate of .7 is
acceptable because most employees who were hired under the old test battery were expected to
be successful, but the baserate of .9 associated with the new test battery is even more ideal
because more hired employees are likely to be successful in the organization.
The overall selection ratio for the old assessment battery was .43, meaning that the
organization was fairly restrictive in hiring people to the position. For external and internal
hiring decisions, White applicants were hired more often than African-American applicants
were. Female applicants were also hired at higher rates than male applicants. The impact ratios
indicate that there is evidence of adverse impact against African-Americans for both external and
internal hires. The ratios also provide evidence of reverse discrimination against males. More
specific figures for selection ratios and adverse impact statistics can be found in the following
table.
Table 1Origins Total White African-
AmericanMale Female
External Hire
Applicants 1000 700 300 600 400
Hires 450 350 100 225 225Hiring Ratio
0.45 0.50 0.33 0.38 0.56
Impact Ratio
0.66* 0.68**
Internal Hire
Applicants 500 300 200 300 200
Hires 200 150 50 100 100Hiring Ratio
0.40 0.50 0.25 0.33 0.50
Impact Ratio
0.50* 0.66**
Total Hiring 0.43 0.50 0.30 0.36 0.54

SELECTION FINAL PROJECT 13
RatioImpact Ratio
0.60* 0.66**
Notes: * Violates the 4/5 Rule. ** Evidence of Reverse Discrimination. This is the Original Assessment which includes the Wonderlic, Stanton, and Interview components. The baserate for this battery was .70.
The overall selection ratio associated with the new assessment battery is even lower
at .38. That means that the addition of the conscientiousness scale is actually reducing the
number of hires that the organization is making. That in itself is not a problem, and that could
actually be a good thing considering that the baserate increased with the use of the consciousness
scale. Under the new assessment, White applicants were still hired more often than African-
American applicants for external and internal hiring. Overall, female applicants were still hired
at greater rates than their male applicant counterparts. There is evidence of adverse impact
against African-Americans for both external and internal hires and of reverse discrimination
against male applicants. More specific figures for selection ratios and adverse impact statistics
for the new assessment can be found in the following table.
Table 2Origins Total White African-
AmericanMale Female
External Hire
Applicants 1000 700 300 600 400
Hires 400 325 75 200 200Hiring Ratio
0.40 0.46 0.25 0.33 0.50
Impact Ratio
0.54* 0.66**
Internal Hire
Applicants 500 300 200 300 200
Hires 175 150 25 125 50Hiring Ratio
0.35 0.50 0.13 0.42 0.25
Impact Ratio
0.26* 0.60**
Total Hiring Ratio
0.38 0.48 0.20 0.36 0.42

SELECTION FINAL PROJECT 14
Impact Ratio
0.42* 0.86
Notes: * Violates the 4/5 Rule. ** Evidence of Reverse Discrimination. This is the New Assessment which includes the Conscientiousness, Wonderlic, Stanton, and Interview components. The baserate for this battery was .90.
The change in baserate is impressive; however there seems to be stronger evidence of not
only adverse impact, but also of reverse discrimination in the new assessment. There is a major
discrepancy in the selection ratio for African-American applicants in the internal hiring process
with the new assessment compared to the original. I find that to be problematic and something
that I believe hurts the usefulness of the scale. Another interesting finding in the data is that in
using the new assessment battery, there is evidence of adverse impact in internal hiring decisions
that is negatively impacting women applicants. This is something that was not found in the old
assessment battery and it is problematic. Looking at the impact statistics, it is possible that the
conscientiousness scale could be a bit biased toward women with a particular characteristic. I am
not sure what that characteristic is, but there may be some trait that is common among women
who are hired by the organization that is being captured by the scale. By that trait being captured
by the scale, it is possibly producing lower scores for women being considered for internal hiring
decisions, which is decreasing their hiring rates and producing adverse impact.
My recommendation would be for the organization to not use the conscientiousness scale.
There are some major problems with adverse impact, reverse discrimination, and fails to provide
sufficient evidence of concurrent or discriminant validity. The scale is a good predictor of
turnover intentions (which would help the organization) but it should be noted that it is a good
predictor in comparison to the variables that were included in the regression. Including other
variables could negate those findings. There are some psychometric issues that were mentioned
earlier with the scale that concern me. I do believe that a conscientiousness scale could benefit

SELECTION FINAL PROJECT 15
the organization, but I believe that it would be wise to do one of the following: try and improve
the psychometric properties of this scale or just use another one.
For those reasons, I do not believe that the scale is practically feasible. I also do not
believe the scale is financially feasible because the organization’s financial situation is tight and
the problems associated with the scale are not worth the organization’s financial resources or
time. I would make the argument that using this scale could cost the organization more money in
the future with a possible increase in legal claims of adverse impact and reverse discrimination. I
would be a bit concerned with faking on the conscientiousness scale if I were planning on using
it because individuals trying to get a job would want to present themselves in the best light on the
scale, which would introduce social desirability issues. To combat that, I would include some
forced choice responses and on some questions, ask respondents to elaborate through writing
why they chose the answer they did.
Section 6
After the data was collected, the participants were screened to determine whether their
data would be included in the proceeding analyses. Deciding on who to remove from the survey
was a bit difficult but criteria was developed to make the objective decisions. Participants had to
meet certain requirements for their data to be used in the analyses that were run. First, all
students or college athletes without a second eligible job listed were screened out because they
would not provide any relevant information concerning how conscientiousness relates to job
performance or to turnover intentions. Second, students who were student/ graduate assistants
were kept unless they had worked less than six months. The reason for that was because student
assistant jobs can be similar to traditional jobs but there are some differences (ex. expectations,
working time, other outside obligations, etc.) that could make them inherently different from
SELECTION FINAL PROJECT 16
traditional jobs. The six month time limit gives the supervisors of the assistants to accurately
evaluate job performance. That time allows their data to provide useful information. The third
stipulation was that as long as the person had a traditional job where they had to leave the home,
work, and were paid, they were kept in the data; as long as they were on the job for at least three
months. Again, this time requirement gives the person enough time on the job for there to be a
reasonably accurate job performance evaluation. Finally, if the participant had no occupation
listed, then their data was not used because it would not provide any specifically useful
information in terms of job categories. They also present the risk that we are adding more people
who classify themselves as students and athletes. Sample sizes are important, but useful
information is even more important in my opinion. These requirements were designed to remove
data that would not practically be useful in interpreting any findings.
In total, the analyses included a sample of 98 participants. In the sample, 65.3 percent of
the applicants classified themselves as Caucasian and 43.9 percent held entry level positions in
their organizations (See Appendix C). One variable that would have been beneficial to include in
the data is gender. There are statistics for the percent of workers hired by the company by
gender, but we have no way to compare that to the actual data. This affects how confident I am
that the sample is actually representative of the electric company workers, primarily in customer
service positions. Despite this limitation, I would claim that the data appears to be fairly
representative of the population of interest. The majority of applicants for positions at the
organization are Caucasian (66.6 percent), which is consistent with the percentage in the sample.
Also of importance is the fact that the population of interest is for customer service positions,
which would be considered entry level positions. Most of those included in the sample would be
classified as service and sales workers, which would match the sample characteristics (See
SELECTION FINAL PROJECT 17
Appendix D). However, it is vital that gender is included to get a better idea of the sample
generalizability.
Those who were not screened out were placed into one of six job categories. The six
categories were the following: Sales & Service, Administrative & Business (i.e. clerks,
managers, supervisors), Health (i.e. social work, physical and mental health occupations),
Student Assistant (i.e. Graduate Assistant, Student Assistant), Education & Training (i.e.
teachers, school related occupations), and Other (i.e. advisors, agents). The reliability for the
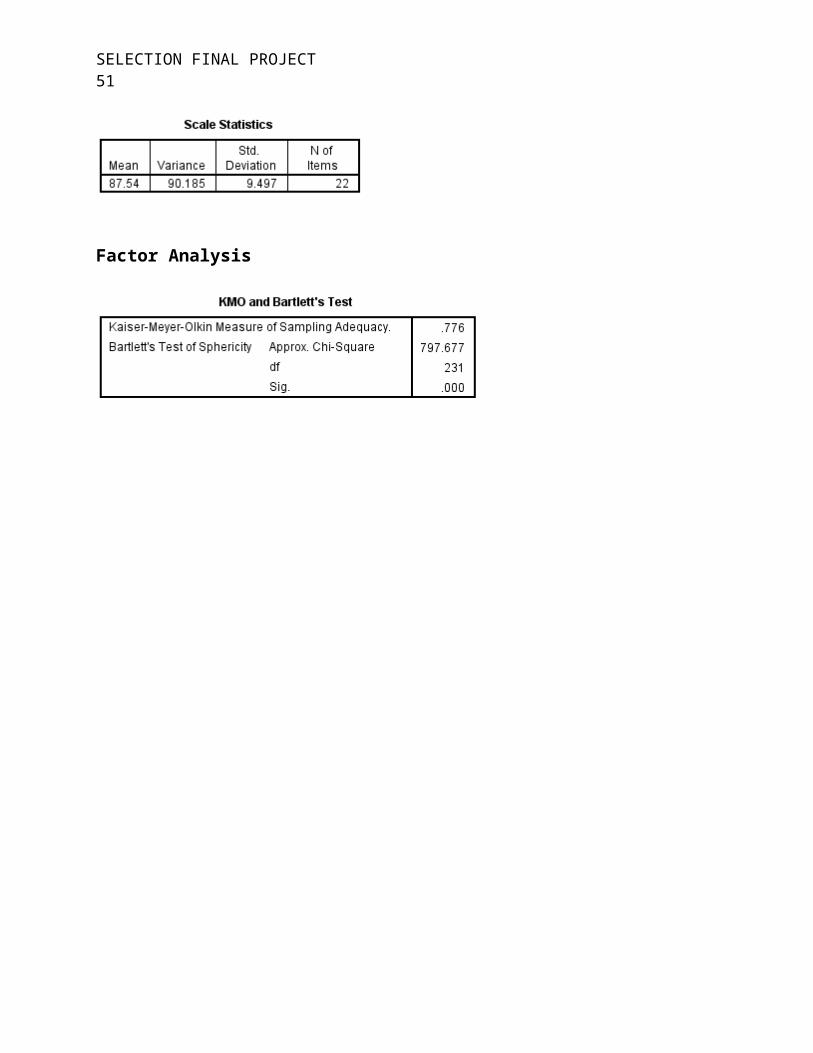
revised conscientiousness scale was .859, which was slightly higher than the reliability of .857
that was observed when all items were included in the scale. The reliability for the protestant
work ethic scale was .674 and the reliability for the turnover intentions scale was .855. The
reliability for the protestant work ethic scale is low and that could actually be attenuating the
correlation between Consciousness and Protestant Work Ethic. The low reliability may be the
result of having items that are more state-based, mixed in with items that are likely to be
answered the same way regardless of the circumstances of the individual when they are
answering the questions. It could also be the result of only having 8 items in the scale.
After running the initial reliability analysis, I made the decision to remove a few items. I
decided to delete Consc5, Consc20, and Consc23. Consc20 was removed because there was no
answer that accurately matched a conscientious individual. A conscientious person would not put
themselves in a situation where they were running behind because they are driven to accomplish
tasks well and plan their time very well. Neither extreme of the answer anchors is a good
reflection of a conscientious person. Refer back to Section 2 for an explanation of why Consc5
and Consc23 were removed from the scale. None of the three items decreased the reliability of
the measure very much. Any incremental decreases in reliability can be acceptable considering

SELECTION FINAL PROJECT 18
that Cronbach’s Alpha is a reliability estimate. It is arguably the best reliability estimate tool, but
it is not perfect.
Overall, it appears that the conscientiousness scale is measuring some aspects
conscientiousness, but that there may be contamination because there is evidence that it may be
measuring some other constructs (See Section 4). The items appear to be covering the different
aspects of the construct domain. However the problem is that the scale has relationships to other
variables that are not appropriate from a theoretical perspective. There are some multicollinearity
concerns and as a result, I am not sure how much of scale responses are being driven by
conscientiousness in comparison to how much they are being driven by other factors or
variables. With this knowledge, I would not be comfortable using this scale as a measure of
conscientiousness because if it is not truly measuring conscientiousness, then the organization
would be making hiring decisions (which I consider high stakes) on a scale measuring some
possibly irrelevant variable. This would hurt the company financially and possibly legally.
The correlation matrix between the three measures used is a bit difficult to interpret. One
of the expected findings was supported and the other was not (See Table 3). The expectation was
that the observed correlation between Conscientiousness and Protestant Work Ethic would be
strongly related and statistically significant because conscientious individuals are hard workers
who put all of their effort into the tasks they have. The matrix provides supporting evidence for
this expectation by being significant at the .01 level. Initially, my expectation was that
Conscientiousness would be negatively correlated with Turnover Intentions and that was not
supported by the correlational analysis. In the correlation among constructs matrix (see
Appendix E), Conscientiousness and Turnover Intentions were had a strong, positive correlation;
because of that evidence, it is surprising to see that Conscientiousness and Turnover Intentions

SELECTION FINAL PROJECT 19
have virtually no relationship in this matrix. The expectation was that because conscientious
individuals give their best at all times, that their organizations would see that and make sure that
they did not leave. This matrix appears to provide evidence that the scale may not be the best to
use because it the Conscientiousness x Turnover Intentions correlation is not even consistent
with correlation found in the correlation among constructs matrix.
Table 3PW TI Consc
PW 1 .074 .408**
TI .074 1 .005Consc .408** .005 1Note: **Correlation is significant at the .01 level.
References

SELECTION FINAL PROJECT 20
Eisenberg, N., Duckworth, A. L., Spinrad, T. L., & Valiente, C. (2012). Conscientiousness:
Origins in childhood?. Developmental Psychology, doi: 10.1037/a0030977
Fayard, J. V., Roberts, B. W., Robins, R. W., & Watson, D. (2012). Uncovering the affective
core of conscientiousness: The role of self-conscious emotions. Journal Of
Personality, 80(1), 1-32. doi: 10.1111/j.1467-6494.2011.00720.x
Roberts, B. W., Jackson, J. J., Fayard, J. V., Edmonds, G., & Meints, J. (2009).
Conscientiousness. In M. R. Leary R. H. Hoyle (Eds.), Handbook of Individual
Differences in Social Behavior (pp. 369-381). New York: Guilford Press.
Appendix A

SELECTION FINAL PROJECT 21
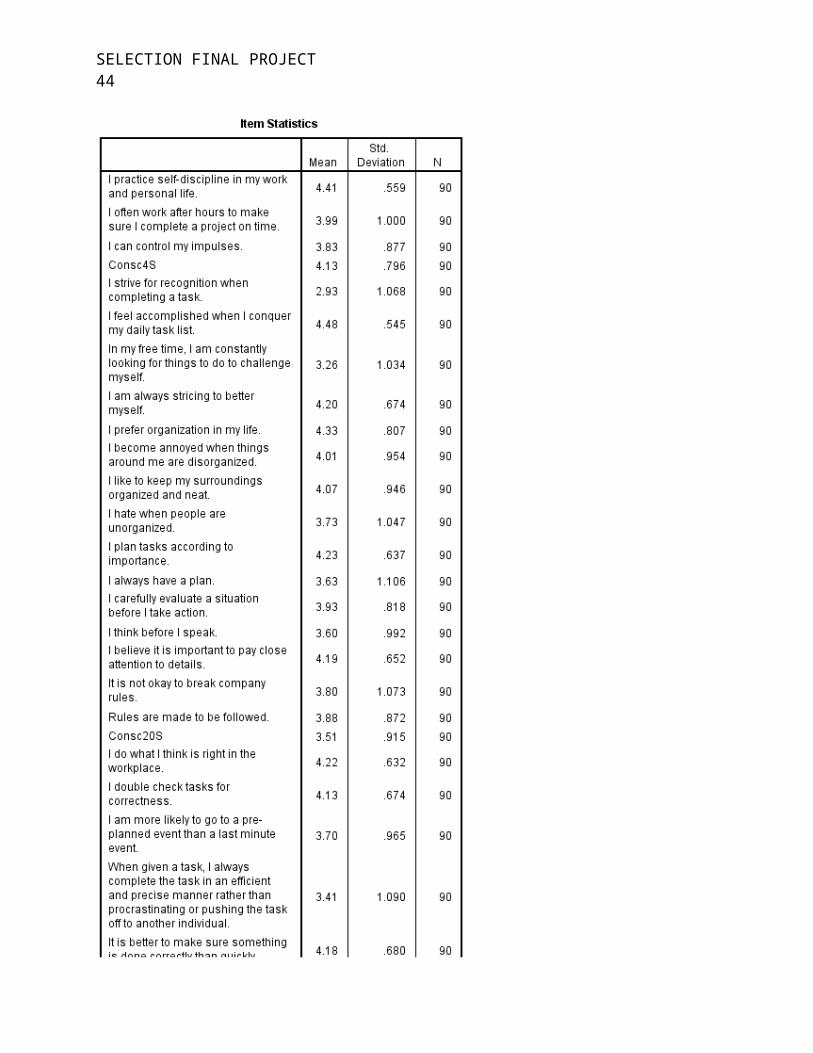
Conscientiousness Scale ItemsItem Code Item Text
Consc1 I practice self-discipline in my work and personal life.Consc2 I often work after hours to make sure I complete a project on time.Consc3 I can control my impulses.Consc4 I don't work as hard as the people around me.Consc5 I strive for recognition when completing a task.Consc6 I feel accomplished when I conquer my daily task list.Consc7 In my free time, I am constantly looking for things to do to challenge myself.Consc8 I am always striving to better myself.Consc9 I prefer organization in my life.Consc10 I become annoyed when things around me are disorganized.Consc11 I like to keep my surroundings organized and neat.Consc12 I hate when people are unorganized.Consc13 I plan tasks according to importance.Consc14 I always have a plan.Consc15 I carefully evaluate a situation before I take action.Consc16 I think before I speak.Consc17 I believe it is important to pay close attention to details.Consc18 It is not okay to break company rules.Consc19 Rules are made to be followed.Consc20 When the deadline is coming close and I am running behind, I feel it's okay to go
around the rules if no harm is done.Consc21 I do what I think is right in the workplace.Consc22 I double check tasks for correctness.Consc23 I am more likely to go to a pre-planned event than a last minute event.Consc24 When given a task, I always complete the task in an efficient and precise manner
rather than procrastinating or pushing the task off to another individual.Consc25 It is better to make sure something is done correctly than quickly.
Note: Consc4S is Consc4 with reverse coded scores.
Protestant Work Ethic Scale ItemsItem Code Item Text
PW1 Most people spend too much time in useless amusement.PW2 The self-made man is likely to be more ethical than the man born to wealth.PW3 Any man who is able and willing to work hard has a good chance of succeeding.PW4 People who fail at a job have usually not tried hard enough.PW5 Life would have very little meaning if we never had to suffer.PW6 Hard work offers little guarantee of success.PW7 If one works hard enough he is likely to make a good life for himself.PW8 A distaste for hard work usually reflects a weakness of character.
Turnover Intentions Scale ItemsItem Code Item Text

SELECTION FINAL PROJECT 22
TI1 I often think about quitting my job with my present organization.TI2 I will probably look for a new job in the next year.TI3 I am considering leaving my job.
Appendix B

SELECTION FINAL PROJECT 23
Job Performance Regressed onto Selection Battery
Variable B SE B
GMA .43* .10 .39*
Integrity .14* .04 .12*
Interview .28* .07 .25*
Conscientiousness .12* .06 .09*
Model F 32.5*
Model R2 0.45
Note. * p < .05
Turnover Intentions Regressed onto Selection Battery
Variable B SE B
GMA .21* .12 .15*
Integrity .35* .09 .29*
Interview .24* .07 .19*
Conscientiousness .42* .06 .39*
Model F 30.3*
Model R2 0.60Note. * p < .05

SELECTION FINAL PROJECT 24
Appendix C
Ethnicities of SampleEthnicity Frequency PercentCaucasian 64 65.3African-American 29 29.6Latino/ Hispanic 2 2.0Other 3 3.1Total 98 100.0
Position Levels of SampleLevel of Position Frequency PercentEntry Level 43 43.9Supervisor 9 9.2Manager 7 7.1Other 39 39.8Total 98 100.0

SELECTION FINAL PROJECT 25
Appendix D
Job Groupings for Included IndividualsJob Grouping Frequency PercentSales & Service 39 39.8Administration & Business 16 16.3Health 7 7.1Student Assistant 9 9.2Education & Training 19 19.4Other 8 8.2Total 98 100.0

SELECTION FINAL PROJECT 26
Appendix E
Correlations among Constructs MatrixVariables 1 2 3 4 5 6 7 8 9
1. Conscientiousness
2. GMA .25* (.90)
3. Integrity .35* .19* (.85)
4. Interview .12* .30* .18* (.70)
5. Task Performance .26* .40* .11 .28* (.80)
6. OCB .29* .18* .34* .15* .20* (.75)
7. CWB .33* -.24* -.30* -.08 -.23* .04 (.60)
8. Mechanical Ability .70* .60* .05 .21* .07 .12* -.06 (.95)
9. Turnover Intentions .37* .12 .19* .18* .60* .00 .30* -.05 (.92)
Note: *p < .05; Cronbach’s Alphas are reported on the diagonal.

SELECTION FINAL PROJECT 27
Appendix F
Data Output
Frequencies
Frequency Table

SELECTION FINAL PROJECT 28
Reliability

SELECTION FINAL PROJECT 29

SELECTION FINAL PROJECT 30

SELECTION FINAL PROJECT 31
Reliability

SELECTION FINAL PROJECT 32
Reliability

SELECTION FINAL PROJECT 33
Reliability

SELECTION FINAL PROJECT 34

SELECTION FINAL PROJECT 35

SELECTION FINAL PROJECT 36
Factor Analysis
SELECTION FINAL PROJECT 37
SELECTION FINAL PROJECT 38

SELECTION FINAL PROJECT 39

SELECTION FINAL PROJECT 40

SELECTION FINAL PROJECT 41
Factor Analysis

SELECTION FINAL PROJECT 42

SELECTION FINAL PROJECT 43
SELECTION FINAL PROJECT 44

SELECTION FINAL PROJECT 45

SELECTION FINAL PROJECT 46
Correlations
Frequencies

SELECTION FINAL PROJECT 47
Means

SELECTION FINAL PROJECT 48

SELECTION FINAL PROJECT 49
Appendix G
Syntax
*Screening Variable.DATASET ACTIVATE DataSet1.USE ALL.COMPUTE filter_$=(Screening = 1).VARIABLE LABELS filter_$ 'Screening = 1 (FILTER)'.VALUE LABELS filter_$ 0 'Not Selected' 1 'Selected'.FORMATS filter_$ (f1.0).FILTER BY filter_$.EXECUTE.
*Demographic Frequency Analyses.DATASET ACTIVATE DataSet1.FREQUENCIES VARIABLES=Ethnicity Major Married Position /STATISTICS=STDDEV MEAN MEDIAN MODE /ORDER=ANALYSIS.
*Demographic Descriptives Analyses.DESCRIPTIVES VARIABLES=HighGPA CurrentGPA CollegeStatus TenureMonths /STATISTICS=MEAN STDDEV MIN MAX.
*Reverse code Consc4.RECODE Consc4 (1=5) (2=4) (3=3) (4=2) (5=1) INTO Consc4S.EXECUTE.
*Reverse Code Consc20.RECODE Consc20 (1=5) (2=4) (3=3) (4=2) (5=1) INTO Consc20S.EXECUTE.
*Reliability Conscientiousness Scale (Original).RELIABILITY /VARIABLES=Consc1 Consc2 Consc3 Consc4S Consc5 Consc6 Consc7 Consc8 Consc9 Consc10 Consc11 Consc12 Consc13 Consc14 Consc15 Consc16 Consc17 Consc18 Consc19 Consc20S Consc21 Consc22 Consc23 Consc24 Consc25 /SCALE('ALL VARIABLES') ALL /MODEL=ALPHA /STATISTICS=DESCRIPTIVE SCALE /SUMMARY=TOTAL.
*Reverse Code PW6.RECODE PW6 (1=5) (2=4) (3=3) (4=2) (5=1) INTO PW6S.EXECUTE.
SELECTION FINAL PROJECT 50
*Reliability Protestant Work Ethic.RELIABILITY /VARIABLES=PW1 PW2 PW3 PW4 PW5 PW7 PW8 PW6S /SCALE('ALL VARIABLES') ALL /MODEL=ALPHA /STATISTICS=DESCRIPTIVE SCALE /SUMMARY=TOTAL.
*Reliability TI.RELIABILITY /VARIABLES=TI1 TI2 TI3 /SCALE('ALL VARIABLES') ALL /MODEL=ALPHA /STATISTICS=DESCRIPTIVE SCALE /SUMMARY=TOTAL.
*Reliability Conscientiosness Scale (With items removed).RELIABILITY /VARIABLES=Consc1 Consc2 Consc3 Consc4S Consc6 Consc7 Consc8 Consc9 Consc10 Consc11 Consc12 Consc13 Consc14 Consc15 Consc16 Consc17 Consc18 Consc19 Consc21 Consc22 Consc24 Consc25 /SCALE('ALL VARIABLES') ALL /MODEL=ALPHA /STATISTICS=DESCRIPTIVE SCALE /SUMMARY=TOTAL.
*EFA Analysis (Original).DATASET ACTIVATE DataSet1.FACTOR /VARIABLES Consc1 Consc2 Consc3 Consc4 Consc6 Consc7 Consc8 Consc9 Consc10 Consc11 Consc12 Consc13 Consc14 Consc15 Consc16 Consc17 Consc18 Consc19 Consc21 Consc22 Consc24 Consc25 /MISSING LISTWISE /ANALYSIS Consc1 Consc2 Consc3 Consc4 Consc6 Consc7 Consc8 Consc9 Consc10 Consc11 Consc12 Consc13 Consc14 Consc15 Consc16 Consc17 Consc18 Consc19 Consc21 Consc22 Consc24 Consc25 /PRINT INITIAL KMO EXTRACTION ROTATION /PLOT EIGEN /CRITERIA MINEIGEN(1) ITERATE(25) /EXTRACTION ML /CRITERIA ITERATE(25) /ROTATION PROMAX(4).
*EFA with 4 Factors Specified.FACTOR
SELECTION FINAL PROJECT 51
/VARIABLES Consc1 Consc2 Consc3 Consc4S Consc6 Consc7 Consc8 Consc9 Consc10 Consc11 Consc12 Consc13 Consc14 Consc15 Consc16 Consc17 Consc18 Consc19 Consc21 Consc22 Consc24 Consc25 /MISSING LISTWISE /ANALYSIS Consc1 Consc2 Consc3 Consc4S Consc6 Consc7 Consc8 Consc9 Consc10 Consc11 Consc12 Consc13 Consc14 Consc15 Consc16 Consc17 Consc18 Consc19 Consc21 Consc22 Consc24 Consc25 /PRINT INITIAL KMO EXTRACTION ROTATION /PLOT EIGEN /CRITERIA FACTORS(4) ITERATE(25) /EXTRACTION ML /CRITERIA ITERATE(25) /ROTATION PROMAX(4).
*EFA with 3 Factors Specified.FACTOR /VARIABLES Consc1 Consc2 Consc3 Consc4S Consc6 Consc7 Consc8 Consc9 Consc10 Consc11 Consc12 Consc13 Consc14 Consc15 Consc16 Consc17 Consc18 Consc19 Consc21 Consc22 Consc24 Consc25 /MISSING LISTWISE /ANALYSIS Consc1 Consc2 Consc3 Consc4S Consc6 Consc7 Consc8 Consc9 Consc10 Consc11 Consc12 Consc13 Consc14 Consc15 Consc16 Consc17 Consc18 Consc19 Consc21 Consc22 Consc24 Consc25 /PRINT INITIAL KMO EXTRACTION ROTATION /PLOT EIGEN /CRITERIA FACTORS(3) ITERATE(25) /EXTRACTION ML /CRITERIA ITERATE(25) /ROTATION PROMAX(4).
*EFA with 2 Factors Specified..FACTOR /VARIABLES Consc1 Consc2 Consc3 Consc4S Consc6 Consc7 Consc8 Consc9 Consc10 Consc11 Consc12 Consc13 Consc14 Consc15 Consc16 Consc17 Consc18 Consc19 Consc21 Consc22 Consc24 Consc25 /MISSING LISTWISE /ANALYSIS Consc1 Consc2 Consc3 Consc4S Consc6 Consc7 Consc8 Consc9 Consc10 Consc11 Consc12 Consc13 Consc14 Consc15 Consc16 Consc17 Consc18 Consc19 Consc21 Consc22 Consc24 Consc25 /PRINT INITIAL KMO EXTRACTION ROTATION /PLOT EIGEN /CRITERIA FACTORS(2) ITERATE(25) /EXTRACTION ML
SELECTION FINAL PROJECT 52
/CRITERIA ITERATE(25) /ROTATION PROMAX(4).
*Mean Scores for PW Scale.DATASET ACTIVATE DataSet1.COMPUTE AvgPW=MEAN(PW1,PW2,PW3,PW4,PW5,PW6S,PW7,PW8).EXECUTE.
*Mean Scores for TI Scale.DATASET ACTIVATE DataSet1.COMPUTE AvgTI=MEAN(TI1,TI2,TI3).EXECUTE.
*Mean Scores for Conscientiousness Scale.DATASET ACTIVATE DataSet1.COMPUTE AvgConsc=MEAN(Consc1,Consc2,Consc3,Consc4S,Consc6,Consc7,Consc8,Consc9,Consc10,Consc11, Consc12,Consc13,Consc14,Consc15,Consc16,Consc17,Consc18,Consc19,Consc21,Consc22,Consc24,Consc25).EXECUTE.
*Correlaton Matrix.CORRELATIONS /VARIABLES=AvgPW AvgTI AvgConsc /PRINT=TWOTAIL NOSIG /STATISTICS DESCRIPTIVES /MISSING=PAIRWISE.
*Frequencies for New Position Groupings.DATASET ACTIVATE DataSet1.FREQUENCIES VARIABLES=JobGrouping /ORDER=ANALYSIS.
*Means for New Position Groups.MEANS TABLES=AvgPW AvgConsc AvgTI BY JobGrouping /CELLS MEAN COUNT STDDEV.
*ANOVA for New Position Groupings.ONEWAY AvgPW AvgConsc AvgTI BY JobGrouping /STATISTICS DESCRIPTIVES /MISSING ANALYSIS /POSTHOC=TUKEY ALPHA(0.05).
Top Related