


Languages
Pages
Legal


Performance Measurement Workgroup Meeting:
01/20/2016

Transformation Activities Update
01/15/2015
3
Transformation Activities to Date GBR Dollars-
In the rates of all hospitals for investments for reducing PAU;
Investment reports for FY2014 and 2015 itemize existing programs or programs that are outside the scope of the Infrastructure dollars.
System Transformation Plan- short-term and long-term strategies and incremental investment plans for improving care coordination and
chronic care, reducing potentially avoidable utilization, and aligning with non-hospital providers;
hospitals should continue to develop their plans and expand their exposure to both hospital-based and non-hospital based providers, patients/families, and other social and public service entities.
Regional Partnerships for Health System Transformation- Designed to facilitate collaboration between hospitals and community-based partners. The plans target
services based on patient and population needs, collaborate on analytics, and plan and develop care coordination and population health improvement approaches that reduce avoidable utilization of Maryland hospitals.
None of the RP plans outlined a hospital-funded, outcomes-based financial incentive plan of sufficient clarity and magnitude that will divert provider attention from strict service-based, fee-for-service reimbursement.
Transformation Implementation proposals due 12/22/15 Specified a set of essential measures that must be measured.

4
HSCRC Key Outcome Measures
Measure Definition Source Population(s) expectedTotal hospital cost per capita
Hospital charges per person HSCRC Casemix Data
All population for covered zips, high utilization set, target population if different, each by race/ethnicity
Total hospital admits per capita
Admits per thousand person HSCRC Casemix Data
Total health care cost per person
Aggregate payments/person HSCRC Total Cost Report
ED visits per capita Encounters per thousand HSCRC Casemix Data
Readmissions All Cause 30-day Inpatient Readmits (see HSCRC specs)
Regional Readmission Reports (CRISP)
Potentially avoidable utilization
Total PAU Charges/Total Charges
PAU Patient Level Reports
Patient experience TBD
Composite quality measure
TBD

5
HSCRC Key Process Measures
Measure Definition Source Population(s) expectedUse of Encounter Notification Alerts
% of inpatient discharges that result in an Encounter Notification System alert going to a physician
CRISP All population for covered zips, high utilization set, target population if different
Completion of health risk assessments
% High utilizers with completed Health Risk Assessments
Partnership High utilization set, target population if different
Established longitudinal care plan
% of High Utilizers Patients with completed care
Partnership High utilization set, target population if different
Shared Care Profile % of patients with care plans with data shared through HIE in Care Profile
CRISP High utilization set, target population if different
Portion of target pop. with contact from assigned care manager
% of High Utilizers Patients with contact with an assigned care manger
Partnership High utilization set, target population if different

6
HSCRC Key Cost/Savings Measures
ROI = G (variable savings) ÷ D (annual intervention) ROI should be greater than 1 at steady state
operations (and get there early)

Consumer Dashboard Draft Metrics
01/15/2015

8
Draft Consumer Dashboard MeasuresMeasure Data Source Frequency Notes
# of observation stays* HSCRC case mix Data
Quarterly
# of Transfers* HSCRC case mix Data
Quarterly
# beds/ downsizing MHCC approved Certificate of Need
Annually Beds versus occupancy rates?
Hospice (or palliative care) use trends*
HSCRC case mix Data
Quarterly
Staffing levels (ED,others)
HSCRC annual filing and wage and salary tables
Annually Schedule D of the hospital Financial Annual Filing enables each hospital to report expenses and FTEs for the following patient care units
ED wait times CMS Emergency Room measures
Quarterly • Inpatient Quality Reporting data for patients admitted
• Outpatient Quality Reporting data for patients not admitted (later)

MHAC FY2018 Policy
01/15/2015

10
Staff Recommend Keeping the Current FY2017 MHAC Methodology for FY2018 Staff believe the current approach balances hospital-specific
incentives with state goals, sets continuous specific quality improvement goals, and focuses the payment adjustments on best and worst performers.
Specific recommendations to update the MHAC policy for FY 2018 include the following: The program should continue to use the same scaling approach:
The program should continue the contingent scaling approach, where a higher level of revenue is at risk if the statewide improvement target is not met. Rewards should only be distributed if the statewide improvement target is met.
Hold-harmless (no-adjustment) zones should be created to focus the payment adjustments to both ends of the performance spectrum.
Rewards should not be limited to the penalties collected. The statewide reduction target should be set at 6 percent,
comparing FY 2015 with CY 2016 risk-adjusted PPC rates.

11
MHAC FY2018 Base Year Information-PPC Tier 1
PPC PPC Description Observed Cases #
FY 2017 Tier
MHA FY 2018 Tier
1 Rec
Low Reliability HSCRC Recommendation
3Acute Pulmonary Edema and Respiratory Failure without Ventilation 1054 1 Y Keep in Tier 14Acute Pulmonary Edema and Respiratory Failure with Ventilation 637 1 Y Keep in Tier 15Pneumonia & Other Lung Infections 674 1 Y Keep in Tier 16Aspiration Pneumonia 496 1 Y Keep in Tier 17Pulmonary Embolism 304 1 Y Keep in Tier 19Shock 512 1 Keep in Tier 1.
14Ventricular Fibrillation/Cardiac Arrest 975 1 Y Keep in Tier 1
16Venous Thrombosis411
1 Keep in Tier 1 . Do not combine.
21Clostridium Difficile Colitis 610 3 Y Move to Tier 1.27Post-Hemorrhagic & Other Acute Anemia with Transfusion 503 2 Y Move to Tier 1.35Septicemia & Severe Infections 507 1 Y Keep in Tier 137Post-Operative Infection & Deep Wound Disruption Without Procedure 378 1 Y Keep in Tier 1
38Post-Operative Wound Infection & Deep Wound Disruption with Procedure 33 1 Y Keep in Tier 1 due to clinical
significance.
40Post-Operative Hemorrhage & Hematoma without Hemorrhage Control Procedure or I&D Proc 920 1 Y Keep in Tier 1
41Post-Operative Hemorrhage & Hematoma with Hemorrhage Control Procedure or I&D Proc 130 2 Y Move to Tier 1.
42Accidental Puncture/Laceration During Invasive Procedure 458 1 Keep in Tier 149 Iatrogenic Pneumothrax 118 1 Keep in Tier 1 .
54 Infections due to Central Venous Catheters 95 1
65Urinary Tract Infection without Catheter 1036 1 Y Keep in Tier 166Catheter-Related Urinary Tract Infection 114 1 Keep in Tier 1.

12
MHAC FY 2018 – PPCs in Monitoring Status
PPC PPC Description Observed Cases #
FY 2017 Tier
MHA FY 2018 Tier
1 Rec
Low Reliability
2Extreme CNS Complications 77 3 Y
15Peripheral Vascular Complications Except Venous Thrombosis 83 3 Y
20Other Gastrointestinal Complications without Transfusion or Significant Bleeding129
3 Y
29Poisonings Except from Anesthesia 71 3 Y
33Cellulitis 195 3 Y

13
MHAC FY 2018 – Combined PPCs
PPC PPC Description Observed Cases #
FY 2017 Tier
MHA FY 2018 Tier
1 Rec
Low Reliability
HSCRC Revised Recommendation (Tier for weighting vs. Monitoring Only)
17Major Gastrointestinal Complications without Transfusion or Significant Bleeding 209
2 Y Tier 2. Combine 17, 18 for scoring.
18Major Gastrointestinal Complications with Transfusion or Significant Bleeding 98
2 Y Tier 2. Combine 17, 18 for scoring.
55Obstetrical Hemorrhage without Transfusion 1033 3 Y Tier 2. Combine PPC 55, 56 for scoring.
56Obstetrical Hemorrhage with Transfusion 494 3 Y Tier 2. Combine PPC 55, 56 for scoring.
57Obstetric Lacerations & Other Trauma Without Instrumentation 891 3 Tier 2. Combine PPC 57, 58 for scoring
58Obstetric Lacerations & Other Trauma With Instrumentation 304 3 Tier 2. Combine PPC 57, 58 for scoring.
25Renal Failure with Dialysis 32
Tier 2. Currently Combined PPC 67 . (PPC 25, 26, 43, 63, 64)
26Diabetic Ketoacidosis & Coma 12
Tier 2. Currently Combined PPC 67 . (PPC 25, 26, 43, 63, 64)
43Accidental Cut or Hemorrhage During Other Medical Care 27
Tier 2. Currently Combined PPC 67 . (PPC 25, 26, 43, 63, 64)
63Post-Operative Respiratory Failure with Tracheostomy 24
Tier 2. Currently Combined PPC 67 . (PPC 25, 26, 43, 63, 64)
64Other In-Hospital Adverse Events 255
Tier 2. Currently Combined PPC 67 . (PPC 25, 26, 43, 63, 64)

14
Benchmark Update – Top 25th best Performance by Patient Population
Hospitals At Risk Observed Expected O/E ratio
Top 25th o/e ratio Benchmark Hospitals
Population covered
Cumulative Patients Cumulative Percent
Top 25th Patients At Risk Benchmark Hospitals
Hospital1 1000 5 10 0.50 Hospital1 1,000 1000 2%Hospital1Hospital2 1000 10 18 0.55 Hospital2 1,000 2000 4%Hospital2Hospital3 1000 15 25 0.60 3000 7%Hospital3Hospital4 1000 30 46 0.65 4000 9%Hospital4Hospital5 1000 60 92 0.65 5000 11%Hospital5
Hospital6 1000 120 171 0.70 6000 13%Hospital6Hospital7 10000 240 343 0.70 16000 35%Hospital7Hospital8 10000 480 600 0.80 26000 57%Hospital9 10000 960 1,067 0.90 36000 78%
Hospital10 10000 1,920 1,920 1.00 46000 100%
Total 46,000 3,840 4,293 Percent population 4% Percent population 35%Bechmark 0.53 Bechmark 0.68

15
MHAC Base Year Information Memo summarizing the changes and baseline information Updated Scaling Points Hospital Base Year Scores Case-level files
RRIP FY2018 Policy
01/15/2015

17
CMMI readmission measure specification refinements reduced the difference between Maryland and National readmission rates to 7.9% in CY2013
Refinements include Requiring 30 day enrollment period after hospitalization Excluding special-licensed beds from Maryland rates similar to
the national rate Refining transfer logic
17.7%15.8% 15.4%
19.2%17.1% 16.6%
0.0%
5.0%
10.0%
15.0%
20.0%
25.0%
V.1 (MD/Nation=8.8%) V.4 (MD/Nation=8.2%) V.5-Final (MD/Nation=7.9%)
Nation MD

18
Maryland is reducing readmission rate faster than the nation
16.3%
15.8%
15.4%15.5%
15.4%
18.2%
17.4%
16.6%16.5%
15.9%
13.5%
14.0%
14.5%
15.0%
15.5%
16.0%
16.5%
17.0%
17.5%
18.0%
18.5%
CY2011 CY2012 CY2013 CY2014 CY 2015 Projected
Nation MD
Reduction in the National Readmission Rate remained small in CY2015
19
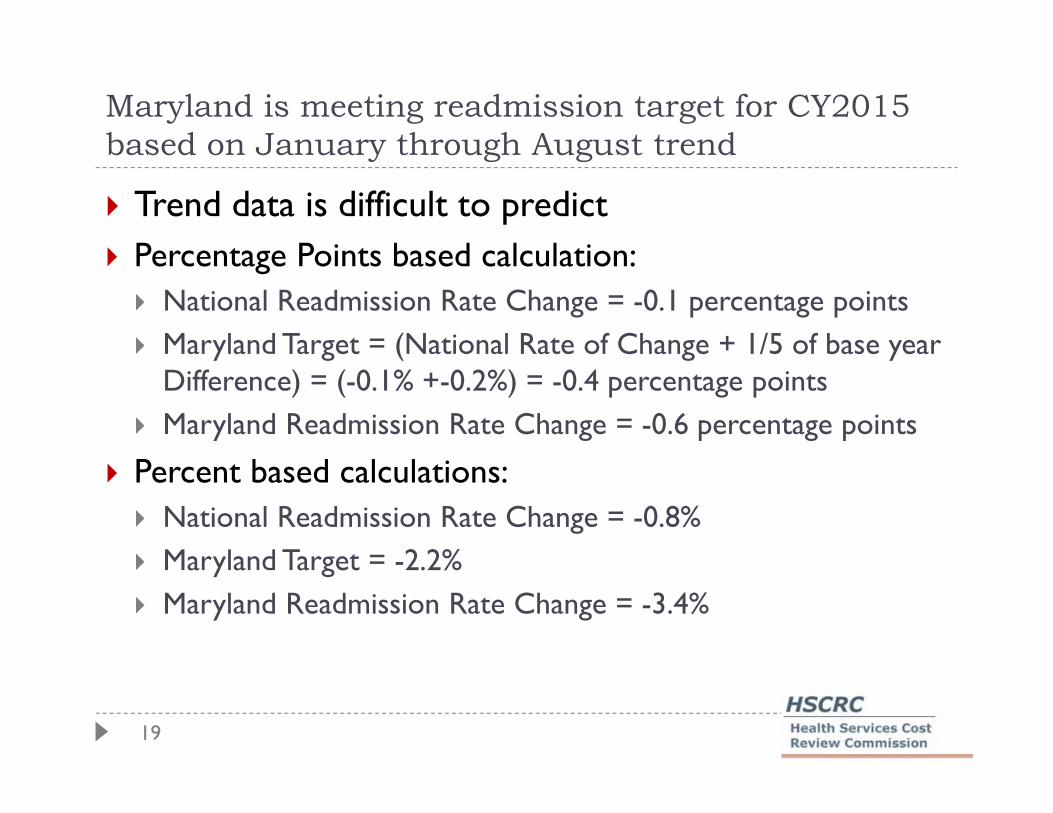
Maryland is meeting readmission target for CY2015 based on January through August trend
Trend data is difficult to predict Percentage Points based calculation: National Readmission Rate Change = -0.1 percentage points Maryland Target = (National Rate of Change + 1/5 of base year
Difference) = (-0.1% +-0.2%) = -0.4 percentage points Maryland Readmission Rate Change = -0.6 percentage points
Percent based calculations: National Readmission Rate Change = -0.8% Maryland Target = -2.2% Maryland Readmission Rate Change = -3.4%

20
CMMI Year to Date (August) Target Calculation (Percent Point Based Calculation)
Nation MD MD- US Difference
% ReadmissionsPercent Change
in Rate of Readmits
% Readmissions Percent Change in Rate of Readmits % Readmits
c1 c2 c3 c4 c5CY2011 L1 16.3% 18.2% 1.9%CY2012 L2 15.8% -0.5% 17.4% -0.8% 1.7%CY2013 L3 15.4% -0.4% 16.6% -0.8% 1.2%CY2014 L4 15.5% 0.1% 16.5% -0.1% 1.0%
CY 2014 YTD 15.5% 16.5%CY 2015 YTD 15.4% -0.1% 16.0% -0.6% 0.6%CY 2015 Projected 15.4% -0.1% 15.9% -0.6% 0.5%
CY 2015 Target 16.1% -0.4% 0.7%
Targets for Future YearsCY2016 L5 15.3% -0.1% 15.6% -0.3% 0.4%

21
CMMI Year to Date (August) Target Calculation (% Based Calculation)
Nation MD MD- US Difference
% ReadmissionsPercent Change
in Rate of Readmits
% Readmissions Percent Change in Rate of Readmits % Readmits
c1 c2 c3 c4 c5CY2011 L1 16.29% 18.17%CY2012 L2 15.76% -3.3% 17.42% -4.1% 10.5%CY2013 L3 15.39% -2.3% 16.61% -4.6% 7.9%CY2014 L4 15.50% 0.7% 16.47% -0.8% 6.3%
CY 2014 YTD 15.49% 16.54%CY 2015 YTD 15.38% -0.75% 15.98% -3.4% 3.93%CY 2015 Projected 15.38% -0.75% 15.91% -3.4% 3.43%
CY 2015 Target 16.11% -2.21% 4.7%
Targets for Future YearsCY2016 L5 15.27% -0.75% 15.62% -1.85% 2.3%
22
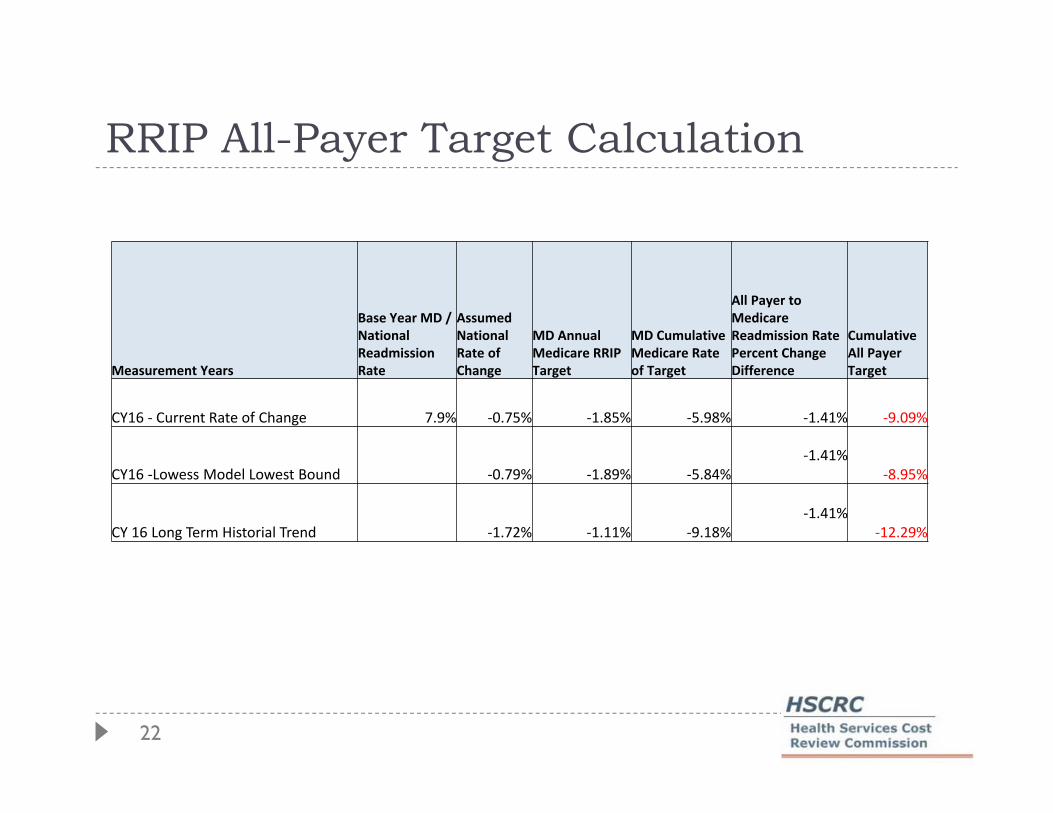
RRIP All-Payer Target Calculation
Measurement Years
Base Year MD / National Readmission Rate
Assumed National Rate of Change
MD Annual Medicare RRIP Target
MD Cumulative Medicare Rate of Target
All Payer to Medicare Readmission Rate Percent Change Difference
Cumulative All Payer Target
CY16 - Current Rate of Change 7.9% -0.75% -1.85% -5.98% -1.41% -9.09%
CY16 -Lowess Model Lowest Bound -0.79% -1.89% -5.84%-1.41%
-8.95%
CY 16 Long Term Historial Trend -1.72% -1.11% -9.18%-1.41%
-12.29%

23
Projecting readmission rates is difficult: Annual rate of change in December was quite different than the one in August in CY 2014
-0.6%
-0.9%
-0.6%
-0.1% -0.1%
0.1% 0.2% 0.2%
0.4% 0.4%0.6%
0.7%
2.2%
1.0%
0.4%
-0.6%
-0.3%
0.3%
-0.2%
-0.6% -0.6%-0.5% -0.5%
-0.9%
-0.015
-0.01
-0.005
0
0.005
0.01
0.015
0.02
0.025
Jan Feb Mar Apr May Jun Jul Aug Sep Oct Nov Dec
Cumulative Annual Rate of Change: National vs Maryland Readmission Rate
Nation-2014
MD-2014

24
National rate of decline is speeding up, while Maryland’s is slowing down based on September preliminary data
-0.8%
-0.3% -0.4%-0.6%
-0.5% -0.5%-0.6%
-0.8%
-1.1%
-4.4%
-3.6%
-2.9%-3.0%
-3.3%-3.4%
-3.5%-3.4%
-3.2%
-0.05
-0.045
-0.04
-0.035
-0.03
-0.025
-0.02
-0.015
-0.01
-0.005
0
Jan Feb Mar Apr May Jun Jul Aug Sep
Cumulative Annual Rate of Change: National vs Maryland Readmission Rate
Nation-2015
Md-2015

Hospital Readmission Rate Improvement Year to Date
01/15/2015
26
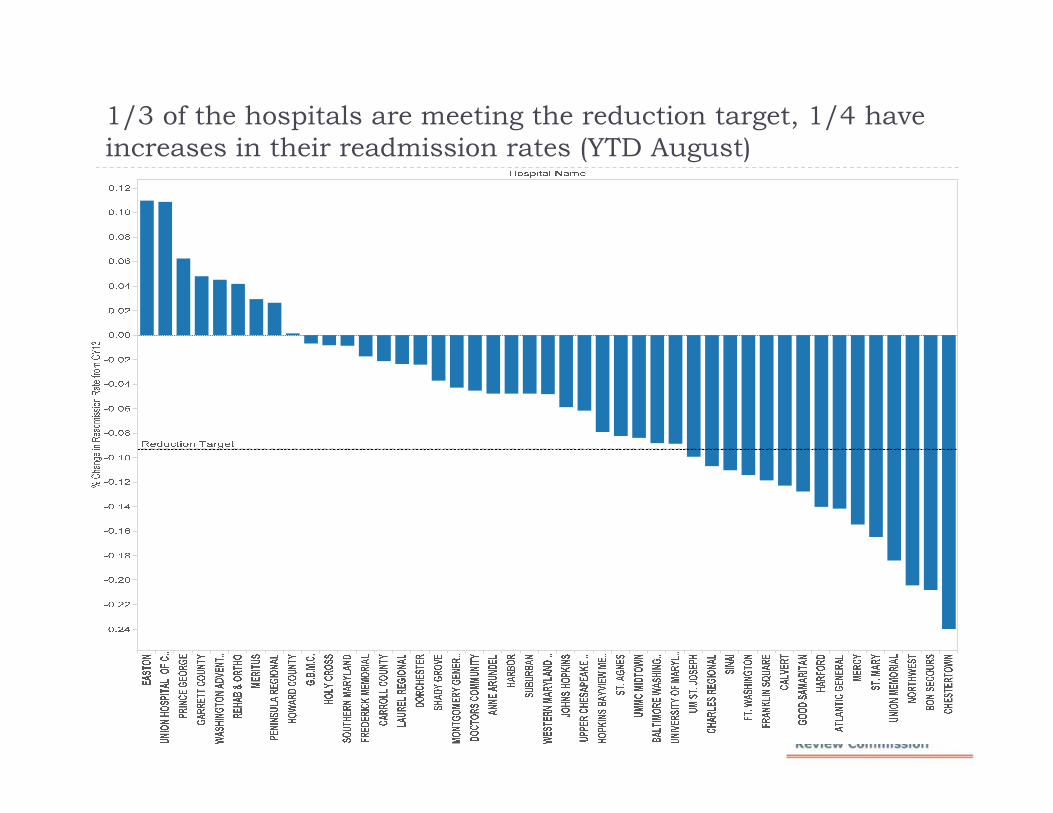
1/3 of the hospitals are meeting the reduction target, 1/4 have increases in their readmission rates (YTD August)

27
Considerations from FY 2017 Approved Recommendations Continue to set a minimum required reduction
benchmark on all-payer basis and re-evaluate the option to move to a Medicare specific performance benchmark for CY2016 performance period.
Continue to assess the impact of admission reductions, SES/D, all-payer, and Medicare readmission trends and make adjustments to the rewards or penalties if necessary.

28
Statewide All-Payer and Medicare readmission improvement rates are strongly correlated
% C
hang
e in
Rea
dmis
sion
Rat
e fro
m C
Y13
Correlation Coefficient=0.80

29
Hospital Performance on All-Payer and Medicare readmission reductions vary

30
Socio-Economic Factors We appreciate Dr. Amy Kind and Commissioner Dr. Steve
Jencks contributions* Staff is working on 2013 Area Deprivation Index (ADI) at
the block-group (smaller than zip code) level Components of ADI include* Education Income Poverty Housing Cost Housing Quality Employment Single-parent Households
*Neighborhood Socioeconomic Disadvantage and 30-Day Rehospitalization: A Retrospective Cohort Study, Ann Intern Med. 2014;161(11):765-774. doi:10.7326/M13-2946

31
ADI and Readmissions Initial analysis indicate strong correlation between
ADI and Readmission Rates even after controlling for case-mix
Hospital level analysis are underway Preliminary results

32
Preliminary results show no correlation between ADI and readmission reductions
Correlation Coefficient=-0.30

33

34
Hospital ADI Distribution
0.00%
10.00%
20.00%
30.00%
40.00%
50.00%
60.00%
70.00%
0.00
20.00
40.00
60.00
80.00
100.00
120.00
140.00
SUBU
RBA
NC
ALV
ERT
AN
NE
AR
UN
DEL
CA
RR
OLL
CO
UN
TY
HO
WA
RD
CO
UN
TY
SHA
DY
GRO
VE
FRED
ERIC
K M
EMO
RIA
LM
ON
TG
OM
ERY
GEN
ERA
LST
. MA
RY
CH
AR
LES
REG
ION
AL
UPP
ER C
HES
APE
AK
E H
EALT
HBW
MC
FT. W
ASH
ING
TO
NLA
URE
L RE
GIO
NA
LU
M S
T. J
OSE
PHH
OLY
CR
OSS
G.B
.M.C
.SO
UT
HER
N M
AR
YLA
ND
CEC
ILD
OC
TO
RS
CO
MM
UN
ITY
EAST
ON
AT
LAN
TIC
GEN
ERA
LM
ERIT
US
GA
RR
ETT
CO
UN
TY
WA
SHIN
GT
ON
AD
VEN
TIS
TFR
AN
KLI
N S
QU
AR
ER
EHA
B &
OR
THO
HA
RFO
RD
CH
EST
ERT
OW
NPR
INC
E G
EOR
GE
NO
RT
HW
EST
WES
TER
N M
AR
YLA
ND
ST. A
GN
ESD
OR
CH
ESTE
RPE
NIN
SULA
REG
ION
AL
UN
IVER
SIT
Y O
F M
AR
YLA
ND
JOH
NS
HO
PKIN
SG
OO
D S
AM
AR
ITA
NH
AR
BOR
HO
PKIN
S BA
YVI
EW M
ED C
TR
SIN
AI
UN
ION
MEM
OR
IAL
MER
CY
UM
MC
MID
TO
WN
BON
SEC
OU
RS
% P
atie
nts
from
Mos
t D
epri
ved
Are
as (
top
85%
)
Mea
n A
DI S
core
All-Payer Mean ADI % All-Payer Patients >=85th ADI Percentile

35
Hospitals with large readmission reductions also have large overall reductions in overall admissions
% C
hang
e in
Rea
dmis
sion
Rat
e fro
m C
Y13
Correlation Coefficient=0.58

36
CY 2013 Readmission Rate and Improvement

Aggregate At Risk FY2018 Policy
01/15/2015

38
Medicare vs Maryland Aggregate At Risk Regulated Revenue at risk: [Maryland] must ensure that the
aggregate percentage of Regulated Revenue at risk for quality programs administered by the State is equal to or greater than the aggregate percentage of revenue at risk under national Medicare quality programs. Quality programs include, but are not limited to, readmissions, hospital acquired conditions, and value-based purchasing programs.

39
Potential at Risk Potential Risk:Maryland - Potential Inpatient Revenue at Risk absolute values
% Inpatient Revenue SFY 2014 SFY 2015 SFY2016 SFY2017 MHAC 2.0% 3.0% 4.0% 3.0%RRIP 0.5% 2.0%QBR 0.50% 0.50% 1.00% 2.0%Shared Savings 0.41% 0.86% 1.35% 1.35%GBR PAU: 0.50% 0.86% 1.10% 1.10%
MD Aggregate Maxium At Risk 3.41% 5.22% 7.95% 9.45%*Italics are estimated numbers based on current policy.
Medicare National - Potential IP revenue at risk absolute values% IP Rev FFY 2014 FFY 2015 FFY2016 FFY2017HAC 1.00% 1.00% 1.00%Readmits 2.00% 3.00% 3.00% 3.00%VBP 1.25% 1.50% 1.75% 2.00%
Medicare Aggregate Maxium At Risk 3.25% 5.50% 5.75% 6.00%
Cumulative MD-US Difference 0.16% -0.12% 2.08% 5.53%
40
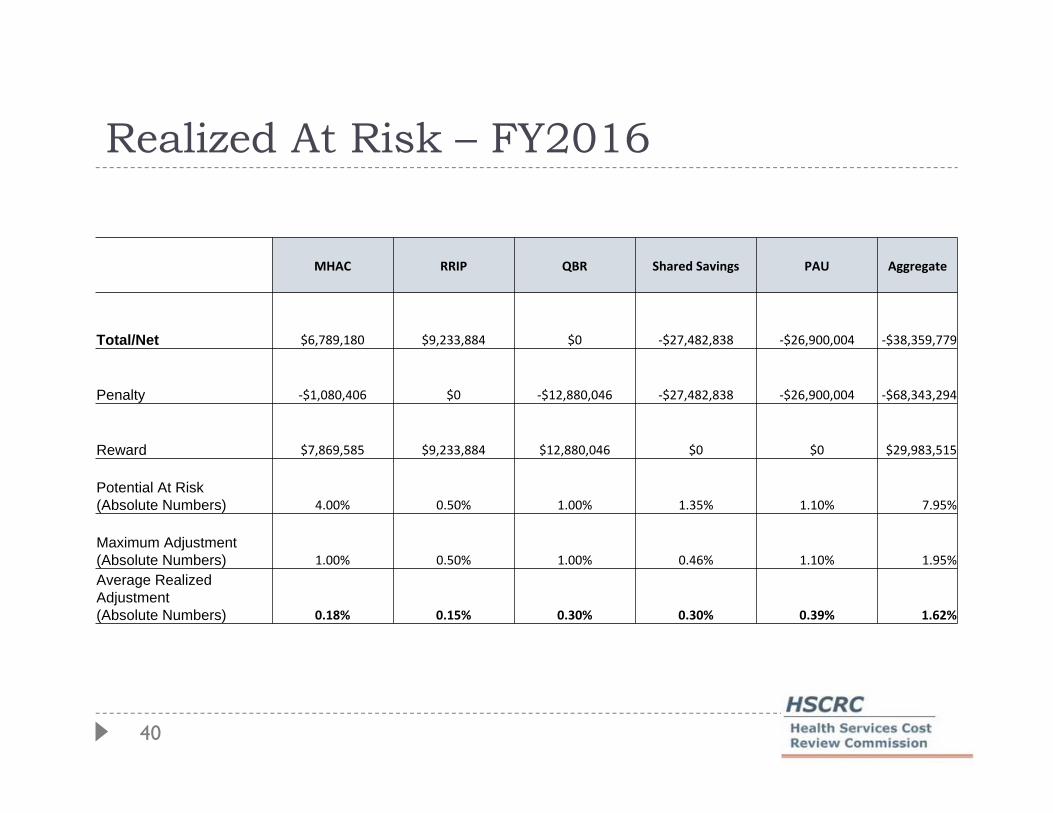
Realized At Risk – FY2016
MHAC RRIP QBR Shared Savings PAU Aggregate
Total/Net $6,789,180 $9,233,884 $0 -$27,482,838 -$26,900,004 -$38,359,779
Penalty -$1,080,406 $0 -$12,880,046 -$27,482,838 -$26,900,004 -$68,343,294
Reward $7,869,585 $9,233,884 $12,880,046 $0 $0 $29,983,515
Potential At Risk (Absolute Numbers) 4.00% 0.50% 1.00% 1.35% 1.10% 7.95%
Maximum Adjustment (Absolute Numbers) 1.00% 0.50% 1.00% 0.46% 1.10% 1.95%Average Realized Adjustment (Absolute Numbers) 0.18% 0.15% 0.30% 0.30% 0.39% 1.62%
41
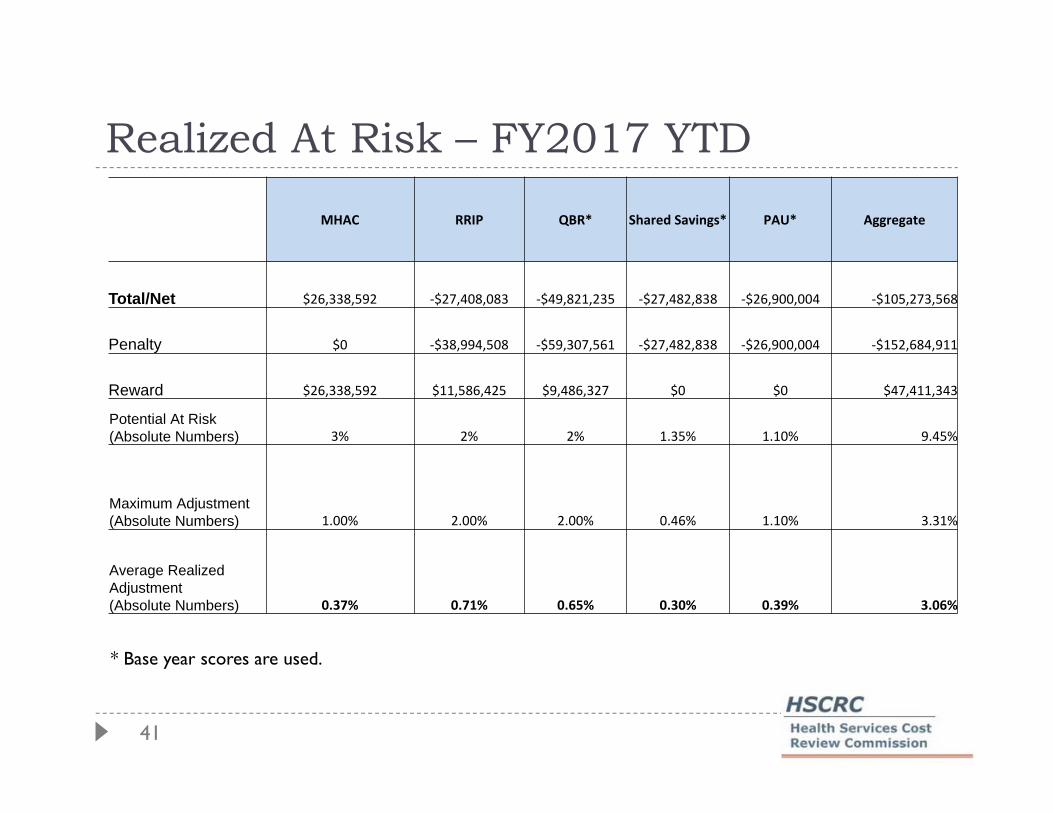
Realized At Risk – FY2017 YTD
MHAC RRIP QBR* Shared Savings* PAU* Aggregate
Total/Net $26,338,592 -$27,408,083 -$49,821,235 -$27,482,838 -$26,900,004 -$105,273,568
Penalty $0 -$38,994,508 -$59,307,561 -$27,482,838 -$26,900,004 -$152,684,911
Reward $26,338,592 $11,586,425 $9,486,327 $0 $0 $47,411,343
Potential At Risk (Absolute Numbers) 3% 2% 2% 1.35% 1.10% 9.45%
Maximum Adjustment (Absolute Numbers) 1.00% 2.00% 2.00% 0.46% 1.10% 3.31%
Average Realized Adjustment (Absolute Numbers) 0.37% 0.71% 0.65% 0.30% 0.39% 3.06%
* Base year scores are used.

42
FY 2018 Proposed Percent at Risk
Max Penalty Max Reward
MHAC Below target -3.0% 0.0%
MHAC Above Target -1.0% 1.0%
RRIP -2.0% 1.0%
QBR -2.0% 1.0%
Top Related