


Languages
Pages
Legal


Harpreet Singh, International Journal of Research in Engineering, IT and Social Sciences, ISSN 2250-0588,
Impact Factor: 6.452, Volume 08 Issue 05, May 2018, Page 14-27
http://indusedu.org Page 14
This work is licensed under a Creative Commons Attribution 4.0 International License
Perception of B2B Sales Force towards
Training and Development:
A Study on Selected Lubricant Companies
Harpreet Singh1 and Dr. Lalit Singla
2
1(Research Scholar, Department of Commerce and Management, Sri Guru Granth Sahib World University,
Fatehgarh Sahib (Punjab) India) 2(Assistant Professor, Department of Commerce and Management, Sri Guru Granth Sahib World University,
Fatehgarh Sahib (Punjab) India)
Abstract: Training is one of the important functional requirements of any organization these days. To stay
competitive in recent global arena wherein lubricant sector which is marginally growing at rate of 3-4% are
putting their “employees first” even much before the business. To increase the efficiency and effectiveness of
both the employee and organization, lubricant industry is putting lot of time money and efforts in employee
development programs. Hence companies have realized that by developing the employees in various spheres of
knowledge, skill and attitude via regular trainings would surely increase the productivity of the organization
too. The premise of this paper is to study the perception of B2B sales force towards training and development in
selected lubricant industries spread across the four regions/zones (N-E-W-S) of India. Also attempt is to inspect
the variance between the perception of employees about T&D across Public, MNC’s and Private companies of
lubricant sector of India and finally to assess the employees satisfaction about T&D and offer suggestions &
recommendations about the same to have a favorable organizational climate. To achieve the objectives of this
study a well-structured questionnaire containing 47 statements was used for primary data collection. On a five
point likert scale ranging from strongly disagrees to strongly agree the respondents were asked to rate.
Statistical tool (SPSS) wherein one way ANOVA & two-way ANOVA technique have been used to analyze the
data. Diagrams and tables have been used to analyze the data. Tools used revealed the positive perception &
attitude of B2B sales force about T&D though there is variance across the regions (N-E-W-S) of India and even
substantial variance across public, private & multi-national companies of lubricant sector.
Keywords: B2B-Business to Business; N-E-W-S-North, East, West, South; PSU’s- Public Sector Undertakings;
MNC’s-Multi-National Companies, T&D-training and development , BU’s-Business units, BSIV-Bharat stage 4,
BSVI-Bharat Stage 6, EV’s-Electric Vehicles.
I. INTRODUCTION Lubricant Sector
Lubrication is an effective means of controlling wear and reducing friction. Lubricating oils are
extremely crucial products without which no machinery/engine can operate. Almost all sophisticated
automotive/industrial products developed these days require distinctive lubricant product due to which lubricant
industry is innovating day & night then be it BSIV or upcoming BSVI engines or EV’s. These distinctive
products comprise more than 600 products with different viscosities & quality levels. Hence this field require
multidisciplinary efforts from various fields –Chemical, Mechanical, Polymer Science, Chemistry, Physics &
Metallurgy etc Lubricants Selling is mainly divided into two (2) Major BU’s:-Retail Sales (Bazar trade) and
Industrial Sales. In Retail/Automotive Sales B2C (Business to Consumer) professionals and Industrial Sales
B2B (Business to Business) professionals are the key stakeholders.
India is the third largest lubricant market globally in volume terms behind the US and China. Lubricant
Industry is changing its dynamics very soon and there is a major structural change which has already begun
from volume growth to value growth with sustainable profits and major Share of Business which is not possible
without quality Front Line Managers
Indian lubricants industry in India is categorized into three (3) sectors national oil companies (PSU’s)-
IOCL, BPCL & HPCL that account for almost half of market share. Leading MNC’s are Castrol-BP, Valvoline,
Shell, Exxon Mobil, Total & Petronas and numerous smaller & local private players big names like-APAR, Raj
petro, Savsol, NPL are also governing a major market share.
Training and Development (T&D)
Training is the process which develops & increases the efficiency, capacity and effectiveness of the
employees as well as of organizations. Objective is to help develop the knowledge, skills & attitude which are
relevant to his or her job. To prepare the employees for handling new and higher job responsibilities arising out

Harpreet Singh, International Journal of Research in Engineering, IT and Social Sciences, ISSN 2250-0588,
Impact Factor: 6.452, Volume 08 Issue 05, May 2018, Page 14-27
http://indusedu.org Page 15
This work is licensed under a Creative Commons Attribution 4.0 International License
of lateral movements, succession planning’s & promotions. T&D is an on-going process which helps to develop
a culture of continuous learning, improvement, innovation, openness, trust & team spirit. Trainings are provided
as per departmental/organizational needs after the discussion & approvals from Sales head and HR head. It is an
application of knowledge to improve the performance on the current job wherein the training gaps are identified
by the employee itself or reporting manager while in quarterly or annual performance appraisals. Since
organizations have realized the importance of “human capital” in lieu of that conduct various types of training at
regular intervals say starting with Induction training for the new joinees to understand the organizational
structure and functioning of the organization. Technical & functional trainings to enhance the technical know-
how of the products being sold, new skill acquisitions or up gradation about the technological shift of the
market. Web based training for capability building on IT usage for employees likewise for various CRM tools.
Behavioral/attitudinal trainings relevant to different levels of organizations.
Since the trained employees are the valuable assets to any organization so are trained after the gap
between the job requirements & employees present specifications is identified subsequent to which HR makes
the Annual training calendar and arrange for the implementation based on the internal or external training
requirement. Faculty & content assessment is also an important factor in effectiveness of T&D which is
thoroughly done by HR/HOD’s. Training feedback is documented by HR via T&D evaluation form and even pre
& post assessment are done to assess the perception & attitude about the T&D, evaluation form is asked for,
documented and followed-up so as to have successful implementation of the same to ensure favorable
organizational culture and environment.
II. REVIEW OF RELATED LITERATURE To have the accurate feedback from the sales force about the perception & to assess their satisfaction
level from T&D, is the need of the hour across various sectors for which various researches are being carried out
across globe. Though major studies I have come across have been carried out in service sector like Healthcare
industry, Mining, IT sector, Banks, Education, PSU’s and Automotive products but very limited have been
carried out in lubricant sector which calls for the need of this study.
S Jency (2016) in “A study on employee perception towards training and development at Indian rare
earth limited (IREL)” through this study tried to assess the perception of the employees of IREL (Indian rare
Earth Limited, Kollam) about T&D, their feedback, level of satisfaction post T&D and even their suggestions
and recommendations for successful implementation of the same at IREL to create a favorable organizational
climate. Herein employee’s preference was also identified on training methods and duration of the same. The
study was exploratory in nature with responses through well-structured questionnaire from 100 Employees in
25days with data collected via primary method with employing convenient sampling technique & data from
company magazines, journals & website as secondary method. Herein the researcher concluded that employees
have a very positive attitude and perception about the T&D and accepted the same wholeheartedly. This study
throws us some good insights about the perceived value of T&D by the employees.
Joshi Parikshit & Srivastava Anuj (2012) in “Examining the HRD Practices in India PSU’S” (With
Special Reference To IOC Mathura Refinery) .This study is somewhat related to our subject matter research
where in this research has bene carried out to examine the problematic areas in HRD Climate of IOCL and HRD
Subsystems of the same. Also interlinkages between HRD Subsystems and their effectiveness in Indian PSUs
were examined. Sample size was 300 Employees drawn using probability systematic sampling technique and 48
Managers selected using probability simple random sampling technique. A well- structured questionnaire
checked using Cronbach’s Alpha was used to collect data from Managerial and Non-Managerial employees of
the Refinery. Cross-section descriptive type with field study was used as a research design for this research
study. To test the hypothesis SPSS-Chi-square statistics was used. It was concluded from the study that HRD
system of this PSU is conducive for the development of the employees. Conclusion also indicated that HRD
function is poorly structured & staffed, is differentiated inadequately and fails to meet the requirements of HRD
system framework. This study focused on only 7 key dimensions of HRD Climate and hence is not exhaustive.
Training needs of employees are completely met at this refinery as reported by 93.75% managers and 66.67%
employees and perceived value of T&D by all employees is taken in a paramount importance at the refinery.
Dr.Murty T.N and Fathima Faiza (2013) in “Perception and Attitude of Employees towards Training
and Development in Public Sector Unit” In this research paper study was conducted using descriptive &
analytical type of methodology wherein primary and secondary data was collected. Primary data was collected
using structured questionnaire survey method wherein the scaling technique was used based on the optional and
statement type questions based on 5-point Likert scale. Though the population in permanent grades at selected
PSU‘s is 2130 but 700 questionnaires were floated out of which 402received back with only 400 were usable ,in
this way sample size selected was systematic but sampling technique was Random sampling for generating the
data. Herein the objectives of the study were to study the perception and attitude of employees of PSU’s towards

Harpreet Singh, International Journal of Research in Engineering, IT and Social Sciences, ISSN 2250-0588,
Impact Factor: 6.452, Volume 08 Issue 05, May 2018, Page 14-27
http://indusedu.org Page 16
This work is licensed under a Creative Commons Attribution 4.0 International License
T&D and their suggestions & recommendations for successful implementation of T&D at PSU’s to create a
favorable organizational climate. Statistical tools –SPSS –T-test were used to analyze the data wherein the
findings conclude that employees of PSU’s accept T&D practices in wholehearted manner and their attitude
towards T&D practices is greatly positive like towards work environment, job satisfaction, nature of job,
training and pay structure etc.it is observed that T&D practices have deep impact on the employees and motivate
them. Only drawback of the study is that they haven’t done any comparison with MNC or Private sector
employees or across the regions of India.
Wahab, et al (2014) in “Employees’ Perception and Motivation Towards Training and Development
Programmes in Health Sector of Pakistan: A Case Study of Khyber Pakhtun Khwa” revealed in this study that
there is no systematic and strategic approach for conducting T&D programs in health sector of Khyber Pakhtun
Khwa (public sector) and herein organizational environment and political intervention were identified as the
most important barriers for effectively conducting the T&D. In these study employees of this Pakistan’s PSU
health sector perceive T&D just as a formality and not any value addition or benefit to their current job as they
are perceived as low productive employees who further lead to low motivation, customer complaints and
decreased productivity. In nutshell KPK PSU health sector doesn’t see any benefits in T&D. Even in this study
no comparison has been discussed with Private or MNC sectors which are again the limitation which calls for
our study on lubes sector across regions and across sectors.
III. NEED & SIGNIFICANCE OF THE STUDY Though major studies wherein I have come across have been carried out in service sector like
Healthcare industry, Mining, IT sector, Banks, Education, PSU’s and Automotive products but very limited
have been carried out in lubricant sector and there many gaps too which calls for the need of this study. Even the
information provided is not suitable and sufficient in current context with missing links in review of literature
too .In lieu of the above cited reasons this study is called for to fill the gaps and to add to the existing literature
in this lubricants field. In this study we will be focusing on the perception of B2B frontline sales managers about
training & developmental in Lubricant Industry spread across the Lubricant sector of India. Hence in this paper
we have examined the comparison between the perception of sales force about T&D across public, private &
multi-national companies and across regions N-E-W-S. The present study done is exploratory research by the
means of primary data analysis to assess the perception score towards T&D across lubricant sector-Public,
MNC’s & Private sector companies and across 4regions(N-E-W-S) of India with the help of well -structured
questionnaire. The questionnaire is based on 5-point Likert scale, ranging from strongly disagrees to strongly
agree. Here in multi-stage random sampling technique is used to collect the primary data from the respondents.
In this mass survey due to time constraints, convenience sampling was used to collect the data from the
respondents
Objectives of the study To study the perception of B2B sales force of the companies under study towards training programs
run by the companies.
Hypothesis
HO: There is no significant difference in the perception of B2B sales force of the companies under
study towards training programs run by the companies.
IV. RESEARCH METHODOLOGY Primary data has been collected from lubricant companies from complete India to achieve the objectives of
the study. The study covered current period and respondents from B2B functional group of various lubricant
companies from public, multi-national and private spread across India. Multi-stage random sampling technique
is applied in this study. In first stage lubricant companies are identified and in second stage sample size via
convenience sampling. A total of 450 questionnaires have been distributed to 450 Front line manager (5
companies from all 3 blocks-Public, Private & MNC’s are identified for the study with 4 block offices (North-
East-West-South) across India with 5-8 FLM’s in each of the 4-regions, so 100-150 respondents from each
block identified under study.) Out of 450 identified actual respondents, responses received were 380. Out of 380
questionnaires received, 63 were found incomplete, so 317 questionnaire responses were considered for the
analysis, which represents 70.44% response rate.
Tools of analysis
Exploratory and descriptive research design has been used to analyze the data. One-way ANOVA is
used to analyze the variance across the independent variable (regions-N-E-W-S) with Perception average score
as dependent variable and Factorial ANOVA is used to analyze the variance across the independent variable
sectors-Public, MNC’s & Private with second independent variable across regions-N-E-W-S with Perception
average score as dependent variable.
Harpreet Singh, International Journal of Research in Engineering, IT and Social Sciences, ISSN 2250-0588,
Impact Factor: 6.452, Volume 08 Issue 05, May 2018, Page 14-27
http://indusedu.org Page 17
This work is licensed under a Creative Commons Attribution 4.0 International License
One-way ANOVA: It tests if two or more groups differ from each other significantly in one or more
characteristics. A one-way ANOVA has one independent variable that splits the sample into two or more groups
A Factorial (2-way) ANOVA: It compares means across two or more independent variables. The factorial
ANOVA has two or more independent variables that split the sample in four or more groups. It is assumed that
the factorial ANOVA is an ‘analysis of dependencies. It is said so because it tests to prove an assumed cause-
effect relationship between the two or more independent variables and the dependent variables. In more
statistical terms it tests the effect of one or more independent variables on one dependent variable. It assumes
an effect of Y = f(x1, x2, x3, … xn).
The Significance value (alpha or α) When the significance value is less than 0.05 the null hypothesis is rejected and if it is more than 0.05
the null hypothesis is accepted. Significance level of 0.05 indicates the 5% risk of conducting when there is
actual no difference.
Development of Research Instrument Based on the above literature review and discussion with the experts in the area of Business to Business of
lubricant sector, many details were appended and edited. The final of 47 items were selected for survey and
these items were to be rated on a five point Likert scale with “strongly disagree” as 1 and “strongly agree” as 5
by the respondents. Initial scale comprised of 47 Items. One-way Anova & 2-Way Anova was used on this well-
structured questionnaire. Questionnaire made comprised of 47 statements related to the perception of B2B sales
force of the companies under study towards training programs run by the companies.
V. DATA ANALYSIS AND INTERPRETATION
The Primary data was collected from B2B sales force- FLM’s. It is based on mail surveys i.e. questionnaire
& mail interviews. The data collected so, from all the sources was scrutinized, edited and tabulated. The data
analysis was done using the statistical tools -SPSS 16.0V In SPSS Software Statistical tools: One-way Anova &
2-Way (factorial) Anova. Were used to analyze the response data .We designed the scale which had a
combination of 5-pointer likert scale & multiple choice questions for this research study in lubricants sector of
B2B sales force for training and development domain to address the research gaps in the lubricant sector across
major sectors & regions of India.
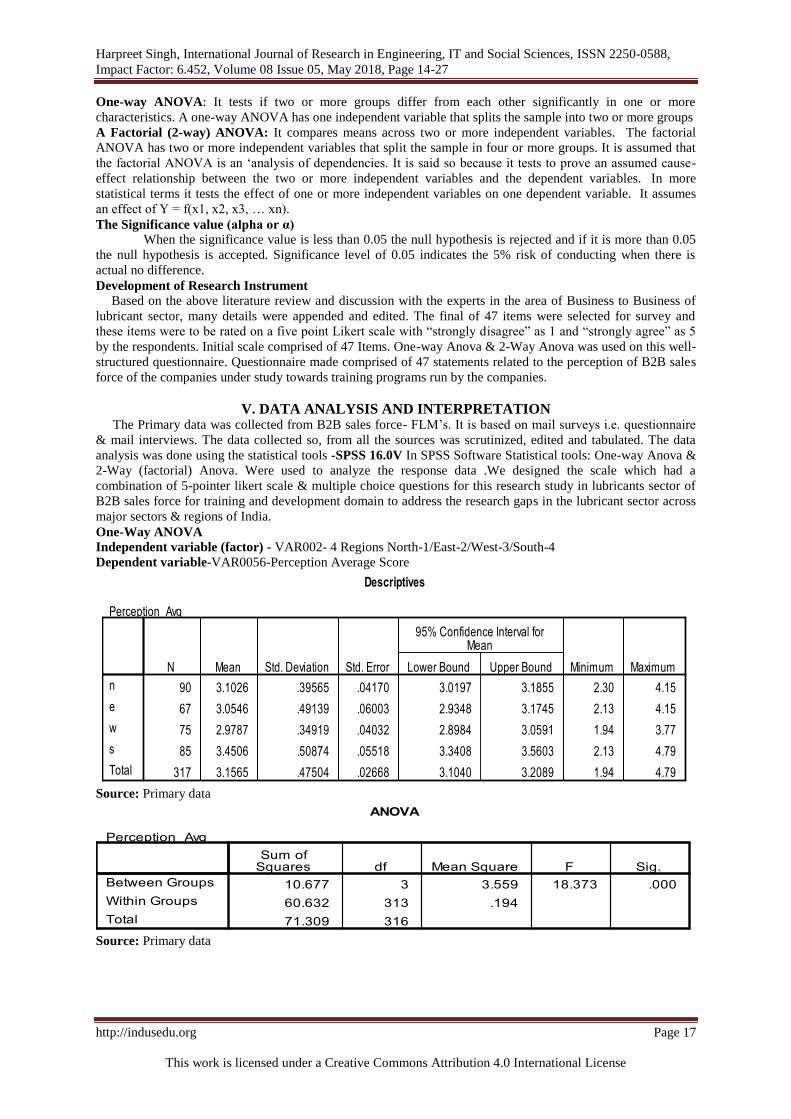
One-Way ANOVA
Independent variable (factor) - VAR002- 4 Regions North-1/East-2/West-3/South-4
Dependent variable-VAR0056-Perception Average Score
Source: Primary data
Source: Primary data
Harpreet Singh, International Journal of Research in Engineering, IT and Social Sciences, ISSN 2250-0588,
Impact Factor: 6.452, Volume 08 Issue 05, May 2018, Page 14-27
http://indusedu.org Page 18
This work is licensed under a Creative Commons Attribution 4.0 International License
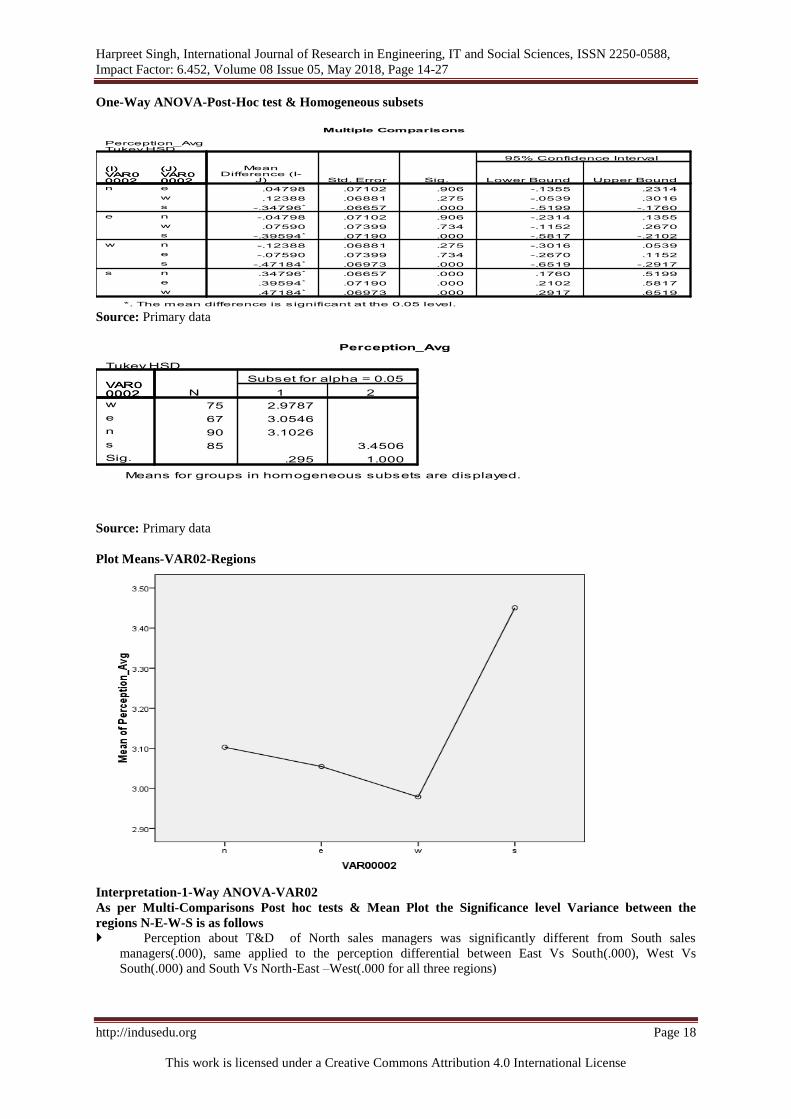
One-Way ANOVA-Post-Hoc test & Homogeneous subsets
Source: Primary data
Source: Primary data
Plot Means-VAR02-Regions
Interpretation-1-Way ANOVA-VAR02
As per Multi-Comparisons Post hoc tests & Mean Plot the Significance level Variance between the
regions N-E-W-S is as follows Perception about T&D of North sales managers was significantly different from South sales
managers(.000), same applied to the perception differential between East Vs South(.000), West Vs
South(.000) and South Vs North-East –West(.000 for all three regions)

Harpreet Singh, International Journal of Research in Engineering, IT and Social Sciences, ISSN 2250-0588,
Impact Factor: 6.452, Volume 08 Issue 05, May 2018, Page 14-27
http://indusedu.org Page 19
This work is licensed under a Creative Commons Attribution 4.0 International License
Conclusion was that North-East-West had somewhat common perception about T&D but South FLM’s
perception was significantly different from all other regions which was(.000) far lesser than (Alpha=.050)
& called for the statistically significant difference in the perception average score between different regions.
After primary survey, reason for the same we were able to summarize & attribute to the fact that most
of the companies under study had their head offices in N-E-W regions but very less had in south, so people
in south felt that travelling for T&D to long distances was shear wastage of time & money and contribute
lesser for their career development. Due to cultural differences also, south FLM’s had conservative
approach towards training & development.
One-Way ANOVA
Independent variable (factor)- VAR003-3 Sectors Public-1/MNC-2/Private-3
Dependent variable-VAR0056-Perception Average Score
Source: Primary data
Source: Primary data
One-Way ANOVA-Post-Hoc test & Homogeneous subsets
Source: Primary data
Source: Primary data
Harpreet Singh, International Journal of Research in Engineering, IT and Social Sciences, ISSN 2250-0588,
Impact Factor: 6.452, Volume 08 Issue 05, May 2018, Page 14-27
http://indusedu.org Page 20
This work is licensed under a Creative Commons Attribution 4.0 International License
Plot Means-VAR03-Sectors
Interpretation-1-Way ANOVA-VAR03
As per Multi-Comparisons Post hoc tests & Mean Plot-the Significance level Variance between the
Public-MNC-Private sector Lubes companies FLM’s is as follows Perception about T&D of Public sector sales managers was significantly different from both MNC &
Private sector company sales managers(.000 for each), same applied to the perception differential between
MNC Vs Public.000) & Private Vs Public(.000)
Conclusion was that Private & MNC FLM’s had somewhat common perception about T&D but Public
sector FLM’s perception was significantly different from both MNC & Private sector FLM’s(.000) which
was far less than (Alpha=.050) & called for the statistically significant difference in the perception average
score between different sector lube companies .
As per the primary survey done, we found out that public sector company’s sales managers were of the
strong opinion that T&D could help them in their job related techno-commercial tasks and were important
for organizational development but does not enhance their skill sets & contribute to their career
development. Public sector FLM’s got us the view that as per the set protocol of some years, they would get
automatic scale revisions & promotions etc. and T&D was not vital from career perspective as compared to
the private & multinational sales managers which were strong contender for training and development for
their career progressions.
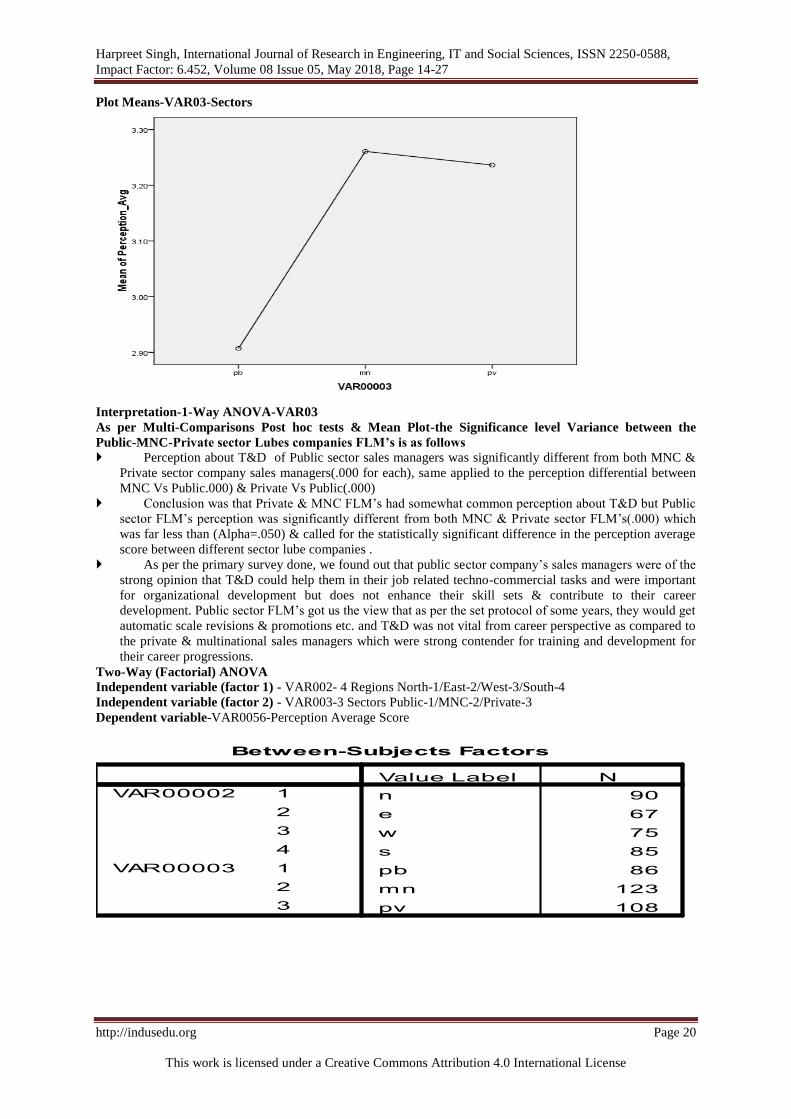
Two-Way (Factorial) ANOVA
Independent variable (factor 1) - VAR002- 4 Regions North-1/East-2/West-3/South-4
Independent variable (factor 2) - VAR003-3 Sectors Public-1/MNC-2/Private-3
Dependent variable-VAR0056-Perception Average Score
Harpreet Singh, International Journal of Research in Engineering, IT and Social Sciences, ISSN 2250-0588,
Impact Factor: 6.452, Volume 08 Issue 05, May 2018, Page 14-27
http://indusedu.org Page 21
This work is licensed under a Creative Commons Attribution 4.0 International License
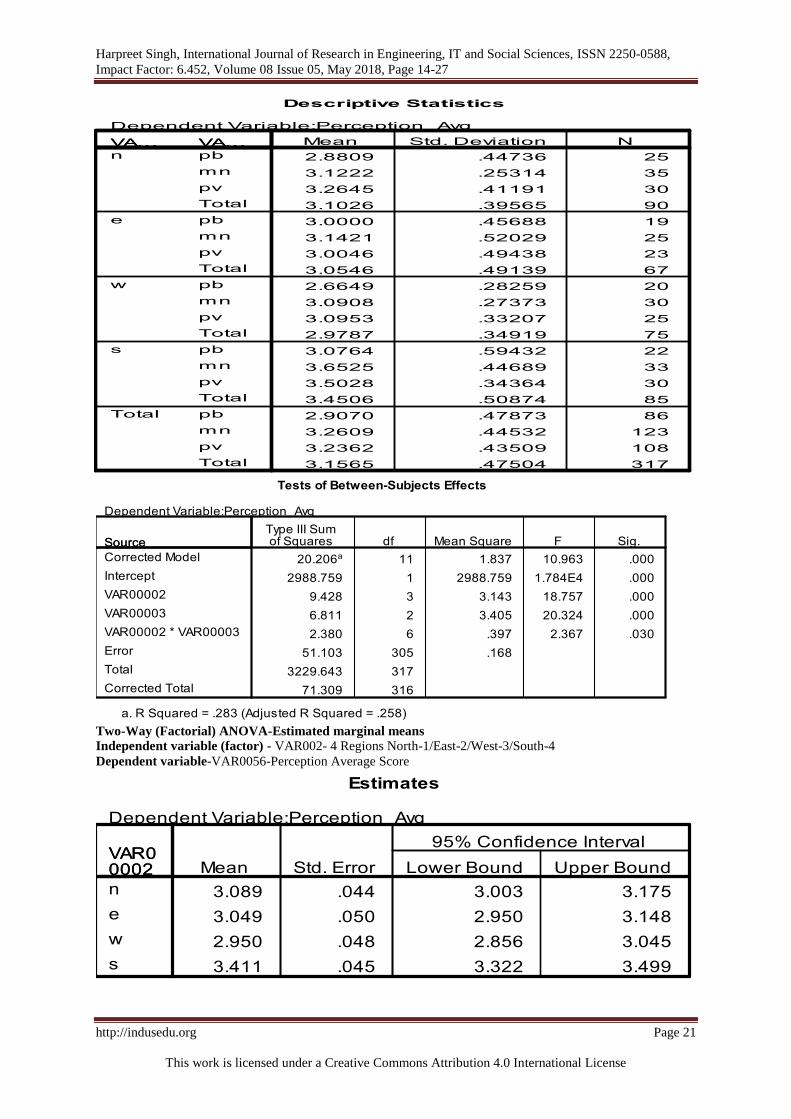
Two-Way (Factorial) ANOVA-Estimated marginal means
Independent variable (factor) - VAR002- 4 Regions North-1/East-2/West-3/South-4
Dependent variable-VAR0056-Perception Average Score

Harpreet Singh, International Journal of Research in Engineering, IT and Social Sciences, ISSN 2250-0588,
Impact Factor: 6.452, Volume 08 Issue 05, May 2018, Page 14-27
http://indusedu.org Page 22
This work is licensed under a Creative Commons Attribution 4.0 International License
Interpretation-2-Way ANOVA-VAR02
As per Pairwise-Comparisons tests in 2way Anova, the Significance level Variance B/w the region N-E-W-
S is as follows Perception about T&D of North sales managers was significantly different from South sales managers
(.000) and extent of difference of opinion b/w N vs W was not so significant (.033) as the N-S have but N-E
(.546) have common say about T&D, same applied to the perception differential between East Vs South
(.000), lesser b/w E-W (.157) and common thoughts b/w E-N (.546) as stated above too. West Vs South
(.000) high difference of opinions, lesser b/w W-N (.033) & W-E (.157) share some commonality and
finally South Vs North-East –West (.000 for all three regions) which established the fact of difference in
perception across regions about T&D.
Conclusion was that North-East-West share common perception about T&D but South FLM’s
perception was significantly different from all other regions which was(.000) far less than (Alpha=.050) &
called for the statistically significant difference in the perception average score between different regions.
Summarization from primary survey of all the sales managers concluded the fact that south managers
were opinionated of the lesser importance to training & development and felt that T&D was not vital for
their job satisfaction, performance, productivity & career development compared to other regional sales
managers due to cultural differences etc.
Two-Way (Factorial) ANOVA-Estimated marginal means
Independent variable (factor) - VAR003-3 Sectors Public-1/MNC-2/Private-3
Dependent variable-VAR0056-Perception Average Score

Harpreet Singh, International Journal of Research in Engineering, IT and Social Sciences, ISSN 2250-0588,
Impact Factor: 6.452, Volume 08 Issue 05, May 2018, Page 14-27
http://indusedu.org Page 23
This work is licensed under a Creative Commons Attribution 4.0 International License
Interpretation-2-Way ANOVA-VAR03
As per Pairwise-Comparisons, the Significance level Variance b/w the Public-MNC-Private sector Lubes
companies FLM’s about T&D is as follows
Perception about T&D of Public sector sales managers is significantly different from both MNC &
Private sector company sales managers(.000 for each).Analyzing the perception differential between MNC
Vs Public(.000) huge difference of perception but MNC-Private(.520) share common thoughts & finally
Private Vs Public(.000) significantly different perception but again states the common opinion for Private-
MNC FLM’s(.520)
Conclusion is that Private & MNC FLM’s have somewhat common perception(.520) about T&D but
Public sector FLM’s perception is significantly different from both MNC & Private sector FLM’s(.000)
Harpreet Singh, International Journal of Research in Engineering, IT and Social Sciences, ISSN 2250-0588,
Impact Factor: 6.452, Volume 08 Issue 05, May 2018, Page 14-27
http://indusedu.org Page 24
This work is licensed under a Creative Commons Attribution 4.0 International License
which is far less than (Alpha=.050) & calls for the statistically significant difference in the perception
average score between FLM’s of different sector lube companies.
Primary survey established the fact that public sector FLM’s felt that T&D could help them in their job
related work & were important from organizational development perspective and not career perspective &
progressions and were having more or less neutral or negative connotations about T&D usefulness
compared to private and multinational company sales managers.
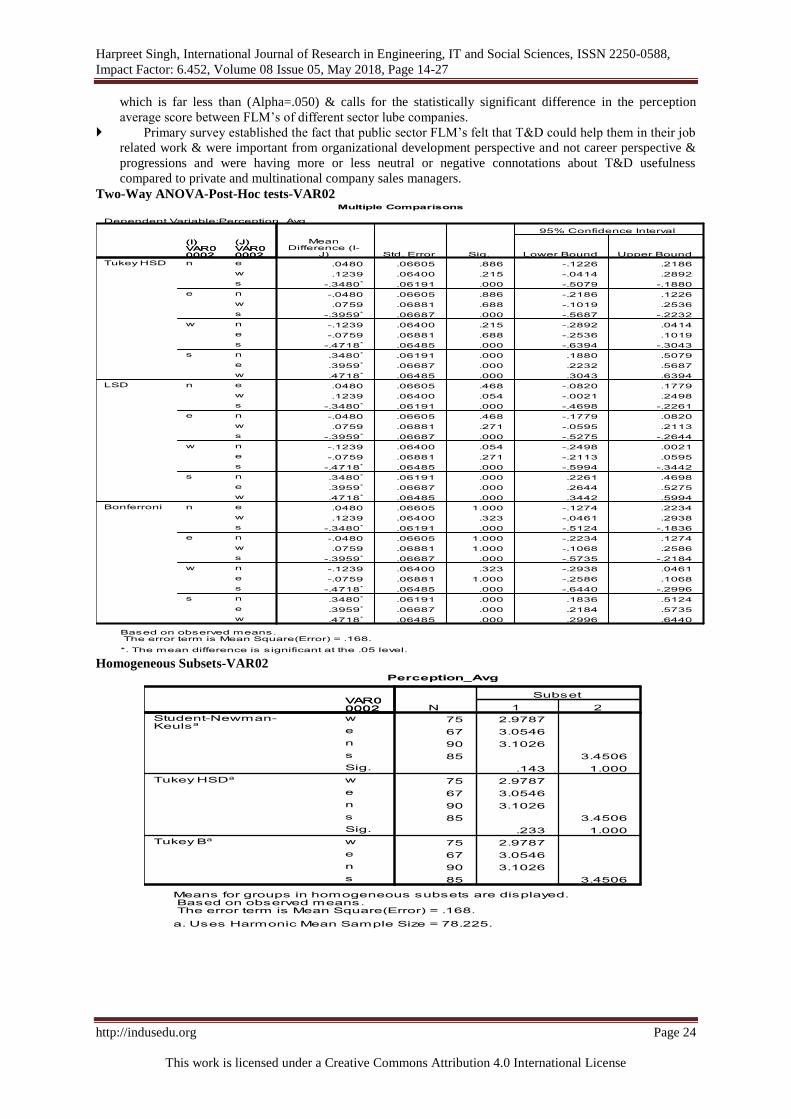
Two-Way ANOVA-Post-Hoc tests-VAR02
Homogeneous Subsets-VAR02

Harpreet Singh, International Journal of Research in Engineering, IT and Social Sciences, ISSN 2250-0588,
Impact Factor: 6.452, Volume 08 Issue 05, May 2018, Page 14-27
http://indusedu.org Page 25
This work is licensed under a Creative Commons Attribution 4.0 International License
Two-Way ANOVA-Post-Hoc tests-VAR03
Homogeneous Subsets-VAR03
Two-Way (Factorial) ANOVA-Comparison of both the variables
Independent variable (factor 1) - VAR002- 4 Regions North-1/East-2/West-3/South-4
Independent variable (factor 2) - VAR003-3 Sectors Public-1/MNC-2/Private-3
Dependent variable-VAR0056-Perception Average Score
Harpreet Singh, International Journal of Research in Engineering, IT and Social Sciences, ISSN 2250-0588,
Impact Factor: 6.452, Volume 08 Issue 05, May 2018, Page 14-27
http://indusedu.org Page 26
This work is licensed under a Creative Commons Attribution 4.0 International License
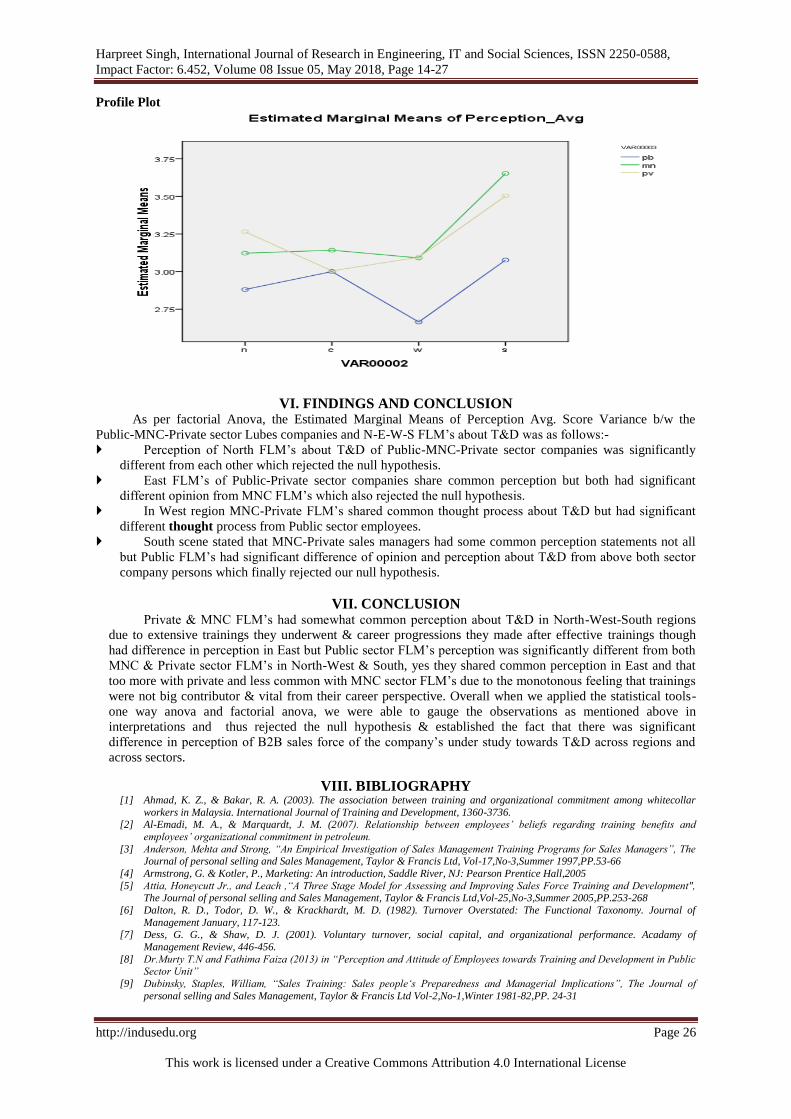
Profile Plot
VI. FINDINGS AND CONCLUSION As per factorial Anova, the Estimated Marginal Means of Perception Avg. Score Variance b/w the
Public-MNC-Private sector Lubes companies and N-E-W-S FLM’s about T&D was as follows:-
Perception of North FLM’s about T&D of Public-MNC-Private sector companies was significantly
different from each other which rejected the null hypothesis.
East FLM’s of Public-Private sector companies share common perception but both had significant
different opinion from MNC FLM’s which also rejected the null hypothesis.
In West region MNC-Private FLM’s shared common thought process about T&D but had significant
different thought process from Public sector employees.
South scene stated that MNC-Private sales managers had some common perception statements not all
but Public FLM’s had significant difference of opinion and perception about T&D from above both sector
company persons which finally rejected our null hypothesis.
VII. CONCLUSION Private & MNC FLM’s had somewhat common perception about T&D in North-West-South regions
due to extensive trainings they underwent & career progressions they made after effective trainings though
had difference in perception in East but Public sector FLM’s perception was significantly different from both
MNC & Private sector FLM’s in North-West & South, yes they shared common perception in East and that
too more with private and less common with MNC sector FLM’s due to the monotonous feeling that trainings
were not big contributor & vital from their career perspective. Overall when we applied the statistical tools-
one way anova and factorial anova, we were able to gauge the observations as mentioned above in
interpretations and thus rejected the null hypothesis & established the fact that there was significant
difference in perception of B2B sales force of the company’s under study towards T&D across regions and
across sectors.
VIII. BIBLIOGRAPHY [1] Ahmad, K. Z., & Bakar, R. A. (2003). The association between training and organizational commitment among whitecollar
workers in Malaysia. International Journal of Training and Development, 1360-3736. [2] Al-Emadi, M. A., & Marquardt, J. M. (2007). Relationship between employees’ beliefs regarding training benefits and
employees’ organizational commitment in petroleum.
[3] Anderson, Mehta and Strong, “An Empirical Investigation of Sales Management Training Programs for Sales Managers”, The Journal of personal selling and Sales Management, Taylor & Francis Ltd, Vol-17,No-3,Summer 1997,PP.53-66
[4] Armstrong, G. & Kotler, P., Marketing: An introduction, Saddle River, NJ: Pearson Prentice Hall,2005
[5] Attia, Honeycutt Jr., and Leach ,“A Three Stage Model for Assessing and Improving Sales Force Training and Development", The Journal of personal selling and Sales Management, Taylor & Francis Ltd,Vol-25,No-3,Summer 2005,PP.253-268
[6] Dalton, R. D., Todor, D. W., & Krackhardt, M. D. (1982). Turnover Overstated: The Functional Taxonomy. Journal of
Management January, 117-123. [7] Dess, G. G., & Shaw, D. J. (2001). Voluntary turnover, social capital, and organizational performance. Acadamy of
Management Review, 446-456.
[8] Dr.Murty T.N and Fathima Faiza (2013) in “Perception and Attitude of Employees towards Training and Development in Public Sector Unit”
[9] Dubinsky, Staples, William, “Sales Training: Sales people‘s Preparedness and Managerial Implications”, The Journal of
personal selling and Sales Management, Taylor & Francis Ltd Vol-2,No-1,Winter 1981-82,PP. 24-31
Harpreet Singh, International Journal of Research in Engineering, IT and Social Sciences, ISSN 2250-0588,
Impact Factor: 6.452, Volume 08 Issue 05, May 2018, Page 14-27
http://indusedu.org Page 27
This work is licensed under a Creative Commons Attribution 4.0 International License
[10] Honeycutt..Jr, Ford and Rao ,“Sales training: Executive Research Needs” ,The Journal of personal selling and Sales
Management, Taylor & Francis Ltd, Vol-15,No-4,Fall 1995, PP.67-71 [11] http://www.gallup.com/poll/11149/talent-vs-training-preparing-tomorrows-teachers.aspx
[12] Joshi Parikshit & Srivastava Anuj (2012) in “Examining the HRD Practices in India PSU’S” (With Special Reference To IOC
Mathura Refinery) [13] Karsh, B., Booske, B. C., & Sainfort, F. (2005). Job and organizational determinants of nursing home employee commitment, job
satisfaction and intent to turnover. Ergonomics,, 1260-1281.
[14] Kaur and Bhalla, “Satisfaction of students towards Quality in Higher Education-A study of Higher education sector Punjab(India)”,Pacific Business Review International ,Volume-8,Issue-6, December 2015
[15] Kothari CR, Research Methodology Methods and Techniques, 2006, Page 37
[16] Kotler, P., & Keller,K., Marketing Management , New Jersey: Pearson Prentice Hall,12th ed.,2006 [17] Kotler, P., Keller, K. L., Cunningham, P. H. & Sivaramakrishnan,S., Marketing management, Pearson Canada Inc.,2009
[18] Krishna K Havaldar & Vasant M Cavale, Sales & Distribution Management book, n Training the sales force
[19] Malhotra Naresh K, Research Methodology: Conjoint Analysis, Multidimensional Scaling, and Related Techniques,2011 [20] Mathis, (1990), “Human Resource Management”, Tata Mc Graw Hills, New Delhi 1990.
[21] Michael J. Tews, John W. Michel, Jill E. Ellingson (2013). The Impact of Coworker Support on Employee Turnover in the
Hospitality Industry. Journal of Group & Organization Management, 38(5), pp. 630-653
[22] Newman, A., Thanacoody, R., & Hui, W. (2011). The impact of employee perceptions of training on organisational commitment
and turnover intentions: a study of multinationals in the Chinese service sector. International Journal of Human Resource
Management, 1765-1787. [23] S Jency (2016) in “A study on employee perception towards training and development at Indian rare earth limited (IREL)”
[24] Schuler, R. S., & MacMillan, I. C. (1984). Gaining competitive advantage through human resource management practices.
Human Resource Management 23 (3), 241-255. [25] Shepherd and Ridnour , “The Training of Sales Managers: An Exploratory Study of Sales Management Training Practices”, The
Journal of personal selling and Sales Management, Taylor & Francis Ltd,Vol-15,No-1,Winter 1995,PP.69-74
[26] Singh Harpreet & Singla Lalit, “Training and Development Programs across Lubricant Industry in India: A Study of B2B Front Line Managers” in International Journal of Advanced Scientific Research and Management, Vol 2, Issue 3,March 2017
[27] Thang, N. N. (2009). Human resource training, organisational strategy and firm performance in emerging economies: the case of Vietnam. Submitted to the Faculty of Economics and Business Administration, Ghent University, in Fulfillment of the
Requirements for the Degree of Doctor in Applied Economics, chapter 2.
[28] Tomas Jungert (2012). The Meaning of Support from Co-workers and Managers in Teams when Working, Retrieved from http://www.ibl.liu.se/fog/fograpporter/1.331304/fograppnr72.pdf
[29] Wahab, et al(2014) in “Employees’ Perception and Motivation Towards Training and Development Programmes in Health
Sector of Pakistan: A Case Study of Khyber Pakhtun Khwa” [30] Wang, Y. (2005). Strategic employee training and development in Chinese luxury hotels. MPRA Paper No. 25405
[31] Zoltners, Sinha and Lorimer ,“Sales Force Effectiveness: A Framework for Researchers and Practitioners ”,The Journal of
personal selling and Sales Management, Taylor & Francis Ltd, Vol-28,No-2,Spring 2008 PP.115-131
Top Related