


Languages
Pages
Legal


Pennsylvania Stormwater
Best Management Practices Manual
Appendix A – Water Quality
Pollutant Event Mean Concentrations by Land Cover &
BMP Pollutant Removal Efficiencies
363-0300-002 / December 30, 2006

Pennsylvania Stormwater Best Management Practices Manual Appendix A
Pollutant Event Mean Concentrations by Land Cover
363-0300-002 / December 30, 2006

Pennsylvania Stormwater Best Management Practices Manual Appendix A
TABLE A-1. EVENT MEAN CONCENTRATIONS (EMCs) FOR TOTAL SUSPENDED SOLIDS
LAND COVER CLASSIFICATION TSS EMC (mg/l) SOURCES COMMENTS
Forest 39 B, G, M ---
Meadow 47 B, N ---
Fertilized Planting Area 55 Q, R R: "Residential" area had considerable mulched areas
Native Planting Area 55 Q, R R: "Residential" area had considerable mulched areas
Lawn, Low-Input 180 C, O, Q, R Median of four values
Lawn, High-Input 180 C, O, Q, R Median of four values
Golf Course Fairway/Green 305 M, R Average of two values
Grassed Athletic Field 200 M, N Average of two values
Rooftop 21 Q, S, V Average of Residential, Commercial, and Industrial Roofs
High Traffic Street / Highway 261 E, F, H, P, Q Median of five values
Medium Traffic Street 113 A, B, H, I, J, P, Q Median of seven values
Low Traffic / Residential Street 86 E, P, Q Average of three values
Res. Driveway, Play Courts, etc. 60 M "Urban Recreation"
High Traffic Parking Lot 120 J, N, Q Median of three values
Low Traffic Parking Lot 58 I, M, N, Q Median of 4 values w/ "comm.", "indust.", "parking" & "comm/res."
Perv
ious
Sur
face
sIm
perv
ious
Sur
face
s
363-0300-002 / December 30, 2006 Page 1of 36

Pennsylvania Stormwater Best Management Practices Manual Appendix A
TABLE A-2. EVENT MEAN CONCENTRATIONS (EMCs) FOR TOTAL PHOSPHORUS
LAND COVER CLASSIFICATION TP EMC (mg/l) SOURCES COMMENTS
Forest 0.15 B, I, J, M, R, X ---
Meadow 0.19 F, W Value from F, W reported no soluble phosphorus from meadow
Fertilized Planting Area 1.34 F Study indicated highly maintained landscapes in "High Density Resid."
Native Planting Area 0.40 F, W W had no soluble P from mulch, assumed equivalent to low-input lawn
Lawn, Low-Input 0.40 F Value for "Low Density Residential"
Lawn, High-Input 2.22 K, L, S, V Median of four values
Golf Course Fairway/Green 1.07 R ---
Grassed Athletic Field 1.07 R No data found, assumed eqivalent to golf course
Rooftop 0.13 L, S, V Median of three values
High Traffic Street / Highway 0.40 L, P, S Median of 3 values including "Arterial St." and "Urban St."
Medium Traffic Street 0.33 I, L, M, X Median of 4 values including "Transportation"
Low Traffic / Residential Street 0.36 L, P, S, V Median of 4 values including "Feeder St." and "Rural Rd."
Res. Driveway, Play Courts, etc. 0.46 L, M, S, V Median of 4 values including "Urban Recreation"
High Traffic Parking Lot 0.39 S ---
Low Traffic Parking Lot 0.15 N, S, V Median of three values
Perv
ious
Sur
face
sIm
perv
ious
Sur
face
s
363-0300-002 / December 30, 2006 Page 2of 36

Pennsylvania Stormwater Best Management Practices Manual Appendix A
TABLE A-3. EVENT MEAN CONCENTRATIONS (EMCs) FOR NITRATE
LAND COVER CLASSIFICATION Nitrate-Nitrite EMC (mg/l as N) SOURCES COMMENTS
Forest 0.17 J ---
Meadow 0.3 B EMC for TN adjusted
Fertilized Planting Area 0.73 F, R Studies indicated mulched areas & highly maintained landscapes
Native Planting Area 0.33 T Assumed equivalent to turfgrass w/o chemical treatment
Lawn, Low-Input 0.44 T, U, W Based on studies of lawn runoff and leachate
Lawn, High-Input 1.46 C, T, U Median of 3 studies in T and NURP data in C - consistent with U
Golf Course Fairway/Green 1.84 M, R, U Average of 3 values including one study of leachate
Grassed Athletic Field 1.01 M ---
Rooftop 0.32 L, U ---
High Traffic Street / Highway 0.83 D, F, I, L, P Median of five values
Medium Traffic Street 0.58 D, I, L, P Median of four values
Low Traffic / Residential Street 0.47 V EMC for TN adjusted
Res. Driveway, Play Courts, etc. 0.47 V Assumed equivalent to residential street
High Traffic Parking Lot 0.60 F Value reported for "Retail"
Low Traffic Parking Lot 0.39 C, F, L Median of 3 values after EMC for TN adjusted
Perv
ious
Sur
face
sIm
perv
ious
Sur
face
s
363-0300-002 / December 30, 2006 Page 3of 36

Pennsylvan
363-0300-0
ia Stormwater Best Management Practices Manual Appendix A
02 / December 30, 2006
REFERENCES
REFERENCES FOR TABLES A-1, A-2, AND A-3
A. Weiss, W. and Guerard, P. 1995. “Water Quality of Storm Runoff and Comparison of Procedures for Estimating Storm-Runoff Loads, Volume, Event-Mean Concentrations, and the Mean Load for a Storm for Selected Properties and Constituents for Colorado Springs, Southeastern Colorado, 1992,” Water-Resources Investigations Report 94-4194, U.S. Geological Survey.
B. CH2MHILL, 2002. Watershed Modeling Technical Memorandum No. 8, prepared for Wake County,
NC. Available at http://projects.ch2m.com/WakeCounty/Docs/TM8_model%20assumptions.pdf. C. U.S. Environmental Protection Agency, 1999. “Preliminary Data Summary of Urban Storm Water
Best Management Practices,” EPA-821-R-99-012, Office of Water, Washington, DC. D. Thomas, A., Tellam, J., and Greswell, R. “Development of a GIS Based Urban Groundwater
Recharge Pollutant Flux Model,” School of Earth Sciences, University of Birmingham, UK. E. Federal Highway Administration. “Stormwater Best Management Practices in an Ultra-Urban
Setting: Selection and Monitoring.” Available at http://www.fhwa.dot.gov/environment/ultraurb/. F. McConnell, R., Araj, E., and Jones, D., 1999. “Developing Nonpoint Source Water Quality Levels of
Service for Hillsborough County, Florida,” presented at the Sixth Biennial Stormwater Research & Watershed Management Conference.
G. “Wake County Watershed Management Plan,” July 25, 2001, presented by Wake County,
CH2MHILL, and the Center for Watershed Protection. H. U.S. Environmental Protection Agency, 2001. “PLOAD Version 3.0 User’s Manual: An ArcView GIS
Tool to Calculate Nonpoint Sources of Pollution in Watershed and Stormwater Projects.” I. Baird, C., Dybala, T., Jennings, M., and Ockerman, D., 1996. “Characterization of Nonpoint Sources
and Loadings to Corpus Christi Bay National Estuary Program Study Area,” Corpus Christi Bay National Estuary Program, CCBNEP-05.
J. “The Simple Method to Calculate Urban Stormwater Loads” available from the Center of Watershed
Protections’ Stormwater Manager’s Resource Center at: http://www.stormwatercenter.net/monitoring%20and%20assessment/simple%20meth/simple.htm.
K. Green Valleys Association (GVA), 1999. Sustainable Watershed Management for Northern Chester
County Watersheds: A Model Program to Balance Water Resources and Land Development in the Schuylkill River Tributary Watersheds: French Creek, Pickering Creek, Pigeon Creek, Stony Run, and Direct Schuylkill Drainage. Technical Assistance From: Cahill Associates, Inc. and Brandywine Conservancy.
L. Ed. Schueler, T.R. and H.K. Holland, 2000. “Storm Pollution Source Areas Isolated in Marquette,
Michigan (Technical Note #105),” article in the edited anthology The Practice of Watershed Protection, Center of Watershed Protection, Ellicott City, MD.
Page 4of 36

Pennsylvania Stormwater Best Management Practices Manual Appendix A
M. Philadelphia Water Department, Office of Watersheds, 2000. Technical Memorandum No. 3: A Screening Level Contaminant Loading Assessment for the Darby and Cobbs Creek Watershed (DRAFT).
N. Larm, T., 2000. Watershed-based design of stormwater treatment facilities: model development
and applications, Doctoral Thesis. Division of Water Resources Engineering, Department of Civil and Environmental Engineering, Royal Institute of Technology, Stockholm, Sweden.
O. United States Environmental Protection Agency (USEPA), 1993. Guidance Specifying
Management Measures for Sources of Nonpoint Pollution in Coastal Waters (EPA 840-B-92-002).
P. United States Environmental Protection Agency (USEPA), 1983. Results of the Nationwide Urban
Runoff Program, Volume I: Final Report, Water Planning Division, Washington, D.C. December 1983. & Federal Highway Administration (FHWA),1990. Pollutant Loadings and Impacts from Highway Stormwater Runoff Volume III: Analytical Investigation and Research Report, FHWA-RD-88-008, Office of Engineering and Highways Operations R&D, McLean, VA.
Q. Center for Watershed Protection, 1996. Design of Stormwater Filtering Systems. Prepared for the
Chesapeake Research Consortium. R. Jennings, G., D. Line, B. Hunt, D. Osmond, Nancy White. Neuse River Basin Pollution Sources and
Best Management Practices. S. Bannerman, R.T., R. Dodds, D. Owens, and P. Hughes, 1992. Sources of Pollutants in Wisconsin
Stormwater. Wisconsin Department of Natural Resources and U.S. Geological Survey. Prepared for USEPA.
T. Ed. Schueler, T.R. and H.K. Holland, 2000. “Nitrate Leaching Potential from Lawns and Turfgrass
(Technical Note #56),” article in the edited anthology The Practice of Watershed Protection, Center of Watershed Protection, Ellicott City, MD.
U. Ed. Schueler, T.R. and H.K. Holland, 2000. “Nutrient Movement from the Lawn to the Stream
(Technical Note #4),” article in the edited anthology The Practice of Watershed Protection, Center of Watershed Protection, Ellicott City, MD.
V. Center for Watershed Protection, 2003. New York State Stormwater Management Design Manual.
Prepared for New York State Department of Environmental Conservation. W. Ed. Schueler, T.R. and H.K. Holland, 2000. “The Peculiarities of Perviousness (Technical Note
#129),” article in the edited anthology The Practice of Watershed Protection, Center of Watershed Protection, Ellicott City, MD.
X. Kieser & Associates, 2001. Non-point Source Modeling of Phosphorous Loads in the Kalamazoo
River/Lake Allegan Watershed for a Total Maximum Daily Load. Prepared for The Kalamazoo Conservation District, Kalamazoo, MI.
363-0300-002 / December 30, 2006 Page 5of 36

Pennsylvania Stormwater Best Management Practices Manual Appendix A
ADDITIONAL REFERENCES
Choe, J.S., K.W. Bang, and J.H. Lee, 2002. “Characterization of surface runoff in urban areas,” Water Science & Technology, 45(9): 249-254.
Clinton, B.D. and Vose, J.M., 2003. Differences in Surface Water Quality Draining Four Road Surface
Types in the Southern Appalachians, Southern Journal of Applied Forestry, 27(2). County of Los Angeles, Department of Public Works, 2000. Los Angeles County 1999-2000
Stormwater Monitoring Report. James, R.B., 1999. Solids in Storm Water Runoff. Water Resources Management. National Atmospheric Deposition Program/National Trends Network, 2001. 2000 Annual & Seasonal
Data Summary for Site NC41. Ed. Schueler, T.R. and H.K. Holland, 2000. “Is Rooftop Runoff Really Clean (Technical Note #8),”
article in the edited anthology The Practice of Watershed Protection, Center of Watershed Protection, Ellicott City, MD.
363-0300-002 / December 30, 2006 Page 6of 36

Pennsylvania Stormwater Best Management Practices Manual Appendix A
BMP Pollutant Removal Efficiencies- Percent Efficiency
363-0300-002 / December 30, 2006 Page 7of 36

Pennsylvania Stormwater Best Management Practices Manual Appendix A
Table A-4. Summary of pollutant removal efficiencies of stormwater BMPs.
TSS TP NO3
5.4.1 Protect Sensitive / Special Value Features SC SC SC5.4.2 Protect / Conserve / Enhance Riparian Areas SC SC SC
5.4.3 Protect / Utilize Natural Flow Pathways in Overall Stormwater Planning and Design 30 20 0
5.5.1 Cluster Uses at Each Site; Build on the Smallest Area Possible SC SC SC
5.5.2 Concentrate Uses Areawide through Smart Growth Practices SC SC SC
5.6.1 Minimize Total Disturbed Area - Grading 40 0 05.6.2 Minimize Soil Compaction in Disturbed Areas 30 0 0
5.6.3 Re-vegetate and Re-forest Disturbed Areas using Native Species 85 85 50
5.7.1 Reduce Street Imperviousness SC SC SC5.7.2 Reduce Parking ImperviousnesS SC SC SC5.8.1 Rooftop Disconnection 30 0 05.8.2 Disconnection from Storm Sewers 30 0 05.9.1 Streetsweeping 85 85 50
6.4.1 Porous Pavement with Infiltration Bed 85 85 306.4.2 Infiltration Basin 85 85 306.4.3 Subsurface Infiltration Bed 85 85 306.4.4 Infiltration Trench 85 85 306.4.5 Rain Garden / Bioretention 85 85 306.4.6 Dry Well / Seepage Pit 85 85 306.4.7 Constructed Filter 85 85 306.4.8 Vegetated Swale 50 50 206.4.9 Vegetated Filter Strip 30 20 106.4.10 Infiltration Berm and Retentive Grading 60 50 406.5.1 Vegetated Roof 85 85 306.5.2 Rooftop Runoff - Capture and Reuse 100 100 1006.6.1 Constructed Wetland 85 85 306.6.2 Wet Pond / Retention Basin 70 60 306.6.3 Dry Extended Detention Basin 60 40 206.6.4 Water Quality Filter 60 50 206.7.1 Riparian Buffer Restoration 65 50 506.7.2 Landscape Restoration 85 85 506.7.3 Soils Amendment and Restoration 85 85 50
Structural BMP
SC, Self Crediting: The BMP reduces the pollutant load, thus is self-crediting. BMPs with this designation are labeled as " Preventive" in Section 5.
** All values shown represent professional interpretation, based upon best available data as provided in Appendix A.**
COMPREHENSIVE BMP LISTPollutant Removal Efficiency %
Non-Structural BMP
363-0300-002 / December 30, 2006 Page 8of 36

Pennsylvania Stormwater Best Management Practices Manual Appendix A
Type TSS TN NO3 NOx TKN TP Primary Source Secondary Source Comments
Biweekly Sweeping 40-60 20-40
Kurahashi & Associates, Inc. 1997. Port of Seattle - Stormwater Treatment BMP Evaluation. Prepared for the Port of Seattle, Pier 66. Prepared by Kurahashi & Associates, in association with AGI Technologies.
Federal Highway Administration (FHWA). “Stormwater Best Management Practices in an Ultra-Urban Setting: Selection and Monitoring – Monitoring Case Study-Streetsweeping BMP Evaluation, Port of Seattle, Washington.” U.S. Department of Transportation.
Land Use = cargo container yards
Weekly Sweeping 45-65 30-55
Kurahashi & Associates, Inc. 1997. Port of Seattle - Stormwater Treatment BMP Evaluation. Prepared for the Port of Seattle, Pier 66. Prepared by Kurahashi & Associates, in association with AGI Technologies.
Federal Highway Administration (FHWA). “Stormwater Best Management Practices in an Ultra-Urban Setting: Selection and Monitoring – Monitoring Case Study-Streetsweeping BMP Evaluation, Port of Seattle, Washington.” U.S. Department of Transportation.
Land Use = cargo container yards
Twice Weekly Sweeping
45-70 35-60
Kurahashi & Associates, Inc. 1997. Port of Seattle - Stormwater Treatment BMP Evaluation. Prepared for the Port of Seattle, Pier 66. Prepared by Kurahashi & Associates, in association with AGI Technologies.
Federal Highway Administration (FHWA). “Stormwater Best Management Practices in an Ultra-Urban Setting: Selection and Monitoring – Monitoring Case Study-Streetsweeping BMP Evaluation, Port of Seattle, Washington.” U.S. Department of Transportation.
Land Use = cargo container yards
Vacuum-assisted sweeper efficiency
42 77 74
NVPDC. 1992. Northern Virginia BMP Handbook: A Guide to Planning and Designing Best Management Practices in Northern Virginia. Prepared by Northern Virginia Planning District Commission (NVPDC) and Engineers and Surveyors Institute.
Federal Highway Administration (FHWA). “Stormwater Best Management Practices in an Ultra-Urban Setting: Selection and Monitoring: Fact Sheet -Street Sweepers.” U.S. Department of Transportation.
Mechanical Sweeper 55 42 40
NVPDC. 1992. Northern Virginia BMP Handbook: A Guide to Planning and Designing Best Management Practices in Northern Virginia. Prepared by Northern Virginia Planning District Commission (NVPDC) and Engineers and Surveyors Institute.
Federal Highway Administration (FHWA). “Stormwater Best Management Practices in an Ultra-Urban Setting: Selection and Monitoring: Fact Sheet -Street Sweepers.” U.S. Department of Transportation.
RANGE 40 - 70 42 - 77 20 - 74
5.9.1 STREETSWEEPING
Pollutant Removal % Efficiency
363-0300-002 / December 30, 2006 Page 9of 36

Pennsylvania Stormwater Best Management Practices Manual Appendix A
Type TSS TN NO3 NOx TKN TP Primary Source Secondary Source Comments
Porous Pavement 80 80
Johnston Smith Consulting Limited. Sustainable Urban Drainage Systems - SUDS.
Porous Pavement 95 88
Metropolitan Washington Council of Governments (MWCOG). 1983. Urban Runoff in the Washington Metropolitan Area: Final Report, Urban Runoff Project, EPA Nationwide Urban Runoff Program. Metropolitan Washington Council of Governments, Washington, DC.
Porous Pavement 82 80 65
Schueler, T.R. 1987. Controlling Urban Runoff: A Practical Manual for Planning and Designing Urban BMPs. Metropolitan Washington Council of Governments. Department of Environmental Programs.
Winer, R. 2000. National Pollutant Removal Performance Database for Stormwater Treatment Practices, 2nd Edition. Center for Watershed Protection. Ellicott City, MD.
# of storms = 13; STP Size = 0.553acres; Percent efficiency calculated using mass efficiency method.
Porous Pavement 95 85 65
Schueler, T.R. 1987. Controlling Urban Runoff: A Practical Manual for Planning and Designing Urban BMPs. Metropolitan Washington Council of Governments. Department of Environmental Programs.
Winer, R. 2000. National Pollutant Removal Performance Database for Stormwater Treatment Practices, 2nd Edition. Center for Watershed Protection. Ellicott City, MD.
Percent efficiency calculated using mass efficiency method.
Porous Pavement 97 94
St. John, M. 1997. Effect of Road Shoulder Treatments on Highway Runoff Quality and Quantity. University of Washington.
Winer, R. 2000. National Pollutant Removal Performance Database for Stormwater Treatment Practices, 2nd Edition. Center for Watershed Protection. Ellicott City, MD.
"Asphalt void volume 22%"; # of storms = 9
Porous Pavement 95 82
Stormwater Manager's Resource Center (SMRC). Stormwater Management Fact Sheet: Porous Pavement.
Porous Pavement 65-100 65-100 30-65
USEPA. 1999. Preliminary Data Summary of Urban Stormwater BMPs.
RANGE 65-100 65-100 30 - 94
6.4.1 POROUS PAVEMENTPollutant Removal % Efficiency
363-0300-002 / December 30, 2006 Page 10of 36

Pennsylvania Stormwater Best Management Practices Manual Appendix A
Type TSS TN NO3 NOx TKN TP Primary Source Secondary Source Comments
Infiltration Basin 95 65
Cahill Assoc. Technical BMP Manual & Infiltration Feasibility Report: Infiltration of Stormwater in Areas Underlain by Carbonate Bedrock within the Little Lehigh Creek Watershed. Nov 2002.
Infiltration Basin 75 45 - 55 50 - 55
Schueler, T. 1987. Controlling urban runoff – a practical manual for planning and designing urban best management practices. Metropolitan Washington Council of Governments, Washington, DC.
FHWA, 1999. Stormwater Best Management Practices in an Ultra-Urban Setting: Selection and Monitoring . Federal Highway Administration, U.S. Department of Transportation.
Capture of 12.7 mm (0.5 in) of runoff (first flush)
Infiltration Basin 99 60 - 70 65 - 75
Schueler, T. 1987. Controlling urban runoff – a practical manual for planning and designing urban best management practices. Metropolitan Washington Council of Governments, Washington, DC.
FHWA, 1999. Stormwater Best Management Practices in an Ultra-Urban Setting: Selection and Monitoring . Federal Highway Administration, U.S. Department of Transportation.
Capture of 25.4 mm (1 in) of runoff
Infiltration Basin 90 55 - 60 60 - 70
Schueler, T. 1987. Controlling urban runoff – a practical manual for planning and designing urban best management practices. Metropolitan Washington Council of Governments, Washington, DC.
FHWA, 1999. Stormwater Best Management Practices in an Ultra-Urban Setting: Selection and Monitoring . Federal Highway Administration, U.S. Department of Transportation.
Capture of 50.8 mm (2 in) of runoff
Infiltration Basin 50-80 50-80 50-80
USEPA. Preliminary Data Summary of Urban Storm Water Best Management Practices. Aug 1999.
RANGE 50 - 99 45 - 80 50 - 80
6.4.2 INFILTRATION BASINPollutant Removal % Efficiency
363-0300-002 / December 30, 2006 Page 11of 36

Pennsylvania Stormwater Best Management Practices Manual Appendix A
Type TSS TN NO3 NOx TKN TP Primary Source Secondary Source Comments
Subsurface Infiltration Bed
90 60 27
Cahill Assoc. Technical BMP Manual & Infiltration Feasibility Report: Infiltration of Stormwater in Areas Underlain by Carbonate Bedrock within the Little Lehigh Creek Watershed. Nov 2002.
Subsurface Infiltration Bed
95 51 70
Chester County Conservation District. Chester County Stormwater BMP Tour Guide: Infiltration Beds . 2002.
RANGE 90 - 95 51 - 60 27 70
6.4.3 SUBSURFACE INFILTRATION BEDPollutant Removal % Efficiency
363-0300-002 / December 30, 2006 Page 12of 36

Pennsylvania Stormwater Best Management Practices Manual Appendix A
Type TSS TN NO3 NOx TKN TP Primary Source Secondary Source Comments
Infiltration Trench 3.4 100 -12.3 4.5
Kuo, C.Y., G. D. Boardman and K.T. Laptos. 1990. Phosphorous and Nitrogen Removal Efficiencies of Infiltration Trenches. Dept. of Civil Engineering. VA Polytechnic Institute and State University. Prepared for: No. VA Planning District Commission, Occoquan Technical Advisory Committee and VA State Water Control Board.
Winer, R. 2000. National Pollutant Removal Performance Database for Stormwater Treatment Practices, 2nd Edition. Center for Watershed Protection. Ellicott City, MD.
"49.5 hours detention time", soil type = loam; Percent efficiency calculated using event mean concentration (EMC) efficiency method.
Infiltration Trench 42.3 -100 100 100
Kuo, C.Y., G. D. Boardman and K.T. Laptos. 1990. Phosphorous and Nitrogen Removal Efficiencies of Infiltration Trenches. Dept. of Civil Engineering. VA Polytechnic Institute and State University. Prepared for: No. VA Planning District Commission, Occoquan Technical Advisory Committee and VA State Water Control Board.
Winer, R. 2000. National Pollutant Removal Performance Database for Stormwater Treatment Practices, 2nd Edition. Center for Watershed Protection. Ellicott City, MD.
"47.75 hours detention time", soil type = sandy loam; Percent efficiency calculated using event mean concentration (EMC) efficiency method.
Infiltration Trench 50.5 82 70.1 100
Kuo, C.Y., G. D. Boardman and K.T. Laptos. 1990. Phosphorous and Nitrogen Removal Efficiencies of Infiltration Trenches. Dept. of Civil Engineering. VA Polytechnic Institute and State University. Prepared for: No. VA Planning District Commission, Occoquan Technical Advisory Committee and VA State Water Control Board.
Winer, R. 2000. National Pollutant Removal Performance Database for Stormwater Treatment Practices, 2nd Edition. Center for Watershed Protection. Ellicott City, MD.
"51.5 hours detention time", soil type = sandy; Percent efficiency calculated using event mean concentration (EMC) efficiency method.
Infiltration Trench 50-80 50-80 15-45
USEPA. Preliminary Data Summary of Urban Storm Water Best Management Practices . Aug 1999.
Infiltration Trench 90 60
Schueler, T.R., 1992. A Current Assessment of Urban Best Management Practices. Metropolitan Washington Council of Governments.
United States Environmental Protection Agency (USEPA). Storm Water Technology Fact Sheet: Infiltration Trench (EPA 832-F-99-019). 1999.
WQ Trench 75 45 - 55 50 - 55
Schueler, T. 1987. Controlling urban runoff – a practical manual for planning and designing urban best management practices. Metropolitan Washington Council of Governments, Washington, DC.
FHWA, 1999. Stormwater Best Management Practices in an Ultra-Urban Setting: Selection and Monitoring . Federal Highway Administration, U.S. Department of Transportation.
Capture of 12.7 mm (0.5 in) of runoff (first flush)
WQ Trench 90 55 - 60 55 - 60
Schueler, T. 1987. Controlling urban runoff – a practical manual for planning and designing urban best management practices. Metropolitan Washington Council of Governments, Washington, DC.
FHWA, 1999. Stormwater Best Management Practices in an Ultra-Urban Setting: Selection and Monitoring . Federal Highway Administration, U.S. Department of Transportation.
Capture of 50.8 mm (2 in) of runoff
RANGE 50 - 90 3.4 - 80 (-100) - 100 (-12.3) - 100 4.5 - 100
6.4.4 INFILTRATION TRENCHPollutant Removal % Efficiency
363-0300-002 / December 30, 2006 Page 13of 36

Pennsylvania Stormwater Best Management Practices Manual Appendix A
Type TSS TN NO3 NOx TKN TP Primary Source Secondary Source Comments
Rain Garden 53 49 16
Cahill Assoc. Technical BMP Manual & Infiltration Feasibility Report: Infiltration of Stormwater in Areas Underlain by Carbonate Bedrock within the Little Lehigh Creek W atershed. Nov 2002.
Rain Garden 87
Davis, A.P. “Bioretention – Studies Completed by the University of Maryland” http://www.ence.umd.edu/~apdavis/Biodata.htm. Updated: August 27, 2002.
Low Impact Development Center. “W atershed Benefits of Bioretention Techniques”. http://www.lid-stormwater.net/bioretention/bio_benefits.htm. Accessed: December 13, 2002.
Rain Garden 57
Davis, A.P., M. Shokouhian, H. Sharma, and C. Minami. 2001. Laboratory Study of Biological Retention for Urban Stormwater Management. W ater Environment Research. 73(1): 5-14.
Tetra Tech, Inc., 2003. Mecklenburg County Site Evaluation Tool Model Documentation.
Rain Garden 91 -16 63
Hsieh, C. and A.P. Davis. Multiple-event Study of Bioretention for Treatment of Urban Storm W ater Runoff. 2003. Percent efficiency calculated using mass efficiency method.
Rain Garden 90
United States Environmental Protection Agency (USEPA). Storm Water Technology Fact Sheet: Bioretention (EPA 832-F-99-012). 1999.
RANGE 53 - 91 49 - 57 (-16) - 16 63
6.4.5 RAIN GARDEN / BIORETENTIONPollutant Removal % Efficiency
L /
Type TSS TN NO3 NOx TKN TP Primary Source Secondary Source Comments
Dry Well 50-80 50-80 15-45
USEPA. Preliminary Data Summary of Urban Storm Water Best Management Practices. Aug 1999.
RANGE 50 - 80 50 - 80 15 - 45
6.4.6 DRY WEL SEEPAGE PITPollutant Removal % Efficiency
363-0300-002 / December 30, 2006 Page 14of 36

Pennsylvania Stormwater Best Management Practices Manual Appendix A
Type TSS TN NO3 NOx TKN TP Primary Source Secondary Source Comments
Filtering Practice 48 -78.5
Leif, W. 1999. Compost Stormwater Filter Evaluation. Snohomish County Public County Works. Everett, WA.
Winer, R. 2000. National Pollutant Removal Performance Database for Stormwater Treatment Practices, 2nd
Edition. Center for Watershed Protection. Ellicott City MD
# of storms = 8; Drainage area = 0.69acres; "Filter is 12" deep"; Percent efficiency calculated using event mean concentration (EMC) efficiency method.
Organic Filter 98 32 88
Corsi, S. and S. Greb. 1997. Demonstration project of Wisconsin Department of Natural Resources, United States Geological Survey and the City of Milwaukee. Personal communication with R. Pitt. 1997. In: Multi-Chamber Treatment Train Developed for Stormwater Hot Spots. Watershed Protection Techniques. Center for Watershed Protection. February 1997.
Winer, R. 2000. National Pollutant Removal Performance Database for Stormwater Treatment Practices, 2nd
Edition. Center for Watershed Protection. Ellicott City, MD.
Land Use = City Maintenance yard (pavement); %Impervious Cover = 100%; "treatment provided for the first 1/2in of runoff. (80% of the annual water load)"; # of storms = 5; Percent efficiency calculated using event mean concentration (EMC) efficiency method.
Organic Filter 88 61 47
Lower Colorado River Authority. 1997. Innovative NPS Pollution Control Program for Lake Travis in Central Texas. LCRA.
Winer, R. 2000. National Pollutant Removal Performance Database for Stormwater Treatment Practices, 2nd
Edition. Center for Watershed Protection. Ellicott City, MD.
Land Use = Large parking lot; % Impervious Cover = 82%; "Peat/sand filter media wit surface ED. Retrofit Site. Steep Slopes. Retention Capacity 1420ft3"; # of storms = 21; Percent efficiency calculated using event mean concentration (EMC) efficiency method
Organic Filter 90 68 73
Lower Colorado River Authority. 1997. Innovative NPS Pollution Control Program for Lake Travis in Central Texas. LCRA.
Winer, R. 2000. National Pollutant Removal Performance Database for Stormwater Treatment Practices, 2nd
Edition. Center for Watershed Protection. Ellicott City, MD.
Land Use = Large parking lot; % Impervious Cover = 82%; "Peat/sand filter media wit surface ED. Retrofit Site. Steep Slopes. Retention Capacity 1420ft3"; # of storms = 21; Percent efficiency calculated using mass efficiency method
Organic Filter 83 14 80
Pitt, R. 1996. The Control of Toxicants at Critical Source Areas. The Univerisity of Alabama at Birmingham. In: Multi-Chamber Treatment Train Developed for Stormwater Hot Spots. Watershed Protection Techniques. Center for Watershed Protection. February 1997. 2(3): 445 449
Winer, R. 2000. National Pollutant Removal Performance Database for Stormwater Treatment Practices, 2nd
Edition. Center for Watershed Protection. Ellicott City, MD.
Land Use = Parking Lot, vehicle service area; Treatment provided for 0.25-0.8in of rain; # of storms = 14; Percent efficiency calculated using event mean concentration (EMC) efficiency method.
Organic Filter 85 80
Pitt, R. 1997. Multi-Chamber Treatment Train Developed for Stormwater Hot Spots. Watershed Protection Techniques. Center for Watershed Protection February 1997 2(3): 445-449
Winer, R. 2000. National Pollutant Removal Performance Database for Stormwater Treatment Practices, 2nd
Edition. Center for Watershed Protection. Ellicott City MD
Land Use = Commercial Parking Lot; # of storms = 7; Drainage area = 2.5 acres; Percent efficiency calculated using event mean concentration (EMC) efficiency method
Organic Filter 95 -34 41Stewart, W. 1992. Compost Stormwater Treatment System. W&H Pacific Consultants. Draft Report. Portland, OR.
Winer, R. 2000. National Pollutant Removal Performance Database for Stormwater Treatment Practices, 2nd
Edition. Center for Watershed Protection. Ellicott City MD
Land Use = 95%Residential, rest roadway; # of storms = 7, Drainage area = 73.9; "Compost media filter"; Percent efficiency calculated using event mean concentration (EMC) efficiency method
Organic Media Filters 92 -145 57 49
Stormwater Management. 1994. Three Year Performance Summary of Stormwater Pollutant and Treatment – 185th Avenue, Hillsboro, Oregon. Technical Memorandum. Stormwater Management Portland Oregon
US Department of Transportation, Federal Highway Administration. "Stormwater Best Management Practices in an Ultra-Urban Setting: Selection and Monitoring: Fact Sheet - Organic Media Filters "
"3-year results for CSF® Type I system"
Other Media Filters 65-100 15-45 <30
USEPA. Preliminary Data Summary of Urban Storm Water Best Management Practices. Aug 1999.
6.4.7 CONSTRUCTED FILTERPollutant Removal % Efficiency
363-0300-002 / December 30, 2006 Page 15of 36

Pennsylvania Stormwater Best Management Practices Manual Appendix A
Type TSS TN NO3 NOx TKN TP Primary Source Secondary Source Comments
Packed Bed Filter 81 63 75
Egan, T., S. Burroughs and T. Attaway. 1995. Packed Bed Filter. Pp. 264-274 in Proceedings Fourth Biennial Stormwater Research Conference. October 19-20. Clearwater, FL. SW Florida Water Management District
Center for Watershed Protection. Design of Stormwater Filtering Systems . Dec 1996. (pg 4-8)
Percent efficiency calculated using mass efficiency method.
Sand Filter 98 64 65 66
Barrett, M.; M. Keblin; J. Malina; R. Charbeneau. 1998. Evaluation of the Performance of Permanent Runoff Controls: Summary and Conclusions. Center for Transportation Research. Texas Department of Transportation. University of Texas Austin TX
Winer, R. 2000. National Pollutant Removal Performance Database for Stormwater Treatment Practices, 2nd
Edition. Center for Watershed Protection. Ellicott City, MD.
Land Use = 67% Highway/33%Commercial; Drainage area = 82.95acres; # of storms = 10; Treament Vol = first 0.5in of runoff; Percent efficiency calculated using mass efficiency method.
Sand Filter 79 47 -53.3 70.6 65.5
Bell, W., L. Stokes, L.J. Gavan and T.N. Nguyen. 1995. Assessment of the Pollutant Removal Efficiences of Delaware Sand Filter BMPs. Final Report. Department of Transportation and Environmental Services. Alexandria, VA
Winer, R. 2000. National Pollutant Removal Performance Database for Stormwater Treatment Practices, 2nd
Edition. Center for Watershed Protection. Ellicott City, MD.
Land Use = Parking Lot; STP Size = 477.6ft3; Drainage area = 0.7acres; # of storms = 20; "Perimeter sand filter"; Percent efficiency calculated using mass efficiency method.
Sand Filter 86 31 -5 48 19
City of Austin, TX. 1990. Removal Efficiences of Stormwater Control Structures. Final Report. Environmental Resource Management Division.
Winer, R. 2000. National Pollutant Removal Performance Database for Stormwater Treatment Practices, 2nd
Edition. Center for Watershed Protection. Ellicott City, MD.
Land Use = Multi-family housing; Impervious Cover = 50%; # of storms = 18; Drainage area = 3.1acres; Treatment Vol = 0.5in; "Surface sand filter"; Percent efficiency calculated using mass efficiency method
Sand Filter 87 32 -79 62 61
City of Austin, TX. 1990. Removal Efficiences of Stormwater Control Structures. Final Report. Environmental Resource Management Division.
Winer, R. 2000. National Pollutant Removal Performance Database for Stormwater Treatment Practices, 2nd
Edition. Center for Watershed Protection. Ellicott City MD
Land Use = Road; Impervious Cover = 81%; # of storms = 16; Drainage area = 9.5acres; "Surface sand filter"; Percent efficiency calculated using mass efficiency method
Sand Filter 75 44 -13 64 59
City of Austin, TX. 1990. Removal Efficiences of Stormwater Control Structures. Final Report. Environmental Resource Management Division.
Winer, R. 2000. National Pollutant Removal Performance Database for Stormwater Treatment Practices, 2nd
Edition. Center for Watershed Protection. Ellicott City, MD.
Land Use = Mall 86%; Commercial Cover = 86%; # of storms = 18; Drainage area = 79acres; Treatment Vol = 0.5in; STP Size = 3.5acre/ft; "Surface sand filter"; Percent efficiency calculated using mass efficiency method
Sand Filter 92 71 23 90 80
City of Austin, TX. 1990. Removal Efficiences of Stormwater Control Structures. Final Report. Environmental Resource Management Division.
Winer, R. 2000. National Pollutant Removal Performance Database for Stormwater Treatment Practices, 2nd
Edition. Center for Watershed Protection. Ellicott City MD
Impervious Cover = 68%; # of storms = 17; Drainage area = 50acres; "Surface sand filter"; Percent efficiency calculated using mass efficiency method.
Sand Filters 70 21
United States Environmental Protection Agency (USEPA). Storm Water Technology Fact Sheet: Sand Filters (EPA 832-F-99-007) 1999.
Sand Filter 78 27 -100 57 27
Welborn, C. and J. Veenhuis. 1987. Effects of Runoff Controls on the Quantity and Quality of Urban Runoff in Two Locations in Austin, TX. USGS Water Resources Investigations Report. 87-4004
Winer, R. 2000. National Pollutant Removal Performance Database for Stormwater Treatment Practices, 2nd
Edition. Center for Watershed Protection. Ellicott City, MD.
Land Use = Commercial; Drainage area = 80acres; # of storms = 22; "Surface sand filter"; Percent efficiency calculated using mass efficiency method.
Surface Sand Filters 50-80 <30 50-80
USEPA. Preliminary Data Summary of Urban Storm Water Best Management Practices. Aug 1999.
RANGE 48 - 100 21 - 71 (-145) - 75 32 48 - 90 (-78.5) - 88
6.4.7 CONSTRUCTED FILTER (cont.)
Pollutant Removal % Efficiency
363-0300-002 / December 30, 2006 Page 16of 36

Pennsylvania Stormwater Best Management Practices Manual Appendix A
Type TSS TN NO3 NOx TKN TP Primary Source Secondary Source Comments
100 Foot Swale 60
Delaware DNREC and Brandywine Conservancy. Conservation Design for Stormwater Management . Sep. 1997.
200 Foot Swale 83
Delaware DNREC and Brandywine Conservancy. Conservation Design for Stormwater Management . Sep. 1997.
Drainage Channel 65 11
Dorman, M.E., J. Hartigan, R.F. Steg and T. Quasebarth. 1989. Retention, Detention and Overland Flow for Pollutant Removal from Highway Stormwater Runoff. Vol. 1. Research Report. Federal Highway Administration. FHWA/RD 89/202
Drainage Channel 33
Oakland H. An evaluation of Stormwater Pollutant Removal Through Grassed Swale Treatment. Proceedings of the International Symposium of Urban Hydrology, Hydraulics and Sediment Control 1983
Drainage Channel 31 37
Occoquan Watershed Monitoring Labortory (OWML). Final Report. Washington Area NURP Report. VPISU. Metropolitan Washington Council of Governments Manassas VA 1983
Drainage Channel 13 11
Yoursef, Y. et al. Best Management Practices – Removal of Highwy Contaminants by Roadside Swales. Final Report. Univerisity of Central Florida. Florida Department of Transportation. Orlando FL 1985
Dry Swale 87 84 80 83
Harper, H. 1988. Effects of Stormwater Management Systems on Groundwater Quality. Final Report. Environmental Research and Design, Inc. Prepared for Florida Department of Environmental Regulation
Winer, R. 2000. National Pollutant Removal Performance Database for Stormwater Treatment Practices, 2nd
Edition. Center for Watershed Protection. Ellicott City, MD.
Land Use = Interstate highway, 70% Impervious; # of storms = 16; "Infiltration Rate = 13.4in/hour. Time of Concentration = 45min" Drainage area = 0.83acres; Percent efficiency calculated using mass efficiency method
Dry Swale 99 99 99 99
Kercher, W.C., J.C. Landon and R. Massarelli. 1983. Grassy Swales Prove Cost-Effective for Water Pollution Control. Public Works. Vol. 16: 53-55.
Winer, R. 2000. National Pollutant Removal Performance Database for Stormwater Treatment Practices, 2nd
Edition. Center for Watershed Protection. Ellicott City MD
Land Use = Residential; Soil Type = Sandy; # of storms = 13; drainage area = 14 acres; slope = 2%; Percent efficiency calculated using mass efficiency method.
Grass Channel 60 -25 45
Seattle Metro and Washington Department of Ecology. 1992. Biofiltration Swale Performance: Recommendations and Design Considerations. Publication No. 657. Water Pollution Control Department, Seattle Washington.
Winer, R. 2000. National Pollutant Removal Performance Database for Stormwater Treatment Practices, 2nd
Edition. Center for Watershed Protection. Ellicott City, MD.
Land Use = Major roadway, residences, parks; impervious Cover = 47%; "grass channel design. 10 minute residence time for design storm; Drainage area = 15.5acres; slope = 4%; "Length 200ft. 5ft wide"; Percent efficiency calculated using event mean concentration (EMC) efficiency method
Grass Channel 67.8 31.4 4.5
Goldberg. 1993. Dayton Avenue Swale Biofiltration Study. Seattle Engineering Department. Seattle, WA.
Winer, R. 2000. National Pollutant Removal Performance Database for Stormwater Treatment Practices, 2nd
Edition. Center for Watershed Protection. Ellicott City MD
%Impervious Cover = 20; "600ft long grass channel"; # of storms = 8; Drainage area = 90acres; Percent efficiency calculated using event mean concentration (EMC) efficiency method
Grass Channel 83 -25 29
Seattle Metro and Washington Department of Ecology. 1992. Biofiltration Swale Performance: Recommendations and Design Considerations. Publication No. 657. Water Pollution Control Department, Seattle Washington.
Winer, R. 2000. National Pollutant Removal Performance Database for Stormwater Treatment Practices, 2nd
Edition. Center for Watershed Protection. Ellicott City, MD.
Land Use = Major roadway, residences, parks; impervious Cover = 47%; "grass channel design. 10 minute residence time for design storm; Drainage area = 15.5acres; slope = 4%; "Length 200ft. 5ft wide"; Percent efficiency calculated using event mean concentration (EMC) efficiency method
6.4.8 VEGETATED SWALE
Pollutant Removal % Efficiency
363-0300-002 / December 30, 2006 Page 17of 36

Pennsylvania Stormwater Best Management Practices Manual Appendix A
Type TSS TN NO3 NOx TKN TP Primary Source Secondary Source CommentsGrassed Swales 30-65 15-45 15-45 USEPA. 1999. Preliminary Data
Summary of Urban Stormwater BMPs.
Swales 24 -21
Yousef, Y.A., M.P. Wanielista, H.H. Harper, D.B. Pearce, and R.D. Tolbert. 1985. Best Management Practices Removal of Highway Contaminants by Roadside Swales. Final Report. Florida Department of Transportation, Tallahassee
Swales 27 -2
Yousef, Y.A., M.P. Wanielista, H.H. Harper, D.B. Pearce, and R.D. Tolbert. 1985. Best Management Practices Removal of Highway Contaminants by Roadside Swales. Final Report. Florida Department of Transportation, Tallahassee
Swales 39 48
Yousef, Y.A., M.P. Wanielista, H.H. Harper, D.B. Pearce, and R.D. Tolbert. 1985. Best Management Practices Removal of Highway Contaminants by Roadside Swales. Final Report. Florida Department of Transportation, Tallahassee
Swales 61 57
Yousef, Y.A., M.P. Wanielista, H.H. Harper, D.B. Pearce, and R.D. Tolbert. 1985. Best Management Practices Removal of Highway Contaminants by Roadside Swales. Final Report. Florida Department of Transportation, Tallahassee
Swales 73 67
Yousef, Y.A., M.P. Wanielista, H.H. Harper, D.B. Pearce, and R.D. Tolbert. 1985. Best Management Practices Removal of Highway Contaminants by Roadside Swales. Final Report. Florida Department of Transportation, Tallahassee
Swales 100 100
Yousef, Y.A., M.P. Wanielista, H.H. Harper, D.B. Pearce, and R.D. Tolbert. 1985. Best Management Practices Removal of Highway Contaminants by Roadside Swales. Final Report. Florida Department of Transportation, Tallahassee
Vegetated Filter Strip 87 50 44
Barrett, M.E. et al. Evaluation of the Performance of Permanent Runoff controls: Summary and Conclusions. Center for Research in Water Resources, University of Texas at Austin. Austin, TX: Nov 1997
Site 1; Treatment Length = 7.5 to 8.8m; slope = .73%; vegetation = buffalo grass; higher traffic than site 2; Percent efficiency calculated using event mean concentration (EMC) efficiency method.
Vegetated Filter Strip 85 23 34
Barrett, M.E. et al. Evaluation of the Performance of Permanent Runoff controls: Summary and Conclusions. Center for Research in Water Resources, University of Texas at Austin. Austin, TX: Nov 1997
Site 2; Treatment Length = 7.8 to 8.1m; slope = 1.7%; vegetation = mixed; lower traffic than site 1; Percent efficiency calculated using event mean concentration (EMC) efficiency method.
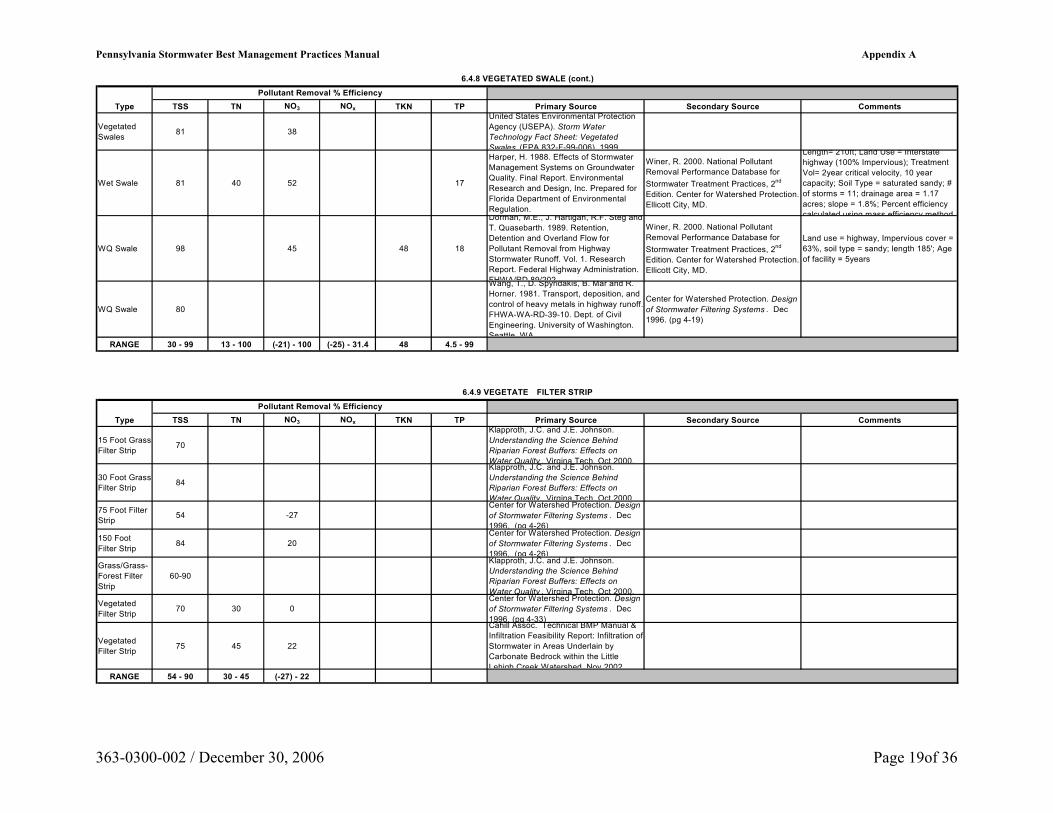
6.4.8 VEGETATED SWALE (cont.)
Pollutant Removal % Efficiency
363-0300-002 / December 30, 2006 Page 18of 36
Pennsylvania Stormwater Best Management Practices Manual Appendix A
Type TSS TN NO3 NOx TKN TP Primary Source Secondary Source Comments
Vegetated Swales 81 38
United States Environmental Protection Agency (USEPA). Storm Water Technology Fact Sheet: Vegetated Swales (EPA 832-F-99-006). 1999.
Wet Swale 81 40 52 17
Harper, H. 1988. Effects of Stormwater Management Systems on Groundwater Quality. Final Report. Environmental Research and Design, Inc. Prepared for Florida Department of Environmental Regulation.
Winer, R. 2000. National Pollutant Removal Performance Database for Stormwater Treatment Practices, 2nd
Edition. Center for Watershed Protection. Ellicott City, MD.
Length= 210ft; Land Use = Interstate highway (100% Impervious); Treatment Vol= 2year critical velocity, 10 year capacity; Soil Type = saturated sandy; # of storms = 11; drainage area = 1.17 acres; slope = 1.8%; Percent efficiency calculated using mass efficiency method
WQ Swale 98 45 48 18
Dorman, M.E., J. Hartigan, R.F. Steg and T. Quasebarth. 1989. Retention, Detention and Overland Flow for Pollutant Removal from Highway Stormwater Runoff. Vol. 1. Research Report. Federal Highway Administration. FHWA/RD 89/202
Winer, R. 2000. National Pollutant Removal Performance Database for Stormwater Treatment Practices, 2nd
Edition. Center for Watershed Protection. Ellicott City, MD.
Land use = highway, Impervious cover = 63%, soil type = sandy; length 185'; Age of facility = 5years
WQ Swale 80
Wang, T., D. Spyridakis, B. Mar and R. Horner. 1981. Transport, deposition, and control of heavy metals in highway runoff. FHWA-WA-RD-39-10. Dept. of Civil Engineering. University of Washington. Seattle WA
Center for Watershed Protection. Design of Stormwater Filtering Systems . Dec 1996. (pg 4-19)
RANGE 30 - 99 13 - 100 (-21) - 100 (-25) - 31.4 48 4.5 - 99
6.4.8 VEGETATED SWALE (cont.)
Pollutant Removal % Efficiency
D
Type TSS TN NO3 NOx TKN TP Primary Source Secondary Source Comments
15 Foot Grass Filter Strip 70
Klapproth, J.C. and J.E. Johnson. Understanding the Science Behind Riparian Forest Buffers: Effects on Water Quality . Virgina Tech. Oct 2000.
30 Foot Grass Filter Strip 84
Klapproth, J.C. and J.E. Johnson. Understanding the Science Behind Riparian Forest Buffers: Effects on Water Quality . Virgina Tech. Oct 2000.
75 Foot Filter Strip 54 -27
Center for Watershed Protection. Design of Stormwater Filtering Systems . Dec 1996. (pg 4-26)
150 Foot Filter Strip 84 20
Center for Watershed Protection. Design of Stormwater Filtering Systems . Dec 1996. (pg 4-26)
Grass/Grass-Forest Filter Strip
60-90
Klapproth, J.C. and J.E. Johnson. Understanding the Science Behind Riparian Forest Buffers: Effects on Water Quality . Virgina Tech. Oct 2000.
Vegetated Filter Strip 70 30 0
Center for Watershed Protection. Design of Stormwater Filtering Systems . Dec 1996. (pg 4-33)
Vegetated Filter Strip 75 45 22
Cahill Assoc. Technical BMP Manual & Infiltration Feasibility Report: Infiltration of Stormwater in Areas Underlain by Carbonate Bedrock within the Little Lehigh Creek Watershed Nov 2002
RANGE 54 - 90 30 - 45 (-27) - 22
6.4.9 VEGETATE FILTER STRIP
Pollutant Removal % Efficiency
363-0300-002 / December 30, 2006 Page 19of 36

Pennsylvania Stormwater Best Management Practices Manual Appendix A
Type TSS TN NO3 NOx TKN TP Primary Source Secondary Source CommentsConstructed Wetlands 50-80 <30 15-45 USEPA. 1999. Preliminary Data
Summary of Urban Stormwater BMPs.
Extended Detention Wetland
24 35 16
Athanas C. and C. Stevenson. 1986. Nutrient Removal from Stormwater Runoff by a Vegetated Collection Pond - The Mays Chapel Wetland Basin Project. Prepared for the City of Baltimore, Department of Public Works, Bureau of Water and Wastewater, Water Quality Management Office
Winer, R. 2000. National Pollutant Removal Performance Database for Stormwater Treatment Practices, 2nd Edition. Center for Watershed Protection. Ellicott City, MD.
Treatment volume = 0.1in/acre; Drainage area = 97acres
Extended Detention Wetland
76 25 54
Barten, J.M. 1983. Treatment of Stormwater Runoff Using Aquatic Plants. The Use of Wetlands for Controlling Stormwater Pollution. Strecker, E.W. J.M. Kersnar and E.E. Dris coll (Eds.). Woodward-Clyde Consultants. Portland, Oregon. Prepared for the USEPA, Region V, Water Division, Watershed Management Unit. EPA/600 February
Winer, R. 2000. National Pollutant Removal Performance Database for Stormwater Treatment Practices, 2nd Edition. Center for Watershed Protection. Ellicott City, MD.
Treatment volume = 0.15in/acre; Drainage area = 1070acres
Extended Detention Wetland
62 23 40 24
Oberts, G.L., P.J. Wotzka and J.A. Hartsoe. 1989. The water Quality Performance of Select Urban Runoff Treatment Systems. Prepared for the Legislative Commision on Minnesota Resources. Metropolitan Council. St. Paul MN Publication No 590-89-062a
Winer, R. 2000. National Pollutant Removal Performance Database for Stormwater Treatment Practices, 2nd Edition. Center for Watershed Protection. Ellicott City, MD.
# of storms = 10; Treatment volume = 0.1in/acre; Drainage area = 413acres
Extended Detention Wetland
62 -2.1 1.2 15 8.3
Occoquan Watershed Monitoring Laboratory and George Mason Univeristy. 1990. Final Report: The Evaluation of a Created Wetland as an Urban Best Management Practice. Prepared for the Northern Virginia Soil and Water Conservation District
Winer, R. 2000. National Pollutant Removal Performance Database for Stormwater Treatment Practices, 2nd Edition. Center for Watershed Protection. Ellicott City, MD.
Impervious Cover = 30%; # of storms = 23; Treatment volume = 0.1in/acre; Drainage area = 40acres; "Data collected from Large storms >0.1watershed inch. Large storms overwhelm capacity of wetlands to remove nutrients."
Extended Detention Wetland
93 76 68 81 76
Occoquan Watershed Monitoring Laboratory and George Mason Univeristy. 1990. Final Report: The Evaluation of a Created Wetland as an Urban Best Management Practice. Prepared for the Northern Virginia Soil and Water Conservation District
Winer, R. 2000. National Pollutant Removal Performance Database for Stormwater Treatment Practices, 2nd Edition. Center for Watershed Protection. Ellicott City, MD.
Impervious Cover = 30%; # of storms = 23; Treatment volume = 0.1in/acre; Drainage area = 40acres; "Data collected from Small storms <0.1watershed inch."; Percent efficiency calculated using mass efficiency method.
Shallow Marsh 65 22.8 54.9 54.5 39.1
Athanas, C. and C. Stevenson. 1991. The Use of Artificial Wetlands in Treating Stormwater Runoff. Prepared for the Maryland Sediment and Stormwater Administration. Maryland Department of the Environment
Winer, R. 2000. National Pollutant Removal Performance Database for Stormwater Treatment Practices, 2nd Edition. Center for Watershed Protection. Ellicott City, MD.
Land Use = High School roof, parking lot, athletic; Surface area of wetland = 0.6acres; Treatment volume = 0.5in/acre; Drainage area = 16acres; Percent efficiency calculated using mass efficiency method
Shallow Marsh 37.5 13 25.5 11.5 47.5
Blackburn, R., P.L. Pimentel and G.E. French. 1986. Treament of Stormwater Runoff Using Aquatic Plants. The Use of Wetlands for Controlling Stormwater Pollution. Strecker, E.W. J.M. Kersnar and E.E. Dris coll (Eds.). Woodward-Clyde Consultants. Portland, Oregon. Prepared for the USEPA, Region V, Water Division, Watershed Management
Winer, R. 2000. National Pollutant Removal Performance Database for Stormwater Treatment Practices, 2nd Edition. Center for Watershed Protection. Ellicott City, MD.
Land use = Golf Course; Size of Wetland = 296acres; # of storms = 72; Treatment volume = 1in; Drainage area = 2340acres; Percent efficiency calculated using event mean concentration (EMC) efficiency method.
Shallow Marsh 86 46 94 34 70
Carr, D. and B. Rushton. 1995. Integrating a Herbaceous Wetland into Stormwater Management. Stormwater Research Program. Southwest Florida Water Management District Brooksville
Winer, R. 2000. National Pollutant Removal Performance Database for Stormwater Treatment Practices, 2nd Edition. Center for Watershed Protection. Ellicott City MD
# of storms = 81; Drainage area = 15.3; STP size = 3acres; Percent efficiency calculated using mass efficiency method.
6.6.1 CONSTRUCTED WETLAND
Pollutant Removal % Efficiency
363-0300-002 / December 30, 2006 Page 20of 36

Pennsylvania Stormwater Best Management Practices Manual Appendix A
Type TSS TN NO3 NOx TKN TP Primary Source Secondary Source Comments
Shallow Marsh 82.9 -1.6 80.2 7
Harper, H.H., M.P. Wanielista, B.M. Fries and D.M. Baker. 1986. The Use of Wetlands for Controlling Stormwater Pollution. Strecker, E.W. J.M. Kersnar and E.E. Dris coll (Eds.). Woodward-Clyde Consultants. Portland, Oregon. Prepared for the USEPA, Region V, Water Division, Watershed Management Unit EPA/600 February 1992
Winer, R. 2000. National Pollutant Removal Performance Database for Stormwater Treatment Practices, 2nd Edition. Center for Watershed Protection. Ellicott City, MD.
"Runoff enters through a small shallow canal. This is a NATURAL WETLAND." Land Use = Large Residential Community; Treatment Volume = 1.08in/acre; Drainage area = 55.4acres; STP size = 2.47acres; Percent efficiency calculated using mass efficiency method.
Shallow Marsh 85.5 67 75
Hey, D.L., A.L. Kenimer and K.R. Barrett. 1994. Water Quality Improvement by Four Experimental Wetlands Ecological Engineering Vol. 3: 381-397.
Winer, R. 2000. National Pollutant Removal Performance Database for Stormwater Treatment Practices, 2nd Edition. Center for Watershed Protection. Ellicott City, MD.
Wetland 4. Land Use = 80%Agriculture, 20%Urban; "5 - 8.6 acre wetland. Max depth 5ft. Subject to low flow conditions (2.8-6.3 in/week)" Drainage area = 128000acres; Percent efficiency calculated using mass efficiency method
Shallow Marsh 87 82.5 77.5
Hey, D.L., A.L. Kenimer and K.R. Barrett. 1994. Water Quality Improvement by Four Experimental Wetlands Ecological Engineering Vol. 3: 381-397.
Winer, R. 2000. National Pollutant Removal Performance Database for Stormwater Treatment Practices, 2nd Edition. Center for Watershed Protection. Ellicott City, MD.
Wetland 1. Land Use = 80%Agriculture, 20%Urban; "5 - 8.6 acre wetland. Max depth 5ft. Subject to high flow conditions (13.4 - 38.2 in/week)" Drainage area = 128000acres; Percent efficiency calculated using mass efficiency method
Shallow Marsh 95.5 86 87
Hey, D.L., A.L. Kenimer and K.R. Barrett. 1994. Water Quality Improvement by Four Experimental Wetlands Ecological Engineering Vol. 3: 381-397.
Winer, R. 2000. National Pollutant Removal Performance Database for Stormwater Treatment Practices, 2nd Edition. Center for Watershed Protection. Ellicott City, MD.
Wetland 2. Land Use = 80%Agriculture, 20%Urban; "5 - 8.6 acre wetland. Max depth 5ft. Subject to high flow conditions (13.4 - 38.2 in/week)" Drainage area = 128000acres; Percent efficiency calculated using mass efficiency method
Shallow Marsh 99.5 99 99.5
Hey, D.L., A.L. Kenimer and K.R. Barrett. 1994. Water Quality Improvement by Four Experimental Wetlands Ecological Engineering Vol. 3: 381-397.
Winer, R. 2000. National Pollutant Removal Performance Database for Stormwater Treatment Practices, 2nd Edition. Center for Watershed Protection. Ellicott City, MD.
Wetland 3. Land Use = 80%Agriculture, 20%Urban; "5 - 8.6 acre wetland. Max depth 5ft. Subject to low flow conditions (2.8-6.3 in/week)" Drainage area = 128000acres; Percent efficiency calculated using mass efficiency method
Shallow Marsh 94 78
Hickok, E.A., M.C. Hannaman and N.C. Wenck. 1977. Urban Runoff Treatment Methods. Volume 1: Non-structural Wetland Treatment. The Use of Wetlands for Controlling Stormwater Pollution. Strecker, E.W. J.M. Kersnar and E.E. Dris coll (Eds.). Woodward-Clyde Consultants. Portland, Oregon. Prepared for the USEPA, Region V, Water Division, Watershed Management
Winer, R. 2000. National Pollutant Removal Performance Database for Stormwater Treatment Practices, 2nd Edition. Center for Watershed Protection. Ellicott City, MD.
Land use = 47%Residential. "This is a NATURAL WETLAND." STP size = 7.6acres. Treatment volume = 1.25 in/acre; Drainage area = 73.2acres;
Shallow Marsh 20 67 33
Koon, J. 1995. Evaluation of Water Quality Ponds and Swales in the Issaquah/East Lake Sammamish Basins. King County Surface Water Management and Washington Department of Ecology. Seattle, WA.
Winer, R. 2000. National Pollutant Removal Performance Database for Stormwater Treatment Practices, 2nd Edition. Center for Watershed Protection. Ellicott City, MD.
"Two cell wetland; first cell 2ft deep pool with emergent wetlands; second cell is free." # of storms = 5; Design Basis = 2 & 25 year quantity control only; Drainage area = 7.7acres; Percent efficiency calculated using event mean concentration (EMC) efficiency method
Shallow Marsh 54 78
Phipps, R.G. and W.G. Crumpton. 1994. Factors Affecting Nitrogen Loss in Experimental Wetlands With Different Hydrologic Loads. Ecological Engineering. December 1994. Vol. 3(4): 399-408
Winer, R. 2000. National Pollutant Removal Performance Database for Stormwater Treatment Practices, 2nd Edition. Center for Watershed Protection. Ellicott City, MD.
"High Hydraulic Loading." Average Detention Time = 12days; Land Use = 80%Ag; STP size = 5.9acres, avg 24in deep; Drainage area = 128000acres; Percent efficiency calculated using mass efficiency method
Shallow Marsh 59 84
Phipps, R.G. and W.G. Crumpton. 1994. Factors Affecting Nitrogen Loss in Experimental Wetlands With Different Hydrologic Loads. Ecological Engineering. December 1994. Vol. 3(4): 399-408
Winer, R. 2000. National Pollutant Removal Performance Database for Stormwater Treatment Practices, 2nd Edition. Center for Watershed Protection. Ellicott City, MD.
"High Hydraulic Loading." Average Detention Time = 13days; Land Use = 80%Ag; STP size = 4.7acres, avg 28in deep; Drainage area = 128000acres; Percent efficiency calculated using mass efficiency method
6.6.1 CONSTRUCTED WETLAND (cont.)
Pollutant Removal % Efficiency
363-0300-002 / December 30, 2006 Page 21of 36

Pennsylvania Stormwater Best Management Practices Manual Appendix A
Type TSS TN NO3 NOx TKN TP Primary Source Secondary Source Comments
Shallow Marsh 75 95
Phipps, R.G. and W.G. Crumpton. 1994. Factors Affecting Nitrogen Loss in Experimental Wetlands With Different Hydrologic Loads. Ecological Engineering. December 1994. Vol. 3(4): 399-408
Winer, R. 2000. National Pollutant Removal Performance Database for Stormwater Treatment Practices, 2nd Edition. Center for Watershed Protection. Ellicott City, MD.
"Low Hydraulic Loading." Average Detention Time = 95days; Land Use = 80%Ag; STP size = 5.9acres, avg 28in deep; Drainage area = 128000acres; Percent efficiency calculated using mass efficiency method
Stormwater Wetland 67 28
Center for Watershed Protection, 1997. National Pollutant Removal Performance Database for Stormwater Best Management Practices. Prepared for the Chesapeake Research Consortium.
United States Environmental Protection Agency (USEPA). Storm Water Technology Fact Sheet: Storm Water Wetlands (EPA 832-F-99-025) 1999.
Stormwater Wetland 56 20 -2
Reinelt et al., 1990. In:The Use of Wetlands for Controlling Stormwater Pollution. Strecker, E.W. J.M. Kersnar and E.E. Dris coll (Eds.). Woodward-Clyde Consultants. Portland, Oregon. Prepared for the USEPA, Region V, Water Division, Watershed Management Unit EPA/600 February 1992
Winer, R. 2000. National Pollutant Removal Performance Database for Stormwater Treatment Practices, 2nd Edition. Center for Watershed Protection. Ellicott City, MD.
# of storms = 13; Treatment Volume = 0.03in/acre; Drainage Area = 214.8acres; "Channelization reduced effectiveness."
Stormwater Wetland 14 4 -2
Reinelt et al., 1992. In:The Use of Wetlands for Controlling Stormwater Pollution. Strecker, E.W. J.M. Kersnar and E.E. Dris coll (Eds.). Woodward-Clyde Consultants. Portland, Oregon. Prepared for the USEPA, Region V, Water Division, Watershed Management Unit EPA/600 February 1992
Winer, R. 2000. National Pollutant Removal Performance Database for Stormwater Treatment Practices, 2nd Edition. Center for Watershed Protection. Ellicott City, MD.
# of storms = 13; Treatment Volume = 0.01in/acre; Drainage Area = 461.7acres; "Channelization reduced effectiveness."
Stormwater Wetland 57 67 57
Rushton, B. and C. Dye. 1993. An In-Depth Analysis of a Wet Detention Stormwater System. Southwest Florida Water Management District. Brooksville, FL.
Winer, R. 2000. National Pollutant Removal Performance Database for Stormwater Treatment Practices, 2nd Edition. Center for Watershed Protection. Ellicott City, MD.
# of storms = 25; Drainage Area = 6acres; Surface Area = 0.32acres, Max Depth = 18ft; Runoff conveyed by 200ft drainage channel; BMP apprx. 3-5 years old.; Percent efficiency calculated using event mean concentration (EMC) efficiency method
Stormwater Wetland -1.32 14.86
Yu, S; G. Fitch, and T. Earles. 1998. Constructed Wetlands for Stormwater Management. Virginia Transportation Research Council. Charlottesville, VA.
Winer, R. 2000. National Pollutant Removal Performance Database for Stormwater Treatment Practices, 2nd Edition. Center for Watershed Protection. Ellicott City MD
Land Use = parking lot and highway; # of storms = 5; STP size = 0.7acres; Percent efficiency calculated using event mean concentration (EMC) efficiency method.
Stormwater Wetland 30.1 27.46
Yu, S; G. Fitch, and T. Earles. 1998. Constructed Wetlands for Stormwater Management. Virginia Transportation Research Council. Charlottesville, VA.
Winer, R. 2000. National Pollutant Removal Performance Database for Stormwater Treatment Practices, 2nd Edition. Center for Watershed Protection. Ellicott City MD
Land Use = parking lot and highway; # of storms = 5; STP size = 0.7acres; Percent efficiency calculated using mass efficiency method.
Stormwater Wetland 52.02 68.09
Yu, S; G. Fitch, and T. Earles. 1998. Constructed Wetlands for Stormwater Management. Virginia Transportation Research Council. Charlottesville, VA.
Winer, R. 2000. National Pollutant Removal Performance Database for Stormwater Treatment Practices, 2nd Edition. Center for Watershed Protection. Ellicott City MD
Land Use = Highway; # of storms = 13; STP size = 5acres; Percent efficiency calculated using mass efficiency method.
Stormwater Wetland 56.96 68.61
Yu, S; G. Fitch, and T. Earles. 1998. Constructed Wetlands for Stormwater Management. Virginia Transportation Research Council. Charlottesville, VA.
Winer, R. 2000. National Pollutant Removal Performance Database for Stormwater Treatment Practices, 2nd Edition. Center for Watershed Protection. Ellicott City MD
Land Use = Highway; # of storms = 13; STP size = 5acres; Percent efficiency calculated using event mean concentration (EMC) efficiency method.
RANGE (-1.32) - 99.5 (-2.1) - 76 1.2 - 99 35 - 94 11.5 - 81 (-2) - 95.5
6.6.1 CONSTRUCTED WETLAND (cont.)
Pollutant Removal % Efficiency
363-0300-002 / December 30, 2006 Page 22of 36

Pennsylvania Stormwater Best Management Practices Manual Appendix A
Type TSS TN NO3 NOx TKN TP Primary Source Secondary Source CommentsRetention Basin 50-80 30-65 30-65 USEPA. 1999. Preliminary Data
Summary of Urban Stormwater BMPs.
Wet Extended Detention Pond
60.4 16 18.2 46.2
Borden, R.C., J.L. Dorn, J.B. Stillman and S.K. Liehr. 1996. Draft Report. Evaluation of Ponds and Wetlands For Protection of Public Water Supplies. Water Resources Research Institute of the Univeristy of North Carolina. Department of Civil Engineering. North Carolina State University Raleigh NC
Winer, R. 2000. National Pollutant Removal Performance Database for Stormwater Treatment Practices, 2nd
Edition. Center for Watershed Protection. Ellicott City, MD.
Land Use = Dairy Farms, woodland; Impervious Cover = 16%; Percent efficiency calculated using mass efficiency method.
Wet Extended Detention Pond
54 39 45 26 46
City of Austin, TX. 1991. Design Guidelines for Water Quality Control Basins. Public Works Department. Austin, TX.
Winer, R. 2000. National Pollutant Removal Performance Database for Stormwater Treatment Practices, 2nd
Edition. Center for Watershed Protection. Ellicott City MD
Impervious cover = 39%
Wet Extended Detention Pond
87 24 59 79
Fellows, D., W. Liang, S. Ristic, and M. Thompson. 1999. Performance Assessment of MTOs Rouge River, Highway 40, Stormwater Management Pond. SWAMP. Ontario Ministry of Environment and Energy
Winer, R. 2000. National Pollutant Removal Performance Database for Stormwater Treatment Practices, 2nd
Edition. Center for Watershed Protection. Ellicott City, MD.
Land Use = Mostly residential; Impervious Cover = 34%; Percent efficiency calculated using mass efficiency method.
Wet Extended Detention Pond
83 55 85 52 52
Lower Colorado River Authority. 1997. Innovative NPS Pollution Control Program for Lake Travis in Central Texas. LCRA.
Winer, R. 2000. National Pollutant Removal Performance Database for Stormwater Treatment Practices, 2nd
Edition. Center for Watershed Protection. Ellicott City MD
Land Use = parking lot/commercial
Wet Extended Detention Pond
98 54 79
Ontario Ministry of the Environment. 1991. Stormwater Quality Best Management Practices. Marshall Macklin Monaghan Limited. Toronto, Ontario.
Winer, R. 2000. National Pollutant Removal Performance Database for Stormwater Treatment Practices, 2nd
Edition. Center for Watershed Protection. Ellicott City MD
Wet Extended Detention Pond
61 63 56
Rushton, B., C. Miller and H. Hull. 1995. The Effect of Residence Time on the Efficiency of a Wet Detention Stormwater Treatment Pond. Presented at the 31st Annual Conference and Symposium in Urban Areas. November 10-12, 1995. Houston TX
Winer, R. 2000. National Pollutant Removal Performance Database for Stormwater Treatment Practices, 2nd
Edition. Center for Watershed Protection. Ellicott City, MD.
Impervious Cover = 30%
Wet Extended Detention Pond
67 61 57
Rushton, B., C. Miller and H. Hull. 1995. The Effect of Residence Time on the Efficiency of a Wet Detention Stormwater Treatment Pond. Presented at the 31st Annual Conference and Symposium in Urban Areas. November 10-12, 1995. Houston TX
Winer, R. 2000. National Pollutant Removal Performance Database for Stormwater Treatment Practices, 2nd
Edition. Center for Watershed Protection. Ellicott City, MD.
Impervious Cover = 30%; Residence time = 5 days
Wet Extended Detention Pond
69 28 67 25 75
Rushton, B., C. Miller and H. Hull. 1995. The Effect of Residence Time on the Efficiency of a Wet Detention Stormwater Treatment Pond. Presented at the 31st Annual Conference and Symposium in Urban Areas. November 10-12, 1995. Houston TX
Winer, R. 2000. National Pollutant Removal Performance Database for Stormwater Treatment Practices, 2nd
Edition. Center for Watershed Protection. Ellicott City, MD.
Impervious Cover = 30%; Residence time = 5 days
Wet Extended Detention Pond
71 64 62
Rushton, B., C. Miller and H. Hull. 1995. The Effect of Residence Time on the Efficiency of a Wet Detention Stormwater Treatment Pond. Presented at the 31st Annual Conference and Symposium in Urban Areas. November 10-12, 1995. Houston TX
Winer, R. 2000. National Pollutant Removal Performance Database for Stormwater Treatment Practices, 2nd
Edition. Center for Watershed Protection. Ellicott City, MD.
Impervious Cover = 30%
Wet Extended Detention Pond
94 88 90
Rushton, B., C. Miller and H. Hull. 1995. The Effect of Residence Time on the Efficiency of a Wet Detention Stormwater Treatment Pond. Presented at the 31st Annual Conference and Symposium in Urban Areas. November 10-12, 1995. Houston TX
Winer, R. 2000. National Pollutant Removal Performance Database for Stormwater Treatment Practices, 2nd
Edition. Center for Watershed Protection. Ellicott City, MD.
Impervious Cover = 30%; Land Use = rooftops, parking lots, vehicle storage; Residence Time = 14days
6.6.2 WET POND / RETENTION BASIN
Pollutant Removal % Efficiency
363-0300-002 / December 30, 2006 Page 23of 36

Pennsylvania Stormwater Best Management Practices Manual Appendix A
Type TSS TN NO3 NOx TKN TP Primary Source Secondary Source Comments
Wet Extended Detention Pond
95 88 89
Rushton, B., C. Miller and H. Hull. 1995. The Effect of Residence Time on the Efficiency of a Wet Detention Stormwater Treatment Pond. Presented at the 31st Annual Conference and Symposium in Urban Areas. November 10-12, 1995. Houston TX
Winer, R. 2000. National Pollutant Removal Performance Database for Stormwater Treatment Practices, 2nd
Edition. Center for Watershed Protection. Ellicott City, MD.
Impervious Cover = 30%; Land Use = rooftops, parking lots, vehicle storage; Residence Time = 14days
Wet Extended Detention Pond
76 75 65 70
Yu, S.L. and D.E. Benelmouffok. 1998. Field Testing of Selected Urban BMPs in Critical Water Issues and Computer Applications. In Proceedings of the 15th Annual Water Resources Conference. American Society of Civil Engineers, New York NY
Federal Highway Administration (FHWA). “Stormwater Best Management Practices in an Ultra-Urban Setting: Selection and Monitoring: Fact Sheet -Detention Ponds.” U.S. Department of Transportation.
Wet Pond 46 36 14 37
City of Austin. 1990. Removal Efficiencies of Stormwater Control Structures. Environmental Resources Management Division, Environmental and Conservation Services Department, City of Austin Austin TX
Federal Highway Administration (FHWA). “Stormwater Best Management Practices in an Ultra-Urban Setting: Selection and Monitoring: Fact Sheet -Detention Ponds.” U.S. Department of Transportation
Wet Pond 94 64 44 81
City of Austin. 1995 (Draft). Characterization of Stormwater Pollution for Austin, Texas Area. Environmental Resources Management Division, Environmental and Conservation Services Department, City of Austin, Austin TX
Federal Highway Administration (FHWA). “Stormwater Best Management Practices in an Ultra-Urban Setting: Selection and Monitoring: Fact Sheet -Detention Ponds.” U.S. Department of Transportation.
Wet Pond 68 12 93 -31 55
Cullum, M. 1984. Volume II Evaluation of the Water Management System at a Single Family Residential Site: Water Quality Analysis for Selected Storm Events at Timbercreek Subdivision in Boca Raton, FL. South Florida Water Management District
Winer, R. 2000. National Pollutant Removal Performance Database for Stormwater Treatment Practices, 2nd
Edition. Center for Watershed Protection. Ellicott City, MD.
Land Use = single family residential; Soil type = group A; Treatment Vol = 3.11in/acre; Percent efficiency calculated using event mean concentration (EMC) efficiency method.
Wet Pond 54 97 68 69
Dorman, M.E., J. Hartigan, R.F. Steg, and T. Quasebarth. 1989. Retention, Detention and Overland Flow for Pollutant Removal from Highway Stormwater Runoff. Vol. 1. Research Report. Federal Highway Administration. FHWA/RD 89/202
Winer, R. 2000. National Pollutant Removal Performance Database for Stormwater Treatment Practices, 2nd
Edition. Center for Watershed Protection. Ellicott City, MD.
Wet Pond 65 61 23 25
Dorman, M.E., J. Hartigan, R.F. Steg, and T. Quasebarth. 1989. Retention, Detention and Overland Flow for Pollutant Removal from Highway Stormwater Runoff. Vol. 1. Research Report. Federal Highway Administration. FHWA/RD 89/202
Winer, R. 2000. National Pollutant Removal Performance Database for Stormwater Treatment Practices, 2nd
Edition. Center for Watershed Protection. Ellicott City, MD.
Land Use = Highway; Percent efficiency calculated using mass efficiency method.
Wet Pond 32 6 -1 7 12
Driscoll, E.D. 1983. Performance of Detention Basins for Control of Urban Runoff Quality. Presented at the 1983 International Symposium on Urban Hydrology, Hydraulics and Sedimentation Control. University of Kentucky. Lexington KY
Winer, R. 2000. National Pollutant Removal Performance Database for Stormwater Treatment Practices, 2nd
Edition. Center for Watershed Protection. Ellicott City, MD.
Wet Pond 32 7 14 18
Driscoll, E.D. 1983. Performance of Detention Basins for Control of Urban Runoff Quality. Presented at the 1983 International Symposium on Urban Hydrology, Hydraulics and Sedimentation Control. University of Kentucky. Lexington KY
Winer, R. 2000. National Pollutant Removal Performance Database for Stormwater Treatment Practices, 2nd
Edition. Center for Watershed Protection. Ellicott City, MD.
6.6.2 WET POND / RETENTION BASIN (cont.)
Pollutant Removal % Efficiency
363-0300-002 / December 30, 2006 Page 24of 36

Pennsylvania Stormwater Best Management Practices Manual Appendix A
E
Type TSS TN NO3 NOx TKN TP Primary Source Secondary Source Comments
Wet Pond 60 45
Driscoll, E.D. 1983. Performance of Detention Basins for Control of Urban Runoff Quality. Presented at the 1983 International Symposium on Urban Hydrology, Hydraulics and Sedimentation Control. University of Kentucky. Lexington KY
Winer, R. 2000. National Pollutant Removal Performance Database for Stormwater Treatment Practices, 2nd
Edition. Center for Watershed Protection. Ellicott City, MD.
Wet Pond 81 37 27 54
Driscoll, E.D. 1983. Performance of Detention Basins for Control of Urban Runoff Quality. Presented at the 1983 International Symposium on Urban Hydrology, Hydraulics and Sedimentation Control. University of Kentucky. Lexington KY
Winer, R. 2000. National Pollutant Removal Performance Database for Stormwater Treatment Practices, 2nd
Edition. Center for Watershed Protection. Ellicott City, MD.
Wet Pond 84 34
Driscoll, E.D. 1983. Performance of Detention Basins for Control of Urban Runoff Quality. Presented at the 1983 International Symposium on Urban Hydrology, Hydraulics and Sedimentation Control. University of Kentucky. Lexington KY
Winer, R. 2000. National Pollutant Removal Performance Database for Stormwater Treatment Practices, 2nd
Edition. Center for Watershed Protection. Ellicott City, MD.
Wet Pond 91 62 66 60 79
Driscoll, E.D. 1983. Performance of Detention Basins for Control of Urban Runoff Quality. Presented at the 1983 International Symposium on Urban Hydrology, Hydraulics and Sedimentation Control. University of Kentucky. Lexington KY
Winer, R. 2000. National Pollutant Removal Performance Database for Stormwater Treatment Practices, 2nd
Edition. Center for Watershed Protection. Ellicott City, MD.
Wet Pond 54 16 24 30
Gain, S.W. The effects of Flow-Path Modifications on Urban Water-Quality Constitiuent Retention in Urban Stormwater Detention Pond and Wetland System, Orlando, Florida. Florida Departemtn of Transportation, Orlando, FL 1996
Winer, R. 2000. National Pollutant Removal Performance Database for Stormwater Treatment Practices, 2nd
Edition. Center for Watershed Protection. Ellicott City, MD.
"Pond was modified to increse detention time and was previously studied by Martin and Smoot (1988)." Percent efficiency calculated using event mean concentration (EMC) efficiency method.
Wet Pond 85 92 26 54
Harper, H.H., and J.L. Herr. 1993. Treatment Efficiencies of Detention with Filtration Systems. Environmental Research and Design, Inc, Orlando, FL.
Claytor, Richard, and T. Schueler, 1996. Design of Stormwater Filtering Systems. Center for Watershed Protection. Silver Spring, MD
Wet Pond 7 23 40
Kantrowitz, I. And W. Woodham. 1995. Efficiency of a Stormwater Detention Pond in Reducing Loads of Chemical and Physical Constituents in Urban Streamflow, Pinellas County, Florida. U.S. Geological Survey. Water Resources Investigations Report: 94-4217 Tallahassee FL
Winer, R. 2000. National Pollutant Removal Performance Database for Stormwater Treatment Practices, 2nd
Edition. Center for Watershed Protection. Ellicott City, MD.
"Very large online wet pond with detention" Percent efficiency calculated using event mean concentration (EMC) efficiency method.
Wet Pond 45 36 45
Kantrowitz, I. And W. Woodham. 1995. Efficiency of a Stormwater Detention Pond in Reducing Loads of Chemical and Physical Constituents in Urban Streamflow, Pinellas County, Florida. U.S. Geological Survey. Water Resources Investigations Report: 94-4217 Tallahassee FL
Winer, R. 2000. National Pollutant Removal Performance Database for Stormwater Treatment Practices, 2nd
Edition. Center for Watershed Protection. Ellicott City, MD.
"Very large online wet pond with detention"
Wet Pond 80 62 0 80
Liang, W. 1996. Performance Assessment of an Off-Line Stormwater Management Pond. Ontario Ministry of Environment and Energy.
Winer, R. 2000. National Pollutant Removal Performance Database for Stormwater Treatment Practices, 2nd
Edition. Center for Watershed Protection. Ellicott City MD
Land Use = Residential; Impervious Cover = 55%; Residential cover = 100%; Soil Type = clay till and clay loam
6.6.2 WET POND / RET NTION BASIN (cont.)
Pollutant Removal % Efficiency
363-0300-002 / December 30, 2006 Page 25of 36

Pennsylvania Stormwater Best Management Practices Manual Appendix A
Type TSS TN NO3 NOx TKN TP Primary Source Secondary Source Comments
Wet Pond 85NC DENR, 1999. North Carolina Stormwater Best Management Practices Manual. Division of Water Quality.
Wet Pond 85 30 24 31 48
Oberts, G.L., P.J. Wotzka and J.A. Hartsoe. 1989. The Water Quality Performance of Select Urban Runoff Treatment Systems. Prepared for the Legislative Commission on Minnesota Resources. Metropolitan Council. St. Paul MN Publication No 590-89-062a
Winer, R. 2000. National Pollutant Removal Performance Database for Stormwater Treatment Practices, 2nd
Edition. Center for Watershed Protection. Ellicott City, MD.
Age of Facility = 4years; Percent efficiency calculated using mass efficiency method.
Wet Pond 90 41 10 50 61
Oberts, G.L., P.J. Wotzka and J.A. Hartsoe. 1989. The Water Quality Performance of Select Urban Runoff Treatment Systems. Prepared for the Legislative Commission on Minnesota Resources. Metropolitan Council. St. Paul MN Publication No 590-89-062a
Winer, R. 2000. National Pollutant Removal Performance Database for Stormwater Treatment Practices, 2nd
Edition. Center for Watershed Protection. Ellicott City, MD.
Age of Facility = 6years
Wet Pond -33.3 32 39
Occoquan Watershed Monitoring Laboratory. 1983. Final Report: Metropolitan Washington Urban Runoff Project. Prepared for the Metropolitan Washington Council of Governments. Manassas VA
Winer, R. 2000. National Pollutant Removal Performance Database for Stormwater Treatment Practices, 2nd
Edition. Center for Watershed Protection. Ellicott City, MD.
Land Use = Medium density residential; Impervious cover = 25%
Wet Pond 85 34 86
Occoquan Watershed Monitoring Laboratory. 1983. Final Report: Metropolitan Washington Urban Runoff Project. Prepared for the Metropolitan Washington Council of Governments. Manassas VA
Winer, R. 2000. National Pollutant Removal Performance Database for Stormwater Treatment Practices, 2nd
Edition. Center for Watershed Protection. Ellicott City, MD.
Land Use = Agriculture
Wet Pond 80-90
United States Environmental Protection Agency (USEPA). Storm Water Technology Fact Sheet: Wet Detention Ponds (EPA 832-F-99-048). 1999.
Wet Pond 62 21 36
Wu, J. 1989. Evaluation of Detention Basin Performance in the Piedmont region of North Carolina. North Carolina Water Resources Research Institute. Report No. 89-248. Raleigh, NC.
Winer, R. 2000. National Pollutant Removal Performance Database for Stormwater Treatment Practices, 2nd
Edition. Center for Watershed Protection. Ellicott City, MD.
Land use = multi-unit housing, woodland; Impervious cover = 38%; Soil type = clay; Surface area = 3.3 acres, Mean pond depth = 3.8'; Volume=12.3acre feet; "No geese present." Percent efficiency calculated using mass
Wet Pond 93 32 45
Wu, J. 1989. Evaluation of Detention Basin Performance in the Piedmont region of North Carolina. North Carolina Water Resources Research Institute. Report No. 89-248. Raleigh, NC.
Winer, R. 2000. National Pollutant Removal Performance Database for Stormwater Treatment Practices, 2nd
Edition. Center for Watershed Protection. Ellicott City, MD.
Land use = mixed residential; Impervious cover = 46%; Residential = 100%; Pond = 4.9 acres; Mean pond depth = 8'; Volume = 38.8 acre feet; "Geese population present increase N and P values." Percent efficiency calculated using mass efficiency method
RANGE (-33.3) - 98 6 - 65 (-1) - 92 23 - 97 (-31) - 68 12 - 90
6.6.2 WET POND / RETENTION BASIN (cont.)
Pollutant Removal % Efficiency
363-0300-002 / December 30, 2006 Page 26of 36

Pennsylvania Stormwater Best Management Practices Manual Appendix A
Type TSS TN NO3 NOx TKN TP Primary Source Secondary Source CommentsDry Detention Basins 30-65 15-45 15-45 USEPA. 1999. Preliminary Data
Summary of Urban Stormwater BMPs.
Dry Detention Pond 96 64 44 81
Yu, S.L., M. Barnes, R.J. Kaighn, and S.L. Laio. 1994. Field Test of Stormwater Best Management Practices in Watershed Wastewater Treatment. In Proceedings of the 1994 National Conference on Environmental Engineering American Society of Civil
Federal Highway Administration (FHWA). “Stormwater Best Management Practices in an Ultra-Urban Setting: Selection and Monitoring: Fact Sheet -Detention Ponds.” U.S. Department of Transportation.
"Removal efficiencies based on mass loading."
Dry Extended Detention Pond
87 -10 26
Baltimore Department of Public Works. 1989. Detention Basin Retrofit Project and Monitoring Study Results. Water Quality Management Office. Baltimore, MD
Winer, R. 2000. National Pollutant Removal Performance Database for Stormwater Treatment Practices, 2nd
Edition. Center for Watershed Protection. Ellicott City MD
# of storms = 9; Treatment Vol = 0.50in/acre; drainage area = 16.8acres
Dry Extended Detention Pond
89 -3 26 51
Barrett, M.E. et al., 1997. Evaluation of the Performance of Permanent Runoff Controls: Summary and Conclusions, CRWR Online Report 97-3 . Center for Research in Water Resources, Bureau of Engineering Research, The University of Texas at Austin TX
Land Use = Highway; Percent efficiency calculated using mass efficiency method.
Dry Extended Detention Pond
30 35 52 18
City of Austin, TX. 1991. Design Guidelines for Water Qualit Control Basins. Public Works Department. Austin, TX.
Winer, R. 2000. National Pollutant Removal Performance Database for Stormwater Treatment Practices, 2nd
Edition. Center for Watershed Protection. Ellicott City MD
# of storms = 17; Treatment Vol = 0.50in/acre; drainage area= 28 acres
Dry Extended Detention Pond
47 21
Miller, T. 1987. Appraisal of Storm-Water Quality Near Salem, Oregon. US Geological Survey. Water Resources Report 87-4064.
Winer, R. 2000. National Pollutant Removal Performance Database for Stormwater Treatment Practices, 2nd
Edition. Center for Watershed Protection. Ellicott City MD
Impervious = 53%; Residential = 39%; Commercial = 38%; Industrial = 1%; # of storms = 11; soil = HSG-C; Drainage area = 512acres
Dry Extended Detention Pond
51.5 42.5 48
Occoquan Watershed Monitoring Laboratory. 1987. Final Report: London Commons Extended Detention Facility. Urban BMP Research and Demonstration Project. Virginia Tech University Manassas VA
Winer, R. 2000. National Pollutant Removal Performance Database for Stormwater Treatment Practices, 2nd
Edition. Center for Watershed Protection. Ellicott City, MD.
# of storms = 27; Treatment Vol = 0.22in/acre; detention provided up to 20hours; drainage area = 11.4 acres
Dry Extended Detention Pond
70 24 30 13
Schueler, T.R. and M. Helfrich. 1988. Design of Extended Detention Wet Pond Systems. In: Design of Urban Runoff Quality Controls. L.L. Roesner, B. Urbonas and M.B. Sonnen (Eds.). American Society of Civil Engineers. New York NY
Winer, R. 2000. National Pollutant Removal Performance Database for Stormwater Treatment Practices, 2nd
Edition. Center for Watershed Protection. Ellicott City, MD.
# of storms = 25; Treatment Vol = 0.30in/acre; drainage area = 34acres
Dry Extended Detention Pond
71 26 -2 14
Stanley, D. 1994. An Evaluation of the Pollutant Removal of a Demonstration Urban Stormwater Detention Pond. Albermarle-Pamlico Estuary Study. APES Report 94-07.
Winer, R. 2000. National Pollutant Removal Performance Database for Stormwater Treatment Practices, 2nd
Edition. Center for Watershed Protection. Ellicott City, MD.
Impervious Cover = 31%; Land Use = Residential/Commerical; # of storms = 8; Treatment Vol = 72hours detention for the first 0.5in; drainage area = 200acres; Percent efficiency calculated using mass efficiency method
RANGE 30 - 96 15 - 45 (-10) - 64 26 - 44 13 - 81
6.6.3 DRY EXTENDED DETENTION BASIN
Pollutant Removal % Efficiency
363-0300-002 / December 30, 2006 Page 27of 36

Pennsylvania Stormwater Best Management Practices Manual Appendix A
Type TSS TN NO3 NOx TKN TP Primary Source Secondary Source Comments
Catch Basins 60 - 97
Aronson, G. et al. Evaluation of Catch Basin Performance for Urban Stormwater Pollution Control. EPA-600/2-83-043.
Stormwater Manager's Resource Center (SMRC). Pollution Prevention Fact Sheet: Catch Basins.
Only very small storms used
Catch Basins 10 - 25 5 - 10
Pitt, R. and G. Shawley.1982. A Demonstration of Non-Point Pollution Management on Castro Valley Creek , Alameda County Flood Control District (Hayward, California) and U.S. EPA, Washington DC
Stormwater Manager's Resource Center (SMRC). Pollution Prevention Fact Sheet: Catch Basins.
Catch Basins 32
Pitt, R. et al. 1997. Guidance Manual for Integrated Wet Weather Flow Collection and Treamtne Systems for Newly Urbanized Areas. US EPA. Office of Research and Development. Cincinnati, OH
Stormwater Manager's Resource Center (SMRC). Pollution Prevention Fact Sheet: Catch Basins.
RANGE 10 - 97 5 - 10
6.6.4 WATER QUALITY FILTER
Pollutant Removal % Efficiency
FF
Type TSS TN NO3 NOx TKN TP Primary Source Secondary Source Comments
25' buffer 57 27 34
Desbonnet, A., P, Pogue, V. Lee, and N. Wolff. 1994. Vegetated Buffers in the Coastal Zone: An Annotated Review and Bibliography. Coastal Resources Center, University of RI
Schueler, T. 1995. Site Planning for Urban Stream Protection. The Center for Watershed Protection.
50' buffer 62 31 38
Desbonnet, A., P, Pogue, V. Lee, and N. Wolff. 1994. Vegetated Buffers in the Coastal Zone: An Annotated Review and Bibliography. Coastal Resources Center, University of RI
Schueler, T. 1995. Site Planning for Urban Stream Protection. The Center for Watershed Protection.
75' buffer 65 33 41
Desbonnet, A., P, Pogue, V. Lee, and N. Wolff. 1994. Vegetated Buffers in the Coastal Zone: An Annotated Review and Bibliography. Coastal Resources Center, University of RI
Schueler, T. 1995. Site Planning for Urban Stream Protection. The Center for Watershed Protection.
100' buffer 67 34 43
Desbonnet, A., P, Pogue, V. Lee, and N. Wolff. 1994. Vegetated Buffers in the Coastal Zone: An Annotated Review and Bibliography. Coastal Resources Center, University of RI
Schueler, T. 1995. Site Planning for Urban Stream Protection. The Center for Watershed Protection.
200' buffer 72 38 47
Desbonnet, A., P, Pogue, V. Lee, and N. Wolff. 1994. Vegetated Buffers in the Coastal Zone: An Annotated Review and Bibliography. Coastal Resources Center, University of RI
Schueler, T. 1995. Site Planning for Urban Stream Protection. The Center for Watershed Protection.
Deciduous Forest Buffers 68
Lowrance, R., R. Todd, J. Fail, Jr., O. Hendrickson, Jr., R. Leonard, and L. Asmussen. 1984b. Riparian forests as nutrient filters in agricultural watersheds. Bioscience 34:374-377
Klapproth, J.C. and J.E. Johnson. Understanding the Science Behind Riparian Forest Buffers: Effects on Water Quality . Virgina Tech. Oct 2000.
Hardwood Riparian Area 84-90
Cooper, J.R., J.W. Gilliam, R.B. Daniels, and W.P. Robarge. 1987. Riparian areas as filters for agricultural sediment. Soil Science Society of America Journal 51:416-420
Klapproth, J.C. and J.E. Johnson. Understanding the Science Behind Riparian Forest Buffers: Effects on Water Quality . Virgina Tech. Oct 2000.
Riparian Buffer 95
Jordan, T.E., D.L. Correll, and D.E. Weller. 1993. Nutrient interception by a riparian forest receiving inputs from adjacent croplands. Journal of Environmental Quality 22:467-473
Klapproth, J.C. and J.E. Johnson. Understanding the Science Behind Riparian Forest Buffers: Effects on Water Quality . Virgina Tech. Oct 2000.
6.7.1 RIPARIAN BU ER RESTORATION
Pollutant Removal % Efficiency
363-0300-002 / December 30, 2006 Page 28of 36

Pennsylvania Stormwater Best Management Practices Manual Appendix A
Type TSS TN NO3 NOx TKN TP Primary Source Secondary Source Comments
Riparian Buffer 89
Peterjohn, W.T. and D.L. Correll. 1984. Nutrient dynamics in an agricultural watershed: observations on the role of a riparian forest. Ecology 65:1466-1475.
Klapproth, J.C. and J.E. Johnson. Understanding the Science Behind Riparian Forest Buffers: Effects on Water Quality . Virgina Tech. Oct 2000.
Riparian Buffer 48
Snyder, N.J., S. Mostaghimi, D.F. Berry, R.B. Reneau, E.P. Smith. 1995. Evaluation of a riparian wetland as a naturally occurring decontamination zone. Pages 259-262. In: Clean Water, Clean Environment - 21st Century. Volume III: Practices, Systems, and Adoption. Proceedings of a conference March 5-8, 1995 Kansas City, Mo. American Society of Agricultural
Klapproth, J.C. and J.E. Johnson. Understanding the Science Behind Riparian Forest Buffers: Effects on Water Quality . Virgina Tech. Oct 2000.
Switchgrass Buffer (7.1m) 95 80 62 78
Lee, K.H., T.M. Isenhart, and R.C. Schultz. "Sediment and nutrient removal in an established multi-species riparian buffer," Journal of Water Conservation, Vol 58 No 1
SWCS, 2003. Soil and Water Conservation Society.
Switchgrass/Woody Buffer (16.3m)
97 94 85 91
Lee, K.H., T.M. Isenhart, and R.C. Schultz. "Sediment and nutrient removal in an established multi-species riparian buffer," Journal of Water Conservation, Vol 58 No 1
SWCS, 2003. Soil and Water Conservation Society.
RANGE 57 - 97 27 - 94 48 - 95 34 - 91
6.7.1 RIPARIAN BUFFER RESTORATION (con't.)
Pollutant Removal % Efficiency
363-0300-002 / December 30, 2006 Page 29of 36

Pennsylvania Stormwater Best Management Practices Manual Appendix A
BMP Pollutant Removal Efficiencies- Inflow vs. Outflow Pollutant concentrations
363-0300-002 / December 30, 2006 Page 30of 36

Pennsylvania Stormwater Best Management Practices Manual Appendix A
Type Inflow Outflow Inflow Outflow Inflow Outflow Inflow Outflow Inflow Outflow Inflow Outflow Primary Source Secondary Source Comments
Infiltration Trench 6.59 3.8 0.95 3.8 0.24 0
Kuo, C.Y., G. D. Boardman and K.T. Laptos. 1990. Phosphorous and Nitrogen Removal Efficiencies of Infiltration Trenches. Dept. of Civil Engineering. VA Polytechnic Institute and State University. Prepared for: No. VA Planning District Commission, Occoquan Technical Advisory Committee and VA State
Winer, R. 2000. National Pollutant Removal Performance Database for Stormwater Treatment Practices, 2nd Edition. Center for Watershed Protection. Ellicott City, MD.
"47.75 hours detention time", soil type = sandy loam
Infiltration Trench 5.38 5.2 0.75 0 0.66 0.63
Kuo, C.Y., G. D. Boardman and K.T. Laptos. 1990. Phosphorous and Nitrogen Removal Efficiencies of Infiltration Trenches. Dept. of Civil Engineering. VA Polytechnic Institute and State University. Prepared for: No. VA Planning District Commission, Occoquan Technical Advisory Committee and VA State
Winer, R. 2000. National Pollutant Removal Performance Database for Stormwater Treatment Practices, 2nd Edition. Center for Watershed Protection. Ellicott City, MD.
"49.5 hours detention time", soil type = loam
Infiltration Trench 2.04 1.01 0.5 0.09 0.2 0
Kuo, C.Y., G. D. Boardman and K.T. Laptos. 1990. Phosphorous and Nitrogen Removal Efficiencies of Infiltration Trenches. Dept. of Civil Engineering. VA Polytechnic Institute and State University. Prepared for: No. VA Planning District Commission, Occoquan Technical Advisory Committee and VA State
Winer, R. 2000. National Pollutant Removal Performance Database for Stormwater Treatment Practices, 2nd Edition. Center for Watershed Protection. Ellicott City, MD.
"51.5 hours detention time", soil type = sandy
6.4.4 INFILTRATION TRENCH**UNITS ARE IN MG/L UNLESS OTHERWISE NOTED**
TSS TN NO3 NOx TKN TP
Type Inflow Outflow Inflow Outflow Inflow Outflow Inflow Outflow Inflow Outflow Inflow Outflow Primary Source Secondary Source Comments
Rain Garden 87.4g 7.6g 1.60g 1.85g 1.62g 0.60g
Hsieh, C. and A.P. Davis. Multiple-event Study of Bioretention for Treatment of Urban Storm Water Runoff. 2003. Percent efficiency calculated using mass efficiency method
6.4.5 RAIN GARDEN**UNITS ARE IN MG/L UNLESS OTHERWISE NOTED**
TSS TN NO3 NOx TKN TP
363-0300-002 / December 30, 2006 Page 31of 36

Pennsylvania Stormwater Best Management Practices Manual Appendix A
Type Inflow Outflow Inflow Outflow Inflow Outflow Inflow Outflow Inflow Outflow Inflow Outflow Primary Source Secondary Source Comments
Organic Filter 35.5 16
Leif, W. 1999. Compost Stormwater Filter Evaluation. Snohomish County Public County Works. Everett, WA.
Winer, R. 2000. National Pollutant Removal Performance Database for Stormwater Treatment Practices, 2nd Edition. Center for Watershed Protection. Ellicott City MD
# of storms = 8; Drainage area = 0.69acres; "Filter is 12" deep";
Organic Filter 49 6 1.76 0.858 0.481 0.552
Lower Colorado River Authority. 1997. Innovative NPS Pollution Control Program for Lake Travis in Central Texas. LCRA.
Winer, R. 2000. National Pollutant Removal Performance Database for Stormwater Treatment Practices, 2nd Edition. Center for Watershed Protection. Ellicott City MD
Land Use = Large parking lot; % Impervious Cover = 82%; "Peat/sand filter media wit surface ED. Retrofit Site. Steep Slopes. Retention Capacity 1420ft3"; # of storms = 21
Organic Filter 39.95 4.47 0.3 0.4
Stewart, W. 1992. Compost Stormwater Treatment System. W&H Pacific Consultants. Draft Report. Portland, OR.
Winer, R. 2000. National Pollutant Removal Performance Database for Stormwater Treatment Practices, 2nd Edition. Center for Watershed Protection. Ellicott City MD
Land Use = 95%Residential, rest roadway; # of storms = 7, Drainage area = 73.9; "Compost media filter"
Sand Filter 204 3.5 2.83 1.065 1.24 0.474
Barrett, M.; M. Keblin; J. Malina; R. Charbeneau. 1998. Evaluation of the Performance of Permanent Runoff Controls: Summary and Conclusions. Center for Transportation Research. Texas Department of Transportation. University of
Winer, R. 2000. National Pollutant Removal Performance Database for Stormwater Treatment Practices, 2nd Edition. Center for Watershed Protection. Ellicott City, MD.
Land Use = 67% Highway/33%Commercial; Drainage area = 82.95acres; # of storms = 10; Treament Vol = first 0.5in of runoff
Sand Filter 76.2 16.84 7.93 3.8 1.27 1.99
Bell, W., L. Stokes, L.J. Gavan and T.N. Nguyen. 1995. Assessment of the Pollutant Removal Efficiences of Delaware Sand Filter BMPs. Final Report. Department of Transportation and Environmental Services. Alexandria VA
Winer, R. 2000. National Pollutant Removal Performance Database for Stormwater Treatment Practices, 2nd Edition. Center for Watershed Protection. Ellicott City, MD.
Land Use = Parking Lot; STP Size = 477.6ft3; Drainage area = 0.7acres; # of storms = 20; "Perimeter sand filter"
6.4.7 CONSTRUCTED FILTER**UNITS ARE IN MG/L UNLESS OTHERWISE NOTED**
TSS TN NO3 NOx TKN TP
363-0300-002 / December 30, 2006 Page 32of 36

Pennsylvania Stormwater Best Management Practices Manual Appendix A
Type Inflow Outflow Inflow Outflow Inflow Outflow Inflow Outflow Inflow Outflow Inflow Outflow Primary Source Secondary Source Comments
Dry Swale 50 4 0.549 0.347 0.83 0.74 0.218 0.304
Dorman, M.E., J. Hartigan, R.F. Steg and T. Quasebarth. 1989. Retention, Detention and Overland Flow for Pollutant Removal from Highway Stormwater Runoff. Vol. 1. Research Report. Federal Highway Administration.
Winer, R. 2000. National Pollutant Removal Performance Database for Stormwater Treatment Practices, 2nd Edition. Center for Watershed Protection. Ellicott City, MD.
Land use = highway, Impervious cover = 63%, soil type = sandy; length 185'; Age of facility = 5years
Grass Channel 47 15.13 1.24 0.85 0.228 0.22
Goldberg. 1993. Dayton Avenue Swale Biofiltration Study. Seattle Engineering Department. Seattle, WA.
Winer, R. 2000. National Pollutant Removal Performance Database for Stormwater Treatment Practices, 2nd Edition. Center for Watershed Protection. Ellicott City, MD.
%Impervious Cover = 20; "600ft long grass channel"; # of storms = 8; Drainage area = 90acres
Grass Channel 94.67 14 0.35 0.77 0.2 0.14
Seattle Metro and Washington Department of Ecology. 1992. Biofiltration Swale Performance: Recommendations and Design Considerations. Publication No. 657. Water Pollution Control Department, Seattle
Winer, R. 2000. National Pollutant Removal Performance Database for Stormwater Treatment Practices, 2nd Edition. Center for Watershed Protection. Ellicott City, MD.
Land Use = Major roadway, residences, parks; impervious Cover = 47%; "grass channel design. 10 minute residence time for design storm; Drainage area = 15.5acres; slope = 4%; "Length 200ft. 5ft wide" Soil Type = glacial till
Grass Channel 128 30 0.26 0.31 0.1 0.06
Seattle Metro and Washington Department of Ecology. 1992. Biofiltration Swale Performance: Recommendations and Design Considerations. Publication No. 657. Water Pollution Control Department, Seattle
Winer, R. 2000. National Pollutant Removal Performance Database for Stormwater Treatment Practices, 2nd Edition. Center for Watershed Protection. Ellicott City, MD.
Land Use = Major roadway, residences, parks; impervious Cover = 47%; "grass channel design. 10 minute residence time for design storm; Drainage area = 15.5acres; slope = 4%; "Length 100ft. 5ft wide" Soil Type = glacial till
Vegetated Swale 157 21 0.91 0.46 2.17 1.46 0.55 0.31
Barrett, M.E. et al. Evaluation of the Performance of Permanent Runoff controls: Summary and Conclusions. Center for Research in Water Resources, University of Texas at Austin. Austin, TX: Nov 1997
Site 1; Treatment Length = 7.5 to 8.8m; slope = .73%; vegetation = buffalo grass; higher traffic than site 2; Percent efficiency calculated using event mean concentration (EMC) efficiency method.
Vegetated Swale 190 29 1.27 0.97 2.61 1.45 0.24 0.16
Barrett, M.E. et al. Evaluation of the Performance of Permanent Runoff controls: Summary and Conclusions. Center for Research in Water Resources, University of Texas at Austin. Austin, TX: Nov 1997
Site 2; Treatment Length = 7.8 to 8.1m; slope = 1.7%; vegetation = mixed; lower traffic than site 1; Percent efficiency calculated using event mean concentration (EMC) efficiency method.
6.4.8 VEGETATED SWALE**UNITS ARE IN MG/L UNLESS OTHERWISE NOTED**
TSS TN NO3 NOx TKN TP
363-0300-002 / December 30, 2006 Page 33of 36

Pennsylvania Stormwater Best Management Practices Manual Appendix A
Type Inflow Outflow Inflow Outflow Inflow Outflow Inflow Outflow Inflow Outflow Inflow Outflow Primary Source Secondary Source Comments
Vegetated Filter Strip 157 21 0.91 0.46
Barrett, M.E. et al. Evaluation of the Performance of Permanent Runoff controls: Summary and Conclusions. Center for Research in Water Resources, University of Texas at Austin. Austin, TX: Nov 1997
Site 1; Treatment Length = 7.5 to 8.8m; slope = .73%; vegetation = buffalo grass; higher traffic than site 2; Percent efficiency calculated using event mean concentration (EMC) efficiency method.
Vegetated Filter Strip 190 29 1.27 0.97
Barrett, M.E. et al. Evaluation of the Performance of Permanent Runoff controls: Summary and Conclusions. Center for Research in Water Resources, University of Texas at Austin. Austin, TX: Nov 1997
Site 2; Treatment Length = 7.8 to 8.1m; slope = 1.7%; vegetation = mixed; lower traffic than site 1; Percent efficiency calculated using event mean concentration (EMC) efficiency method.
6.4.9 VEGETATED FILTER STRIP**UNITS ARE IN MG/L UNLESS OTHERWISE NOTED**
TSS TN NO3 NOx TKN TP
Type Inflow Outflow Inflow Outflow Inflow Outflow Inflow Outflow Inflow Outflow Inflow Outflow Primary Source Secondary Source Comments
Shallow Marsh 11.85 ppm 7.85 ppm 1.14 ppm 0.99 ppm 0.2 ppm 0.15 ppm 0.085ppm 0.045ppm
Blackburn, R., P.L. Pimentel and G.E. French. 1986. Treament of Stormwater Runoff Using Aquatic Plants. The Use of Wetlands for Controlling Stormwater Pollution. Strecker, E.W. J.M. Kersnar and E.E. Dris coll (Eds.). Woodward-Clyde Consultants. Portland, Oregon. Prepared for the USEPA, Region V, Water Division, Watershed Management Unit EPA/600
Winer, R. 2000. National Pollutant Removal Performance Database for Stormwater Treatment Practices, 2nd Edition. Center for Watershed Protection. Ellicott City, MD.
Land use = Golf Course; Size of Wetland = 296acres; # of storms = 72; Treatment volume = 1in; Drainage area = 2340acres
Shallow Marsh 7.55 1.801 0.756 1.206 0.085 0.016 0.98 0.04
Carr, D. and B. Rushton. 1995. Integrating a Herbaceous Wetland into Stormwater Management. Stormwater Research Program. Southwest Florida Water Management District. Brooksville FL
Winer, R. 2000. National Pollutant Removal Performance Database for Stormwater Treatment Practices, 2nd Edition. Center for Watershed Protection. Ellicott City, MD.
# of storms = 81; Drainage area = 15.3; STP size = 3acres
Shallow Marsh 14 12 0.097 0.071
Koon, J. 1995. Evaluation of Water Quality Ponds and Swales in the Issaquah/East Lake Sammamish Basins. King County Surface Water Management and Washington Department of Ecology. Seattle, WA.
Winer, R. 2000. National Pollutant Removal Performance Database for Stormwater Treatment Practices, 2nd Edition. Center for Watershed Protection. Ellicott City, MD.
Two cell wetland; first cell 2ft deep pool with emergent wetlands; second cell is free." # of storms = 5; Design Basis = 2 & 25 year quantity control only; Drainage area = 7.7acres; "Inflow and Outflow values are presented as mean concentrations "
6.6.1 CONSTRUCTED WETLAND**UNITS ARE MG/L UNLESS OTHERWISE NOTED**
TSS TN NO3 NOx TKN TP
363-0300-002 / December 30, 2006 Page 34of 36

Pennsylvania Stormwater Best Management Practices Manual Appendix A
Type Inflow Outflow Inflow Outflow Inflow Outflow Inflow Outflow Inflow Outflow Inflow Outflow Primary Source Secondary Source Comments
Wet Extended Detention Pond
177 39 3.352 1.459 0.761 0.214
Borden, R.C., J.L. Dorn, J.B. Stillman and S.K. Liehr. 1996. Draft Report. Evaluation of Ponds and Wetlands For Protection of Public Water Supplies. Water Resources Research Institute of the Univeristy of North Carolina. Department of Civil Engineering. North Carolina State University.
Winer, R. 2000. National Pollutant Removal Performance Database for Stormwater Treatment Practices, 2nd Edition. Center for Watershed Protection. Ellicott City, MD.
Land Use = Dairy Farms, woodland; Impervious Cover = 16
Wet Extended Detention Pond
71 12 1.713 0.769 0.416 0.062 0.232 0.112
Lower Colorado River Authority. 1997. Innovative NPS Pollution Control Program for Lake Travis in Central Texas. LCRA.
Winer, R. 2000. National Pollutant Removal Performance Database for Stormwater Treatment Practices, 2nd Edition. Center for Watershed Protection. Ellicott City MD
Land Use = parking lot/commercial
Wet Extended Detention Pond
45 14 1.27 0.91 0.096 0.032 0.651 0.164
Rushton, B., C. Miller and H. Hull. 1995. The Effect of Residence Time on the Efficiency of a Wet Detention Stormwater Treatment Pond. Presented at the 31st Annual Conference and Symposium in Urban Areas. November 10-12, 1995.
Winer, R. 2000. National Pollutant Removal Performance Database for Stormwater Treatment Practices, 2nd Edition. Center for Watershed Protection. Ellicott City, MD.
Impervious Cover = 30%; Residence time = 5 days
Wet Extended Detention Pond
28 11 1.35 1.16 0.24 0.09 0.4 0.176
Rushton, B., C. Miller and H. Hull. 1995. The Effect of Residence Time on the Efficiency of a Wet Detention Stormwater Treatment Pond. Presented at the 31st Annual Conference and Symposium in Urban Areas. November 10-12, 1995.
Winer, R. 2000. National Pollutant Removal Performance Database for Stormwater Treatment Practices, 2nd Edition. Center for Watershed Protection. Ellicott City, MD.
Impervious Cover = 30%; Residence Time = 2 days
Wet Extended Detention Pond
131 7 1.61 0.722 0.396 0.062 0.497 0.053
Rushton, B., C. Miller and H. Hull. 1995. The Effect of Residence Time on the Efficiency of a Wet Detention Stormwater Treatment Pond. Presented at the 31st Annual Conference and Symposium in Urban Areas. November 10-12, 1995.
Winer, R. 2000. National Pollutant Removal Performance Database for Stormwater Treatment Practices, 2nd Edition. Center for Watershed Protection. Ellicott City, MD.
Impervious Cover = 30%; Land Use = rooftops, parking lots, vehicle storage; Residence Time = 14days
Wet Pond 20.6 6.5 0.93 0.65 0.18 0.02 0.136 0.035
Cullum, M. 1984. Volume II Evaluation of the Water Management System at a Single Family Residential Site: Water Quality Analysis for Selected Storm Events at Timbercreek Subdivision in Boca Raton, FL. South Florida Water Management
Winer, R. 2000. National Pollutant Removal Performance Database for Stormwater Treatment Practices, 2nd Edition. Center for Watershed Protection. Ellicott City, MD.
Land Use = single family residential; Soil type = group A; Treatment Vol = 3.11in/acre
6.6.2 WET POND / RETENTION BASIN**UNITS ARE MG/L UNLESS OTHERWISE NOTED**
TSS TN NO3 NOx TKN TP
363-0300-002 / December 30, 2006 Page 35of 36

Pennsylvania Stormwater Best Management Practices Manual Appendix A
Type Inflow Outflow Inflow Outflow Inflow Outflow Inflow Outflow Inflow Outflow Inflow Outflow Primary Source Secondary Source Comments
Wet Pond 7 15 1.2 1.27 0.272 0.155
Dorman, M.E., J. Hartigan, R.F. Steg, and T. Quasebarth. 1989. Retention, Detention and Overland Flow for Pollutant Removal from Highway Stormwater Runoff. Vol. 1. Research Report. Federal Highway Administration.
Winer, R. 2000. National Pollutant Removal Performance Database for Stormwater Treatment Practices, 2nd Edition. Center for Watershed Protection. Ellicott City, MD.
Land Use = Highway
Wet Pond 52 23 2.62 1.92 0.729 0.224 1.89 1.7 0.3 0.4
Dorman, M.E., J. Hartigan, R.F. Steg, and T. Quasebarth. 1989. Retention, Detention and Overland Flow for Pollutant Removal from Highway Stormwater Runoff. Vol. 1. Research Report. Federal Highway Administration.
Winer, R. 2000. National Pollutant Removal Performance Database for Stormwater Treatment Practices, 2nd Edition. Center for Watershed Protection. Ellicott City, MD.
Land Use = Highway
Wet Pond 45 19 1.64 1.39 0.31 0.31 0.17 0.12
Gain, S.W. The effects of Flow-Path Modifications on Urban Water-Quality Constitiuent Retention in Urban Stormwater Detention Pond and Wetland System, Orlando, Florida. Florida Departemtn of Transportation, Orlando, FL.
Winer, R. 2000. National Pollutant Removal Performance Database for Stormwater Treatment Practices, 2nd Edition. Center for Watershed Protection. Ellicott City, MD.
Inflow and Outflow are reported as a mean concentration. "Pond was modified to increse detention time and was previously studied by Martin and Smoot (1988)." Percent efficiency calculated using event mean concentration (EMC)
Wet Pond 0.79 0.63 0.12 0.08
Wu, J. 1989. Evaluation of Detention Basin Performance in the Piedmont region of North Carolina. North Carolina Water Resources Research Institute. Report No. 89-248. Raleigh, NC.
Winer, R. 2000. National Pollutant Removal Performance Database for Stormwater Treatment Practices, 2nd Edition. Center for Watershed Protection. Ellicott City, MD.
Land use = multi-unit housing, woodland; Impervious cover = 38%; Soil type = clay; Surface area = 3.3 acres, Mean pond depth = 3.8'; Volume=12.3acre feet; "No geese present." Percent efficiency calculated using
Wet Pond 0.86 0.59 0.14 0.08
Wu, J. 1989. Evaluation of Detention Basin Performance in the Piedmont region of North Carolina. North Carolina Water Resources Research Institute. Report No. 89-248. Raleigh, NC.
Winer, R. 2000. National Pollutant Removal Performance Database for Stormwater Treatment Practices, 2nd Edition. Center for Watershed Protection. Ellicott City, MD.
Land use = mixed residential; Impervious cover = 46%; Residential = 100%; Pond = 4.9 acres; Mean pond depth = 8'; Volume = 38.8 acre feet; "Geese population present increase N and P values." Percent efficiency calculated using mass efficiency method
6.6.2 WET POND / RETENTION BASIN (cont.)**UNITS ARE MG/L UNLESS OTHERWISE NOTED**
TSS TN NO3 NOx TKN TP
363-0300-002 / December 30, 2006 Page 36of 36
Top Related