


Languages
Pages
Legal

SHABBIR AHMADABID A. BURKI
Banking Deregulation and Allocative Efficiency in
Pakistan
LUMS ECONOMICS WORKING PAPER NO.14-11
LUMS Economics Department is not only among the top economics departments in the country but is also well respected internationally. The department prides itself on the diversity of interests and fields of its faculty. The teaching and research of its faculty members cover theory, econometric methods, applied data analysis, development, finance, industrial organization to behavioral economics and game theory. Around 40 MS Economics students enter our programs each year while the Department has around 900 undergraduates majoring economics, and economics and politics. Collaboration with other departments allows LUMS undergraduate students to undertake interdisciplinary studies. The MS Economics program at LUMS has been designed to set a new standard in graduate level economics education in the country, and to meet the growing need for well-trained economists in both the public and private sectors. The program provides rigorous analysis and strong grounding in economic theory, econometrics and applications in novel applied fields with the option of Master’s thesis. The Department also serves as an intellectual resource base in the region and plays an important role in the making of public policy. Its faculty is actively involved in research and publications, and are active in international, national, and regional professional societies. Faculty members also serve in positions with national and state governments, and international institutions.
FACULTY
Abid A. BurkiPhD, Kansas State UniversityAli CheemaPhD, University of Cambridge Antonio MarascoPhD, Radboud University Bilal KhanPhD, Northern Illinois UniversityFaisal BariPhD, McGill UniversityHadia MajidPhD, Ohio State UniversityHusnain Fateh AhmadPhD, University of IowaImtiaz ul HaqPhD, University of ManchesterKashif Z. MalikPhD, Florida State UniversityKhalid MirPhD, University of EssexM. Farooq NaseerPhD, Yale UniversityMushtaq A. KhanPhD, Kansas State UniversityRashid MemonPhD, New School UniversitySyed Ali HasanainPhD, George Mason UniversityS.M. Turab HussainPhD, University of Essex
Syed M. HasanPhD, Ohio State UniversitySyed Muhammad HussainPhD, University of RochesterSyed Zahid AliPhD, McMaster UniversityKate Vyborny DPhil, University of OxfordAhmed M. KhalidPhD, Johns Hopkins UniversityKarin Astrid SiegmannPhD, University of BonnM. Usman KhanMPhil, University of CambridgeAnum HasanMSc, LUMSFarah Shahid HassanMSc, LUMSLyyla KhalidMSc, University College LondonNadia MukhtarMSc, LUMSNazish AfrazMSc, London School of EconomicsRabia RasheedMSc, LUMSSyed Amin HussainMSc, LUMSUsman ElahiMSc, London School of Economics
LUMS DEPARTMENT OF ECONOMICS
LUMS ECONOMICS WORKING PAPER NO.14-11
SHABBIR AHMADCentre for Social Responsibility in Mining, Sustainable Minerals InstituteUniversity of QueenslandBrisbane, [email protected]: +61733564088
ABID A. BURKIDepartment of EconomicsMushtaq Ahmad Gurmani School of Humanities & Social Sciences (MGSHSS)Lahore University of Management SciencesLahore, [email protected]
October 2014
DEPARTMENT OF ECONOMICSLAHORE UNIVERSITY OF MANAGEMENT SCIENCESOpposite Sector U, DHA, Lahore, Cantt. 54792Lahore. Pakistan.http://lums.edu.pk/mgshss/economics/
Banking Deregulation and Allocative Efficiency in Pakistan
LUMS ECONOMICS WORKING PAPER SERIES
Editor:
ABID A. BURKI
About the Authors:
Shabbir Ahmad
Shabbir Ahmad is currently working as a Postdoctoral Research Fellow at the Centre for Social Responsibility in Mining, Sustainable Minerals Institute, University of Queensland, Brisbane, Australia. He is also an Assistant Professor of Economics at the International Institute of Islamic Economics, International Islamic University, Islamabad. He received his PhD degree in Econometrics from the University of Queensland and a PhD in Economics from the Quaid-i-Azam University. His research interests lie in efficiency and productivity analysis, environment and sustainability, financial regulation and governance. Currently, he is developing regional economic impact assessment models for the mining sector development outcomes including input-output analysis and econometric analysis to estimate local and regional economic multipliers of mining sector development activities in the developing world.
Abid A. Burki
Abid Burki is a Professor of Economics at LUMS. Previously, he was also Director of Centre for Management and Economic Research of LUMS for 8 years. Prior to his appointment at LUMS, he was on the economics faculty of Quaid-i-Azam University from 1985–2002, most recently as Professor and Head of the Economics Department from 2000–2002. He has also taught at Kansas State University. His research interests lie in the areas of development economics, applied microeconomics and production economics with focus on frontier efficiency and productivity. Dr. Burki holds a PhD in Economics from Kansas State University and a Masters in Economics from University of Manitoba. He has authored or co-authored more than 70 articles, book chapters and professional reports. His academic research has appeared in World Development, Energy Economics, Applied Economics, Economics Bulletin, Journal of Economics and Business, Journal of Development Effectiveness, Pakistan Development Review and other journals. He has supervised three PhD, and around 50 MPhil and Master’s theses. In recognition of his services, he was conferred the President of Pakistan’s academic distinction award Izaz-i-Fazeelat.
1
1. INTRODUCTION1
Since 1990, many of the world’s developing countries have liberalized their financial institutions by introducing various deregulation and pro-competition policies. A large number of these studies have investigated the effects of financial reforms on technical efficiency of banks in developed and developing countries, by using parametric or non-parametric frontier models.2 However, an important policy question for regulators and other stakeholders in developing countries is to find out whether deregulation policies have indeed been successful in improving the performance of banks, and if yes, then which category of banks (i.e., state-owned, private and foreign banks) have been more successful than others. Many other developing countries are still in the process of evaluating the merits and demerits of deregulation policies in their financial markets. Thus, the impact of banking deregulation on allocative efficiency of banks is still an important topic that warrants further investigation.
While there are many studies on efficiency of banks in developing countries, most do not take account of the impact of deregulation on allocative efficiency of banks. This paper contributes to the literature by analyzing the impact of banking deregulation on allocative efficiency of banks in Pakistan, as an interesting case study. Removal of regulatory controls in Pakistan in the 1990s has dramatically altered the structure of the banking industry in which state-owned, private and foreign banks are now functioning on a level playing field.
Allocative inefficiency is measured by absence of equality between marginal rate of technical substitution and ratio of factor prices.3 Due to regulations, banks may fail to hire banking inputs in optimal proportions given prices of inputs (Huang et al., 2011). Until 1990, most of the banks in Pakistan were under the government control, holding asset share of 93% (SBP, 2003). A notable feature of state-owned banks was their distortion of credit allocation by providing “concessional and mandatory credit to the private sector” (SBP, 2003). Moreover, the increased share of such credit raised “the shadow cost of intermediation to banks” and deprived the participating banks to earn “market rates of return” (SBP, 2003). Political rent seeking from state-owned banks in developing countries is another concern raised by some recent studies (see, Dinc, 2005, Facio, 2006). Prior to deregulation, political affiliation played more important role in lending decisions of state-owned banks than the feasibility and profitability of the projects to be financed. Khawaja and Mian (2005) show that rent-seeking firms in Pakistan borrowed more from state-owned banks, which led to increasing portfolios of nonperforming loans. Because profitability was not a key determinant of the performance of state-owned banks, over-utilization of inputs and over-staffing was quite common in state-owned banks.
The liberalization of banking regulations in Pakistan involved privatization of state-owned banks, removal of controls on entry of new
Banking Deregulation and Allocative Efficiency in Pakistan
1 We are grateful to Janet Hohnen for useful comments and editorial suggestions.2 For a survey of this literature, see, among others, Berger et al. (1993), Berger and DeYoung (1997), Berger and Humphrey (1997), DeYoung et al. (2001), Berger and Mester (1997, 2003), Berger (2007), Cook and Seiford (2009), Fethi and Pasiouras (2010), Delis et al.(2011) and Barth et al. (2013). For evidence from developing countries, see for example, Zaim (1995), Bhattacharyya et al. (1997), Gilbert and Wilson (1998), Fries and Taci (2005), William and Nguyen (2005), Patti and Hardy (2005), Burki and Niazi (2010), Burki and Ahmad (2010).3 Empirical applications of this framework include Lau and Yotopolous (1971), Atkinson and Halvorsen (1984, 1986), Burki et al. (1997) and Burki and Khan (2004), Oum and Zhang (1995).
Shabbir Ahmad and Abid A. Burki
Shabbir Ahmad & Abid A. Burki / LUMS Economics Working Paper No.14-11
2
private and foreign banks, liberalization of branch policy, elimination of concessional and mandatory credit, abolition of politically motivated loans, ending of interest rate controls, etc. (SBP, 2003). Enactment of deregulation policy was expected to strengthen competition in the banking industry, leading to marked changes in structure and operations of banks, which in turn would result in larger portfolios, new products and more varied services. In the post-deregulation period, input prices were expected to adjust slowly to free market levels. It is in this context that we study the impact of banking deregulation on allocative efficiency of banks in Pakistan.
Have banking deregulation benefitted Pakistani banks? Have financial deregulation influenced the pattern of allocative inefficiency? While earlier papers on the banking sector of Pakistan have explored the impact of reforms on technical efficiency4 little is known about the impact on allocative efficiency. Which type of banks, state-owned, private and foreign, have gained more efficiency than the others? Which banking inputs are over- or under-utilized, and which type of banks have outperformed others in terms of improvement in allocative efficiency?
In this paper, we attempt to answer these questions using an extension of the translog shadow cost- share system on data of commercial banks from Pakistan for the period 1991 to 2005.5 Our empirical results show that these banks were sub-optimally utilizing banking inputs, which confirms that allocative inefficiency was present. Most of the banks were over-utilizing labor and deposit relative to operating cost. The most striking results is that since deregulation policies were enacted, the state-owned banks have successfully decreased over-utilization of labor while private banks have also reduced over-utilization of operating
cost relative to labor.
This article is different from the existing studies on allocative efficiency in two respects. Firstly, unlike the DEA approach, our empirical specification explicitly models allocative inefficiency in the translog cost-share system of equations and introduces three bank ownership dummy variables, which distinguish resource allocation of all inputs across state-owned, private and foreign banks. Secondly, like Oum and Zhang (1996) we introduce time-dependent shadow prices and incorporate them in the cost-share equation system. In this way, our empirical specification helps us differentiate resource use efficiency in pre- and post-reform periods and identifies which segment of the banking sector is more responsive to the deregulation policies. Before we turn to these results, a brief overview of banking industry in Pakistan is presented in Section 2, which highlights significant deregulation measures introduced since 1990. Section 3 lays out the theoretical framework for the translog shadow cost function. Section 4 describes the data and presents summary statistics. Section 5 shows estimation of the empirical models and interprets the results, while conclusions are presented in Section 6. 2. AN OVERVIEW OF PAKISTANI BANKING SECTOR
In 1972, all private banks and insurance companies were nationalized by the government of Z.A. Bhutto. With the nationalization, the role of market forces in the financial sector largely remained absent until the late eighties. The period from 1972 to 1989 was marred by excessive state interventions, e.g., directed credit to priority sectors, curbs on the functioning of foreign banks, a ban on private banks, among others. By the late eighties the policy makers
4 These studies include Iimi (2003, 2004), Ataullah et al. (2004), Patti and Hardy (2005), Burki and Ahmad (2010), Burki and Niazi (2010), Jaffry et al. (2013).5 Only few studies have examined the effect of deregulation on allocative inefficiency of banks in a parametric framework. This is because decomposition of flexible cost function into allocative and technical components has proved to be a challenging estimation issue (e.g., Atkinson and Cornwell, 1994, Kumbhakar and Tsiaonas, 2005, Brissimis et al., 2010, Huang et al., 2011).

Shabbir Ahmad & Abid A. Burki / LUMS Economics Working Paper No.14-11
3
had realized that over-regulated banks create inefficiencies, which, in turn, stifle economic growth. Hence, the government embarked upon a wide-ranging reforms agenda in 1990 aimed at efficient, profitable and sound banking sector by creating a competitive environment. Since then the banking sector has gone through major structural changes such as restructuring, privatization and merger and acquisitions. This deregulation phase used policy instruments to restructure of state-owned banks through rationalization of work force and closure of loss making branches. Steps were also taken to encourage private banking sector and to privatize state-owned banks. The main areas of focus of these reforms were: a) restructuring of state-owned banks through recapitalization and partial privatization; b) easing entry barriers to new private and foreign banks; and c) banking consolidation through mergers and acquisitions (see for details, Burki and Ahmad, 2010). The first phase of liberalization, targeted the restructuring of state-owned banks. The second phase focused on privatization of state-owned banks as well as elimination of restrictions on private banks entry. Lastly, banks consolidation was initiated through mergers and acquisitions in the early 2000s. These reforms have changed the structure of Pakistan’s banking sector substantially [SBP (2003)]. The reforms were initiated in early 1990s to achieve multiple goals of strengthening monetary policy and improving the performance of financial institutions, particularly in the banking sector, which made up 90 percent of the financial sector by that time. As a result, the structure of banking sector has changed during the last 25 years. In 1990, banking sector of Pakistan comprised of 7 state-owned and 17 foreign banks. The entry of private banks was banned by that time, the 7 state-owned banks,
held more than 90% of deposits and 93% of all banking assets. With the opening of new private and foreign banks and expansion in branch networks, the share of state-owned banks has radically declined. For example, the share of private and foreign banks in the branch network went up from only 4.6% in 1993 to more than 73% in 2005. At the same time, the share of state-owned banks in branch network declined from 95% to 27%. The emergence of private and foreign banks have not only balanced the relative shares of the three type of banks, but has also helped in promoting healthy competition between them, which has resulted in expanded infrastructure and upgraded financial services. The restructuring and downsizing of state-owned banks have taken place in phases, with funding from the World Bank. Under this program, five state-owned banks were selected for restructuring and downsizing6, and “employee separation schemes” were started which resulted in releasing of 21,996 employees or 22% of the employees with “voluntary golden shake-hand”. Moreover, 26% of the bank branches of the state-owned banks were also closed down. Some state-owned banks suffered from liquidity glitches due to “concessional and mandatory credit” leading to “fragility and vulnerability of these banks”. They were provided government support through major injections to improve their balance sheets, while attempting to maintain their financial sustainability.7
3. THE TRANSLOG SHADOW COST FUNCTION
We use an empirical specification that builds on the idea of shadow prices introduced by Hopper (1965). The concept of shadow prices was formalized by Lau and Yotopolous (1971) to estimate allocative efficiency empirically using parametric models. This approach was extended by Atkinson and Halvorsen (1984, 1986) and
6 These banks included National Bank of Pakistan (NBP), United Bank Limited (UBL), Habib Bank Limited (HBL), Allied Bank of Pakistan (ABL) and Muslim Commercial Bank (MCB).7 An injection of Rs.9.7 billion was allowed to HBL to meet its minimum requirement on December 31, 1999. Similarly, Rs.7.9 billion were again injected to improve financial health of the bank.
Shabbir Ahmad & Abid A. Burki / LUMS Economics Working Paper No.14-11
4
Lovell and Sickles (1983), among others.
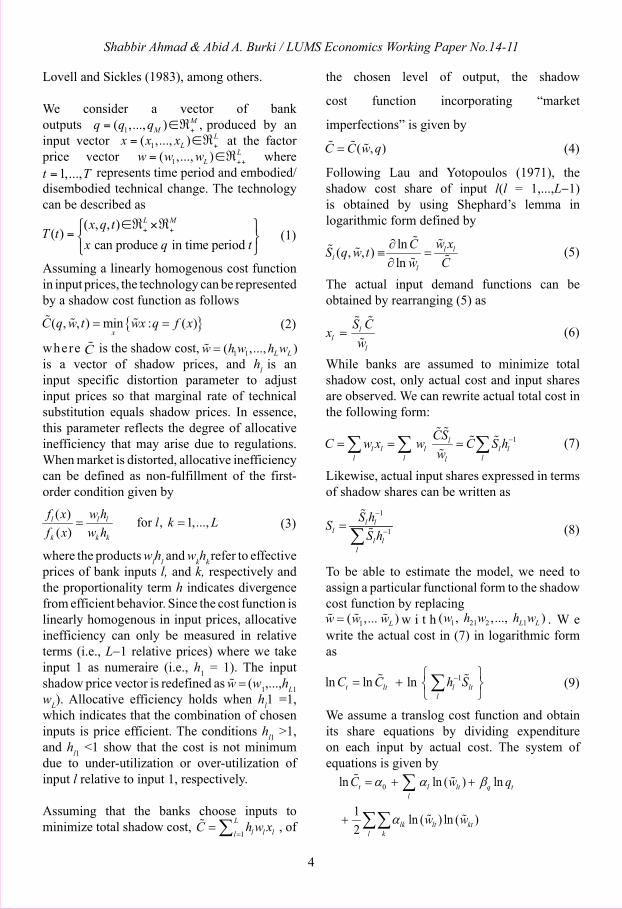
We consider a vector of bankoutputs produced by an input vector at the factor price vector where
represents time period and embodied/disembodied technical change. The technology can be described as
Assuming a linearly homogenous cost function in input prices, the technology can be represented by a shadow cost function as follows
where is the shadow cost,is a vector of shadow prices, and hl is an input specific distortion parameter to adjust input prices so that marginal rate of technical substitution equals shadow prices. In essence, this parameter reflects the degree of allocative inefficiency that may arise due to regulations. When market is distorted, allocative inefficiency can be defined as non-fulfillment of the first-order condition given by
where the products wlhl and wkhk refer to effective prices of bank inputs l, and k, respectively and the proportionality term h indicates divergence from efficient behavior. Since the cost function is linearly homogenous in input prices, allocative inefficiency can only be measured in relative terms (i.e., L-1 relative prices) where we take input 1 as numeraire (i.e., h
1 = 1). The input
shadow price vector is redefined as (w1,...,hL1
wL). Allocative efficiency holds when hl1 =1, which indicates that the combination of chosen inputs is price efficient. The conditions hl1 >1, and hl1 <1 show that the cost is not minimum due to under-utilization or over-utilization of input l relative to input 1, respectively.
Assuming that the banks choose inputs to minimize total shadow cost, , of
the chosen level of output, the shadow
cost function incorporating “market
imperfections” is given by
Following Lau and Yotopoulos (1971), the shadow cost share of input l(l = 1,...,L-1)is obtained by using Shephard’s lemma in logarithmic form defined by
The actual input demand functions can be obtained by rearranging (5) as
While banks are assumed to minimize total shadow cost, only actual cost and input shares are observed. We can rewrite actual total cost in the following form:
Likewise, actual input shares expressed in terms of shadow shares can be written as
To be able to estimate the model, we need to assign a particular functional form to the shadow cost function by replacing
w i t h . W e write the actual cost in (7) in logarithmic form as
We assume a translog cost function and obtain its share equations by dividing expenditure on each input by actual cost. The system of equations is given by
(1)
(4)
(5)
(6)
(7)
(8)
(9)
(2)
(3)
Shabbir Ahmad & Abid A. Burki / LUMS Economics Working Paper No.14-11
5
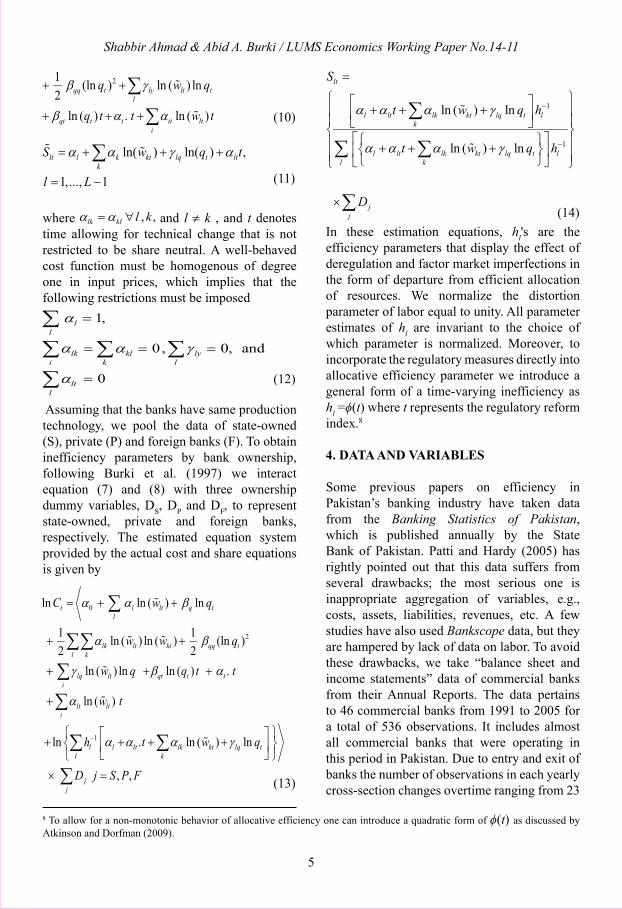
where and l ≠ k , and t denotes time allowing for technical change that is not restricted to be share neutral. A well-behaved cost function must be homogenous of degree one in input prices, which implies that the following restrictions must be imposed
Assuming that the banks have same production technology, we pool the data of state-owned (S), private (P) and foreign banks (F). To obtain inefficiency parameters by bank ownership, following Burki et al. (1997) we interact equation (7) and (8) with three ownership dummy variables, D
S, D
P and D
F, to represent
state-owned, private and foreign banks, respectively. The estimated equation system provided by the actual cost and share equations is given by
In these estimation equations, hl's are the efficiency parameters that display the effect of deregulation and factor market imperfections in the form of departure from efficient allocation of resources. We normalize the distortion parameter of labor equal to unity. All parameter estimates of hl are invariant to the choice of which parameter is normalized. Moreover, to incorporate the regulatory measures directly into allocative efficiency parameter we introduce a general form of a time-varying inefficiency as hl =ϕ(t) where t represents the regulatory reform index.8
4. DATA AND VARIABLES
Some previous papers on efficiency in Pakistan’s banking industry have taken data from the Banking Statistics of Pakistan, which is published annually by the State Bank of Pakistan. Patti and Hardy (2005) has rightly pointed out that this data suffers from several drawbacks; the most serious one is inappropriate aggregation of variables, e.g., costs, assets, liabilities, revenues, etc. A few studies have also used Bankscope data, but they are hampered by lack of data on labor. To avoid these drawbacks, we take “balance sheet and income statements” data of commercial banks from their Annual Reports. The data pertains to 46 commercial banks from 1991 to 2005 for a total of 536 observations. It includes almost all commercial banks that were operating in this period in Pakistan. Due to entry and exit of banks the number of observations in each yearly cross-section changes overtime ranging from 23
(10)
(11)
(12)
(13)
(14)
8 To allow for a non-monotonic behavior of allocative efficiency one can introduce a quadratic form of ϕ(t) as discussed by Atkinson and Dorfman (2009).
Shabbir Ahmad & Abid A. Burki / LUMS Economics Working Paper No.14-11
6
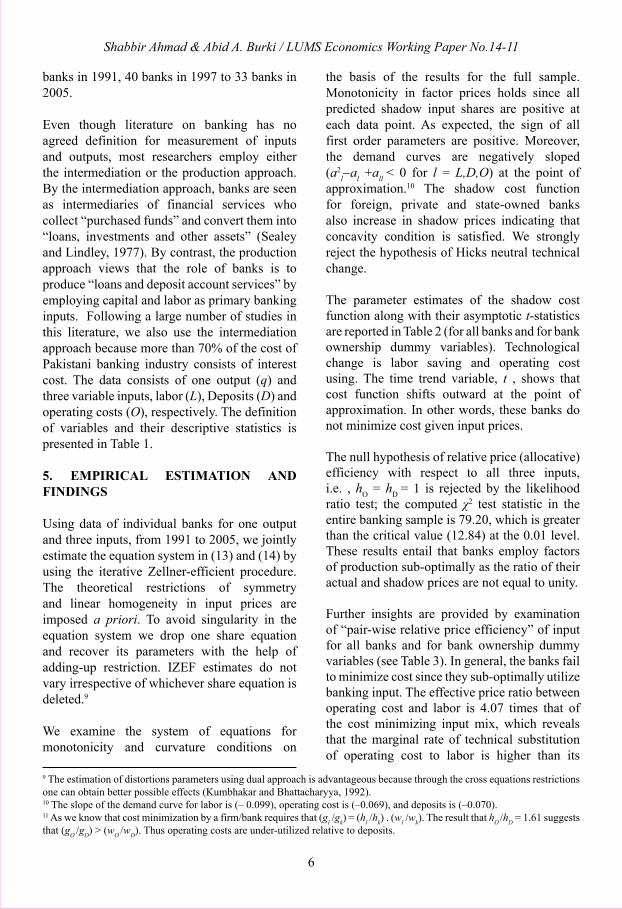
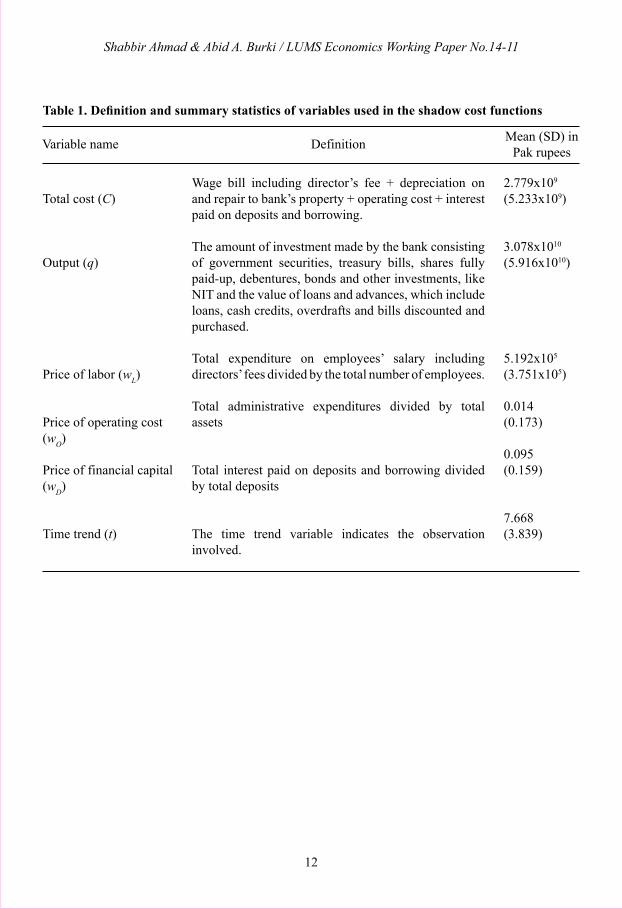
banks in 1991, 40 banks in 1997 to 33 banks in 2005. Even though literature on banking has no agreed definition for measurement of inputs and outputs, most researchers employ either the intermediation or the production approach. By the intermediation approach, banks are seen as intermediaries of financial services who collect “purchased funds” and convert them into “loans, investments and other assets” (Sealey and Lindley, 1977). By contrast, the production approach views that the role of banks is to produce “loans and deposit account services” by employing capital and labor as primary banking inputs. Following a large number of studies in this literature, we also use the intermediation approach because more than 70% of the cost of Pakistani banking industry consists of interest cost. The data consists of one output (q) and three variable inputs, labor (L), Deposits (D) and operating costs (O), respectively. The definition of variables and their descriptive statistics is presented in Table 1.
5. EMPIRICAL ESTIMATION AND FINDINGS
Using data of individual banks for one output and three inputs, from 1991 to 2005, we jointly estimate the equation system in (13) and (14) by using the iterative Zellner-efficient procedure. The theoretical restrictions of symmetry and linear homogeneity in input prices are imposed a priori. To avoid singularity in the equation system we drop one share equation and recover its parameters with the help of adding-up restriction. IZEF estimates do not vary irrespective of whichever share equation is deleted.9
We examine the system of equations for monotonicity and curvature conditions on
the basis of the results for the full sample. Monotonicity in factor prices holds since all predicted shadow input shares are positive at each data point. As expected, the sign of all first order parameters are positive. Moreover, the demand curves are negatively sloped (a2
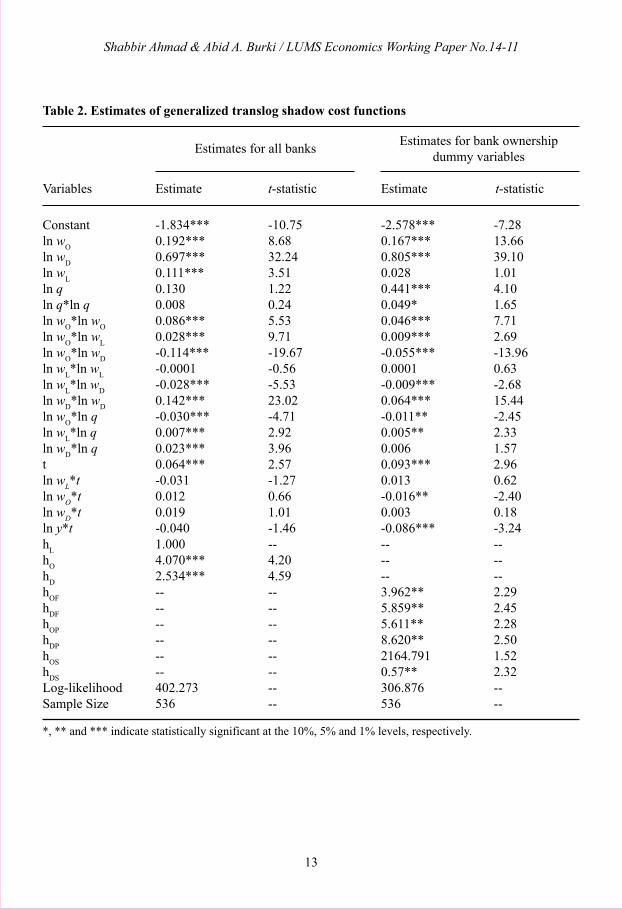
l-al +all < 0 for l = L,D,O) at the point of approximation.10 The shadow cost function for foreign, private and state-owned banks also increase in shadow prices indicating that concavity condition is satisfied. We strongly reject the hypothesis of Hicks neutral technical change. The parameter estimates of the shadow cost function along with their asymptotic t-statistics are reported in Table 2 (for all banks and for bank ownership dummy variables). Technological change is labor saving and operating cost using. The time trend variable, t , shows that cost function shifts outward at the point of approximation. In other words, these banks do not minimize cost given input prices.
The null hypothesis of relative price (allocative) efficiency with respect to all three inputs, i.e. , h
O = h
D = 1 is rejected by the likelihood
ratio test; the computed χ2 test statistic in the entire banking sample is 79.20, which is greater than the critical value (12.84) at the 0.01 level. These results entail that banks employ factors of production sub-optimally as the ratio of their actual and shadow prices are not equal to unity.
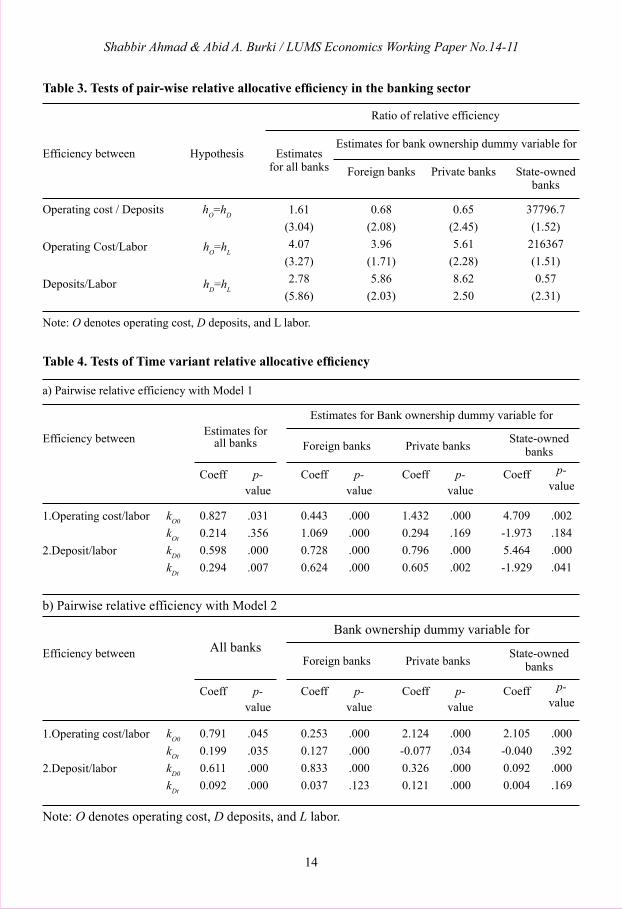
Further insights are provided by examination of “pair-wise relative price efficiency” of input for all banks and for bank ownership dummy variables (see Table 3). In general, the banks fail to minimize cost since they sub-optimally utilize banking input. The effective price ratio between operating cost and labor is 4.07 times that of the cost minimizing input mix, which reveals that the marginal rate of technical substitution of operating cost to labor is higher than its
9 The estimation of distortions parameters using dual approach is advantageous because through the cross equations restrictions one can obtain better possible effects (Kumbhakar and Bhattacharyya, 1992).10 The slope of the demand curve for labor is (– 0.099), operating cost is (–0.069), and deposits is (–0.070).11 As we know that cost minimization by a firm/bank requires that (gl /gk) = (hl /hk) . (wl /wk). The result that hO
/hD = 1.61 suggests that (gO
/gD) > (wO /wD). Thus operating costs are under-utilized relative to deposits.
Shabbir Ahmad & Abid A. Burki / LUMS Economics Working Paper No.14-11
7
ratio of input prices.11 A comparison between deposit and labor presents the same story as the effective price ratio is 2.78. Deposits are also over-utilized relative to operating cost since the effective price ratio is 1.61. It implies that labor is the most over-utilized banking input in this sample followed by deposit.
Test of pair-wise relative efficiency by ownership of banks provide further insights on utilization of banking inputs. Overall these results corroborate the findings discussed above, but there are a few exceptions. Contrary to the results presented above, foreign and private banks over-utilize operating cost relative to deposits. The effective price ratio of 0.68 and 0.65 indicate that over-utilization of operating cost is more in private than in foreign banks. Foreign banks largely succeed in optimal allocation of deposit relative to operating cost since their effective price ratio is close to unity. By contrast, state-owned banks severely over-utilize deposit relative to operating cost, but no statistical significance could be attached to this result. It appears that state-owned banks fail to diversify banking services and heavily rely on deposit creation, which in turn leads to increased cost of intermediation and swelling of non-performing loans. Another exception to the sample of all banks is that state-owned banks over-utilize deposit relative to labor, which may be attributed to poor management of banking resources. Similarly, severe over-utilization of labor relative to operating cost supports the bad management hypothesis often attributed to the meddling of government in the affairs of state-owned banks.
5.1 Time-Variant Allocative Inefficiency
Regulatory constraints stifle competition, which may lead to sub-optimal utilization of banking inputs thus increasing the banks’ cost of production above their optimal level. However, financial reforms that promote deregulation and competition are likely to induce banks
to adjust their input-mix overtime leading to improved allocative efficiency. We study the impact of financial reforms on input-specific allocative efficiency of banks by incorporating a time variable in the efficiency parameter. To illustrate, we study the temporal relationship by taking time-dependent shadow prices and incorporating them in the equation system (13 & 14). Following Kumbhakar (1991), Oum and Zhang (1996) and Atkinson and Cornwell (1994), we assume that the ratio of shadow prices to market prices of inputs is dependent on time as follows12
In hl = kl0 + kltϕ(t)where ϕ(t) is an increasing function of time. To distinguish pre- and post-reform periods, we formulate and test two alternative estimable
functions given by Model 1 and Model 2:where ϕ
1(t) is a binary (0, 1) variable that
captures the effects of deregulation on banking performance, while ϕ
2(t) captures time-trend in
pre- and post-1996 period, respectively.
We estimate two shadow cost functions each incorporating model 1 and model 2, which include: (a) intercept and slope coefficients for operating cost and deposit; and (b) intercept and slope coefficients for operating cost and deposit for state-owned, private and foreign banks. For brevity we do not report the parameter estimates of the four shadow cost functions, but only present the consolidated results.
The relation in (15) suggests that when allocative inefficiency is absent, hi =1 for all inputs. The null hypothesis that allocative efficiency is present in the sample is given by kl0 +klt =0 for all l = (D, L, O). Likewise,
12 The square term was dropped in the final analysis because it turned out to be statistically insignificant. .
(15)
Shabbir Ahmad & Abid A. Burki / LUMS Economics Working Paper No.14-11
8
the hypothesis that increased competition has no effect on allocative efficiency is given by kOt =kDt =0. Absence of allocative efficiency in our sample is confirmed since the likelihood ratio test strongly rejects the null hypothesis in all the cost functions.13 Similarly, we also reject the hypothesis that reforms have no effect on allocative inefficiency.14
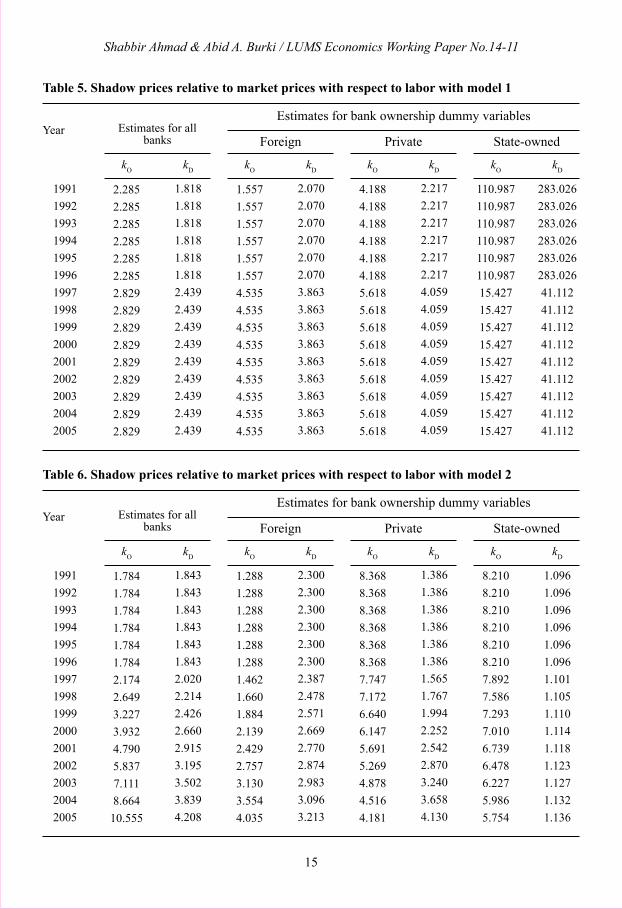
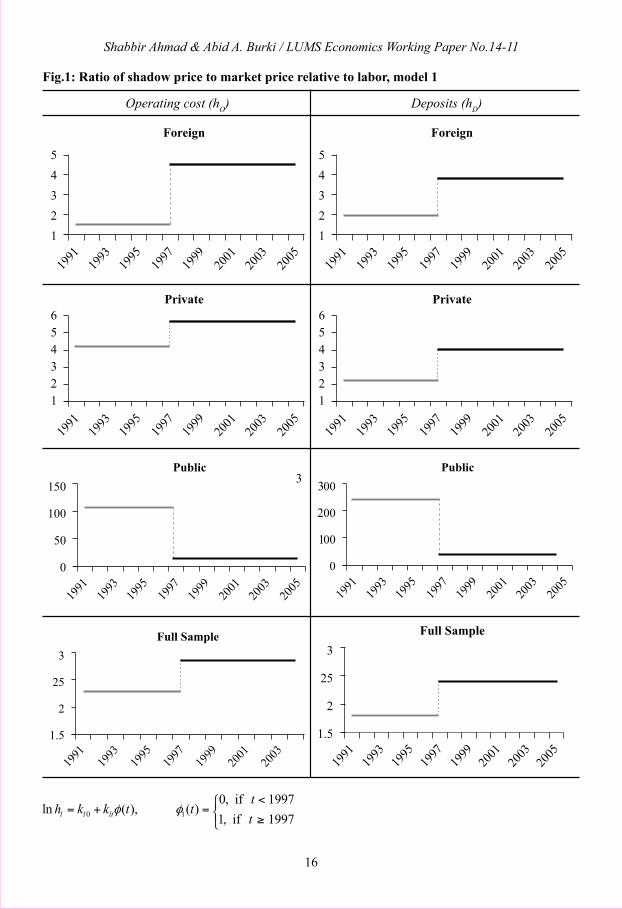
Table 4 presents the consolidated results of the four shadow cost functions where we collect all the relevant efficiency parameters, ki0's and kit's, of model 1 and model 2 whereas Tables 5 and 6 present computed time-series of the ratio of shadow price to market price of inputs for model 1 and model 2, respectively. The same information is depicted in Fig. 1 and Fig.2, respectively. Results in Table 4, panels (a) and (b), indicate that the estimated coefficients for operating cost, kO0
, are positive and statistically significant in each case meaning that in pre-1996 period, the shadow price to market price ratio of operating cost is greater than the same ratio for labor. The results suggest that in pre-1996 period use of operating cost exceeds optimal level relative to labor. Similarly, estimated coefficient kOt
remains positive in all the cost functions, except for state-owned banks. The results indicate that the intercept term kO0
(i.e., the ratio of the shadow price to the market price of operating cost) not only shifts upward in post-1996 period, but further departs from unity (or full allocative efficiency) in this period. To illustrate, the ratio of shadow price to market price of operating cost in pre-1996 period is 2.28 (e0.827= 2.28), while it reaches to 2.83 in post-reform period (e0.827 = 0.214= 2.83). It shows that the extent of over-utilization (under-utilization) of labor (operating cost) increases over time. Similarly, as revealed by the estimated coefficients kD0
and kDt, over-utilization (under-utilization) of labor (deposit) relative to deposit (labor) also increases with time.
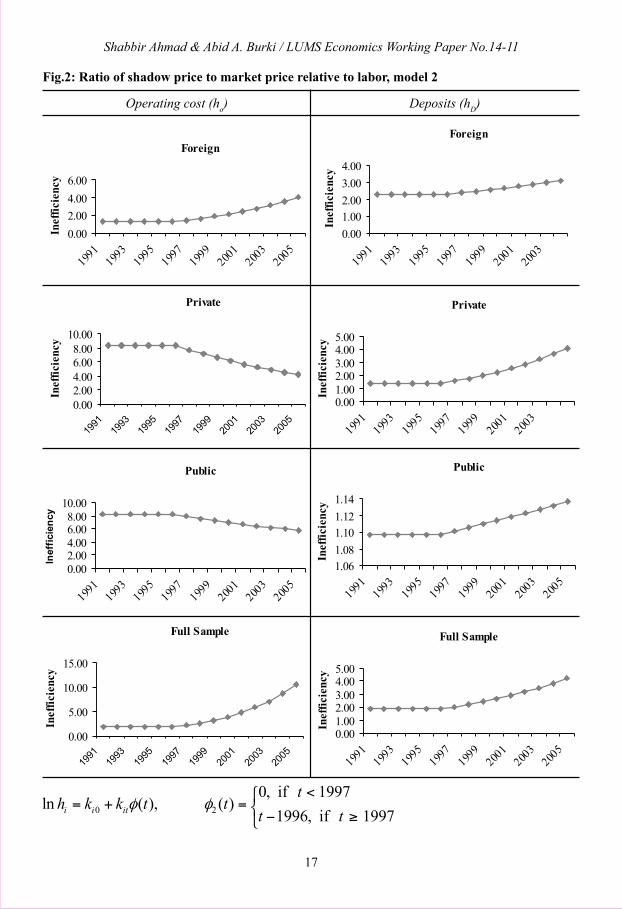
In addition, the ratio of shadow price to market price for operating cost increases from 2.28 in pre-1996 period to 2.83 in post-1996 period (see, Table 5 and Fig.1) reaching to 8.58 by 2005 (Table 6 and Fig.2). In short, the banks are unable to achieve optimal mix of banking resources with time. Similarly, shadow price ratio between deposit and labor moves from 1.81 to 2.44 (Table 6 & Fig.1), which confirms that over-utilization of labor relative to deposit has increases and reaches to 3.96 in 2005 (Table 6 & Fig.2).
Estimates grouped by bank ownership corroborate these results and show that over-utilization of labor relative to operating cost is highest in state-owned banks (e4.71 = 110.99)followed by private banks (at 4.18), and then by foreign banks (at 1.56). However, state-owned banks experienced a remarkable turnaround towards allocative efficiency in post-1996 period as indicated by 86% decrease in utilization of labor relative to operating cost and 85.5% decrease in utilization of labor relative to deposit. The time trend of allocative inefficiency shows that over-utilization of labor relative to operating cost continues to decline until 2005 (see Table 6 & Fig.2). Private Banks have also benefit from deregulation and competition policy as revealed by their improved utilization of labor relative to operating cost. This result also makes sense if seen in the light of removal of curbs on opening up of new private banks and of new bank branches.
In sum, these results show that Pakistani banks misallocate resources due to regulations and imperfect market structure in the banking industry, leading to over-utilization of labor and deposit relative to operating cost. These banks as a group also fail to reduce relative inefficiency of factor use in post-reform period. However, financial sector reforms enable state-owned and private banks to benefit from deregulation
13 For instance, in the cost function for all banks the computed x2-test statistics of 99.96 exceeds the critical value of 18.54 at the 0.005 level indicating that ki0 and kit vectors are significantly different from a zero vector.14 The null hypothesis was strongly rejected as the computed x2-test statistics is 41.32, which is well above the critical value of 12.84 at the 0.005 level.
Shabbir Ahmad & Abid A. Burki / LUMS Economics Working Paper No.14-11
9
and competition policies by reducing costs of production in post-1996 period. State-owned banks experience a significant improvement in resource allocation as seen by a sharp decline in their relative inefficiency in post-1996 period. Likewise, private banks are also successful in reducing price of operating cost relative to labor in post-reform era, which indicates that these banks are partially successful in achieving appropriate input mix due to deregulation policies.
6. CONCLUSIONS
This paper examines the effects of deregulation and competition on allocative efficiency of banks in Pakistan. This analysis has been done by using parametric models that extend the existing estimation techniques for the translog cost function. Using data of all Pakistani banks from 1991 to 2005, the study shows that when operating environment of the banking sector is marred by over regulation and imperfect market structure, it hampers the ability of participating banks to make competitive decisions. The results of this paper provide strong evidence of presence of allocative inefficiency, which is revealed by divergence in actual and effective price ratios. This evidence supports prior beliefs that deregulation and market imperfections in banking industry results in suboptimal utilization of resources which might be an important factor in determining bank competitiveness in subsequent years. We find that, due to misallocation of resources, banks fail to minimize cost of production and reduce input mix inefficiency in post-reform period. Specifically, tests of pair-wise relative inefficiency of banking inputs indicate that labor is the most over-utilized factor of production while operating costs are the most under-utilized factor. Assessment of pair-wise relative inefficiency by bank ownership generally corroborates these results. Estimates of the time varying inefficiency model further reveal that the banks in our sample generally fail to reduce allocative inefficiency in post-
reform period. However, in response to more rational banking policies in post-1996 period, state-owned banks have improved relative inefficiency by using appropriate input mix. An important finding of this paper is that, under the influence of deregulation and competition policies, state-owned banks decrease over-utilization of labor with the passage of time. Banking sector reforms also help private banks to achieve correct input-mix, by reducing price of operating cost relative to labor. The results from all the models suggest that deregulation and competition policies do not immediately bring about improvement in overall productivity and growth. The effect of policy change on the allocative efficiency of banks depends on how quickly they react to the changed policies.
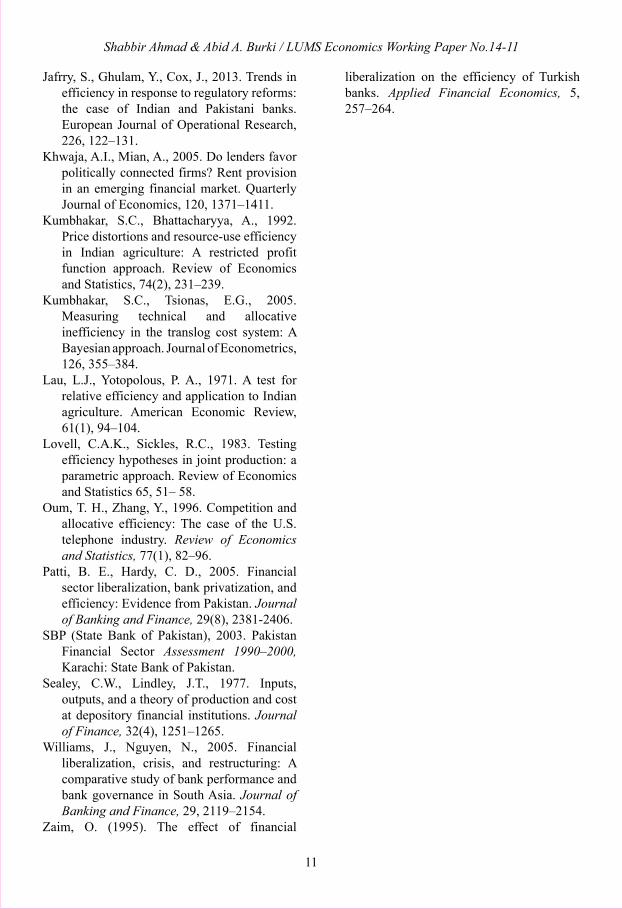
REFERENCES
Ataullah, A., Cockerill, T., Le, H., 2004. Financial liberalization and bank efficiency: A comparative analysis of India and Pakistan. Applied Economics, 36, 1915–1924.
Atkinson, S. E., Cornwell, C., 1994. Parametric estimation of technical and allocative inefficiency with panel data, International Economic Review, 35, 231–243.
Atkinson, S.E, Dorfman, H.J., 2009. Feasible estimation of firm-specific allocative inefficiency through bayesian numerical methods, Journal of Apllied Econometrics, 24, 675–697.
Atkinson, S.E., Halvorsen, R., 1984. Parametric efficiency tests, economies of scale, and input demand in US electric power generation. International Economic Review, 25, 647–662.
Atkinson, S.E., Halvorsen, R., 1986. The relative efficiency of public and private firms in a regulated environment: the case of US electric utilities. Journal of Public Economics, 29, 281– 294.
Barth, R.J., Lin, C, Ma, Y., Seade, J., Song, M. F., 2013. Do bank regulation, supervision, and monitopring enhance or impede bank efficiency?, Journal of banking and Finance,
Shabbir Ahmad & Abid A. Burki / LUMS Economics Working Paper No.14-11
10
37, 2879–2892.Berger A. N., Hunter, W. C., Timme, S.G., 1993.
The Efficiency of financial institutions: A review and preview of researches, past, present and future. Journal of Banking and Finance, 220–249.
Berger, A. N., Humphrey, D.B., 1997. Efficiency of financial institutions: International survey and directions for future research. European Journal of Operational Research, 98, 175–212.
Berger, A.N., DeYoung, R., 1997. Problem loans and cost efficiency in commercial banks. Journal of Banking and Finance, 21, 849–870.
Berger, A.N., Mester, L.J., 1997. Inside the black box: What explains differences in the efficiencies of financial institutions? Journal of Banking and Finance, 21(7), 895–47.
Berger, A.N., Mester, L.J., 2003. Explaining the dramatic change in performance of US banks: Technological change, deregulation, and dynamic changes in competition. Journal of Financial Intermediation, 12, 57–95.
Bhattacharyya, A., Lovell, C. A. K., Sahay, P., 1997. The impact of liberalization on the productive efficiency of Indian commercial banks, European Journal of Operational Economics, 98, 332–345.
Brissmis, S. N., Delis, M. D., Tsionas, E. G., 2010. Technical and allocative efficiency in European banking. European Journal of Operational Research, 204(1), 153–163.
Burki, A. A., Ahmad, S., 2010. Bank governance changes in Pakistan: Is there performance effect? Journal of Economics and Business, 61, 162–171.
Burki, A. A., Niazi, G. S. K., 2010. Impact of financial reforms on efficiency of state-owned, private and foreign banks in Pakistan, Applied Economics, 42(24), 3147-3160.
Burki, A.A., Khan, M.A., Bratsberg, B., 1997. Parametric tests of allocative efficiency in the manufacturing sectors of India and Pakistan. Applied Economics 29, 11–22.
Burki, A.A., Khan, M.-H., 2004. Effects of
allocative inefficiency on resource allocation and energy substitution in Pakistan’s manufacturing, Energy Economics, 26, 371–388.
Cook, W. D., Seiford, L. M., 2009. Data envelopment analysis (DEA)-thirty years on. European Journal of Operational Research, 192(1), 1–17.
DeYoung, E. R., Huges, P. J., Moon, C-G., 2001. Efficient risk-taking and regulatory enforcement in a deregulated banking industry. Journal of Banking and Finance, 53, 255–282.
Delis, D. M., Molyneux, P., Pasiouras, P., 2011. Regulation and productivity growth in banking: evidence from transition economies. Journal of Money Credit and Banking, 43, 735–764.
Dinc, I.S., 2005. Politicians and Banks: Political Influences on Government-owned Banks in Emerging Markets. Journal of Financial Economics, 77, 453–79.
Faccio, M., 2006. Politically connected firms. American Economic Review, 96(1), 369–386.
Fethi, D. M., Pasiouras, F., 2010. Assessing bank efficiency and performance with operational research and artificial intelligence techniques: A survey, European Journal of Operational Research, 204, 189–198.
Fries, S., Taci, A., 2005. Cost efficiency of banks in transition: Evidence from 289 banks in 15 post-communist countries. Journal of Banking and Finance, 29, 55–81.
Gilbert, R.A., Wilson, P.W., 1998. Effects of deregulation on the productivity of Korean banks. Journal of Economics and Business, 50, 133–155.
Huang, T.-H., Shen, C.-H., Chen, K.-C., Tseng, S.-J., 2011. Measuring technical and allocative efficiencies for banks in the transition countries using the Fourier flexible cost function. Journal of Productivity Analysis, 35, 143–157.
Iimi, A., 2004. Banking sector reforms in Pakistan: economies of scale scope, and cost complementarities. Journal of Asian Economics, 15, 507–528.
Shabbir Ahmad & Abid A. Burki / LUMS Economics Working Paper No.14-11
11
Jafrry, S., Ghulam, Y., Cox, J., 2013. Trends in efficiency in response to regulatory reforms: the case of Indian and Pakistani banks. European Journal of Operational Research, 226, 122–131.
Khwaja, A.I., Mian, A., 2005. Do lenders favor politically connected firms? Rent provision in an emerging financial market. Quarterly Journal of Economics, 120, 1371–1411.
Kumbhakar, S.C., Bhattacharyya, A., 1992.Price distortions and resource-use efficiency in Indian agriculture: A restricted profit function approach. Review of Economics and Statistics, 74(2), 231–239.
Kumbhakar, S.C., Tsionas, E.G., 2005. Measuring technical and allocative inefficiency in the translog cost system: A Bayesian approach. Journal of Econometrics, 126, 355–384.
Lau, L.J., Yotopolous, P. A., 1971. A test for relative efficiency and application to Indian agriculture. American Economic Review, 61(1), 94–104.
Lovell, C.A.K., Sickles, R.C., 1983. Testing efficiency hypotheses in joint production: a parametric approach. Review of Economics and Statistics 65, 51– 58.
Oum, T. H., Zhang, Y., 1996. Competition and allocative efficiency: The case of the U.S. telephone industry. Review of Economics and Statistics, 77(1), 82–96.
Patti, B. E., Hardy, C. D., 2005. Financial sector liberalization, bank privatization, and efficiency: Evidence from Pakistan. Journal of Banking and Finance, 29(8), 2381-2406.
SBP (State Bank of Pakistan), 2003. Pakistan Financial Sector Assessment 1990–2000, Karachi: State Bank of Pakistan.
Sealey, C.W., Lindley, J.T., 1977. Inputs, outputs, and a theory of production and cost at depository financial institutions. Journal of Finance, 32(4), 1251–1265.
Williams, J., Nguyen, N., 2005. Financial liberalization, crisis, and restructuring: A comparative study of bank performance and bank governance in South Asia. Journal of Banking and Finance, 29, 2119–2154.
Zaim, O. (1995). The effect of financial
liberalization on the efficiency of Turkish banks. Applied Financial Economics, 5, 257–264.
Shabbir Ahmad & Abid A. Burki / LUMS Economics Working Paper No.14-11
12
Table 1. Definition and summary statistics of variables used in the shadow cost functions
Wage bill including director’s fee + depreciation on and repair to bank’s property + operating cost + interest paid on deposits and borrowing.
The amount of investment made by the bank consisting of government securities, treasury bills, shares fully paid-up, debentures, bonds and other investments, like NIT and the value of loans and advances, which include loans, cash credits, overdrafts and bills discounted and purchased.
Total expenditure on employees’ salary including directors’ fees divided by the total number of employees.
Total administrative expenditures divided by total assets
Total interest paid on deposits and borrowing divided by total deposits
The time trend variable indicates the observation involved.
2.779x10⁹
(5.233x10⁹)
3.078x10¹⁰
(5.916x10¹⁰)
5.192x10⁵
(3.751x10⁵)
0.014(0.173)
0.095(0.159)
7.668(3.839)
Total cost (C)
Output (q)
Price of labor (wL)
Price of operating cost (wO)
Price of financial capital(wD)
Time trend (t)
Variable name DefinitionMean (SD) in
Pak rupees
Shabbir Ahmad & Abid A. Burki / LUMS Economics Working Paper No.14-11
13
-1.834***0.192***0.697***0.111***0.1300.0080.086***0.028***-0.114***-0.0001-0.028***0.142***-0.030***0.007***0.023***0.064***-0.0310.0120.019-0.0401.0004.070***2.534***------------402.273536
-10.758.6832.243.511.220.245.539.71-19.67-0.56-5.5323.02-4.712.923.962.57-1.270.661.01-1.46--4.204.59----------------
-2.578***0.167***0.805***0.0280.441***0.049*0.046***0.009***-0.055***0.0001-0.009***0.064***-0.011**0.005**0.0060.093***0.013-0.016**0.003-0.086***------3.962**5.859**5.611**8.620**2164.7910.57**306.876536
-7.2813.6639.101.014.101.657.712.69-13.960.63-2.6815.44-2.452.331.572.960.62-2.400.18-3.24------2.292.452.282.501.522.32----
Constantln w
O
ln wD
ln wL
ln qln q*ln qln w
O*ln w
O
ln wO*ln w
L
ln wO*ln w
D
ln wL*ln w
L
ln wL*ln w
D
ln wD*ln w
D
ln wO*ln q
ln wL*ln q
ln wD*ln q
tln wL*tln wO*tln wD*tln y*th
L
hO
hD
hOF
hDF
hOP
hDP
hOS
hDS
Log-likelihoodSample Size
Table 2. Estimates of generalized translog shadow cost functions
Estimates for all banksEstimates for bank ownership
dummy variables
Estimate t-statisticEstimatet-statisticVariables
*, ** and *** indicate statistically significant at the 10%, 5% and 1% levels, respectively.
Shabbir Ahmad & Abid A. Burki / LUMS Economics Working Paper No.14-11
14
Table 4. Tests of Time variant relative allocative efficiency
Estimatesfor all banks
State-owned banksPrivate banksForeign banks
Foreign banks Private banks State-ownedbanks
Hypothesis
Estimates forall banks
Efficiency between
Efficiency between
1.Operating cost/labor
2.Deposit/labor
Note: O denotes operating cost, D deposits, and L labor.
Note: O denotes operating cost, D deposits, and L labor.
kO0
kOt
kD0
kDt
0.827
0.214
0.598
0.294
.031
.356
.000
.007
Coeff p-value
0.443
1.069
0.728
0.624
.000
.000
.000
.000
Coeff p-value
1.432
0.294
0.796
0.605
.000
.169
.000
.002
Coeff p-value
4.709
-1.973
5.464
-1.929
.002
.184
.000
.041
Coeff p-value
1.Operating cost/labor
2.Deposit/labor
kO0
kOt
kD0
kDt
0.791
0.199
0.611
0.092
.045
.035
.000
.000
Coeff p-value
0.253
0.127
0.833
0.037
.000
.000
.000
.123
Coeff p-value
2.124
-0.077
0.326
0.121
.000
.034
.000
.000
Coeff p-value
2.105
-0.040
0.092
0.004
.000
.392
.000
.169
Coeff p-value
Operating cost / Deposits
Operating Cost/Labor
Deposits/Labor
hO=hD
hO=hL
hD=hL
1.61
(3.04)
4.07
(3.27)
2.78
(5.86)
0.68
(2.08)
3.96
(1.71)
5.86
(2.03)
0.65
(2.45)
5.61
(2.28)
8.62
2.50
37796.7
(1.52)
216367
(1.51)
0.57
(2.31)
Estimates for bank ownership dummy variable for
Ratio of relative efficiency
a) Pairwise relative efficiency with Model 1
b) Pairwise relative efficiency with Model 2
Estimates for Bank ownership dummy variable for
State-owned banksPrivate banksForeign banks
All banksEfficiency between
Bank ownership dummy variable for
Table 3. Tests of pair-wise relative allocative efficiency in the banking sector
Shabbir Ahmad & Abid A. Burki / LUMS Economics Working Paper No.14-11
15
Table 5. Shadow prices relative to market prices with respect to labor with model 1
Table 6. Shadow prices relative to market prices with respect to labor with model 2
Estimates for all banks
Estimates for all banks
kO
kO
kO
kO
kO
kO
kO
kO
kD
kD
kD
kD
kD
kD
kD
kD
Year
Year
2.285
2.285
2.285
2.285
2.285
2.285
2.829
2.829
2.829
2.829
2.829
2.829
2.829
2.829
2.829
1.784
1.784
1.784
1.784
1.784
1.784
2.174
2.649
3.227
3.932
4.790
5.837
7.111
8.664
10.555
1.557
1.557
1.557
1.557
1.557
1.557
4.535
4.535
4.535
4.535
4.535
4.535
4.535
4.535
4.535
1.288
1.288
1.288
1.288
1.288
1.288
1.462
1.660
1.884
2.139
2.429
2.757
3.130
3.554
4.035
4.188
4.188
4.188
4.188
4.188
4.188
5.618
5.618
5.618
5.618
5.618
5.618
5.618
5.618
5.618
8.368
8.368
8.368
8.368
8.368
8.368
7.747
7.172
6.640
6.147
5.691
5.269
4.878
4.516
4.181
110.987
110.987
110.987
110.987
110.987
110.987
15.427
15.427
15.427
15.427
15.427
15.427
15.427
15.427
15.427
8.210
8.210
8.210
8.210
8.210
8.210
7.892
7.586
7.293
7.010
6.739
6.478
6.227
5.986
5.754
283.026
283.026
283.026
283.026
283.026
283.026
41.112
41.112
41.112
41.112
41.112
41.112
41.112
41.112
41.112
1.096
1.096
1.096
1.096
1.096
1.096
1.101
1.105
1.110
1.114
1.118
1.123
1.127
1.132
1.136
1991
1992
1993
1994
1995
1996
1997
1998
1999
2000
2001
2002
2003
2004
2005
1991
1992
1993
1994
1995
1996
1997
1998
1999
2000
2001
2002
2003
2004
2005
1.818
1.818
1.818
1.818
1.818
1.818
2.439
2.439
2.439
2.439
2.439
2.439
2.439
2.439
2.439
1.843
1.843
1.843
1.843
1.843
1.843
2.020
2.214
2.426
2.660
2.915
3.195
3.502
3.839
4.208
2.070
2.070
2.070
2.070
2.070
2.070
3.863
3.863
3.863
3.863
3.863
3.863
3.863
3.863
3.863
2.300
2.300
2.300
2.300
2.300
2.300
2.387
2.478
2.571
2.669
2.770
2.874
2.983
3.096
3.213
2.217
2.217
2.217
2.217
2.217
2.217
4.059
4.059
4.059
4.059
4.059
4.059
4.059
4.059
4.059
1.386
1.386
1.386
1.386
1.386
1.386
1.565
1.767
1.994
2.252
2.542
2.870
3.240
3.658
4.130
Estimates for bank ownership dummy variables
Estimates for bank ownership dummy variables
Foreign
Foreign
Private
Private
State-owned
State-owned
Shabbir Ahmad & Abid A. Burki / LUMS Economics Working Paper No.14-11
16
Fig.1: Ratio of shadow price to market price relative to labor, model 1
Operating cost (hO) Deposits (hD)
10
Shabbir Ahmad & Abid A. Burki / LUMS Economics Working Paper No.14-11
17
Fig.2: Ratio of shadow price to market price relative to labor, model 2
Operating cost (ho) Deposits (hD)
Shabbir Ahmad & Abid A. Burki / LUMS Economics Working Paper No.14-11
18
LUMS ECONOMICS WORKING PAPER SERIES
2014No.14-11Shabbir Ahmad and Abid A. BurkiBanking Deregulation and Allocative Efficiency in Pakistan
No.14-10M. Usman Khan and Syed Turab HussainNormalizing India-Pakistan Trade Relations: India Pakistan Agricultural Trade
No.14-09Ehsan U. Choudhri and Antonio Marasco:Asymmetric Technological Change in the Melitz Model: Are Foreign Technological Improvements Harmful 2013No.13-08Kashif Zaheer Malik and Syed Zahid Ali:Intangible Capital in a Real BusinessCycle Model
No.13-07Abid A. Burki, Mushtaq A. Khan and Sobia Malik:From Chronic Disease to Food Poverty:Evidence from Pakistan
No. 13-06Syed Muhammad Hussain:Reversing the Brain Drain: Is it Beneficial?
2012No.12-05Abid A. Burki:Do Group-Based BDS Matching Grants Affect Farm Level Outcomes? Evidence from Pakistan
No. 12-04Kiran Javaid, Tareena Musaddiq and AtiyabSultan:Prying the Private School Effect: An EmpiricalAnalysis of Learning Outcomes of Public andPrivate Schools in Pakistan
No.12-03Hadia Majid:School Choice in Rural Pakistan
No.12-02Syed Zahid Ali:Inflation and Interest Rates in the Presence of a Cost Channel, Wealth Effect and Agent Heterogeneity
No.12-01Abid A. Burki and Mushtaq A. Khan:Agglomeration Economies and their Effects on Technical Inefficiency of Manufacturing Firms
These papers can be accessed at: http://lums.edu.pk/mgshss/economics/page.php/economics-working-papers-economics

Abstract
This paper studies how banking deregulation effects allocative efficiency of banks in Pakistan, where until 1990 state-owned banks dominated the scene by holding 93% of banking assets, whereas government intervention influenced prices of banking inputs. However, in early 1990s pro-competition policies were enacted, which created a level playing field for all the banks. Using an extension of the translog shadow cost-share system on data of all banks for the period 1991 to 2005, this paper shows that allocative inefficiency was present in the banking industry in the study period. Deregulation policies were found to have induced state-owned banks to decrease over-utilization of labor, thus reducing allocative inefficiency of labor input. Pro-competition policies have also persuaded private banks to use operating cost inputs closer to the optimal proportions. The paper concludes that deregulation policies do not immediately improve allocative efficiency. The outcome depends on how quickly the banks react to the changed policies. Key Words: Banking deregulation, allocative efficiency, translog cost function JEL Code: D24, G2, G21
http://lums.edu.pk/mgshss/economics/
Top Related