


Languages
Pages
Legal


Partial Discharge in MV Cables
IEEE Insulated Conductor Committee Meeting Hollywood FL, October 2017

Failures in MV Cable
2
These graphs are from a research paper currently underway at the University of Connecticut.
It examines 100 forensic investigations in mv cable failure.
Takeaways:
1) Cables follow a standard bathtub failure curve with most failures occurring before 20 yrs.
2) Most failures (75%) are not in the middle of the cable.

Internal discharge in a cable
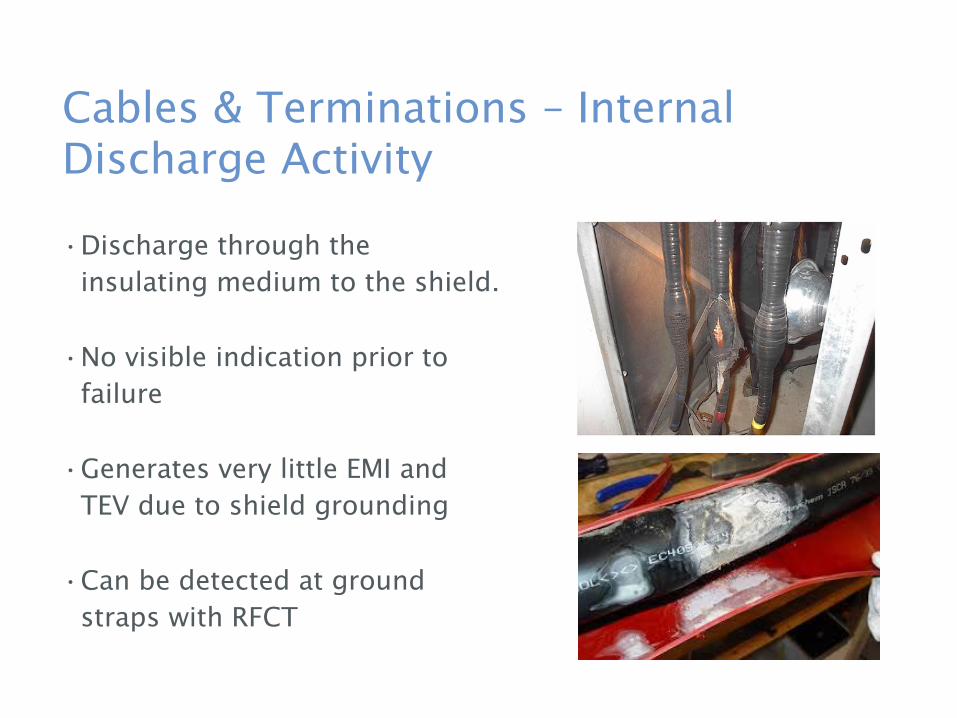
Cables & Terminations – Internal Discharge Activity
•Discharge through the insulating medium to the shield.
•No visible indication prior to failure
•Generates very little EMI and TEV due to shield grounding
•Can be detected at ground straps with RFCT

Cables & Terminations - Surface Discharge Activity
•Discharge across surface of insulation towards earth or phase to phase discharge
•Often characterised by low amplitude but very high discharge rate
•Visible signs include white powder (Nitric Oxide)

Equipotential Lines
Voltage
0 V
X kV
6X voltagedrop
Section through a homogenous insulator showing uniform electrical stress (equipotential) lines. A line indicates where the voltage potential is constant
The same insulator with a void. The lower dielectric of the void causesa concentration of the electrical field through the void high enough to
cause breakdown at working voltages

Cable Stress Control
Cable partial discharge is a classic example of local concentration of electrical stress.
Cable terminations and splices have carefully designed components to distribute the electrical stresses equally.
The stress controlling components include semiconducting layers and stress cones or tubes
When the stress relief is not adequate discharge occurs.
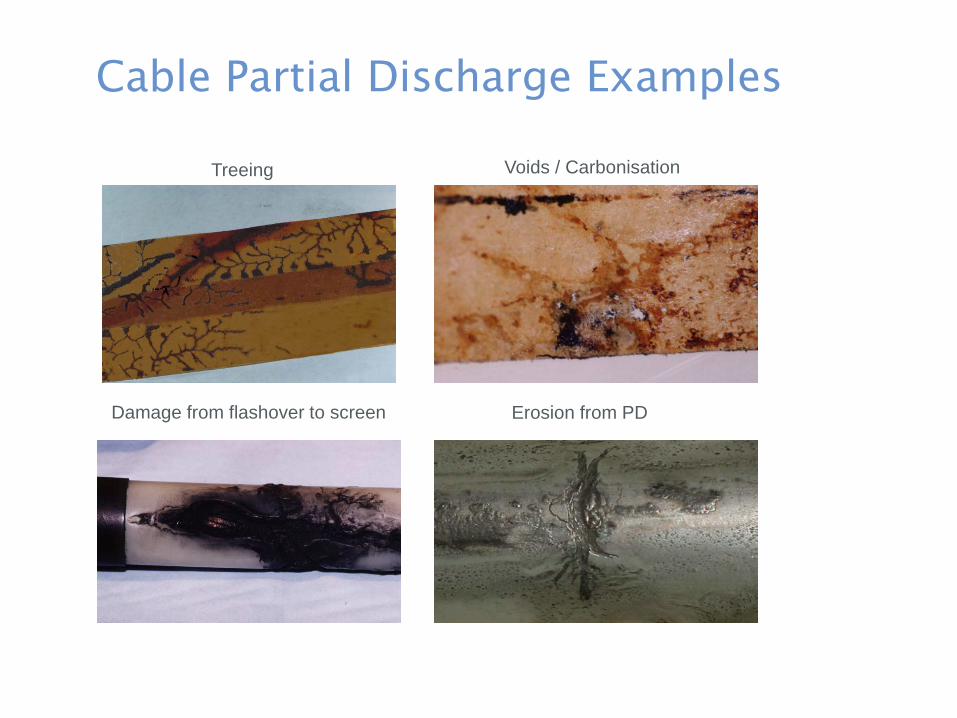
Cable Partial Discharge Examples
8
Treeing Voids / Carbonisation
Erosion from PDDamage from flashover to screen
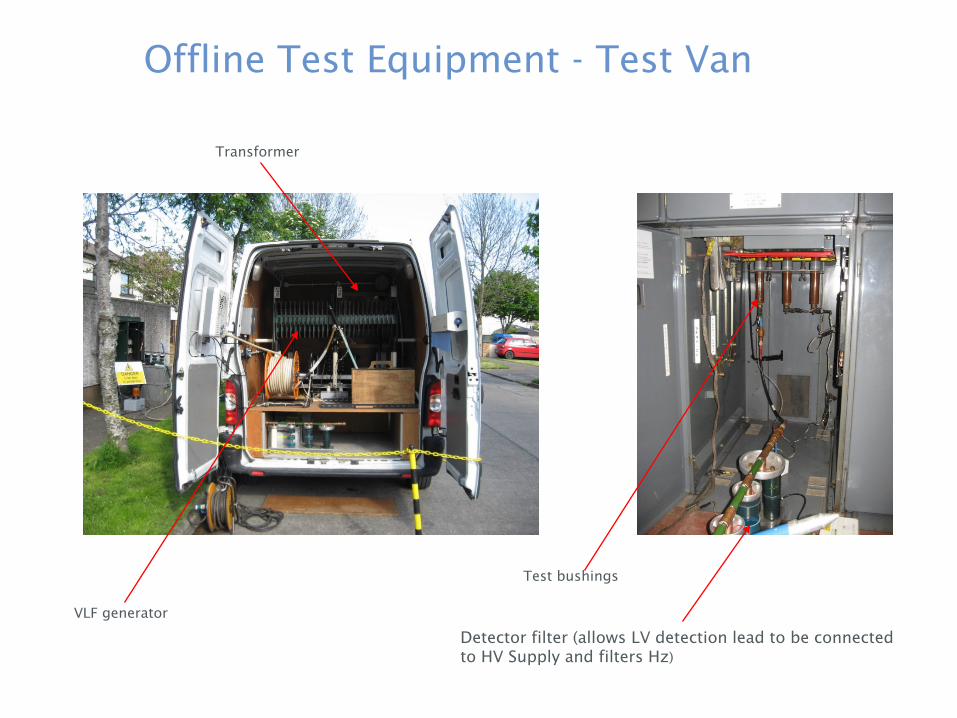
Offline Test Equipment - Test Van
9
Detector filter (allows LV detection lead to be connected to HV Supply and filters Hz)
Test bushings
VLF generator
Transformer

Online Test Equipment – Hand Carried
RFCT Installed on Ground Straps

Shielded MV Cable
Earth GroundPD causes high current pulse
to travel down shield to ground strap
Instrument measures current pulse on ground strap
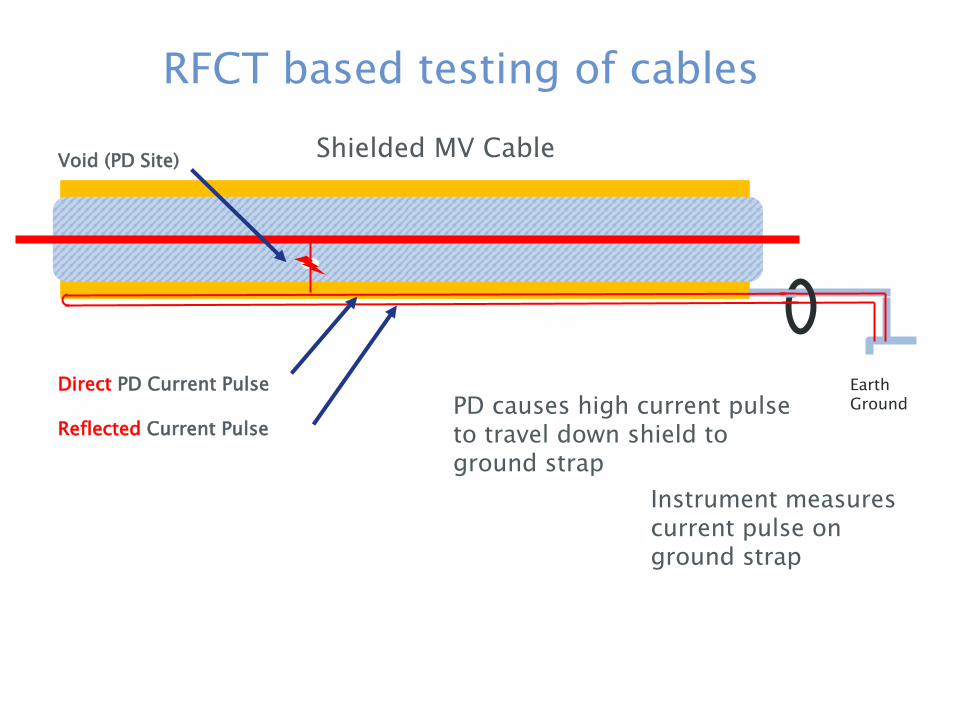
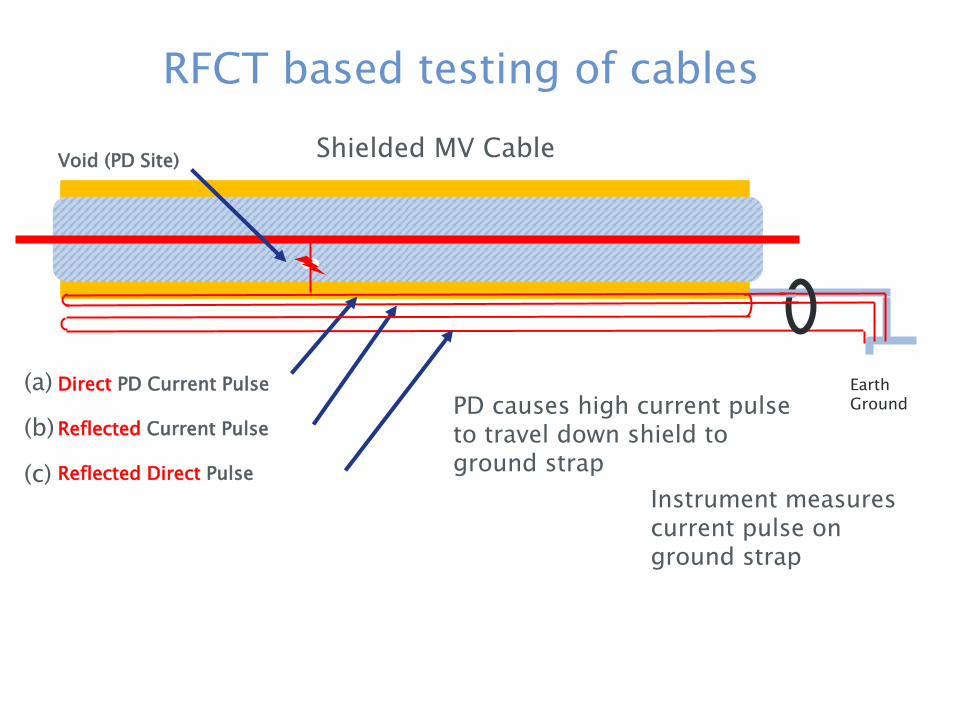
RFCT based testing of cables
Void (PD Site)
DIrect PD Current Pulse
Shielded MV Cable
Earth GroundPD causes high current pulse
to travel down shield to ground strap
Instrument measures current pulse on ground strap
RFCT based testing of cables
Void (PD Site)
Direct PD Current Pulse
Reflected Current Pulse
Shielded MV Cable
Earth Ground
Void (PD Site)
Direct PD Current Pulse
Reflected Current Pulse
Reflected Direct Pulse
PD causes high current pulse to travel down shield to ground strap
Instrument measures current pulse on ground strap
(a)
(b)
(c)
RFCT based testing of cables
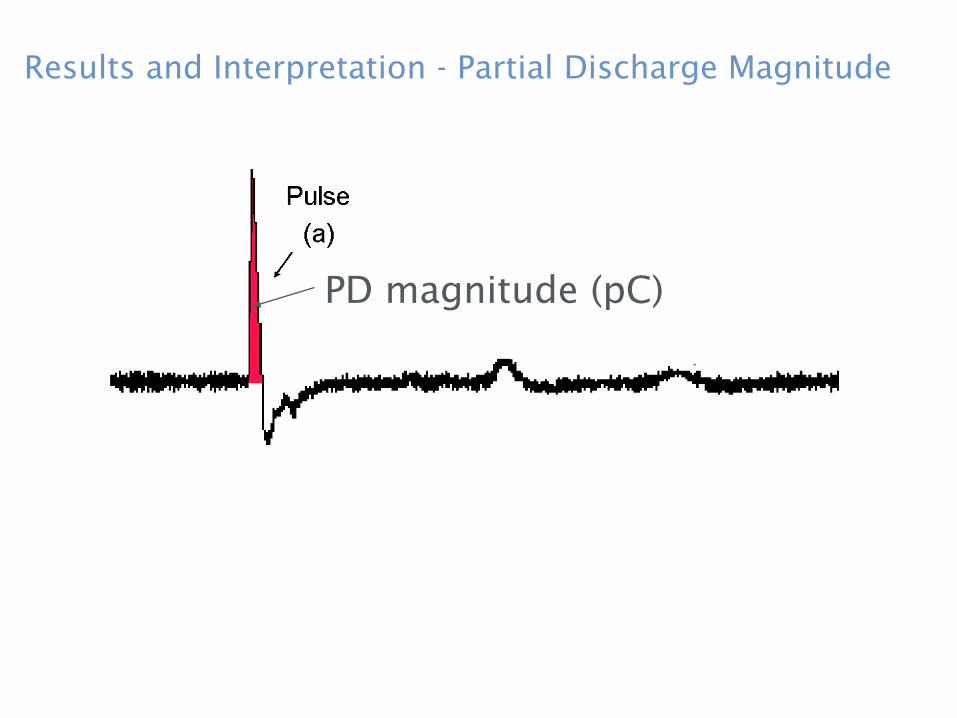
Results and Interpretation - Partial Discharge Magnitude
14
PD magnitude (pC)

-2.5 0 Time (us) 35
DirectPulse
Far EndReflection
Direct PulseReflection
Results and Interpretation – Pulse Components

-2.5 0 Time (us) 35
T0 = Time actual pulse occurs (not measurable)T1 = Time for direct pulse to travel to RFCT (not measurable)T2 = Time between direct pulse and reflected pulse arrival at RFCTT3 = Time between direct pulse and direct reflected pulse arrival at RFCT
Distance to PD = ((T3- T2) / 2) * ((2 * L)/T3)
T3
T2
Results and Interpretation – Distance to PD Site
T1
T0

Direct connected online systems
Direct connected online systems use permanently installed HV capacitors and current transformers to measure PD directly.
• Periodic or 24x7 monitoring with alarming
• Typically include remote communications
• Can include humidity and load monitoring
• Can be used for Rotating machines, Metal clad switchgear, MV/HV Cables, and Transformers
On-Line systems

Direct connected systems

PD Couplers

Shielded MV Cable
Earth Ground
Phase Reference
Void (PD Site)
Initial PD Current Pulse
PD causes high current pulse to travel down shield to ground strap
Instrument measures current pulse on ground strap
RFCT based testing of cables
Data Collection
33
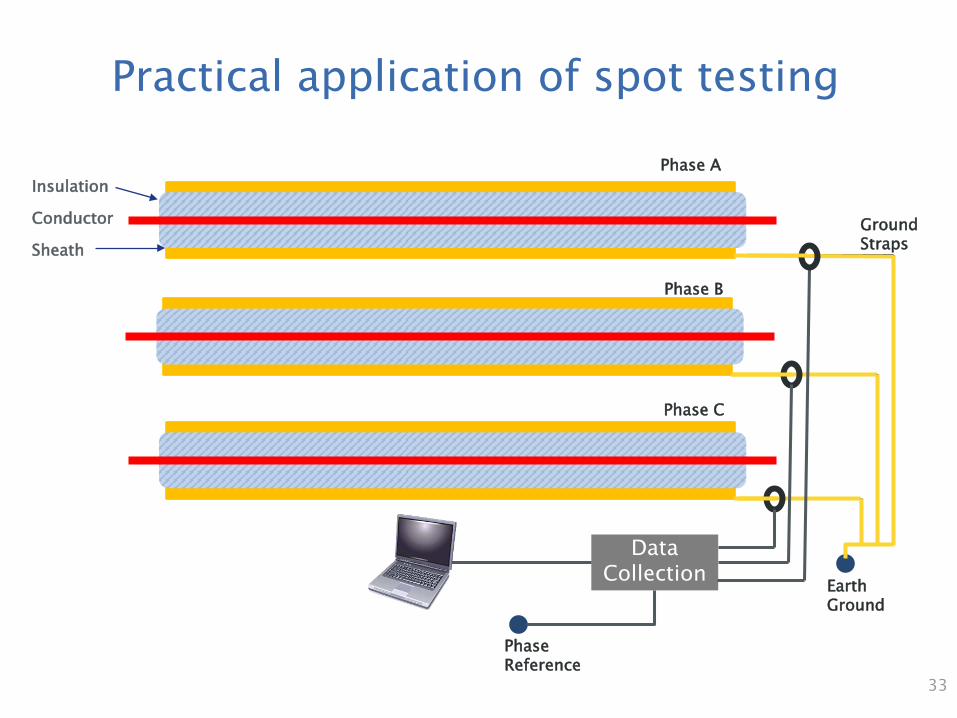
Insulation
Conductor
Sheath
Earth Ground
Ground Straps
Data Collection
Phase Reference
Phase A
Phase C
Phase B
Practical application of spot testing

34
Picking Milliamps of PD out of Kiloamps of current is not trivial. Two key pieces of information are vital
Analyzing Data – Two crucial pieces of data

35
One sign of recognizable PD Activity is clustering of points on the phase resolve plot at a distance of 180º apart
1 Cycle wide (16.66 ms)
AmplitudeIn pCAround 0
0
Analyzing Data – Phase Resolved Plots

36
A typical waveform from online Cable PD testing should have a large unipolar pulse indicating the discharge
Very fast time base (40 uS)
AmplitudeIn mAAround 0
Analyzing Data – Waveforms
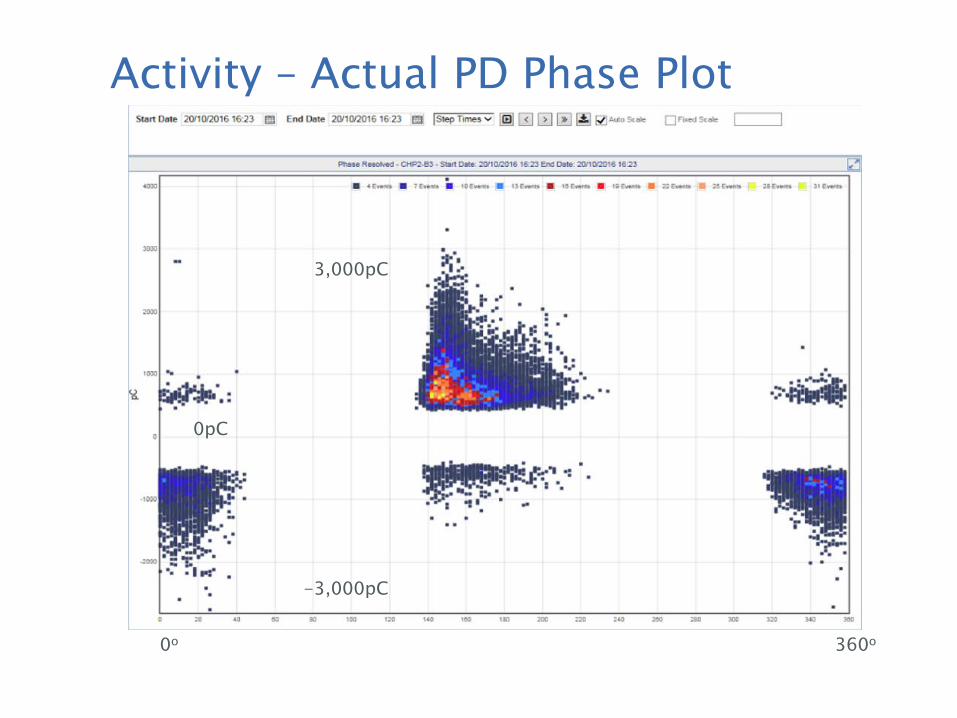
3,000pC
0pC
-3,000pC
0o 360o
Activity – Actual PD Phase Plot
38
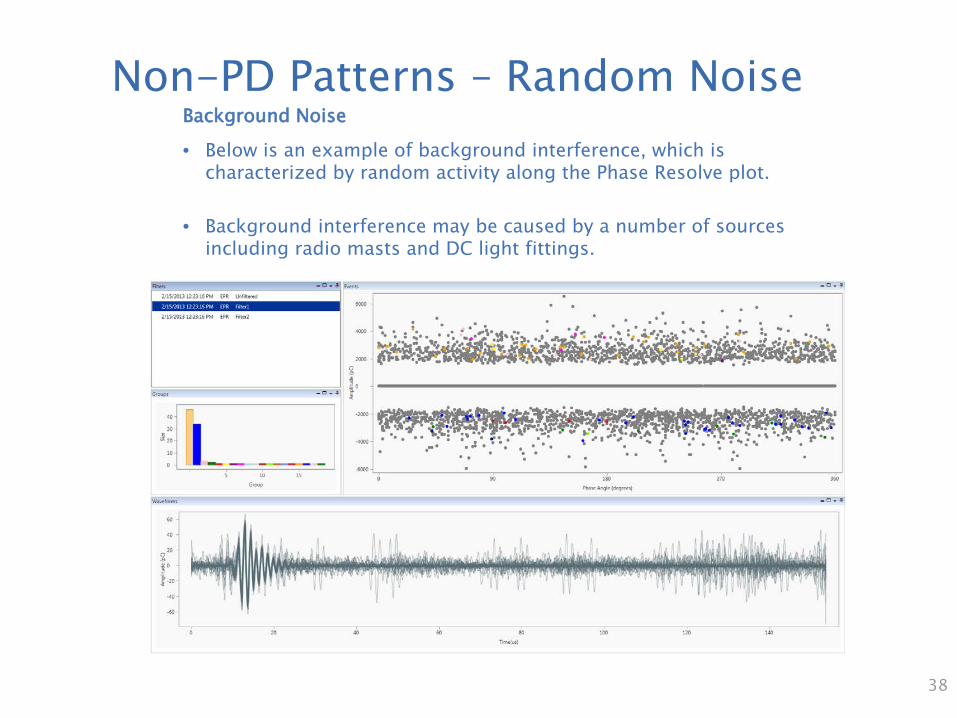
Background Noise
• Below is an example of background interference, which is characterized by random activity along the Phase Resolve plot.
• Background interference may be caused by a number of sources including radio masts and DC light fittings.
Non-PD Patterns – Random Noise

39
Machine Noise• Data captured on circuits which have rotating machines
operating on them will contain some machine noise• Machine noise is characterized by vertical lines spread across
the phase resolved plot
Non-PD Patterns – VFD Noise

40
Comments ColorCode
XLPE Cable
XLPE Accessories
PILC Cable
PILC Accessories
Discharge within “acceptable” limits. 0-250pC 0-500pC 0-2500pC 0-4000pC
Some concern, more frequent monitoring recommended. 250-500pC 500-
2500pC2500-
7000pC4000-
10000pC
Major concern, locate PD activity and repair or replace. >500pC >2500pC >7000pC >10000pC
Evaluation Scale

UK utility Electricity North West Limited (ENWL) undertook a two year evaluation of RFCT based on-line testing that condition assessment of 191 33KV cables on their network over a two year period.
Field Example #1 – ENWL (UK)
84% rated GREEN(no problems)
>2% of those failed within 2 years
7% rated Amber(no problems)
<21% of those failed within 2 years7% rated RED
(no problems)
<40% of those failed within 2 years
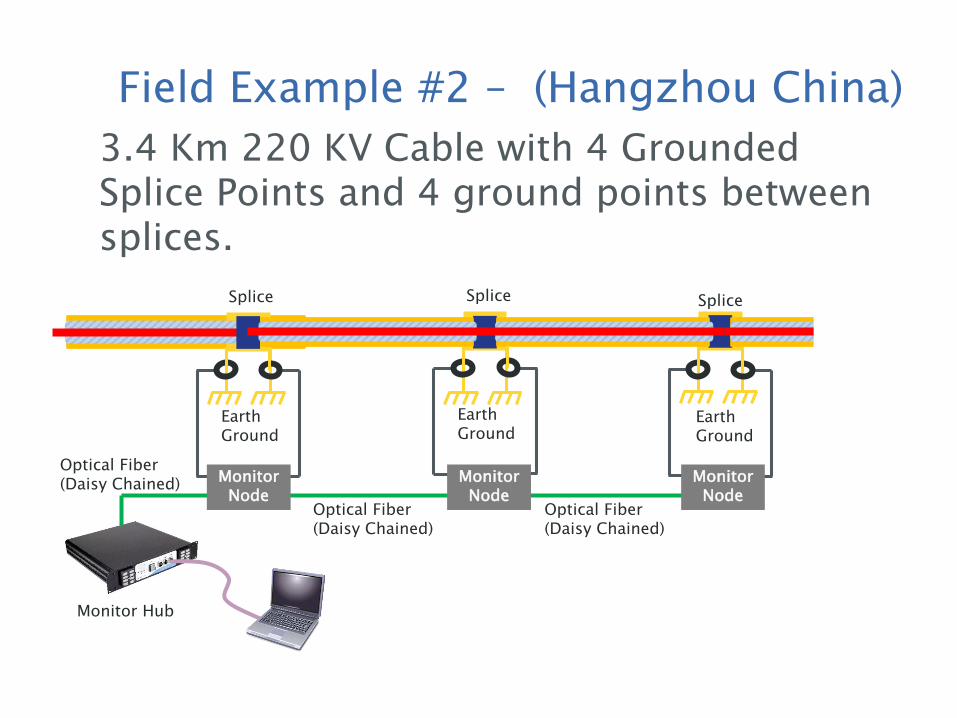
3.4 Km 220 KV Cable with 4 Grounded Splice Points and 4 ground points between splices.
Earth Ground
Earth Ground
Earth Ground
SpliceSplice Splice
Monitor Node
Monitor Node
Monitor Node
Monitor
HUB
Optical Fiber(Daisy Chained)
Optical Fiber(Daisy Chained)
Optical Fiber(Daisy Chained)
Monitor Hub
Field Example #2 – (Hangzhou China)
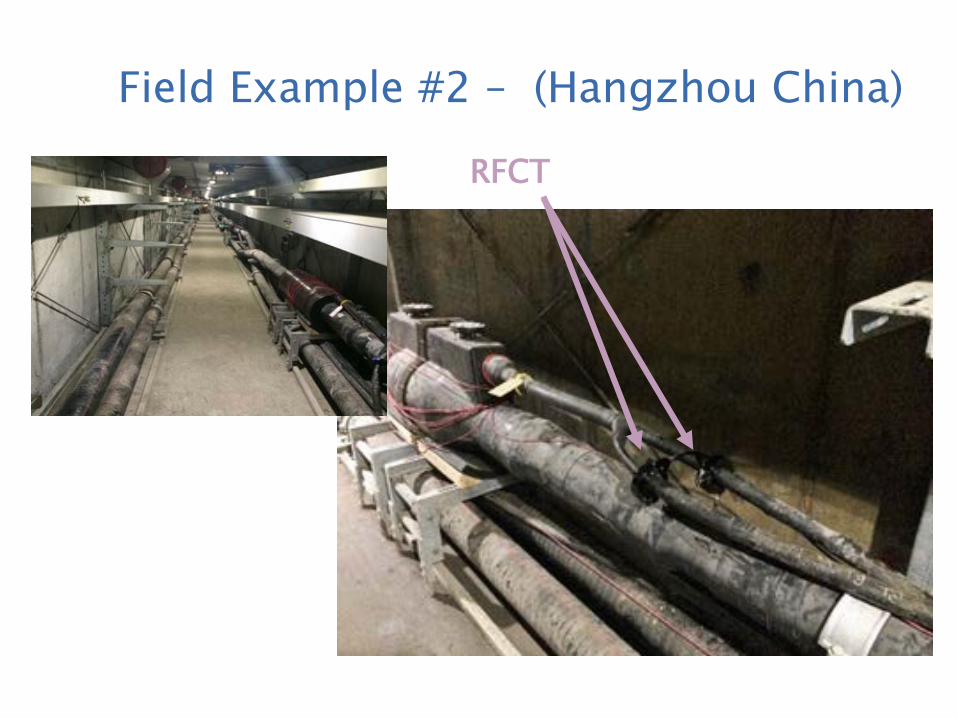
RFCT
Field Example #2 – (Hangzhou China)

Amplitude(pC)
Phase Angle (360 degrees)
PD Events(180 degrees apart)
Colors signify frequency of events
Field Example #2 – (Hangzhou China)
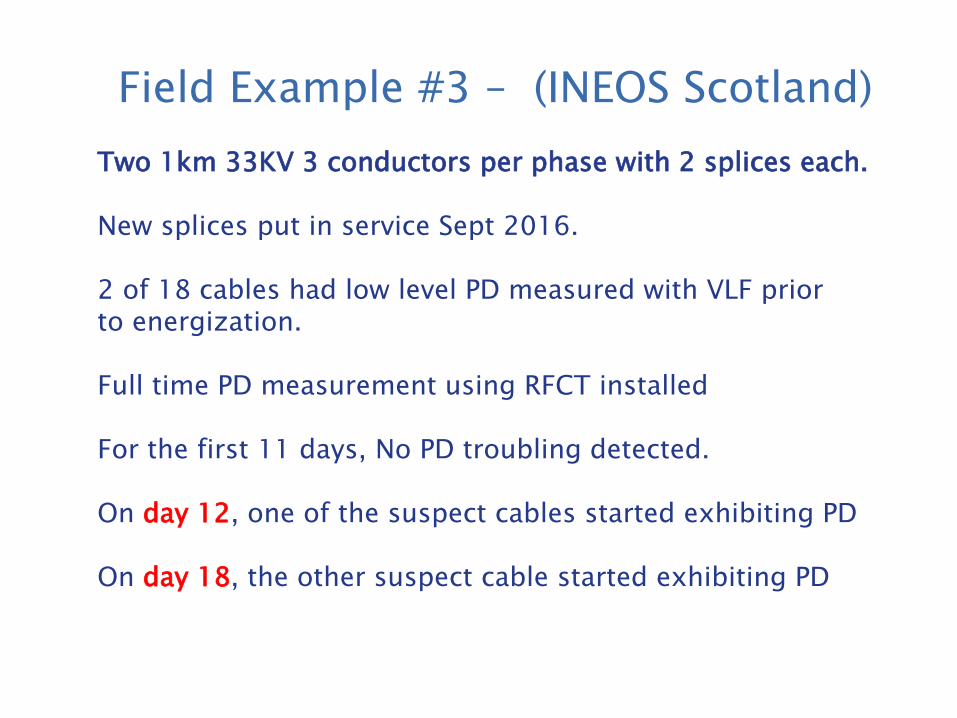
Field Example #3 – (INEOS Scotland) Two 1km 33KV 3 conductors per phase with 2 splices each.
New splices put in service Sept 2016.
2 of 18 cables had low level PD measured with VLF prior to energization.
Full time PD measurement using RFCT installed
For the first 11 days, No PD troubling detected.
On day 12, one of the suspect cables started exhibiting PD
On day 18, the other suspect cable started exhibiting PD
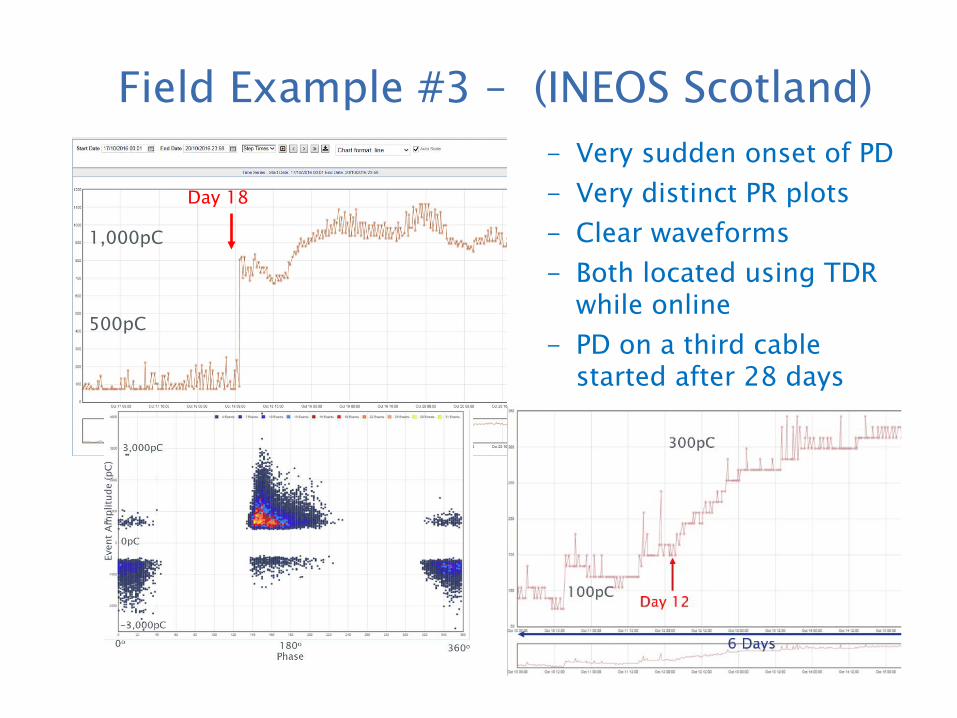
500pC
1,000pC
Day 18
Field Example #3 – (INEOS Scotland) - Very sudden onset of PD- Very distinct PR plots- Clear waveforms- Both located using TDR
while online- PD on a third cable
started after 28 days

Conclusions
• Online RFCT based testing is a viable method for finding partial discharge in MH, HV, and EHV cables
• Periodic testing of MV cables while in service finds a high percentage of damaged cables prior to failure
• Full time monitoring of EHV cables may be required due to more extensive grounding systems
• Evaluation of data requires more than just amplitude. High quality filtering, analysis of phase resolved plots and analysis of waveforms is needed to discriminate PD from noise
Top Related