


Languages
Pages
Legal


2016 ANNUAL REPORT
The National Architectural Accrediting Board®
PART I: PROGRAMS, ENROLLMENT, AND DEGREES AWARDED
01

00Contents
01 INTRODUCTION 3
From the NAAB President
Vision, Mission, and Values of the National Architectural Accrediting Board
NAAB Annual Report System
02 ACCREDITED PROGRAMS 7
Number of Accredited Programs
Number of Candidate Programs
Number of Institutions with Accredited Architecture Programs
Institution Type
Distribution of Accredited Programs and Students by ACSA Region
03 ENROLLMENT 9
Overall Enrollment in Accredited Programs by Degree
Overall Enrollment in Accredited Programs by Gender, by Ethnicity
Overall Enrollment in Candidate Programs by Gender, by Ethnicity
Trends in Enrollment by Ethnicity
First-Time Enrollment in Accredited Programs by Gender, by Ethnicity
Overall Enrollment in Preprofessional Programs
Preprofessional Enrollment by Gender, by Ethnicity
First-Time Enrollment in Preprofessional Programs by Gender, by Ethnicity
04 DEGREES AWARDED 15
Degrees Awarded by Accredited Programs by Gender, by Ethnicity
Degrees Awarded in Preprofessional Programs by Gender, by Ethnicity
Postprofessional Programs
05 TRENDS IN ENROLLMENT AND DEGREES AWARDED
17

3 2016 Annual Report
01
The report is released in three parts:
Part I: Programs, Enrollment, and Degrees Awarded
Part II: Faculty and Team Pool Statistics
Part III: Accreditation Decisions and Other Activities
In 1975, the NAAB became responsible for establishing and maintaining “a data bank of comparable information on schools.” Today, this responsibility is fulfilled by the Annual Report Submission system (ARS). Since 2008, 100% of accredited and candidate programs have submitted statistical data. There are currently 171 programs in 136 institutions that are accredited or in candidacy. The graphics included in these reports are designed to provide aggregated information on these programs, their students, and their faculty.
For the first time, this report also includes information on the NAAB’s visiting team pool. We will continue to track the demographics of this group as we seek to have the participants in our process reflect the increasing diversity of our student population.
In calendar 2016, the NAAB visited 33 institutions and reviewed 41 programs.
· Twenty-four visits to institutions to review 32 programs for continuing accreditation; eight of these visits are for concurrent review of two accredited programs.
· Three visits for initial accreditation
· Four visits for continuation of candidacy
· Two visits for initial candidacy
The accreditation decisions reported in part three were all made on the basis of visits and Visiting Team Reports submitted for spring 2016; these decisions were all effective January 1, 2016. This report does not include the results of decisions based on visits conducted between September 1 and November 30, 2016.
Approximately 130 volunteers contributed 5,000 hours to the important task of specialized accreditation in architecture. The level of commitment from these volunteers is remarkable. The NAAB expresses its gratitude to each of them for sharing their time and talent in the critically important work of assuring the quality of accredited and candidate professional degree programs in architecture.
I hope you find this report valuable. It is the NAAB’s intention to make it a useful tool for schools of architecture, accredited programs, and the profession. Please feel free to share suggestions for improvements or changes by contacting the NAAB at [email protected].
Sincerely,
Judith Kinnard, FAIA President
From the NAAB President
On behalf of the directors and staff, it is my pleasure to share the 2016 edition of the annual report from the National Architectural Accrediting Board (NAAB).

4 2016 Annual Report
01 Vision, Mission, and Values of the National Architectural Accrediting Board
From the 1940 Founding Agreement
“The…societies creating this accrediting board, here record their intent not to create conditions, nor to have conditions created, that will tend toward standardization of educational philosophies or practices, but rather to create and maintain conditions that will encourage the development of practices suited to the conditions which are special to the individual school. The accrediting board must be guided by this intent.”
Since 1975, the NAAB Conditions for Accreditation have emphasized self-assessment and student performance as central elements of the NAAB model. The Directors have maintained their commitment to both of these as core tenets of the NAAB’s criteria and procedures.
Values: The following principles serve as a guide and inspiration to the NAAB.
1. Shared Responsibility. The education of an architect is a responsibility shared by the academy and the profession in trust for the broader society and the public good.
2. Best Practices. The NAAB’s accreditation processes are based on best practices in professional and specialized accreditation.
3. Program Accountability. Architecture degree programs are accountable for the learning of their students. Thus, accreditation by the NAAB is based both on educational outcomes and institutional commitment to continuous improvement.
4. Preparing Graduates for Practice. A NAAB-accredited degree prepares students to live and work in a diverse world; to think critically; to make informed decisions; to communicate effectively; to engage in lifelong learning; and to exercise the unique knowledge and skills required to work and develop as professionals. Graduates are prepared for architectural internship, set on the pathway to examination and licensure, and to engage in related fields.
5. Constant Conditions for Diverse Contexts. The NAAB Conditions for Accreditation are broadly defined and achievement-oriented so that programs may meet these standards within the framework of their mission and vision, allowing for initiative and innovation. This imposes conditions on both the NAAB and on architecture programs. The NAAB assumes the responsibility for undertaking a fair, thorough, and holistic evaluation process, relying essentially on the program’s ability to demonstrate how within their institutional context they meet all evaluative criteria. The process relies on evaluation and judgment that, being rendered on the basis of qualitative factors, may defy precise substantiation.
6. Continuous Improvement through Regular Review. The NAAB Conditions for Accreditation are developed through an iterative process that acknowledges and values the contributions of educators, professionals in traditional and nontraditional practice, and students. The NAAB regularly convenes conversations on critical issues (e.g., studio culture) and challenges the other four collateral partners to acknowledge and respect the perspectives of the others.
VISION The NAAB aspires to be the leader in establishing educational quality assurance standards to enhance the value, relevance, and effectiveness of the architecture profession.
MISSION The NAAB develops and maintains a system of accreditation in professional architecture education that is responsive to the needs of society and allows institutions with varying resources and circumstances to evolve according to their individual needs.

5 2016 Annual Report
01 Historical Background
The National Architectural Accrediting Board (NAAB) was founded in 1940, to “produce and maintain current a list of accredited schools of architecture in the United States and its possessions, with the general objective that a well-integrated and coordinated program of architectural education be developed that is national in scope and afford opportunity for architectural schools with varying resources and operating conditions to find places appropriate to their objectives and do high class work therein.”
Since 1975, the NAAB has accredited professional degree programs rather than schools or universities and only accredits the first professional degree program offered by any school or university.
Among the NAAB’s primary responsibilities are (a) to maintain a list of accredited degree programs in architecture and (b) to maintain statistical information on accredited programs.

6 2016 Annual Report
01 Annual Report Submission (ARS)
Overview
The NAAB launched a new web site and rebuilt its Annual Report Submission system this year. We hope that programs will find the new ARS more intuitive and easier to navigate. The NAAB has used the ARS to collect statistical information from programs since 2008, and the aggregate results of the web-based questionnaire are presented in this report.
The annual statistical report captures information on both the institution in which an architecture program is located and the program itself. The statistical report consists of seven sections: (1) institutional characteristics; (2) NAAB-accredited architecture programs; (3) tuition, fees, and financial support for students; (4) student characteristics; (5) degrees awarded; (6) resources for students and learning; and (7) human resources.
The definitions used in the statistical report are based on the glossary of terms used by the Integrated Postsecondary Education Data System (IPEDS). IPEDS is the “core postsecondary data collection program” for the National Center for Education Statistics. Data are collected from all primary providers of postsecondary education in the United States in areas including enrollments, program completions, graduation rates, faculty, staff, finances, institutional prices, and student financial aid.¹ Much of the institutional information requested in the ARS corresponds to reports submitted by institutions to IPEDS each fall.
¹ Integrated Postsecondary Education Data System http://nces.ed.gov/IPEDS/

7 2016 Annual Report
02 Number of Accredited Programs
In AY 2015–16, 155 accredited programs were housed in 123 institutions with U.S. regional accreditation.
Of the 155 programs, 104 (66%) are Master of Architecture programs, 50 (33%) are Bachelor of Architecture programs, and 1 (1%) is a Doctor of Architecture program.
Number of Candidate Programs
Data included in this report are only for those programs that had achieved initial candidacy by July 1, 2016. All programs visited for candidacy in 2016 submitted their first statistical reports in fall 2016. Please see part 3 of this report for additional information on programs in or seeking candidacy.
Of the 16 programs in candidacy in AY 2015–16, 9 were M. Arch. programs and 7 were B. Arch. programs.
Number of Institutions with Accredited Architecture Programs
Of the 123 institutions that offer accredited architecture programs, 91 (74%) institutions offer one accredited program, and 32 (26%) offer two accredited programs.
Institution Type
Seventy-eight (62%) are public institutions; 43 (36%) are private, not-for-profit institutions; and 2 (2%) are private, for-profit institutions.
Accredited Programs
Master of Architecture
Bachelor of Architecture
Doctor of Architecture
66% 33% 1%
155
9M. Arch
7B. Arch
32two accreditatedprograms
91one accreditatedprogram
62% 36% 2%
123
Public Institutions
Private, Not-for-Profit Institutions
For-ProfitInstitutions

8 2016 Annual Report
02
West
East Central
Mid-Atlantic
Gulf
Northeast
West Central
34
23
20
34
24
20
23
19
18
23 11
12
9 11
8
10
6
1
4
Total Programs
M. Arch. B. Arch. D. Arch.50 1
155
104Total Enrollment
B. Arch. M. Arch. D. Arch.10,227 88
24,456
14,141
Northeast
2,1943,4065,600
2,1483,847West
6,083
West Central
2,1901,4793,669
Gulf
2,461 1,0373,498
East Central
1,5031,1452,648
B. ARCH. D. ARCH.M. ARCH.
Mid-Atlantic
1,803 1,1552,958
88
26 20 1625
Northeast West
19
West CentralEast Central
17
Mid-Atlantic Gulf
Programs and Enrollment in ACSA Regions
Distribution of Accredited Programs and Enrolled Students by ACSA Region
The table below shows the total number of students enrolled in accredited degree programs by ACSA region. The number in parentheses is the number of institutions in that region. This table does not include candidate programs.
Total enrollment in all ACSA regions increased by 1% from 2015. The East Central region saw the greatest percentage increase in enrollment, up 30% over 2015
numbers. The West Central region saw the greatest percentage decrease, down by 18% from 2015. Increases/decreases in the remaining regions were
· Gulf, +18%
· Mid-Atlantic, -11%
· Northeast, -5%
· West, +6%
Number of Institutions in ACSA Regions

9 2016 Annual Report
03Enrollment
Overall Enrollment in Accredited Programs by Degree
There are 24,456 students enrolled in NAAB-accredited degree programs; of this total, 14,141 (58%) are enrolled in Bachelor of Architecture programs, 10,227 (42%) in Master of Architecture programs, and 88 (0.4%) in Doctor of Architecture programs.
Of the students enrolled, 22,303 (91%) are enrolled full-time, and 2,153 (9%) are enrolled part-time.
Overall, enrollment in accredited programs increased by a net of 248 students, or 1%, from AY 2014–2015, when 24,208 students were enrolled in accredited degree programs.
Total enrollment in B. Arch. programs increased by 410 over 2014–15 numbers, while enrollment in M. Arch. programs decreased by 144, and enrollment in D. Arch. programs decreased by 18.
There are 12,759 (52%) architecture students enrolled in institutions with public support and 11,697 (48%) in institutions with private support. In 2015 the distribution of enrolled students between public and private institutions was essentially the same.
Bachelor of Architecture
Master of Architecture
Doctor of Architecture
14,141 10,227 88
24,456
9%91%Full-time Part-time
B. ARCH. D. ARCH.M. ARCH.
-144 -18
410
2014-15 Enrollment
24,208248
48%52%Public Support Private Support

10 2016 Annual Report
03Overall Enrollment in Accredited Programs by Gender
The gender breakdown of enrolled students is 13,233 (54%) males and 11,223 (46%) females. In 2014–15, the percentage breakdown was 55% male students and 45% female students. The percentages are statistically the same for the three degrees, Bachelor of Architecture, Master of Architecture, and Doctor of Architecture.
Overall Enrollment in Accredited Programs by Ethnicity
Trends in Enrollment by Ethnicity
Enrollment by students who indicated white for ethnicity has been steadily declining since 2009. The chart below shows white enrollment as a percentage of total enrollment, 2009-16.
The fastest growing category of ethnicity is nonresident alien. In 2009, this category accounted for 6% of enrollment overall; in 2016, it was 19%. Enrollment of Black/African-American students has remained flat over the past five years, hovering at 5% of total enrollment each year.
Gender breakdown shows little change from last year.
46%54%Male students Female students
Race/Ethnicity unknown
10,264
59
1,308 1,197White
American Indian/Alaskan Native
4,138
Asian
664
4,560
2,224
Two or moreraces
Nonresident alien
42Native Hawaiian /Pacific Islander
24,456 42%
19%
17%
9%
5%5% 3%
Black/AfricanAmerican
Hispanic/Latino
0%0%
20%
2009 2010 2011 2012 2013 2014 2015
40%
60%
80%
100%
52% 51% 51% 48% 46% 44%54%
2016
42%
12%
14%
16%
18%
20%
2009 2010 2011 2012 2013 2014 2015 2016
4%
6%
8%
10%
2%
0%
HISPANIC/LATINO
ASIAN
NONRESIDENT ALIEN
BLACK/AFRICAN AMERICAN
11 2016 Annual Report
03Overall Enrollment in Candidate Programs by Degree
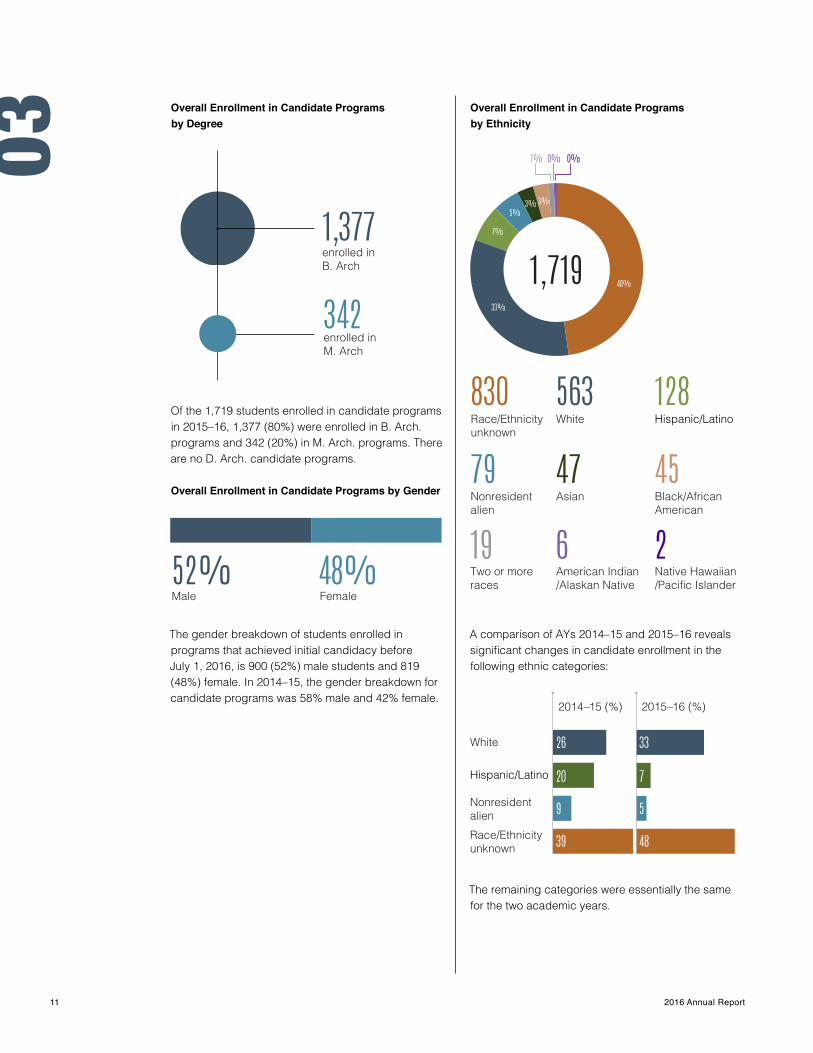
Of the 1,719 students enrolled in candidate programs in 2015–16, 1,377 (80%) were enrolled in B. Arch. programs and 342 (20%) in M. Arch. programs. There are no D. Arch. candidate programs.
Overall Enrollment in Candidate Programs by Gender
The gender breakdown of students enrolled in programs that achieved initial candidacy before July 1, 2016, is 900 (52%) male students and 819 (48%) female. In 2014–15, the gender breakdown for candidate programs was 58% male and 42% female.
Overall Enrollment in Candidate Programs by Ethnicity
A comparison of AYs 2014–15 and 2015–16 reveals significant changes in candidate enrollment in the following ethnic categories:
The remaining categories were essentially the same for the two academic years.
342enrolled inM. Arch
1,377enrolled in B. Arch
Black/African American
45
2Native Hawaiian /Pacific Islander
128
Nonresident alien
79
19Two or moreraces
830Race/Ethnicity unknown
563White
6American Indian /Alaskan Native
1,719 48%
33%
7%
5%3% 3%
47Asian
Hispanic/Latino
0%0%1%
White
Hispanic/Latino
Nonresident alienRace/Ethnicity unknown
2014–15 (%) 2015–16 (%)
26 33
20 7
9 5
39 48
48%52%Male Female

12 2016 Annual Report
03First-Time Enrollment in Accredited Programs
There are 7,368 newly matriculated students enrolled in NAAB-accredited degree programs for the academic year 2015–2016; this number represents a 4% increase over first-time enrollment in 2014-15. The number of new students is approximately 30% of all students in accredited programs. Of this total, 3,721 (51%) are enrolled in Bachelor of Architecture programs, 3,626 (49%) in Master of Architecture programs, and 21 (0%) in Doctor of Architecture degree programs.
Of the 7,368 newly enrolled students, 6,887 (93%) are enrolled full-time and 481 (7%) are enrolled part-time. There are 4,008 (54%) architecture students enrolled in institutions with public support and 3,360 (46%) enrolled in institutions with private support.
After several years of declining numbers in first-time enrollment, 2015-16 saw an increase of 316 students, or 4%, over the previous year. See page 17 for trends in enrollment between 2010 and 2016.
First-Time Enrollment in Accredited Programs by Gender
The gender breakdown of first-time enrollment is 3,885 (53%) male students and 3,483 (47%) female. The percentage breakdown by gender in 2014–2015 was 54% male and 46% female. In addition, the percentages for male/female are relatively the same for the three degrees, Bachelor of Architecture, Master of Architecture, and Doctor of Architecture.
First-Time Enrollment in Accredited Programs by Ethnicity
Masterof Architecture
3,626
Doctor of Architecture
Bachelor of Architecture
3,721 21
7,368
Full-time93%
Part-time7%
Public
54%Private46%
46%54%Male Female
Race/Ethnicityunknown
21
457 357
American Indian /Alaskan Native
1,069
Asian
196
3,155
736
Two or moreraces
White1,357Nonresidentalien
20Native Hawaiian /Pacific Islander
Hispanic/Latino
Black/AfricanAmerican
7,368
0%0%
43%
18%
15%
10%
6%5% 3%

13 2016 Annual Report
03Overall Enrollment in Preprofessional Programs
Of the institutions that offer accredited and candidate architecture programs, 82 offer preprofessional programs. The term preprofessional refers to architecturally focused four-year degrees that are not accredited by NAAB. These degrees have such titles as B.S. in Architecture, B.S. in Architectural Studies, B.A. in Architecture, Bachelor of Environmental Design, or Bachelor of Architectural Studies. The amount of architectural content in the program may vary among institutions.
There were 14,403 students enrolled in preprofessional degree programs in AY 2015–16. This is a decrease of 276 students, or 2%, from AY 2014–15. With one exception (2011), overall enrollment in these programs has been declining steadily since 2010. See page 17 for trends in overall enrollment in preprofessional programs.
Of the total, 13,345 (93%) are enrolled full-time and 1,058 (7%) part-time. There are 11,153 (77%) architecture students enrolled in institutions with public support and 3,250 (23%) in institutions with private support.
Enrollment in Preprofessional Programs by Gender
The gender breakdown of preprofessional enrollment was 8,217 (57%) males and 6,186 (43%) females. The percentage breakdown in 2014-15 was 58% males and 42% females.
Enrollment in Preprofessional Programs by Ethnicity
Full-time93%
Part-time7%
Public77%
Private23%
43%57%Male Female
Two or moreraces
66
969 482
American Indian /Alaskan Native
1,529
476
7,301
1,173
Race/Ethnicityunknown
2,387Hispanic/Latino
20Native Hawaiian /Pacific Islander
0%0%
14,403
White Nonresidentalien
AsianBlack/AfricanAmerican
51%
17%
11%
8%
7%3% 3%
14 2016 Annual Report
03First-Time Enrollment in Preprofessional Programs
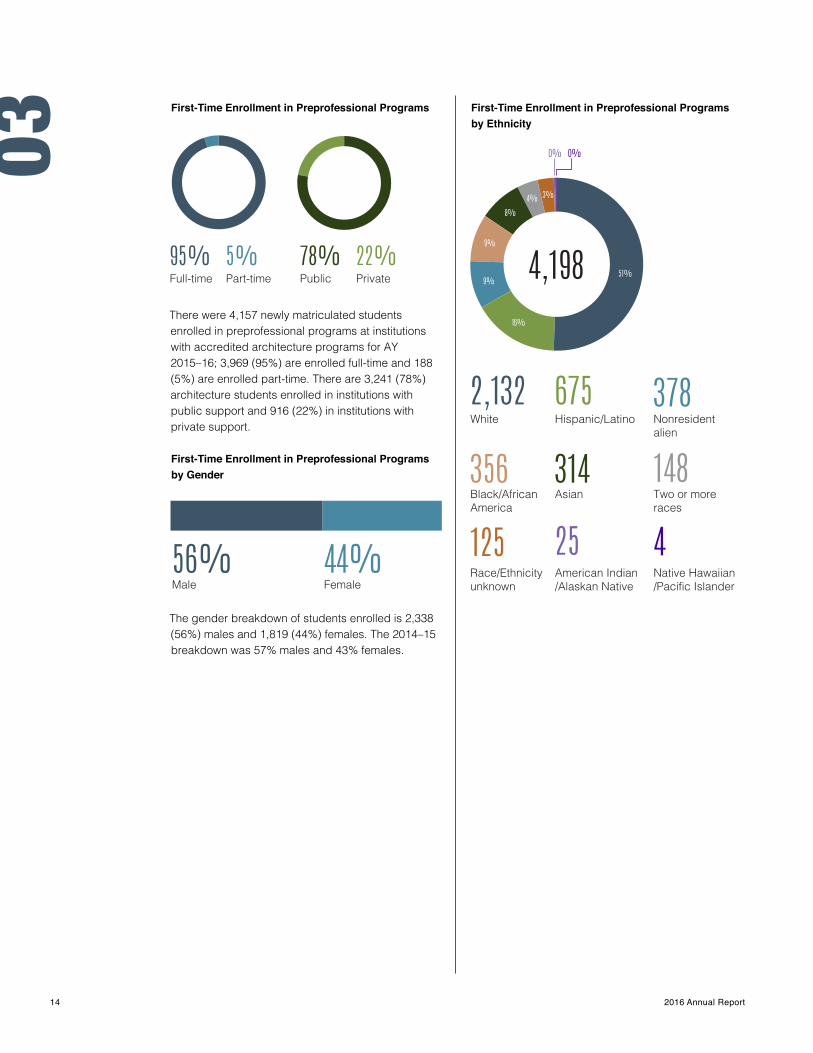
There were 4,157 newly matriculated students enrolled in preprofessional programs at institutions with accredited architecture programs for AY 2015–16; 3,969 (95%) are enrolled full-time and 188 (5%) are enrolled part-time. There are 3,241 (78%) architecture students enrolled in institutions with public support and 916 (22%) in institutions with private support.
First-Time Enrollment in Preprofessional Programs by Gender
The gender breakdown of students enrolled is 2,338 (56%) males and 1,819 (44%) females. The 2014–15 breakdown was 57% males and 43% females.
First-Time Enrollment in Preprofessional Programs by Ethnicity
Full-time95%
Part-time5%
Public78%
Private22%
44%56%Male Female
Asian
25
314 148
American Indian /Alaskan Native
378
Black/African America
125
2,132
356
Race/Ethnicityunknown
White675Hispanic/Latino Nonresident
alien
4Native Hawaiian /Pacific Islander
0%0%
4,198 51%
16%
9%
9%
8%4% 3%
Two or moreraces

15 2016 Annual Report
04Degrees Awarded
Degrees Awarded by Accredited Programs
A total of 6,042 accredited degrees were awarded in AY 2015–16: 3,525 (58%) were Master of Architecture degrees; 2,491 (41%) were Bachelor of Architecture degrees; and 26 (1%) were Doctor of Architecture degrees.
The number of degrees awarded this year represents a 5% decrease from AY 2014–15.
Degrees Awarded by Accredited Programs by Gender
The gender breakdown for degrees awarded is 3,434 (57%) males and 2,608 (43%) females. These percentages are identical to those in 2014-15.The gender breakdown for overall enrollment is 54% males and 46% females.
The distribution by gender for degrees awarded is statistically the same for the degrees of Bachelor of Architecture and Master of Architecture. The gender distribution for the Doctor of Architecture is 58% male and 42% female. The D. Arch. breakdown in 2014–2015 was 53%/47%.
Degrees Awarded by Accredited Programs by Ethnicity
The distribution of degrees awarded by ethnicity is statistically the same for the degrees Bachelor of Architecture and Master of Architecture.
Bachelor of Architecture
Doctor of Architecture
2,491Masterof Architecture
3,525 26
6,042
43%57%Male Female
11
324 225Black/African American
Race/Ethnicityunknown
American Indian /Alaskan Native
856
127
2,974
603
Two or moreraces
White917Nonresidentalien
Hispanic/Latino
5Native Hawaiian /Pacific Islander
Asian
0%0%
6,042 49%
15%
14%
10%
5%4% 2%

16 2016 Annual Report
04Degrees Awarded in Preprofessional Programs
A total of 3,253 preprofessional degrees were awarded in AY 2015–2016. This total is a 3% decrease from 2014–15, when 3,340 preprofessional degrees were awarded.
Degrees Awarded in Preprofessional Programs by Gender
The gender breakdown of degrees awarded is 1,869 (57%) degrees awarded to male students and 1,384 (43%) to female students. The gender breakdown in 2014–15 was 58% male and 42% female.
Degrees Awarded in Preprofessional Programs by Ethnicity
Postprofessional Programs
Of the institutions that offer accredited architecture programs, 73 offer postprofessional programs; the term postprofessional refers to graduate degrees offered to students who already have a professional degree in architecture. These degree programs are not accredited by NAAB. They may be in highly specialized areas of study such as design theory, health care facilities, preservation, interior design, or solar design. Postprofessional degrees are offered at the master’s or, in a few cases, doctoral level.
43%57%Male Female
13
179 113Race/Ethnicityunknown
Black/African American
American Indian /Alaskan Native
310
90
1,858
191
Two or moreraces
White492Hispanic/Latino Nonresident
alien
7Native Hawaiian /Pacific Islander
Asian
4,198
0%0%
57%
15%
10%
6%
6%3% 3%

17 2016 Annual Report
05Trends in Enrollment and Degrees Awarded
Accredited Programs
After several years of decline, first-time enrollment increased by 4% over 2015 numbers, and overall enrollment increased by 1% for the same period. The number of degrees awarded in 2016 decreased by 5% from 2015.
Preprofessional Programs
Enrollment in preprofessional programs continued to decline, down 2% from 2015 and 20% since 2010 and 2011. The number of degrees awarded decreased by 3% from last year’s numbers.
2009 2010 2011 2012 2013 2014 2015
TOTAL ENROLLMENT FIRST-TIME ENROLLMENT DEGREES AWARDED
5,000
0
10,000
15,000
20,000
25,000
30,00025,707
8,553
6,017 6,017 6,191 6,354 6,347 5,918 6,348
8,653
27,852 27,477 26,850 25,958 24,989 24,456
8,307 8,120 7,169 6,957 7,052
2016
24,208
7,368
6,042
3,000
0
6,000
9,000
12,000
15,000
18,000 17,342 17,834 17,29415,830 15,507
14,679
5,492
3,430 3,1633,588 3,515 3,3403,951
4,952 5,404 4,342 4,276 4,198
TOTAL ENROLLMENT FIRST-TIME ENROLLMENT DEGREES AWARDED
2010 2011 2012 2013 2014 2015 2016
4,157
3,252
14,403

2016 ANNUAL REPORT
National Architectural Accrediting Board®
©2016 All rights reserved
1101 Connecticut Avenue, NWSuite 410Washington, DC 20036
WWW.NAAB.ORG
®
Top Related