


Languages
Pages
Legal


PANAGIOTIS YPSILANTIS
The Design, Planning and Execution of Sustainable Intermodal Port-hinterland Transport Networks
brought to you by COREView metadata, citation and similar papers at core.ac.uk
provided by Erasmus University Digital Repository


The Design, Planning and Execution of Sustainable Intermodal Port-hinterland Transport Networks


The Design, Planning and Execution of Sustainable Intermodal Port-hinterland Transport Networks
Het ontwerp, de planning en uitvoering van duurzaam intermodaal haven-hinterland vervoersnetwerken
Thesis
to obtain the degree of Doctor from the Erasmus University Rotterdam
by command of the Rector Magnificus
Prof.dr. H.A.P. Pols
and in accordance with the decision of the Doctorate Board.
The public defence shall be held on 1 December 2016 at 13:30 hrs
by
Panagiotis Ypsilantis born in Athens, Greece
Doctoral Committee Doctoral dissertation supervisor(s): Prof.dr. R.A. Zuidwijk † Prof.dr. L.G. Kroon Other members: Prof.dr.ir R. Dekker Prof.dr. A.W. Veenstra Dr. J. van Dalen Erasmus Research Institute of Management – ERIM The joint research institute of the Rotterdam School of Management (RSM) and the Erasmus School of Economics (ESE) at the Erasmus University Rotterdam Internet: http://www.erim.eur.nl ERIM Electronic Series Portal: http://repub.eur.nl/ ERIM PhD Series in Research in Management, 395 ERIM reference number: EPS-2016-395-LIS ISBN 978-90-5892-4674 © 2016, Panagiotis Ypsilantis Design: Panart, www.panart.nl This publication (cover and interior) is printed by Tuijtel on recycled paper, BalanceSilk® The ink used is produced from renewable resources and alcohol free fountain solution. Certifications for the paper and the printing production process: Recycle, EU Ecolabel, FSC®, ISO14001. More info: www.tuijtel.com All rights reserved. No part of this publication may be reproduced or transmitted in any form or by any means electronic or mechanical, including photocopying, recording, or by any information storage and retrieval system, without permission in writing from the author.

To Magda


Acknowledgements
Approaching the end of an astonishing but challenging path always leaves a bitter-
sweet feeling. On one side the feeling of relief that you successfully reached the end
but on the other side the nostalgia for all steps you had to follow in this way. Of
course, in many cases one has to take some distance to better appraise a situation,
and I am fortunate enough that I already did. It has been almost six years since the
start of my Ph.D. journey and almost two years since the end of my full engagement
in my Ph.D. work, but still my eagerness to learn, design and apply novel solutions
to problems remains. That is my biggest gain of my Ph.D. studies and although I
will not follow academia, all the skills and values I acquired during this process will
always follow me. For all the above I feel that this is the right time to express my
gratitude to all the people that made this journey feasible for me.
First and foremost, I would like to express my gratitude to my promotors, Prof. Rob
Zuidwijk and Prof. Leo Kroon IM (11/1958 - 09/2016), that gave me the opportunity
to obtain Ph.D studies, I am indebted to both of you. Rob, since you acted also as
my daily supervisor, thank you for all the support and trust in me that always kept
me motivated. It was a pleasure brainstorming and developing research ideas with
you that led to very interesting research paths. Your open mind and very positive
attitude are the values that I admire in you mostly. It was a privilege having Leo as
my promotor and I was so saddened to hear about his passing. His guidance during
all the crucial milestones of my Ph.D. trajectory was invaluable. He will always be
remembered for the positive influence he had on others next to the great impact he
had in academia. Rest in peace.
Besides my promotors I am grateful to the rest of my inner committee and I would like
to thank them separately. Prof. Albert Veenstra who, together with Rob, selected
me for this Ph.D. position, and, as the manager of the project that this thesis was
part of, always provided me with valuable feedback and directions throughout the
process. Albert, your ability to see the bigger picture and connect business problems
to academia is remarkable. Prof.dr.Ir. Rommert Dekker who introduced me to the
i
Acknowledgments
world of operations research and freight transportation during my M.Sc. studies
and supported my ambition to continue with Ph.D. studies. Rommert, I will always
admire your passion for research and your ability to effectively position any research
idea. Associate Prof. Jan Van Dalen who was co-author in one chapter and guided
me very constructively on its contents and presentation. Jan, I would like also to
thank you very much for acting as the secretary of my doctoral committee.
Moreover, I would like to thank Prof.dr.ir. Rene de Koster, Prof. Luce Brotcorne
and Prof. Lori Tavasszy for accepting to be in my doctoral committee given their
busy schedule. I admire your research work and I feel really honored to defend my
thesis against you.
This thesis was part of the ULTIMATE project and was funded by the Dutch Institute
of Advanced Logistics (DINALOG). Apart from the academic partners of the project,
several business partners were involved. Especially, I would like to thank Jan Nater
and Arno van Rijn from Europe Container Terminals (ECT) and Ben van Rooij from
Brabant Intermodal (BIM), that were mostly involved in my part of the project. The
data and insights of their businesses added great value and impact to our research.
Thank you very much. Moreover, I would like to thank ERIM for all the financial
support that enabled me to follow courses abroad, and visit several international
conferences.
Apart from the research I would have to say a special thanks to all people in the
Technology and Operations Management department (previously Department 1) of
RSM, that made work very pleasant throughout my Ph.D. studies. Cheryl, Indrid
and Carmen, I will always be grateful for all your help all these years. Nick and Sarita
thank you very much for being the paranymfs in my defense, I will expect you for
more partying in Greece. Konstantina, Wouter, Morteza, Niels, Dimitri, Paul, Joris,
Evsen, Irina, Evelien, Luuk, Lingzhe, Xiao, Clint, Peter, Judith, Stefano, Susan,
Sishu, it was great having you as colleagues. Our activities, from going out for drinks
to trips, conference visits, basketball games, table tennis and poker nights, are what
made our time during the Ph.D. studies even more fun. Thanks a lot.
In my time in Rotterdam I made a lot of friends that I would like to thank for
their support and all the great times we shared together. Especially Manos, Klairi,
Thanos, Zanna, Maria, Tzina, it would have been much more difficult without you.
A special thanks goes to my family, my father Pandelis and my mother Kelly, with
their unconditional love and support. They taught me to have high expectations and
always try for the best. I would like to thank my sister Ioanna, my brother Grigoris,
ii

Acknowledgments
my brother in law Panos, my sister in law Chrysa and my nephew Andreas for all
the good times we had during my visits back home, you definitely made me have
more reasons to visit Greece often. My friends in Greece, Christos, Giorgos, Antonis,
Xaris, Fanis, Dimitra, Eleni, Christina, that although I was missing a lot, every time
I was back it was like I had never been away. It is a pleasure having all of you in my
life.
Last but not least, I would like to thank the woman that stood by me during all
this journey, Magda. You followed me in Rotterdam and supported me with your
love and care throughout this period, you were there in all the ups and downs of this
process and made me certain that together we can get through any situation. I love
you, lets start the next chapter of our life...
Thanks a lot! Ευχαριστώ!
Panagiotis Ypsilantis
Athens, September 2016
iii

Contents
Acknowledgments i
Glossary i
Clarification of Contribution i
1 Introduction 1
1.1 Port-Hinterland freight intermodal transportation . . . . . . . . . . . . 4
1.2 Research scope and objectives of the thesis . . . . . . . . . . . . . . . 7
2 Literature Review on Intermodal Service Network Design 13
2.1 Intermodal Service Network Design . . . . . . . . . . . . . . . . . . . . 13
2.2 Consideration of time in intermodal transport . . . . . . . . . . . . . . 15
2.3 Network flows and economies of scale . . . . . . . . . . . . . . . . . . . 16
2.4 Consideration of transshipments in intermodal transportation . . . . . 17
2.5 Contributions in Port - Hinterland Network Design . . . . . . . . . . . 18
3 Dwell Times at Container Terminals: Shipper Effects 23
3.1 Introduction . . . . . . . . . . . . . . . . . . . . . . . . . . . . . . . . . 23
3.2 The import container process . . . . . . . . . . . . . . . . . . . . . . . 26
3.3 Candidate dwell time determinants . . . . . . . . . . . . . . . . . . . . 28
3.3.1 Shipper (Client) . . . . . . . . . . . . . . . . . . . . . . . . . . 29
3.3.2 Selection of shipping line . . . . . . . . . . . . . . . . . . . . . 30
3.3.3 Selection of inland container terminal . . . . . . . . . . . . . . 31
3.4 Dwell time analysis . . . . . . . . . . . . . . . . . . . . . . . . . . . . . 31
3.4.1 Case and sample . . . . . . . . . . . . . . . . . . . . . . . . . . 31
3.4.2 Descriptive analysis of container dwell times . . . . . . . . . . . 32
3.5 Evaluation of various effects on container dwell times . . . . . . . . . . 36
3.5.1 Dwell time analysis . . . . . . . . . . . . . . . . . . . . . . . . . 36
3.5.2 Shipper clustering analysis . . . . . . . . . . . . . . . . . . . . 38
v

Contents
3.5.3 Summary and discussion of results . . . . . . . . . . . . . . . . 41
3.6 Conclusion . . . . . . . . . . . . . . . . . . . . . . . . . . . . . . . . . 42
4 Joint Design and Pricing of Intermodal Port - Hinterland Network Services:
Considering Economies of Scale and Service Time Constraints 47
4.1 Introduction . . . . . . . . . . . . . . . . . . . . . . . . . . . . . . . . . 48
4.2 Theoretical background in joint design and pricing of networks . . . . 50
4.3 Modeling . . . . . . . . . . . . . . . . . . . . . . . . . . . . . . . . . . 52
4.3.1 Notation . . . . . . . . . . . . . . . . . . . . . . . . . . . . . . . 53
4.3.2 The model . . . . . . . . . . . . . . . . . . . . . . . . . . . . . 57
4.3.3 MIP equivalent formulation (MIP EQ) . . . . . . . . . . . . . . 60
4.3.4 Experimental design . . . . . . . . . . . . . . . . . . . . . . . . 64
4.4 Solution approach . . . . . . . . . . . . . . . . . . . . . . . . . . . . . 65
4.4.1 Heuristic development . . . . . . . . . . . . . . . . . . . . . . . 67
4.4.2 Heuristic assessment . . . . . . . . . . . . . . . . . . . . . . . . 70
4.5 Experimental results . . . . . . . . . . . . . . . . . . . . . . . . . . . . 71
4.5.1 Port-to-port vs port-to-door haulage . . . . . . . . . . . . . . . 74
4.5.2 Impact of service level constraints . . . . . . . . . . . . . . . . 75
4.6 Conclusions . . . . . . . . . . . . . . . . . . . . . . . . . . . . . . . . . 76
5 Joint fleet deployment and barge rotation network design: The case of
horizontal cooperation of dryports 83
5.1 Introduction . . . . . . . . . . . . . . . . . . . . . . . . . . . . . . . . . 83
5.2 Basic Trade-offs in Port-Hinterland Barge Network design . . . . . . . 86
5.3 Theoretical background . . . . . . . . . . . . . . . . . . . . . . . . . . 90
5.4 Model formulation . . . . . . . . . . . . . . . . . . . . . . . . . . . . . 91
5.4.1 Notation . . . . . . . . . . . . . . . . . . . . . . . . . . . . . . . 91
5.4.2 MIP formulation . . . . . . . . . . . . . . . . . . . . . . . . . . 95
5.5 Case study and results . . . . . . . . . . . . . . . . . . . . . . . . . . . 98
5.5.1 Experiment . . . . . . . . . . . . . . . . . . . . . . . . . . . . . 99
5.5.2 Results . . . . . . . . . . . . . . . . . . . . . . . . . . . . . . . 99
5.5.3 Experimental results summary . . . . . . . . . . . . . . . . . . 104
5.6 Stylized analytical model to illustrate design trade-offs . . . . . . . . . 106
5.6.1 Analytical expressions . . . . . . . . . . . . . . . . . . . . . . . 107
5.6.2 Analytical optimization model . . . . . . . . . . . . . . . . . . 110
5.7 Conclusions . . . . . . . . . . . . . . . . . . . . . . . . . . . . . . . . . 114
vi

Contents Contents
6 Conclusion 117
6.1 Summary of results . . . . . . . . . . . . . . . . . . . . . . . . . . . . . 118
6.2 Discussion and future research . . . . . . . . . . . . . . . . . . . . . . 122
Bibliography 125
Summary 131
Samenvatting (Summary in Dutch) 133
vii


Glossary
AEO Authorized Economic Operator. The AEO concept is
based on the Customs-to-Business partnership introduced
by the World Customs Organisation (WCO). Traders who
voluntarily meet a wide range of criteria work in close
cooperation with customs authorities to assure the
common objective of supply chain security and are
entitled to enjoy benefits throughout the EU. The EU
established its AEO concept based on the internationally
recognised standards, creating a legal basis for it in 2008
through the ’security amendments’ to the ”Community
Customs Code” (CCC) (Regulation (EC) 648/2005) and
its implementing provisions. The programme, which aims
to enhance international supply chain security and to
facilitate legitimate trade, is open to all supply chain
actors. (ac.europa.eu)
BAPLIE The BAPLIE message is a widely used EDIFACT message
in the shipping industry. It is used by and between
various parties to advise the exact stowage positions of the
cargo on board of an ocean vessel. It is currently chiefly
used for container cargo. Besides the container number
and the exact position on board, general information
regarding the containers is also specified such as weight
and hazardous cargo class. (www.portofantwerp.com)
Carrier haulage Carrier haulage is when the shipping company itself takes
care of pre and end haulage of a container. It is also
referred to as liner’s haulage. (www.logisticsglossary.com)
i

Glossary
Containerization Containerization is a system of intermodal freight
transport using intermodal containers (also called
shipping containers and ISO containers) made of
weathering steel. The containers have standardized
dimensions. They can be loaded and unloaded, stacked,
transported efficiently over long distances, and transferred
from one mode of transport to another—container ships,
rail transport flatcars, and semi-trailer trucks—without
being opened. The handling system is completely
mechanized so that all handling is done with cranes and
special forklift trucks. All containers are numbered and
tracked using computerized systems.
COPINO COPINO is an UN/EDIFACT message that is used by the
inland carrier to notify the Terminal he will come to pick
up and/or deliver a container. Inland transport is mainly
by truck, but the message is also suitable for a
pre-notification of inland barges and rail operators.
Originally the pre-notification was only meant to pick up
the containers: “COntainer PIck-up NOtice”, hence the
acronym “COPINO”. (www.portofantwerp.com)
COPRAR COPRAR is an UN/EDIFACT message that is used by
the shipping company or his ship’s agent to instruct the
Terminal operators which containers can be loaded
(“COPRAR/Load”) of discharged
(“COPRAR/Discharge”). (www.portofantwerp.com)
Customs Customs is an authority or agency in a country responsible
for collecting customs duties and for controlling the flow
of goods, including animals, transports, personal effects,
and hazardous items, into and out of a country.
Demurrage
Charges
This charge will be levied when the Customer holds
containers inside the terminal for longer than the agreed
free days and is applicable to all containers that remain at
the terminal longer than the agreed free time.
(www.cma-cgm.com)
ii

Glossary
Detention
Charges
Detention charges will be levied when the Customer holds
containers outside the terminal longer than the agreed free
time : it is applicable throughout the duration of
Customer’s possession of container(s) in his custody, and
until its safe return to the shipping line.
(www.cma-cgm.com)
Detention &
Demurrage
Charges
Detention & Demurrage charges will be applicable for
shipments wherein customers have exceeded the standard
free time applicable both in the import & export cycles.
(www.cma-cgm.com)
Dry port A Dry Port is an inland intermodal terminal directly
connected to seaport(s) with high capacity transport
mean(s), where customers can leave/pick up their
standardised units as if directly to a seaport. (Leveque
and Roso, 2002)
Dwell time The time cargo remains in a terminal’s in-transit storage
area while awaiting shipment by clearance transportation.
(Collins English Dictionary)
Extended gate An extended gate is an inland intermodal terminal
directly connected to seaport terminal(s) with high
capacity transport mean(s), where customers can leave or
pick up their standardised units as if directly with a
seaport, and where the seaport terminal can choose to
control the flow of containers to and from the inland
terminal. (Veenstra et al., 2012)
iii

Glossary
Freight
forwarder
A freight forwarder is an individual or company that
dispatches shipments via asset based carriers and books or
otherwise arranges space for those shipments. Common
carrier types could include waterborne vessels, airplanes,
trucks or railroads. Freight forwarders typically arrange
cargo movement to an international destination. Also
referred to as international freight forwarders, they have
the expertise that allows them to prepare and process the
documentation and perform related activities pertaining
to international shipments. Some of the typical
information reviewed by a freight forwarder is the
commercial invoice, shipper’s export declaration, and
other documents required by the carrier or country of
export, import, or transshipment. Much of this
information is now processed in a paperless environment.
As an analogy, freight forwarders have been called travel
agents for freight. (http://www.wcscargo.com)
Globalization Globalization (or globalisation) is the process of
international integration arising from the interchange of
world views, products, ideas and other aspects of culture.
Advances in transportation and telecommunications
infrastructure, including the rise of the telegraph and its
posterity the Internet, are major factors in globalization,
generating further interdependence of economic and
cultural activities.
Intermodal
freight
transport
Intermodal freight transportation is defined as a particular
type of multimodal transportation where the load is
transported from an origin to a destination in one and the
same intermodal transportation unit (e.g. a TEU
container) without handling of the goods themselves when
changing modes. (Crainic and Kim, 2007)
Merchant
haulage
Merchant’s haulage is when the pre and end haulage is
carried out by the shipper and the receiver of a container,
respectively. (http://www.logisticsglossary.com/)
iv

Glossary
Multimodal
transport
Multimodal freight transportation is defined as the
transportation of goods by a sequence of at least two
different modes of transportation (UNECE, 2009). The
unit of transportation can be a box, a container, a swap
body, a road/rail vehicle, or a vessel. As such, the regular
and express delivery system on a regional or national
scale, and long-distance pickup and delivery services are
also examples of multimodal transportation. (SteadieSeifi
et al., 2014)
ISO container An ISO container is a container with strength suitable to
withstand shipment, storage, and handling. ISO
containers range from large reusable steel boxes used for
intermodal shipments to the ubiquitous corrugated boxes.
In the context of international shipping trade, ”container”
or ”shipping container” is virtually synonymous with
”(standard) intermodal freight container” (a container
designed to be moved from one mode of transport to
another without unloading and reloading).
Shipper The person for whom the owners of a ship agree to carry
goods to a specified destination and at a specified price.
The merchant who can be consignor, exporter, or seller
(who may be the same or different parties) named in the
shipping documents as the party responsible for initiating
a shipment, and who may also bear the freight cost.
(http://www.oocl.com)
TEU Abbreviation for twenty-foot equivalent unit: a standard
measure for a container for transporting goods, used to
calculate how many containers a ship can carry, or a port
can deal withtwenty-foot equivalent unit: a standard
measure for a container for transporting goods, used to
calculate how many containers a ship can carry, or a port
can deal with. (http://dictionary.cambridge.org)
The first time each term is used in text is shown in Italics.
v


Clarification of Contributions
This dissertation is the result of a collaboration between myself (Panagiotis Ypsilan-
tis), my promotors (Prof. dr. Rob Zuidwijk, Prof. dr. Leo Kroon) and Assoc. Prof.
Jan van Dalen. My promotors offered advice and guidance throughout the entire
process and made suggestions for additions and improvements. For each chapter, the
contributions were as followed:
• Chapters 1, 2 & 6: Written by myself, improved over several rounds based on
feedback and advice by my promotors.
• Chapter 3: The initial research ideas resulted from brainstorming sessions be-
tween myself and my promotor Prof. Rob Zuidwijk. My role was to perform
literature review, perform data collection and data analysis, develop and test
the quantitative models, and write the chapter. After producing the first ver-
sion, the paper was shared with Assoc. Prof. Jan van Dalen who provided
constructive feedback and suggestions on the presentation and contents of the
paper that were incorporated in later versions.
• Chapter 4 and 5: The initial research ideas resulted from brainstorming sessions
between myself and my promotor Prof. Rob Zuidwijk. My role was to perform
literature review, develop and test the quantitative models and the solution
procedure, and write the chapter. The chapters resulted in its current form
after several rounds of feedback and suggestions of my promotors Prof. Rob
Zuidwijk (during the full development of the chapter) and Prof. Leo Kroon
(later versions of the chapter), that were incorporated in the final version of
the chapters.
i


1 Introduction
Globalization has led to a tremendous growth in international trade over the last
century, from $296 billion in 1950 to $18.8 trillion in 2014 (World Trade Organiza-
tion / www.wto.org). At the same time, companies have transformed into global or
multinational corporations that aim to deploy their global supply chains by sourcing
materials, producing goods, and satisfying demand around the world in the most
efficient way. This has led to a vast increase in international transportation. Several
actors are involved in international trade and transportation, such as shippers, ship-
ping lines, inland carriers, truckers, seaport and inland terminals, freight forwarders,
financial institutions, customs, distribution centers, and warehouses.
Fig. 1.1 illustrates the international container transportation process. The figure
depicts the physical movement of containers from their origin to their destination,
through the network of depots, storage yards and inland and seaport terminals.
Inland and sea carriers provide the transport between the nodes of the network.
Moreover, the figure depicts how all other actors involved in the process that enable
the international transport of containers are linked and interconnected in the global
container transport process.
Nowadays, approximately 90% of non-bulk cargo is transported via shipping con-
tainers (Ebeling, 2009). Containers are boxes with standardized dimensions. The
capacity is usually measured in Twenty Feet Equivalent units (TEUs), which is a
steel box 6.06 meters long, 2.44 meters wide, and 2.59 meters high. The container-
ization of cargo, in which cargo is loaded into containers, has supported and enabled
the vast increase in international trade volumes by allowing the efficient international
transport of cargo over long distances. The use of standardized loading units enables
the effective handling, storage and transport of cargo with different modalities like
ships, trains, barges, and trucks. Moreover, the use of standardized boxes simplified
the transfer between modes, so the notion of intermodal transportation emerged. In-
termodal transportation refers to shipping cargo successively using multiple transport
modes.
1

Chapter 1 Introduction
Figure 1.1: Global Freight Transportation (Source: Van Baalen et al. (2009))
International transportation is done via sea, air, or land modes when transportation
is done completely over land. The dominant container transport mode measured
in TEU-km is maritime. Shipping lines or carriers, responsible for this part of the
transport chain, operate big container vessels and connect deep sea terminals around
the globe. Economies of scale have driven an increase in the size of container vessels;
the biggest vessel built in 2014 has a capacity of 19,000 TEUs. The increasing size
of vessels puts pressure on the major seaport terminals that can handle these mega-
vessels since handling big vessels requires specific equipment, e.g. sea cranes, and
requires specific port infrastructure, e.g. water depth. Moreover, storage capacity in
their yard is usually limited and difficult to expand, and the infrastructure connect-
ing the seaport area with its hinterland, via roads, rail and waterways, has limited
capacity. So, seaport terminal operators are interested in the effective utilization of
transport infrastructure connecting to the hinterland and in the reduction of the time
that containers stay in their yard.
The first and the last legs of the international door-to-door transportation chain,
usually from the port to the hinterland destination and vice versa, generate a big
share of the total transportation costs and total lead time, although the distance to
be covered in these legs is just a small portion of total distance. Several processes
and actors are involved and several transportation schemes have been proposed to
2

Introduction
accommodate the needs of this part of the transportation chain. Trucking is still
the dominant modality used in the port-hinterland services in Europe, but inter-
modal, rail-road and barge-road schemes are emerging. The successful execution of
port-hinterland multimodal networks lies in the effective design of a high capacity
hinterland network and the services associated with it, as much as coordination issues
among the different actors involved.
From an economics point of view, the inland dynamics are considered a driver to port
development, and hinterland connectivity is a main fundament in the competitive
position of a port. This development phase is characterized as “port regionalization”
(Notteboom and Rodrigue, 2005). The port-hinterland networks can be represented
in three dimensions: the macro-economic, the physical, and the logistical (Notteboom
and Rodrigue, 2007). Since the objective is a functionally integrated hinterland,
efforts must be put into developing high capacity corridors to the hinterland. Ports
are interested in more than their captive service regions, which are close, and compete
with neighboring ports on contestable hinterlands in order to attain a larger share
of container flows through their networks. This is the case for almost all seaports
within the Le Havre - Hamburg range, the hinterland of which is overlapping more.
There are currently several actions taken in Europe to improve the hinterland trans-
portation of cargo. For example, in 2015 the TEN-T policy has been initiated for
eleven major inland corridors in Europe (see Fig. 1.2). The policy includes work
plans for these 11 corridors until 2030, and include actions to enhance modal in-
tegration, cross-border connectivity, sustainability, safety and innovation in freight
transportation.
This thesis was part of the research agenda of the ULTIMATE project. The Ultimate
project aimed towards efficient multimodal hinterland networks, and had a multidis-
ciplinary research agenda. An overview of the project can be found in Veenstra and
Zuidwijk (2015). The project focused on four research streams, that varied from
assessing the consequences of integrating transport and cargo handling activities in
supply chains, to the legal consequences of mixing transport and storage activities, to
investigating the role and position of port authorities vis-a-vis the activities of con-
tainer terminals, and to integrating new business models in the design of hinterland
networks. The latter was the core scope of the research presented in this thesis.
Considering the above, we conclude that the reinforcing cycle of containerization,
economies of scale in operations, and the growth of international trade has resulted in
an increased pressure on hinterland intermodal systems, which justifies the systematic
3

Chapter 1 Introduction
Figure 1.2: Map of TEN-T corridors in Europe (Source: ec.europa.eu/)
study of its design, planning, and execution. Given the motivation for this study,
in Section 1.1 we introduce the freight intermodal transportation topic at the port-
hinterland level. Section 1.2 provides a brief overview of the research scope and
objectives of this thesis. Finally, in the last section we provide a reading guide to
this thesis and we formulate the research questions that will be addressed in this
thesis.
1.1 Port-Hinterland freight intermodal transportation
Freight intermodal transportation usually refers to the container transport using
multiple modes successively to connect the consignor of cargo to its consignee (Crainic
and Kim, 2007). Several studies consider the environmental effects of transportation
and thrive to propose sustainable intermodal network designs (Bauer et al., 2009).
Northern Europe is densely populated by intermodal inland terminals, as shown in
Fig. 1.3, and usually inland terminals are connected with seaport areas via waterways
and rail networks with high capacity transport means.
Freight transportation with barges or trains always involves a combination of trans-
port modes, and is therefore referred as combined transport. The main haulage be-
4

1.1 Port-Hinterland freight intermodal transportation
Figure 1.3: Map of intermodal inland terminals in Europe (Source:www.inlandlinks.eu) The data set of inland terminals is incomplete.
5
Chapter 1 Introduction
tween the seaport and the inland terminal is performed by the high capacity modes,
trains or barges, and the pre- and end-haulage is done by trucks (Fremont and Franc,
2010). Combined transport is enabled by several actors involved; a seaport termi-
nal, an inland terminal, inland multimodal carriers, and a forwarder that usually
orchestrates the transport. The international transportation process and the actors
involved are depicted in Fig. 1.1. The uni-modal port-hinterland transportation, via
trucks, has shifted to intermodal combined transportation that requires one or more
transshipments of containers between modes at inland terminals.
Usually some break-even distances exist for which each transport mode becomes
economically effective. Current literature suggests that for relatively short distances
direct trucking results in lower costs than combined transport if one considers the
extra crane moves and the final transportation via trucks to the final destinations
(Janic, 2007). On the contrary, business examples suggest that combined transport
can be efficient even for relatively short distances, in case high capacity modes are
effectively utilized and when container storage and handling is well embedded in the
supply chain design. These break-even distances can vary depending on the external
costs of intermodal and road transportation. By internalizing external costs, EU
policies may reduce the break-even distances of intermodal transportation. External
costs that could be internalized include emissions, congestion, noise, etc. Moreover,
national governments and port authorities impose regulations on the modal spit for
the import and export of containers at major seaport terminals.
Better hinterland connectivity can be achieved by considering several different busi-
ness models; cooperation between different actors, vertical or horizontal alliances
among supply chain players are the most common practices followed in the inter-
national shipping industry (Notteboom and Merckz, 2006). Nowadays, the different
actors in the supply chain do not have distinctive roles in the transportation chain,
and their roles usually overlap. One particular example is the changing role of con-
tainer terminals from “node operators” to “flow operators” as stated in Veenstra and
Zuidwijk (2010) for both the seaport and inland container terminals, and by the
many examples of investments of shipping lines in container terminals.
The inland transport of containers is performed under several governance structures.
The most common are carrier haulage and the merchant haulage; in case of the
former, containers are transferred to hinterland locations under the responsibility
and customs license of shipping lines while in case of the latter, containers are moved
under the responsibility of inland carriers with the custom license of the shippers
6

1.2 Research scope and objectives of the thesis
or their representatives. During the last years, more haulage schemes and concepts
have been developed; Notteboom (2008) has identified for the port of Antwerp a
new haulage concept, the terminal operator haulage in which terminal operators can
consolidate and transport flows of different shipping lines to hinterland destinations
under their responsibility and customs license; this concept relies on the cooperation
between seaport terminals and shipping lines, inland carriers and terminals. There
are several business practices followed by both seaport and inland container terminals
that resemble the terminal operator haulage concept.
To facilitate a better port-hinterland connectivity, the “Extended Gate” (Veenstra
et al., 2012) and “Dryport” (Roso et al., 2009) concepts emerged and are developed
in concrete business models, in several regions around the world. According to these
concepts, the seaport and the inland terminals, respectively, extend their role from
node operators and claim the roles of inland carriers by providing transport services.
Such concepts are used to enhance the competitive position of seaport and inland
terminals respectively by providing better hinterland connectivity to selected desti-
nations. Moreover, seaport terminals engage in extended gate concepts to boost their
storage capacity by pushing containers immediately after their discharge to inland
terminals, while postponing customs clearance and other added value activities to
the inland terminals. Moreover, such concepts are in favor of a modal split shift
to more sustainable transport modes while leading to several other benefits for the
actors involved that are discussed later in this thesis.
1.2 Research scope and objectives of the thesis
The aim of this thesis is to quantitatively and qualitatively address research questions
that support the tactical design of port-hinterland multimodal container transport
networks. In particular, we analyze the design of port-hinterland multimodal net-
works, while considering the extended gate and dryport concepts. The design for such
networks is evaluated not only according to their economic performance but also ac-
cording to other performance measures like sustainability, reliability, and service level
offered to customers.
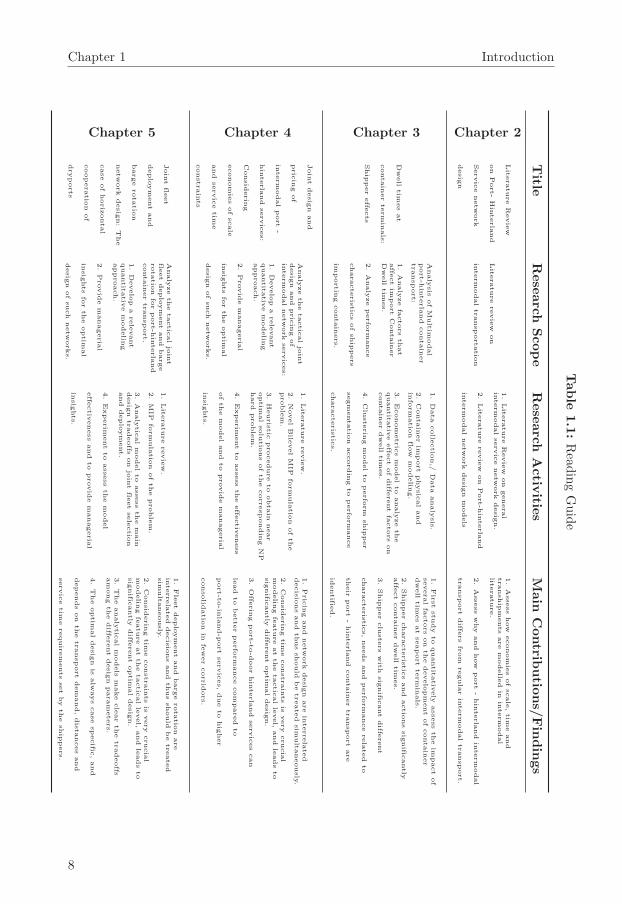
To facilitate the reader, we provide in Tab. 1.1 a reading guide of this thesis.
We formulate three main research objectives and briefly elaborate on their motivation.
Each research objective is addressed separately in a chapter of this thesis, where
relevant literature, methodology used, models developed, and results are presented.
7
Chapter 1 IntroductionTable
1.1:Read
ingGuide
Title
Research
Scope
Research
Activ
ities
Main
Contrib
utio
ns/
Findings
Chapter 2
Literature
Revie
w
on
Port-Hin
terla
nd
Servic
enetwork
desig
n
Literature
revie
won
interm
odaltransportatio
n
1.
Literature
Revie
won
general
interm
odalservic
enetwork
desig
n.
2.
Literature
revie
won
Port-h
interla
nd
interm
odalnetwork
desig
nm
odels
1.
Assess
how
econom
ies
ofscale
,tim
eand
tranship
ments
are
modelle
din
interm
odal
literature.
2.
Assess
why
and
how
port
-hin
terla
nd
interm
odal
transport
diffe
rs
from
regula
rin
term
odaltransport.
Chapter 3
Dwell
tim
es
at
contain
er
term
inals:
Ship
per
effe
cts
Analy
sis
ofM
ultim
odal
port-h
interla
nd
contain
er
transport:
1.
Analy
ze
factors
that
affe
ct
import
Contain
er
Dwell
tim
es.
2.
Analy
ze
perfo
rm
ance
characteristic
sofship
pers
importin
gcontain
ers.
1.
Data
colle
ctio
n,/
Data
analy
sis.
2.
Contain
er
import
physic
aland
info
rm
atio
nflo
wm
odelin
g.
3.
Econom
etric
sm
odelto
analy
ze
the
quantitativ
eeffe
ct
ofdiffe
rent
factors
on
contain
er
dwell
tim
es.
4.
Clu
sterin
gm
odelto
perfo
rm
ship
per
segm
entatio
naccordin
gto
perfo
rm
ance
characteristic
s.
1.
First
study
to
quantitativ
ely
assess
the
impact
of
severalfa
ctors
on
the
develo
pm
ent
ofcontain
er
dwell
tim
es
at
seaport
term
inals.
2.
Ship
per
characteristic
sand
actio
ns
sig
nific
antly
affe
ct
contain
er
dwell
tim
es.
3.
Ship
per
clu
sters
with
sig
nific
ant
diffe
rent
characteristic
s,needs
and
perfo
rm
ance
rela
ted
to
their
port
-hin
terla
nd
contain
er
transport
are
identifie
d.
Chapter 4
Join
tdesig
nand
pric
ing
of
interm
odalport
-
hin
terla
nd
servic
es:
Consid
erin
g
econom
ies
ofscale
and
servic
etim
e
constrain
ts
Analy
ze
the
tactic
aljo
int
desig
nand
pric
ing
of
interm
odalnetwork
servic
es:
1.
Develo
pa
rele
vant
quantitativ
em
odelin
gapproach.
2.
Provid
em
anageria
l
insig
hts
for
the
optim
al
desig
nofsuch
networks.
1.
Literature
revie
w.
2.
NovelBile
velM
IPfo
rm
ula
tio
nofthe
proble
m.
3.
Heuristic
procedure
to
obtain
near
optim
alsolu
tio
ns
ofthe
correspondin
gNP
hard
proble
m.
4.
Experim
ent
to
assess
the
effe
ctiv
eness
ofthe
modeland
to
provid
em
anageria
l
insig
hts.
1.
Pric
ing
and
network
desig
nare
interrela
ted
decisio
nsand
thusshould
be
treated
sim
ultaneously
.
2.
Consid
erin
gtim
econstrain
ts
isvery
crucia
lm
odelin
gfe
ature
at
the
tactic
alle
vel,
and
leads
to
sig
nific
antly
diffe
rent
optim
aldesig
n.
3.
Offe
rin
gport-t
o-d
oor
hin
terla
nd
servic
es
can
lead
to
better
perfo
rm
ance
com
pared
to
port-t
o-in
land-p
ort
servic
es,due
to
hig
her
consolid
atio
nin
fewer
corrid
ors.
Chapter 5
Join
tfle
et
deplo
ym
ent
and
barge
rotatio
n
network
desig
n:
The
case
ofhoriz
ontal
cooperatio
nof
dryports
Analy
ze
the
tactic
aljo
int
fleet
deplo
ym
ent
and
barge
rotatio
nfo
rport-h
interla
nd
contain
er
transport.
1.
Develo
pa
rele
vant
quantitativ
em
odelin
gapproach.
2.
Provid
em
anageria
l
insig
hts
for
the
optim
al
desig
nofsuch
networks.
1.
Literature
revie
w.
2.
MIP
form
ula
tio
nofthe
proble
m.
3.
Analy
tic
alm
odelto
assess
the
main
desig
ntradeoffs
on
join
tfle
et
sele
ctio
nand
deplo
ym
ent.
4.
Experim
ent
to
assess
the
model
effe
ctiv
eness
and
to
provid
em
anageria
l
insig
hts.
1.
Fle
et
deplo
ym
ent
and
barge
rotatio
nare
interrela
ted
decisio
ns
and
thus
should
be
treated
sim
ultaneously
.
2.
Consid
erin
gtim
econstrain
ts
isvery
crucia
lm
odelin
gfe
ature
at
the
tactic
alle
vel,
and
leads
to
sig
nific
antly
diffe
rent
optim
aldesig
n.
3.
The
analy
tic
alm
odels
make
cle
ar
the
tradeoffs
am
ong
the
diffe
rent
desig
nparam
eters.
4.
The
optim
aldesig
nis
alw
ays
case
specific
,and
depends
on
the
transport
dem
and,distances
and
servic
etim
erequirem
ents
set
by
the
ship
pers.
8

1.2 Research scope and objectives of the thesis
Research Objective 1
The first objective of this thesis is to assess the implications of different shippers’
characteristics on combined port-hinterland transportation. Shippers organize differ-
ently their supply chains and may have different priorities over costs, service times,
modal choice, and other service characteristics as offered by carriers. To address
this objective, we conceptualize the physical import container process next to the
information flows among the actors involved. Then we collect and analyze data to
study empirically the differences among shippers, modalities, container dwell times,
and other performance characteristics.
Research Objective 1. Analyze the combined transport process for port-hinterland
container transport based on empirical data. Assess the main performance char-
acteristics of shippers using combined transportation. More specifically, determine
which characteristics of shippers influence container dwell times.
The first objective seeks to identify the shipper characteristics that drive modal choice
and differentiated service time needs. Our analysis covers the container cycle from
discharge of full containers at the seaport terminal to the return of empty containers
at the inland terminal. The main determinants of container dwell times in seaport and
inland container terminals are qualitatively and quantitatively examined. In Chapter
3, a model is developed that explains and predicts dwell times at container terminals.
In particular, 48% of the dwell time variance is explained by factors related to the
shippers involved. In contrast to the common assumption that the container terminal
performance is the main determinant of dwell times, we show that factors exogenous
to the container terminal determine dwell times. To the best of our knowledge,
this is the first study that quantitatively assesses the impact of such factors. Our
results show connections between dwell times and time criticality, and the value
of information in the reduction of dwell times. The assumption that dwell time
performance can be treated as a purely endogenous capacity performance criterion
of seaport terminals is challenged. Moreover, clusters of shippers are identified with
different characteristics and different performances in terms of dwell times and modal
choice.
The above results from Chapter 3, which identify the main determinants of container
dwell times to be shipper related, motivate the research performed in the next chap-
ters. In particular, we consider three elements to be crucial for the effective design
of port-hinterland networks: The different actors involved, the resulting service level
offered (measured either by expected service times or by service frequency), and the
9

Chapter 1 Introduction
expected cost of the proposed services which is usually dependent of the achievement
of economies of scale.
Research objectives 2 and 3
Current research on intermodal network design mainly considers the objective of
one actor which may be the shipper or the carrier. On the one hand, in case of
the network design from a shipper perspective, it might be sufficient to use models
that select services, modes and routes offered by a collective of carriers that would
minimize their expected total logistic cost while satisfying their time constraints. On
the other hand, when network design is considered from a carrier perspective, the
carrier should design its services at a tactical level while anticipating the demand
of a collective of shippers and their service time requirements. So, for the latter
case, the resulting service level received by the users of the services should always
be incorporated. Moreover, consolidation opportunities exist that can enable the
achievement of economies of scale. The achievement of economies of scale and the
establishment of frequent connections, with lower costs and expected service times
for shippers, mainly drives the market penetration of combined transport services
and makes them competitive to uni-modal road transport.
Considering the above, we set up two more research objectives that relate with the
development of models suitable for the design of port-hinterland services and that
incorporate our findings from Chapter 3.
Our second research objective relates to the design of a multimodal hinterland net-
work according to the Extended Gate concept as it is implemented by a major seaport
terminal in the Netherlands, but its scope can be generalized to the joint pricing and
design of high capacity shuttle services between seaport and inland terminals.
Research Objective 2. Establish a model to design a multimodal hinterland transport
network at the tactical level, by establishing shuttle services of high capacity modes
between seaport terminals and inland container terminals. The model should balance
costs faced by the carrier, and costs and service levels faced by the shippers that
arise from the network design related decisions, such as the optimal mode size, the
frequency of connections and pricing of services. The design of such a network and in
particular the tariffs and the expected service times establish the market penetration
of proposed services, while considering services offered by competitors.
In Chapter 4, a bi-level MIP model to jointly design and price extended gate network
10
1.2 Research scope and objectives of the thesis
services for profit maximization is proposed. The model considers cost, demand data,
and other relevant parameters and proposes the optimal design and pricing of such
services at a tactical level. The design comes down to the selection of the optimal sizes
of transport modes and the optimal frequency of connections at each corridor. At the
same time, the optimal tariffs for the services offered to customers are determined.
Together with the expected service times at each corridor, that are connected with
the frequency of connections, they determine the market penetration of the proposed
services in consideration with transportation services offered by competitors.
On the technical side, the model extends previous bi-level formulations and proposes
a heuristic that provides near optimal solutions to this NP hard problem. On the
managerial side, we study optimal network designs while comparing seaport-to-door
and seaport-to-inland port services and situations where transit time requirements do
and do not apply. Our results show that there are significant differences in the optimal
network designs under the different assumptions, and moreover they show that there
is a significant interaction between the design and the pricing on such networks. It
follows that the two decisions should be treated simultaneously and one should try
to capture the corresponding trade-offs among revenue management, economies of
scale and service level offered to customers. The interaction between the design and
pricing of network services and service level offered to customers is not limited to the
extended gate case studied but may be relevant in a lot of network design cases, like
the design of public transport services, where the expected transport time, frequency
of connections, and tariffs directly affect the modal choice of customers.
Our third research objective relates to other cases, where point-to-point shuttle ser-
vices may not be a viable option, and consolidation is best achieved by the rotation
of resources, like barges, trains and trucks along terminals, hubs etc.
Research Objective 3. Establish a model to design a multimodal hinterland transport
network at the tactical level, by establishing rotation services of high capacity modes
along seaport terminals and inland terminals. The model should design the optimal
fleet and its deployment on a network, in such a way that costs are minimized while
demand is satisfied and expected service levels required by the shippers are met.
In Chapter 5, we consider a case where the optimal fleet is selected and its deployment
on a network of inland terminals is explored. In particular we study the design of a
multimodal hinterland network according to the Dryport concept as it is implemented
by a major alliance of inland terminals in the Netherlands, but its scope can be
generalized to the joint fleet selection and routing of high capacity modes in a network
11

Chapter 1 Introduction
consisting of seaport and inland terminals. The model considers cost, demand data,
and other relevant parameters, and proposes the joint optimal fleet mix and routing
over the network at a tactical level. It minimizes costs by optimizing fleet utilization,
both in space and time, and by satisfying expected demand of Origin Destination
pairs and service levels set by the shippers.
On the technical side, we develop both an analytical model and an MIP model that
capture the connections between network design parameters like the number of ve-
hicles, their size and their routing and performance measures like the total cost, the
capacity installed and network coverage. The MIP model aims to support tactical
decisions regarding: the fleet size and mix selection, the routing of the fleet over the
network for a long time horizon in order to satisfy demand under some service time
related constraints and, the assignment of container flows to given services in order
to assess the performance of the proposed network design. On the managerial side,
the model is applied to a real case of an alliance of closely located dryports that con-
nect with container terminals in a seaport area. We study the impact of cooperation
of closely located dryport terminals in terms of sharing transport capacity in both
cost and service quality performance. Moreover, we show that although decisions
regarding the optimal fleet mix and its deployment are usually treated separately,
are actually interrelated and should be treated simultaneously.
12
2 Literature Review on Intermodal
Service Network Design
Summary: In this chapter, we go through the general intermodal service network
design literature and we discuss how literature is divided according to the plan-
ning levels and problems on hand, while we provide references to extensive literature
reviews on the topic. In the following sections, we go into more detail of the model-
ing techniques used in the literature to incorporate crucial elements to the effective
network design. These elements are the consideration of time in modeling, the for-
mulation of economies of scale and the consideration of transshipments. We review
them in Sections 2.2., 2.3. and 2.4 respectively. Finally, in Section 2.5 we discuss how
and why port - hinterland service network design differs from usual service network
design and why the effective consideration of the elements mentioned above is cru-
cial while we review contributions of literature that focus on port-hinterland network
design.
2.1 Intermodal Service Network Design
In this section, we go through the most relevant literature to our research and position
our work accordingly. First, we go through some general literature on the supply side
of freight transportation networks and then we review streams of literature that we
consider relevant for the port-hinterland network design and in particular for the
modeling approaches we follow in the next chapters. Our literature review is not
exhaustive but focuses on specific modeling features that could be applied or adapted
to facilitate the port hinterland multimodal network design. The development of
the supply side of container transport networks has been studied extensively in the
literature and is widely known as the service network design problem. Such problem
formulations are increasingly used to designate the tactical issues of carriers (Crainic,
2000).
13
Chapter 2 Literature Review on Intermodal Service Network Design
Some recent overviews of the intermodal freight planning research are conducted
by Macharis and Bontekoning (2004), Crainic and Kim (2007), Caris et al. (2008),
Wieberneit (2008) and SteadieSeifi et al. (2014). The authors divide the contribu-
tions in the field according to the time horizon in strategic, tactical and operational
models. Strategic decisions in intermodal transportation usually are long term de-
cisions regarding node and network infrastructure and configurations, infrastructure
investments, cooperation among companies, and terminal design. Tactical decisions
are medium term, and relate to capacity setting of resources, infrastructure and labor,
configuration of consolidation networks, pricing strategies, and allocation of shippers
and receivers on a terminal. Operational decisions in this context are in a dynamic
and stochastic environment and come down to vehicle routing, assigning containers
to specific transport itineraries, resource allocation, scheduling of jobs, redistribution
of resources and assets, etc. Decisions at the strategical and tactical levels though
can have a significant effect on the operational performance of such networks. The
models proposed in literature are most of the time between the tactical and the op-
erational level. Although tactical level problems are treated like the planning of fleet
composition and capacity deployment, most models seem to focus on the minimiza-
tion of operational cost while meeting operational time constraints of deterministic
instances.
Moreover, most research in intermodal transportation assumes hub and spoke net-
work topologies while very few consider other network topologies like direct links,
corridors, connected hubs, static or dynamic routes that could in several cases depict
reality better (SteadieSeifi et al., 2014).
Modeling intermodal transport systems effectively, in an operational, tactical or
strategic levels, is a challenging task. The consideration of different modalities with
their respective sizes, fixed and operational cost, speeds, handling and service times,
and transshipments in intermediate terminals influence the operational performance
and complicate the problem formulation since each characteristic has a different effect
on the performance of the designed services.
In the context of pre-haulage or end-haulage intermodal transportation, that is from
the seaport to the inland destination and vice versa, three elements seem to be the
most vital for the effective representation of such systems. These are the consideration
of the time dimension in modeling, the formulation of economies of scale through
consolidation opportunities, and the consideration of transshipments in modeling.
Below we discuss relevant literature on the modeling of each element separately, in
14

2.2 Consideration of time in intermodal transport
Sections 2.2, and 2.3 respectively. Finally in Section 2.4 we go through the most
relevant port-hinterland service network design literature, and position our modeling
work (in Chapters 4 and 5) accordingly.
2.2 Consideration of time in intermodal transport
The consideration of time in intermodal transport models constitutes a major re-
search challenge (Crainic and Kim, 2007), mainly because the resulting models be-
come computationally intractable. The use of time in such models is twofold. First,
efficient asset management requires the scheduling, coordination and routing of trans-
port modalities, that in its turn affects asset utilization over time. Second, different
network configurations (mode speed, frequency of services, number of stops, trans-
shipments) can lead to considerably different results in terms of expected service
times, since service times consist of transport, handling, dwell times and delays.
Especially for the case of port-hinterland transportation, the market penetration of
combined transport services compared to trucking may not only depend on cost but
also on service times.
The time dimension in service network design is usually incorporated at the oper-
ational level by considering time windows for the pick up and delivery of cargo, or
to satisfy coordination restrictions that apply in some problems, i.e., establishing
transfer times between arrivals and departures of modes at a node. This can be
done either by applying penalty cost for late deliveries or by imposing hard due date
constraints. Contrary to the operational level models, in strategic and tactical level
models the time dimension should be used to depict the expected time utilization of
assets and the service time performance of services, and capture the effects of compe-
tition. Shippers tend to choose their carriers based on the perception of the service
quality and price that they will receive (Crevier et al., 2012). In the intermodal
network design, the service quality perception can be associated with the service
times of intermodal paths which depend among others on the frequency of services
(Li and Tayur, 2005). It follows that the market penetration of combined services
depends also on the tactical and strategic design of such networks in addition to their
operational performance.
Very few modeling contributions at a tactical level seem to take the time dimension
explicitly into account, since space-time formulations are mainly at the operational
level. In Crainic (2000) the main service network design formulations are reviewed;
15
Chapter 2 Literature Review on Intermodal Service Network Design
the service level is considered by the application of minimum frequency constraints
on specific links over the network. Such formulations cannot capture the demand
penetration of a carrier based on the service level offered. In order to capture this
effect, multi-commodity formulations with differentiated characteristics among the
commodities should be developed. In Crainic and Rousseau (1986) this interaction
is captured by considering unit delay cost in the objective function differentiated per
commodity which depend on both connection frequency delays and transit times in
each link over the network. First, unit delay cost can be difficult to approximate for
each commodity, compared to setting a desired service time or a minimum frequency
constraint per commodity. Second, the routing of containers in the network may rely
substantially on the values of the penalty delay cost compared to the cost structure
over the network, but still the potential of losing some market to competition is not
captured in such models. Li and Tayur (2005) consider the expected total service
time constraints set by the clients of the network. They model frequency dependent
service times on paths, that consist of link, capacity and frequency delays. The service
frequency on the links is then bounded from below to satisfy the time constraints
set by the clients. The last formulation of service level constraints seems to be the
most considerable if interested in the differentiation of total expected service times
of intermodal transport alternative options.
2.3 Network flows and economies of scale
Economies of scale are usually incorporated in Hub and Spoke network formulations.
Most of these contributions apply a discount factor a, 0 ≤ a ≤ 1, to the unit trans-
portation cost between any two of the selected nodes of the network that will act as
hubs. This simplistic approach does not take into account the amount of flow that
will pass through the inter-hub link, so post-assessment and post-validation of the
solutions are needed. The above explains the shift to flow dependent economies of
scale. Several authors consider piece-wise linear functions to depict the economies of
scale (O’Kelly and Bryan 1998; Horner and O’Kelly 2001; Klincewicz 2002). Marginal
cost is then positive and decreasing in flow volumes.
Applying the former simplistic approach is considered to be wrong since assuming
that the discount factors are independent of the flows can lead to false hub allocations
and result interpretations (Kimms, 2006). The latter approach with flow dependent
discount factors could be valid if the transportation is performed by a third party.
16

2.4 Consideration of transshipments in intermodal transportation
Kimms (2006) proposes an alternative formulation of economies of scale as a non
continuous increasing function of the flows, with break points denoting the multiples
of the capacity of the mode in reference. In this way, the actual cost faced by a
party operating high capacity modes is more effectively approximated. We agree in
principle with Kimms (2006), but we argue that in port-hinterland transportation
the variable cost per unit transferred is minor compared to the fixed cost associated
with operating (leasing) additional units of high capacity modes such as barges and
trains; that is why the slope of the piece-wise linear parts of the function should be
close to zero.
Of course economies of scale are already embedded in models that allow the fleet
selection in the sense that cost for buying or leasing assets like vessels, river vessels
of trains are not linear in their respective sizes.
2.4 Consideration of transshipments in intermodal
transportation
Transshipment is the process at a terminal to shift flow from one mode to the other
(Vis and De Koster, 2003). Port - hinterland intermodal transportation, or combined
transport, converts by definition the unimodal transport via trucks to the combined,
barge-truck or train-truck format by adding an extra stop at an inland terminal in
which the transshipment of containers happens from one mode to the other. Ignoring
transshipment in modeling might result in sub-optimal or infeasible solutions (Stead-
ieSeifi et al., 2014). Considering transshipment affects the overall performance of the
system, both in terms of total cost but also in terms of total service time.
In literature, there are several cases where transshipments are not explicitly incor-
porated. When modeled, transshipments usually take the form of a per-unit cost
in the objective function (Gelareh and Nickel, 2011; Hamzaoui and Ben-Ayed, 2011;
Shintani et al., 2007; Ishfaq and Sox, 2012) or the form of a capacity constraints
(Anghinolfi et al., 2011; Meng and Wang, 2011). To the best of our knowledge, there
are no service network design models that explicitly consider the transshipment times.
This might be the case in liner shipping service network design where transshipment
times might be included in the fixed times per stop considered in the models.
In port-hinterland intermodal transportation, it is crucial to consider the transship-
ment cost and times for two reasons; first, it affects the attractiveness of combined
17

Chapter 2 Literature Review on Intermodal Service Network Design
services (total cost and total service time), and second, neglecting transshipments
can result in infeasible designs and underestimated capacity requirements.
2.5 Contributions in Port - Hinterland Network Design
In this section we review papers that specifically handle port-hinterland network de-
sign problems which we argue to be considerably different from problems handled in
general intermodal transportation literature. There are several features that distin-
guish this class of problems. First, in port-hinterland transportation there is almost
always the option of trucking, which is the most dominant mode for hinterland trans-
port due to its flexibility and speed. Considering the above, means that any combined
transport service configuration, barge-truck or train-truck, would have to compete in
both cost and service times with trucking from a shippers perspective, or that truck-
ing could be considered as a recourse action when planning capacities from an inland
carrier perspective. Second, the distance to be covered is usually shorter than the
distances covered in international container transport e.g. liner shipping, and this is
even more the case regarding transport times, where instead of weeks trucking takes
usually less than a day. Considering this, it can be inferred that the other consti-
tutes of total service times, such as dwell times, delays, and transhipment times can
account for a big share to total service time. For this reason it is crucial to explicitly
consider these time elements in the modeling of such systems. Considering such time
and cost elements in the modeling is what differentiates the performance between
the different configurations of combined transport and of trucking and what should
determine market penetration of each service, modal splits, etc. As we show later in
Chapter 3, shippers can have different time needs regarding the inland transport of
their containers ranging from a few hours to several days, that gives room to both
types of services. Formulations in this regime should focus on effectively capturing
these special characteristics of port-hinterland intermodal systems. So, the charac-
teristics of different modalities should be effectively formulated and their utilization
should be assessed both in terms of cost and time. Moreover, the demand penetration
of intermodal services compared to that of uni-modal truck transport should also be
assessed both in terms of cost and of service times from the customer’s perspective.
Contributions that could exclusively focus on the port-hinterland tactical intermodal
network design area are still limited. Relevant literature includes models focusing on
corridor design, line bundling, and the design of hub and spoke networks.
18
2.5 Contributions in Port - Hinterland Network Design
In Tab. 2.1, the main research done for the port-hinterland network design is sum-
marized, and below each paper is briefly discussed. The models considered differ in
several dimensions including the planning level, the mathematical formulation, the
solution approach, and other modeling considerations.
Crainic et al. (2013) discuss the optimization challenges that arise by the development
of the dryport concept and propose a service network design model, in a space-time
network, for the operational rotation planning of barges between seaport and inland
terminals. The size of the problem becomes restrictive even for small and medium
instances due to its space-time format, so commercial solvers fail to find feasible
solutions. Further research on the development of efficient solution methodologies
for such problems in space-time formulations is needed.
Sharypova et al. (2012) develop a continuous time formulation for the scheduled
barge network design problem with synchronization and transshipment constraints.
This model can facilitate the operational planing of barge routing. The heteroge-
neous fleet of barges is routed through the network and the arrival and departure
of each barge at each node are specified under a large set of synchronization and
coordination constraints. Demand that is organized in commodities is assigned to
transport services that satisfy pick up and delivery time windows. The size of the
problem allows the treatment of only very small instances with commercial solvers.
Therefore, Sharypova (2014) develops some meta-heuristic approaches. Problems at
the operational level do not allow for simplifications that reduce the computational
complexity, so heuristic procedures are needed for the solution procedure.
Behdani et al. (2014) develop a model for the scheduling of synchromodal services.
The authors take as given the fleet composition, the capacity and the frequency
of services, and schedule the services such that the overall cost and waiting times
(via penalties) are minimized. Constant unit cost per modality are considered so
economies of scale are not formulated, while several operational constraints are con-
sidered such as opening and closing times of terminals, delivery time constraints,
infrastructure usage constraints, etc.
Caris et al. (2012) adapt the generic path-based multi-commodity network design
formulation of Crainic (2000) to intermodal barge transport by using a concave cost
function to formulate economies of scale for the links operated by barge. The element
of time is ignored in this formulation. The impact of cooperation of barge inland
terminals is assessed only in terms of consolidating flows on some corridors, but an
analysis of overall transport performance and cost or routing are not considered.
19

Chapter 2 Literature Review on Intermodal Service Network Design
Braekers et al. (2012) develop a line bundling MIP model to construct round trips
of barges and assign container flows to round-trips in a tactical time horizon. The
model gets as input the weekly number of trips - thus maximum round-trip time -,
and the number and size of barges. Demand of customers should always be fulfilled
by one round trip and trucking is not considered as a recourse action. The authors
run a number of scenarios to assess the optimal capacity setting on the corridor.
Their results are in favor of bigger barges for the achievement of economies of scale,
but as indicated, barge operators may be in favor of providing higher frequencies in
order for their services to be more attractive to customers.
Van Riessen et al. (2013) proposes a path-based service network design model that
investigates the use of contracted and subcontracted network services for the opera-
tion of an extended gate network at a tactical level, while assuming flexible due dates.
Their findings show that transshipment cost at terminals should be reduced in order
for paths with more than one stop at inland terminals to become cost effective.
Summarizing the literature review, some conclusions can be drawn. Although the
supply side of transport networks have been extensively studied in literature, the
design of port-hinterland intermodal transport systems has only recently grasped
the attention of the academic world. The models proposed are most of the time
between the tactical and the operational levels. Although they aim to support tac-
tical decisions like capacity setting or fleet composition, specific demand instances
are considered and the models are solved based on minimizing operational cost and
meeting operational time constraints. Moreover, most models seem to ignore crucial
factors to the multimodal nature of the problem such as the consideration of time,
or become too computationally intensive when time is taken into account. Moreover,
some do not consider all relevant cost elements.
We suggest that considering total cost and time in such modeling is the most crucial
element for the effective modeling of such systems because this is how combined ser-
vices are differentiated from unimodal road transport which is still the most dominant
and flexible mode in the hinterland. In Chapters 4 and 5 of this thesis, we develop
two models that aim to take explicitly into consideration these elements along with
other elements crucial to the design of port-hinterland network design. The analysis
of the results of these two models clearly shows that there are several interactions
among the design parameters of such networks which are interrelated. Moreover it
is shown that neglecting the time dimension can lead to unrealistic network designs.
In Chapter 4, we develop a model for the joint design and pricing of intermodal shuttle
20

2.5 Contributions in Port - Hinterland Network Design
Table
2.1:Com
parison
ofmodelsin
Port-hinterlan
dnetwork
design
Paper
Obje
ctiv
eForm
ula
tio
nLevel
Modes
Modeling
Consid
eratio
ns
Tim
eSolu
tio
n
Crain
icet
al.
(2013)
Min
imiz
e
operatio
nalcost
Servic
eNetwork
desig
nfo
rbarge
transport
Operatio
nal
Barge
Truck
Space
tim
enetwork
is
consid
ered
Space
tim
enetwork
isconsid
ered
Tim
ewin
dows
Heuristic
procedures
Sharypova
et
al.
(2012)
Min
imiz
e
operatio
nalcost
Contin
uous
tim
e
form
ula
tio
nofthe
servic
enetwork
desig
nproble
m
Operatio
nal
Barge
Routes
are
constructed
Transship
ments
are
allowed
One
round
trip
pervehic
le
Synchroniz
atio
nand
Coordin
atio
nofbarges
Tim
ewin
dows
for
the
pick
up
and
delivery
of
com
moditie
s
Heuristic
procedures
Caris
et
al.
(2012)
Concave
cost
functio
n
(Econom
ies
scale
)
Corrid
or
ND
Path-b
ased
multic
om
modity
network
desig
n
Tactic
al
Barge
Round
trip
sand
cost
giv
en
Not
Ela
stic
dem
and
Not
consid
ered
Com
mercia
l
Solv
er
Braekers
et
al.
(2012)
Optim
alship
pin
g
routes
and
barge
siz
e
ND
modeladapted
for
line
bundling
Tactic
al
Barge
Round
trip
sper
week
giv
en
One
type
ofbarge
No
servic
equality
Tim
eper
round
trip
is
consid
ered
and
bounded
from
above
Com
mercia
l
Solv
er
Van
Rie
ssen
et
al.
(2013)
Capacity
settin
g
on
corrid
ors
Path
based
network
desig
nM
IPm
odel
Tactic
al-
Operatio
nal
Barge
Train
Truck
Self
Operated
and
Sub-c
ontracted
servic
es
Servic
etim
eofpaths
isgiv
en
Fle
xib
ledue
dates
-
Penalty
cost
Com
mercia
l
Solv
er
Behdaniet
al.
(2014)
Min
imiz
e
Transportatio
n
and
waitin
gcost
Synchrom
odal
form
ula
tio
nofone
OD
pair
Operatio
nal
Barge
Train
Truck
Giv
en
Fle
et,capacity
and
Frequency
ofservic
es
Penalty
on
waitin
gtim
es
Com
mercia
l
Solv
er
Chapter
4M
axim
ize
Net
Profit
Join
tcapacity
settin
gand
pric
ing
ofcorrid
ors
3decisio
nactors
Tactic
al
Barge
Train
Truck
Shuttle
servic
es
-No
Rotatio
n
Econom
ies
ofScale
-
Servic
ele
vel
Frequency
dependent
expected
dwell
tim
es
Maxim
um
num
ber
of
round
trip
sgiv
en
Heuristic
procedures
Chapter
5
Min
imiz
e
Transport
and
tranship
ment
cost
Join
tFle
et
Com
positio
nand
Routin
g
Cont.
tim
eM
IP
Tactic
al
Barge
Truck
Severalbarge
round
trip
s
per
tim
ehoriz
on
Utiliz
atio
nofbarges
in
space
and
tim
ele
vels
Com
mercia
l
Solv
er
21

Chapter 2 Literature Review on Intermodal Service Network Design
barge services according to the extended gate concept. The bi-level structure of our
model allows on the first level the capacity setting on corridors by selecting the size of
modalities and frequencies of connections, in parallel with the pricing of the services
offered to customers. On the second level, customers select the minimum cost paths
that satisfy their service time constraints among the ones operated by the extended
gate operator, but also by other transport providers like trucking companies. Both
cost and expected service times on corridors are frequency and mode dependent; so
penetration of combined transport services is achieved both in terms of cost and time.
In Chapter 5, we develop a model to support the tactical joint fleet deployment and
routing of barges in port-hinterland networks. The optimal fleet should be selected
based on its expected operational performance and this is why routing plans for
barges are considered simultaneously. In this sense, the utilization of the fleet should
not only be based on the consolidation of flows but also on the construction of round
trips that achieve low circulation times and thus more round trips per barge within
the planning horizon. Moreover, by considering the routing of the fleet, we look at
the expected service level that shippers of the network will experience by controlling
the minimum frequency per OD pair serviced.
22

3 Dwell Times at Container
Terminals: Shipper Effects
Summary: In this chapter, the variation of dwell times of imported containers to the
hinterland at seaport container terminals via a multimodal network is analyzed. In
contrast to the general belief that container dwell times are mainly a consequence of
container terminal performance, we show that other factors, particularly the actions
performed by shippers, significantly affect container dwell times as well. Ignoring
the effect of such factors can lead to inefficient capacity setting in terminals and to
ineffective measures to alleviate the negative effects of large dwell times. We analyze
a case where containers are transported from a major seaport container terminal in
the Netherlands to its nearby hinterland through a multimodal hinterland network
controlled by an intermodal inland carrier. We analyze the physical and information
flows of imported containers and collect information and milestone time stamps for all
imported containers in the specific region in 2011. A statistical analysis is performed
to assess the main factors that affect dwell times at seaport terminals. The results
show a large effect of shippers’ choices, as reflected by modality, order placement,
and due date, on the magnitude of dwell times.
3.1 Introduction
Container dwell time (CDT) at container terminals (CT) is defined as the time a
container spends at the container terminal yard. In this study we only consider the
dwell times of imported containers. The dwell time of imported containers starts with
their discharge from a deep sea vessel and ends with their loading on a truck, barge,
train or feeder vessel for further transport. Container dwell times are relevant for
assessing the utilization of, congestion in, and efficiency of the terminal. Container
dwell times affect lead times for shippers and the utilization of assets (containers)
for shipping lines, and are thus considered detrimental to the performance of most
23

Chapter 3
stakeholders in the international transport of containers. At the same time, container
dwell times incorporate the slack time needed to perform handling, transhipment,
and other added value operations before a container is loaded to a mode to exit the
terminal, and thus are an integral part of the import and export process.
The capacity of the container terminals in terms of infrastructure and customs fa-
cilities affects the average dwell times of containers. According to Little and Graves
(2008), the expected number of containers stored in a container terminal yard is de-
termined by the product of the average arrival rate of imported containers and their
average dwell time. Thus, shorter dwell times can be associated with the relief of
the container terminal stack such that fewer container reshuffles are needed for the
retrieval of containers (Castillo and Daganzo, 1993).
Dwell times are frequently quoted in studies that assess the performance of seaport
terminals assuming that the container terminals through their operations can have
control over the development of dwell times. Chu and Huang (2005) assume that
the dwell time performance of a container terminal affects its overall capacity, while
Steenken et al. (2004) consider it a performance indicator of the container terminal
yard. Cochrane (2008) discusses dwell times as both a determinant of the yard capac-
ity of a container terminal and as a performance indicator of the container terminal.
Veeke and Ottjes (2002) and Ottjes et al. (2006) use the distribution of dwell times
as input for their simulation model to analyze different layouts for the expansion of
the container terminal in Rotterdam at Maasvlakte 2. In their study the dwell times
and the arrival pattern of containers in a seaport terminal are identified as the main
drivers of the container terminal performance and define the dwell time of containers
as the slack time available for customs inspections. In most of these studies, it is
assumed that container dwell times depend on container terminal performance, ig-
noring other exogenous factors. In reality though, container terminals have limited
control over the development of dwell times, unless the arrival rates of containers
are higher than the capacity installed at the terminal yard. Container terminals can
influence container dwell times by incentivizing shippers, through storage fees, or
allowing shorter free storage periods. Next to these factors we analyze the import
container process and focus on actions and choices made by the shippers that seem
to have a great effect on container dwell times.
In this study, we propose that several other factors, exogenous to the seaport termi-
nal, affect container dwell times. Most of these factors are connected with preferences
and selections made by shippers, like the selection of shipping lines, inland carriers,
24

3.1 Introduction
the contents and value of goods within the containers, the time criticality for deliv-
ering goods, information sharing, and overall the supply chain design of individual
shippers. Some shippers opt for the timely and quick transport of their containers
in order to reduce in-transit and safety inventories. Others use the CT’s yard for
the short or even longer term storage of their containers and apply a Just-in-Time
(JIT) principle while picking up their containers when needed. The former type of
shippers often uses inland terminals for long term storage and quick retrieval of their
containers. Moreover, an increasing number of shippers strive to minimize their en-
vironmental footprint when fulfilling their transportation needs. Consequently, there
is a considerable shift in the modal split to more sustainable modalities such as barge
and train. The different modalities used for the transport of containers to the hinter-
land can affect the dwell times of the containers. Trucking is the most flexible mode
compared to rail and barge, for which containers have to wait at the terminal until
the next departure.
Long dwell times increase the total lead time for cargo to reach its final consignee
and thus increase safety stocks and overall logistics costs faced by the shippers
(Daschkovska and Scholz-Reiter, 2008). Moreover, demurrage costs are charged to
shippers by the shipping lines when the container cycle times exceed certain thresh-
olds. The expected dwell times at different nodes of container transportation net-
works affect the route selection through the network, according to most network de-
sign contributions formulated from the shipper perspective; see Iannone and Thore
(2010).
The policies of shipping lines in terms of demurrage and detention costs may affect
container dwell times since they can motivate shippers to accelerate logistic processes
in order to avoid paying fees for late returns of the containers to the shipping line’s
empty container depots. Finally, containers have to be released by customs authori-
ties before they can be transported out of the container terminal. Customs use X-ray
equipment or even physical inspections to check only a small portion of the total con-
tainer flow. The possibility of a container being checked and thus delayed depends on
the risk assessment performed by customs, which incorporates several characteristics
such as the consignee, consignor, cargo type, shipping line, and AEO status.
The reduction of container dwell times at seaport container terminals is often consid-
ered an inexpensive enhancement of terminal capacity, compared to other measures
like advanced stacking and handling technologies, optimizing yard space allocation,
and expanding the yard (Rodrigue and Notteboom 2009, Moini et al. 2012, Merckx
25

Chapter 3
2005). This research aims to determine the main drivers of container dwell times and
propose measures to reduce them.
In this present study, we analyze the import container process and discuss, in parallel
to the physical movement of containers, the information streams among actors. The
main determinants of container dwell times in seaport and inland container termi-
nals are examined using quality and quantity criteria. In particular, we examine the
determinants of dwell times of full imported containers originating from a seaport
terminal and destined for an inland region, covered by a network of intermodal in-
land container terminals. Time stamps for specific milestones are collected from the
discharge of full containers at the seaport terminal to the return of empty containers
at the inland terminal. Our analysis of dwell times at container terminals shows
that 48% of the dwell time variation is explained by factors related to the shippers
involved. In contrast to the common belief that container terminal performance is
the main determinant of dwell times, we show that various factors, exogenous to
the container terminal, influence the development of dwell times. To the best of
our knowledge, this is the first study that quantitatively assesses the impact of such
factors on dwell times.
The structure of this chapter is as follows. In Section 2, we describe the process
regarding the import of containers. We discuss the role of actors involved in the
process and present the information flows among them that enable the total process.
In Section 3, we discuss possible determinants of container dwell times, and substan-
tiate their possible effect. In Section 4, we present our case study and perfom some
descriptive analysis of the data on hand. In Section 5, we propose a model to explain
dwell times at seaport container terminals, a model for shipper segmentation, and
present our results. Finally, in Section 6, the conclusions are addressed, consisting of
managerial insights and of directions for further research.
3.2 The import container process
A stream of information accompanies the physical movement of containers from the
seaport to its final hinterland destination, involving transhipment, terminal internal
transport, and hinterland transport. The information flows among actors involved in
the process are summarized in Fig. 3.1. The shipper of imported containers initiates
the process by selecting a shipping line and a preferred import seaport container
terminal (1). The shipping line that usually operates under a liner service, loads the
26
3.2 The import container process
container at the first available vessel and notifies the shipper about the estimated
time of arrival (ETA) of the specific vessel (2). Due to variation in transport times,
the ETA is updated regularly. At least 24 hours before the deep sea vessel calls
at the seaport terminal, the shipping line shares the unloading list of containers for
the specific call with the seaport terminal and with the customs authorities. Based
on this list, the seaport terminal plans the unloading of the vessel, while customs
authorities decide whether to put containers under the customs hold status.
The shipper contacts the forwarder responsible for the inland transport of the contain-
ers and provides them with information about the imported container. Specifically,
the shipper announces the ETA of the container and the due date when the container
should be delivered at the shippers premises (3). Depending on the available inter-
modal services and the time criticality of the container, the shipper indicates whether
truck transport, combined barge-truck or train-truck service is preferred. Before the
container is transported from the seaport to the hinterland, it is cleared both by the
shipping line (4) and customs (5). After that the seaport terminal changes the status
of the container such that it can be picked up by inland carriers (6). customs clear-
ance of a container may be postponed when it is transported to an inland terminal
with customs facilities.
The intermodal inland carrier plans its barge or train calls at the terminal well in
advance of their realization. A call at a seaport terminal is initially communicated to
the terminal at least forty eight hours in advance and is updated twenty four hours in
advance. At the time the barge or train call is scheduled, the inland carrier partially
knows how many and which containers will be picked up. The inland carrier checks
regularly with the seaport terminal whether the containers are cleared for further
transport and sends the loading list of containers of the barge eight hours before
the barge/train call (7). In this way, the seaport terminal can internally transport
containers near the crane that will load the barge or train calling. The containers
are then transported to the inland terminal, where they dwell until they are trans-
ported to the customer’s premises by trucks around the due date and time. In some
cases, when time is really critical or it is preferred by the customer, containers are
transported via trucks from the seaport terminal directly to the customer’s location.
27

Chapter 3
Figure 3.1: Information Flows
3.3 Candidate dwell time determinants
The determinants of container dwell times have not been extensively studied in the
literature. A first study investigating this issue is done by Moini et al. (2012), who
list the following determinants of container dwell times: terminal function and loca-
tion; port policy and management; shipping line; truck carrier; modal split; container
status; content of a container; cargo flow pattern; container security level; business
connection; shipper; consignee, and Third Party Logistics company (3PL). The pos-
sible impact of these factors is qualitatively discussed, but only a few are subject to
further analysis: the shipping line, truck carrier and container status. They employ
data mining algorithms to search through the candidate determinants of the dwell
times. Through a case study they demonstrate the importance of container dwell
28
3.3 Candidate dwell time determinants
times in assessing the container terminal yard capacity.
In our study, we extend Moini et al. (2012) by analyzing the container dwell times
at a seaport terminal destined to its hinterland and transported via a multimodal
transport network consisting of waterways, rails and roads. Qualitatively we consider
the same factors as suggested by Moini et al. (2012) to be relevant for explaining
container dwell times, but we have on hand more data for our analysis. Specifically,
in addition to the three factors available at Moini et al. (2012) analysis, we have
registered for each container in our data-set the specific shipper of the container,
the modality used for its transport from the seaport terminal and the inland region
it was destined. Furthermore, we modeled the information flow (Fig. 3.1), among
relevant actors, in parallel to the import container process and collected performance
measures and timestamps of relevant events, as shown later in Fig. 3.2. Moreover, we
provide a quantitative analysis of the impact effect of each factor on the development
of dwell times. Our analysis points out the shipper as the main actor having control
over the development of dwell times at container terminals and provides empirical
evidence of the various causes of variation in container dwell times. This leads to the
clustering analysis we performed on shippers.
Below we discuss the main determinants of dwell times that we consider in this study.
3.3.1 Shipper (Client)
The shipper is the owner of the contents of the container and the one to whom the
containers are destined. Different shippers have different needs regarding the trans-
port of their containers, which can affect the dwell times of containers. Some prefer
the use of barge or train, possibly motivated by an interest in sustainability and cost
reduction. Others prefer the timely transport of their containers and consequently
prefer trucks. Moreover, each shipper organizes his supply chain differently and may
or may not have an interest in the timely transport of his containers. The time crit-
icality for the delivery of containers is inferred by three quantities: import modality,
order placement and due date, as explained below.
3.3.1.1 Import modality
The import modality is the first transport mode used for further container transport
to the hinterland of the port. Possible modes are truck, barge and train. The
29

Chapter 3
intuition of including the import modality as an explanatory factor lies in the fact
that containers transported by barge or train are supposed to dwell longer at the
seaport terminal, since they have to wait until the next barge or train itinerary or
until several containers can be consolidated in a single barge or train itinerary. But
the modal choice cannot be assumed exogenous to the process since it is performed by
the shipper after considering the time criticality for final delivery and after considering
the next available itinerary.
3.3.1.2 Due date
The due date indicates the time criticality for the delivery of a container and can
affect container dwell times in several ways. The due date limits the dwell time from
above. The time between the container discharge at the seaport terminal and the
due date consists of dwell time at the seaport terminal, transportation to the inland
terminal, dwell time at the inland terminal and transportation to the shipper location.
Setting the due date earlier or later can impact the modal choice when considering
the available transport itineraries of high capacity modes that could satisfy the time
limitations.
3.3.1.3 Order placement
The time of the order placement for container transport at the forwarder can affect
container dwell times in several ways. First, the time of order placement limits
the container dwell time from below, since the container will definitely dwell at the
seaport terminal until its further transport is booked and organized. Second, the time
of the order placement for the transport of a container compared to its time criticality
can affect the modal choice. The early information availability allows the forwarder
to organize the transport of containers and to seek for consolidation opportunities
among the collectively available orders.
3.3.2 Selection of shipping line
The shipping line is the owner of the container, and is responsible for the sea trans-
port of the container. Every shipping line applies different demurrage and detention
schemes, and implement contractual agreements with clients regarding specific de-
tails that include both the the free-periods for demurrage and detention as much as
30

3.4 Dwell time analysis
the charges that apply after the end of the free period. The demurrage and deten-
tion periods can be considered jointly or separately. These demurrage and detention
schemes can affect the dwell time of containers at both the seaport and inland termi-
nals. For example, in case demurrage and detention periods are considered separately,
the shipper may opt to the maximum use of the free demurrage period at the seaport
terminal before picking up the container and allowing the detention period to start.
3.3.3 Selection of inland container terminal
Containers destined for different inland terminals can have different dwell times at the
seaport terminal. First, each terminal has a different connection availability. Some
are tri-modal but most of them are either rail-road or barge-road terminals. So, not
all modalities are always available. Second, container flows are not balanced among
the terminals. Some have large flows that justify higher frequency on the inland high
capacity corridors, while others are smaller and just serviced once or twice a week.
Moreover, each terminal satisfies a specific collection of shippers that almost always
use the same inland terminal for the handling of their containers.
3.4 Dwell time analysis
Dwell times and other performance measures analyzed and presented in this section
are under our confidentiality agreements with Europe Container Terminals (ECT)
and Brabant Intermodal. We apply a confidentiality factor to all time measures and
change the time units (e.g. 1 day =0.83α). By such transformation no exact perfor-
mance data are shown while the validity of results remain.
3.4.1 Case and sample
Our analysis of dwell times is based on an elaborate data set from two companies: (i)
Europe Container Terminal (ECT) the biggest container Terminal Operator Com-
pany (TOC) in Europe, operating three deep sea terminals within the Port of Rot-
terdam; and (ii) Brabant Intermodal (BIM) a collaboration of six intermodal inland
container terminals (ICT) located in the Brabant region of the Netherlands. BIM also
acts as an intermodal inland carrier and provides transport services to its customers,
next to the usual handling and storage services.
31

Chapter 3
The data contain timestamps of milestones and specific characteristics of 15,100 im-
ported containers that were transported from one of ECT’s deep sea terminal to the
Brabant region through the BIM’s inland multimodal network in 2011. The contain-
ers were destined to the 102 clients of BIM through its six inland container terminals.
The containers were transported by nine shipping lines.
The information and milestone timestamps gathered for this research are schemat-
ically presented in Fig. 3.2. In particular, factors like the shipping line, the inland
terminal, the modality used and the shipper of the container have been registered.
Moreover, timestamps of milestones, either of physical movements or of information
flows between actors, have been registered. From the shipping lines, the arrival time
(ATA) and departure time (ATD) of the vessel carrying the containers at the seaport
terminal were recorded. Furthermore, the times that the shipping line provided the
unloading list and position of containers in the vessel, to the seaport terminal and to
the custom authorities were registered (BAPLI, COPRAR). For the seaport termi-
nal, we recorded the time of discharge, when the dwell time begins, and the gate-out
time, when the dwell time period ends. We also recorded the time that customs put
the containers under customs hold status and the time they were released.
We recorded milestones about the inland transport of containers through Brabant
Intermodal which plays a central role in the total process. BIM acts as an inland
carrier, inland terminal operator and a forwarder. The time the shipper contacted
BIM regarding a specific container and provided BIM with the information regarding
its arrival, due date and import modality to be used, was registered. The times the
containers passed through the gate of the inland terminal and their delivery at the
customer’s location and their empty return were also registered. Moreover, the time
BIM provided the seaport container terminal with the loading list (COPINO) has
been recorded.
3.4.2 Descriptive analysis of container dwell times
The time between the container discharge and its due date consists of dwell times at
both the seaport and the inland terminals and transport times, the average distribu-
tion is shown in Fig. 3.3. This slack time starts from the container discharge at the
seaport terminal and ends at the arranged due date for delivery. On average, 48.93%
of the slack time was spent at the inland terminals, 45.86% at the seaport terminal,
and only 4.91% for transportation.
32
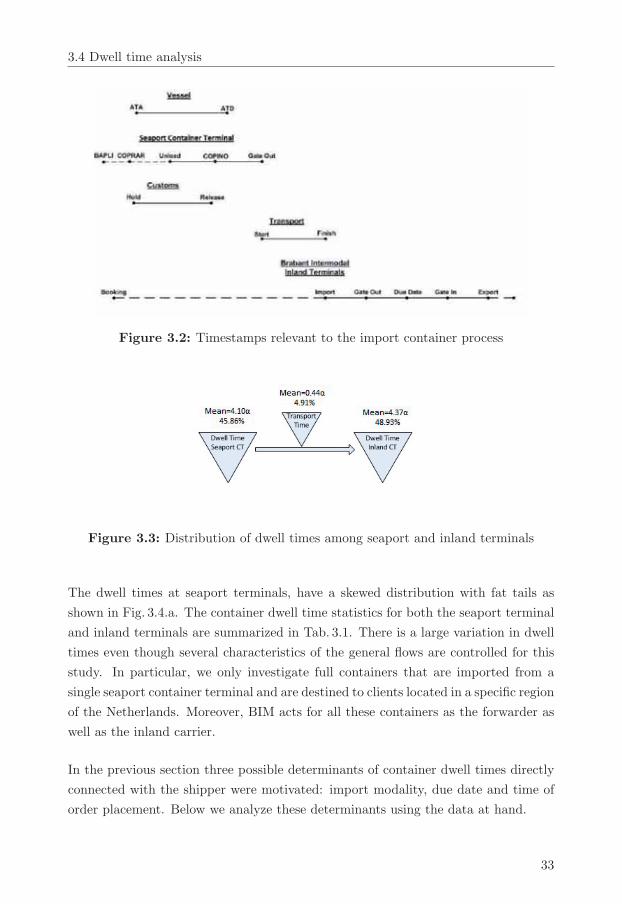
3.4 Dwell time analysis
Figure 3.2: Timestamps relevant to the import container process
Figure 3.3: Distribution of dwell times among seaport and inland terminals
The dwell times at seaport terminals, have a skewed distribution with fat tails as
shown in Fig. 3.4.a. The container dwell time statistics for both the seaport terminal
and inland terminals are summarized in Tab. 3.1. There is a large variation in dwell
times even though several characteristics of the general flows are controlled for this
study. In particular, we only investigate full containers that are imported from a
single seaport container terminal and are destined to clients located in a specific region
of the Netherlands. Moreover, BIM acts for all these containers as the forwarder as
well as the inland carrier.
In the previous section three possible determinants of container dwell times directly
connected with the shipper were motivated: import modality, due date and time of
order placement. Below we analyze these determinants using the data at hand.
33

Chapter 3
Table 3.1: Dwell time Statistics
Mean St. Dev Median
Dwell timeSeaportTerminal
4.10α 3.93α 3.18α
Log Dwell timeSeaportTerminal
1.12 1.01 1.15
Dwell timeInland Terminal
4.38α 1.89α 8.08α
3.4.2.1 Import modality
Three possible modes are available in our case, barge, train and truck; the modal
split of the containers considered was 59.84%, 24.48% and 15.68%, respectively. It
is obvious that BIM achieves a modal split in favor of high capacity modalities,
since intermodal combined transport is its core competence. The histograms of dwell
times for different modalities in Fig. 3.5 show that containers with short container
dwell times, less than a day, are mainly transported by trucks, while the dwell time
distributions of the different modalities are overlapping.
3.4.2.2 Time between container discharge at seaport terminal and due date at
the clients location (CDDD)
The time between container discharge and due date indicates the time criticality for
the delivery of a container. It can be interpreted as the available time given to BIM
by its clients to fulfill their transport orders. The histograms in Fig. 3.6 show how
this time is distributed over different modalities. One can infer that not all orders are
satisfied by the quickest transport mode. Orders with higher slack time are satisfied
through slower but more cost effective transport means. For the latter case, the
inland terminal yard could be used for medium term storage instead of keeping them
at the congested seaport terminal yard. Since containers are to be delivered at the
specific due date set by the shipper, the container discharge to due date measure,
CDDD, consists of the dwell times at the seaport(CDTST ) and inland (CDTIT )
terminals enhanced by the transport times(TT ) between the terminals and to the
34
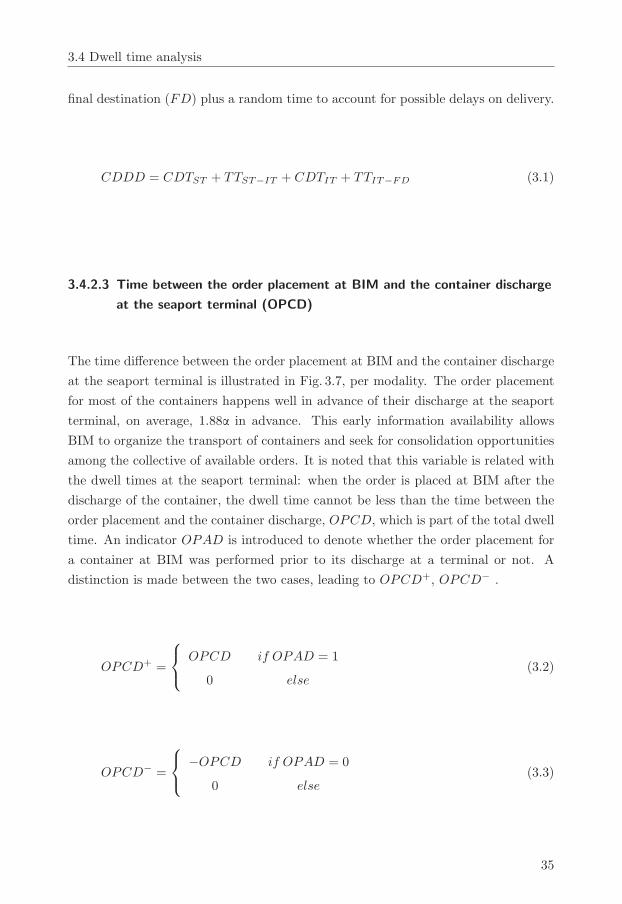
3.4 Dwell time analysis
final destination (FD) plus a random time to account for possible delays on delivery.
CDDD = CDTST + TTST−IT + CDTIT + TTIT−FD (3.1)
3.4.2.3 Time between the order placement at BIM and the container discharge
at the seaport terminal (OPCD)
The time difference between the order placement at BIM and the container discharge
at the seaport terminal is illustrated in Fig. 3.7, per modality. The order placement
for most of the containers happens well in advance of their discharge at the seaport
terminal, on average, 1.88α in advance. This early information availability allows
BIM to organize the transport of containers and seek for consolidation opportunities
among the collective of available orders. It is noted that this variable is related with
the dwell times at the seaport terminal: when the order is placed at BIM after the
discharge of the container, the dwell time cannot be less than the time between the
order placement and the container discharge, OPCD, which is part of the total dwell
time. An indicator OPAD is introduced to denote whether the order placement for
a container at BIM was performed prior to its discharge at a terminal or not. A
distinction is made between the two cases, leading to OPCD+, OPCD− .
OPCD+ =
⎧⎨⎩ OPCD
0
if OPAD = 1
else(3.2)
OPCD− =
⎧⎨⎩ −OPCD
0
if OPAD = 0
else(3.3)
35

Chapter 3
3.5 Evaluation of various effects on container dwell
times
In the previous sections various determinants of container dwell times were motivated
and an empirical case was presented. In this section, we aim to quantitatively assess
the main determinants of container dwell times at seaport terminals. First, areg-
gression model is presented, which is used to explain the variation in container dwell
times. Second, a cluster analysis of clients according to their operational performance
is performed.
3.5.1 Dwell time analysis
The following model has been applied to assess the influence of various factors on
container dwell times at seaport terminals:
ln (DTST ) = β0+β1Shipper+β2Modality+β3Carrier+β4IT+β5CDDD+β6OPCD+
+ β7OPCD− + β8
(OPCD+
)2+ β9
(OPCD−
)2+ β10OPAD + ε (3.4)
Where ε is an identically independently distributed term with zero mean and variance
σ2. The natural logarithm of the dwell times is used as a dependent variable for two
reasons. First, container dwell times are positively skewed. Second, the dwell times
can take only positive values, that would contradict the main assumptions of an OLS
model and thus the predictive power of the model.
Tab. 3.2 summarizes the results of the regression model. We tested two models with
and without the quadratic terms, (OPCD+)2and (OPCD−)2. The partial F-test
reveals that the quadratic terms have a significant effect (F = 391.08, p = 0.01).
The model is significant and counts for almost 48% of the variation of the log dwell
times at seaport terminals. All proposed variables have significant effects on the
development of dwell times. The partial eta square indicators are calculated to
indicate the effect sizes.
We also tested whether any second order interactions have significant effect. Based
on partial F-tests, some interactions among variables appear to be jointly significant
(p < 0.001), but since this inclusion has no additive explanatory power to our model
36

3.5 Evaluation of various effects on container dwell times
Table 3.2: Results OLS model on ln(Dwell Times)
Model 1 Model 2
Variable FaPartialEta
SquareFa
PartialEta
SquareParameters
Shipping Line 5.0 .003 6.1 .004 [-0.057 , 0.477]IT 7.3 .002 5.8 .001 [-0.664 , 0.282]Shipper 9.7 .062 10.4 .066 [-0.581 , 1.027]
Modality 196.6 .026 211.4 .027Truck=0
Train=0.237Barge=0.296
OPAD 452.0.3 .029 34.5 .002 0.096CDDD 761.7 .05 785.9 .05 0.025OPCD+ 1521.2 .09 2854.5 .160 0.194
(OPCD+)2
- 867.2 .055 -0.004OPCD− 111.7 .007 92.0 .006 -0.054
(OPCD−)2 - 58.0 .004 0.002R2 0.453 0.484
aAll variables are significant at the 1% level
(the R2 increases only slightly), these interaction terms were not finally included into
the model.
As the proposed determinants are under direct control of the shipper, our analysis
assesses the effect of shippers’ selections on the development of dwell times at the
seaport terminal. It should be noted though that some explanatory variables are
not independent from each other. For example, shippers often import containers to
the inland terminal located closer to their premises, while selecting the shipping line
preferred. Furthermore, there seems to be some patterns that connect the modal
choice with the time criticality CDDD, and the modal choice with the time of order
placement, as illustrated in Fig. 3.6 and Fig. 3.7, respectively.
The shippers identity seems to have largest effect on the development of log dwell
times, counting for 6.6% of the variability. This supports our hypothesis that shippers
can influence the dwell times of their containers at the seaport terminal. Further
insights into the shipper effects are given below.
The import modality follows with an effect size around 2.7%. This is consistent with
the hypothesis that containers with high time criticality are mainly transported via
37
Chapter 3
trucks while others with less time criticality are transported via intermodal transport.
A significant number of containers with relatively prompt due dates, CDDD, are
transported via high capacity, slow modes (barge, train), while others with tardy
due dates are transported by trucks. This variation, even among subjects within
the same modality, may be due to the availability of itineraries around the time of
booking. The latter depends on the schedule of high capacity modalities and on other
characteristics like the time of booking which acts as an enabler for BIM to organize
the transport of a specific container.
Regarding the shipping line and inland terminal factors, we found that their effect is
statistically significant (p < 0.001), but that their effect size is considerably smaller
than other variables, 0.4% and 0.1%, respectively.
The time of the order placement at BIM, OPCD, has a significant effect on the
development of dwell times. Two cases are distinguished depending on whether the
order placements are performed before or after the container discharge at the seaport
terminal. First, an earlier booking OPCD− by α leads to 5.4% less dwell time at a
decreasing rate of 0.2%. Second, a tardier booking, OPCD+ seems to increase the
total dwell time by 19.4%, but at a decreasing rate 0.4% per α. Note that the dwell
time starts at the time of the discharge preceding the time of the order placement,
and there is a high correlation between the two but at a decreasing rate. This paradox
can be explained by considering that the tardier the order placement, the larger the
time criticality CDDD of a container to be delivered.
The time criticality of the container has a large effect on the development of dwell
times. Postponing the due date by α, increases the dwell time of containers by almost
2.5%. It is clear though that when due dates are further away containers dwell more
time at the inland terminals.
3.5.2 Shipper clustering analysis
Our analysis showed that the shippers are the key actors accounting for the develop-
ment of dwell times. In order to illustrate the main differences among the different
shippers, we classify them in groups with similar characteristics. A k-means cluster
analysis is performed on the shippers based on their quantitative characteristics and
performance measures. In particular, four quantitative measures were considered in
the clustering of shippers: (i) mean dwell time of containers at the seaport terminal,
(ii) mean dwell time of containers at the inland terminal , (iii) mean time difference
38

3.5 Evaluation of various effects on container dwell times
between the order placement and the container discharge (OPCD) and, (iv) mean
time difference from container discharge to its due date (CDDD).
The number of clusters was derived by applying the Wards method on the principal
components scores and then checking the Agglomeration schedule. We performed
k-means clustering for six clusters. Clients assigned to each cluster had significantly
different characteristics. The results are summarized in Tab. 3.3. The clusters are
organized in the table according to the mean time criticality CDDD needed to trans-
port the containers, from the left, the most time critical, to the right, the less time
critical. In order to assess the significance of the clustering we performed an reg-
gression of the log dwell times on cluster membership and achieved an R2 equal to
11%. Moreover, modifying the initial regression model presented in section 3.5.1,
by substituting the shipper identity with the cluster membership, yields a slightly
smaller R2 equal to 45%.
Clusters 1, 2 and 3 represent shippers with the highest time criticality in transporting
their containers with mean time between container discharge and due date CDDD
equal to 5.15α, 5.51α and 7.01α. Clusters 1 and 2 seem to have similar dwell time
performance in both seaport and inland terminals but there is a significant difference
on how these dwell times are achieved. Cluster 1 clients place their orders at BIM on
average 15.29α in advance of the discharge of their containers at the seaport terminal
while those of Cluster 2 only 4.11α earlier. Though this difference does not affect
significantly the dwell time of containers, it does affect the modal choice since in the
latter case 22% of containers are transported by trucks compared to 4% trucking
that is realized for shippers assigned to cluster 1. Shippers assigned to Cluster 3
place their order at BIM on average 1,05α after their containers are discharged at
the seaport terminal. This leads to an increase in both their average container dwell
time at the seaport terminal and also in the trucking percentage.
Clusters 4, 5 and 6 represent shippers with lower average time criticality in trans-
porting their containers with mean CDDD times equal to 10.64α, 12.51α and 17.10α.
Shippers assigned to Clusters 4 and 6 place their orders in advance of the discharge
of their containers at the seaport terminal on average 1.88α and 0.44α, respectively
and both achieve the longer dwell times at the storage yard of the inland terminals.
More time availability to perform the transport in case of cluster 6 shippers leads to
lower trucking which is only 4% compared to that of 16% that is realized in case of
cluster 4 shippers. Shippers assigned to Cluster 5 use the seaport container yard for
the storage of their containers and only place their order at BIM some days before
39

Chapter 3
the cargo is needed, in average 4.85α after the containers where originally physically
available at the seaport terminal. The lack of information availability on BIM in or-
der to organize the transport leads to both larger average dwell times at the seaport
area and also higher trucking, averaging in 22%.
Table 3.3: Performance characteristics of clusters of clients
Cluster
1 2 3 4 5 6
Dwell Time ST (α) 3.21 3.15 4.27 4,77 9.18 5.10Dwell Time IT (α) 1.90 1.86 2.34 5.48 3.19 11.49Order placement tocontainer discharge(OPCD) (α)
-15.29 -4.11 1.05 -1.88 4.85 -0.44
Container discharge todue date (CDDD) (α)
5.15 5.51 7.01 10.64 12.51 17.10
Trucking Percentage 4% 22% 25% 16% 22% 4%
Moreover, the resulting clustering of shippers was analyzed together with BIM’s
executives such that other motivations that explain the different performances of
shippers emerged. For example, clients assigned to cluster 1 import goods from
distant regions, like China, and provide BIM with the information of their incoming
containers as soon as their containers are loaded in the deep sea vessel. So that is
what drives the early information availability for this cluster compared to the clients
of cluster 2 that provide the same information some days later. Other clients like
those assigned in clusters 4 and 6 usually have contracts with the shipping lines with
separate demurrage and detention periods so they are motivated to fully use the free
demurrage period, usually 5 days, before they allow their containers to be picked up
and consecutively start the detention period.
Overall, the presented clustering shows that the time criticality for delivering the
containers is the main driver of the container dwell times at both the seaport terminals
and inland terminals. Moreover, the information availability at the forwarder, which
in our case is BIM, can provide a shift in container dwell times from the seaport to
the inland terminals, and a shift in the modal split in favor of sustainable modalities
such as barges and trains.
40

3.5 Evaluation of various effects on container dwell times
3.5.3 Summary and discussion of results
The analysis provided in this research could lead to some measures regarding the
reduction of container dwell times at seaport terminals, and also to a modal shift in
favor of sustainable modes which is increasingly considered to be a major concern of
seaport terminals. Since in this analysis we considered only one seaport terminal we
cannot propose measures that are related with the direct operational performance of
the terminals, like stacking methods, cranes capacity, customs capacity etc. On the
other hand, we can discuss measures that are not in direct control of the terminals
but more in control of shipping lines, inland carriers and shippers and with which
terminals cooperate and may have contractual agreements. The problem owner of
long dwell times is still the terminal operator for which the capacity of the terminal
is determined; so the optimal measure for terminal operators would be to motivate
other actors to perform towards the reduction of dwell times.
There seem to be three major observations derived from our analysis, and measures
taken against them would have a significant impact on the reduction of container
dwell times.
First, when demurrage and detention periods are treated separately, they seem to
motivate shippers to fully use the free periods (see shippers assigned to clusters 4
and 6 in the previous section). So shipping lines should be motivated to change
their policy. That could be partly enforced by container terminals by alternating
their contractual agreements with shipping lines regarding the storage scheme they
impose (free storage periods and storage charges after the free period).
Second, the information availability for incoming containers seems to have a great
impact to both the reduction of dwell times and to a modal shift towards more
sustainable modalities. This early information availability enables the forwarder to
better organize the transport of containers and shorter dwell times can be achieved.
So shippers should be prompt to provide this information to the inland carriers as
soon as they have it available. Still there is not a clear motivation for shippers and
inland carriers towards the reduction of dwell times of containers at seaport terminals
apart from the charges when containers dwell longer than the free period, so maybe
shorter free storage periods could act as a motivation to accelerate the import process.
Third, the observation that the time criticality for the transport of a container has
a significant relationship with the dwell times of containers next to the fact that
several containers had very short dwell times (less than a day for all import modalities
41

Chapter 3
(Fig. 3.5)) indicates that there is not a real lower bound on the dwell times. Thus
there is room for improvement for all clusters of shippers and not only the ones with
high average dwell times. This is especially interesting for cases where containers
are transported via combined transport through inland terminals, like our case, and
there can be an straightforward shift between dwell times at seaports and inland
terminals. So enhancing the connectivity of the seaport terminal with more frequent
service would lead to the reduction of dwell times.
3.6 Conclusion
In the present study, we examined the factors affecting container dwell times at a
major seaport container terminal. We found that there is a significant relationship
between the shipper and the time their containers dwell at seaport terminals. The
models proposed has considerable explanatory power on imported container dwell
times, and on the different clusters of shippers. The impact of exogenous factors has
been analyzed qualitatively and quantitatively.
Container dwell times at seaport terminals can be shorted by a combination of im-
proved operational performance of the terminals (e.g. automated terminals), as sug-
gested from previous literature, and from motivating other actors relevant to the
process to act towards this enhancement. Shippers, Shipping lines, Inland carriers
and Inland terminal operators are relevant actors to the development of dwell times.
The analysis above seems to look at several factors relevant to the process but is
not exhaustive. For example, the development of the extended gate concept in which
seamless connections to inland terminals are formulated and customs and other added
value activities are postponed to the inland terminals could be a relevant solution for
the reduction of dwell times. Moreover, the connectivity of the seaport terminal with
high capacity frequent connections could also be a step towards both the reduction
of dwell times and the shift towards sustainable modalities. Unfortunately, we do
not have enough data to support such a quantitative analysis.
The results of this research are essential for both academics and industry. The as-
sumption that dwell time performance can be treated as a purely endogenous capacity
performance criterion of seaport terminals is challenged. Dwell times are influenced
by various exogenous factors outside the control of terminals. Moreover, congested
seaport terminals should incentivize shippers and other important actors involved
42

3.6 Conclusion
in the process in order to achieve a significant reduction of container dwell times at
seaport terminals.
43

Chapter 3
(a) Dwell time at Seaport Container Terminal
(b) ln(Dwell Time) at Seaport Container terminal
(c) Dwell Time at Inland Container Terminals
Figure 3.4: Dwell time histograms
44
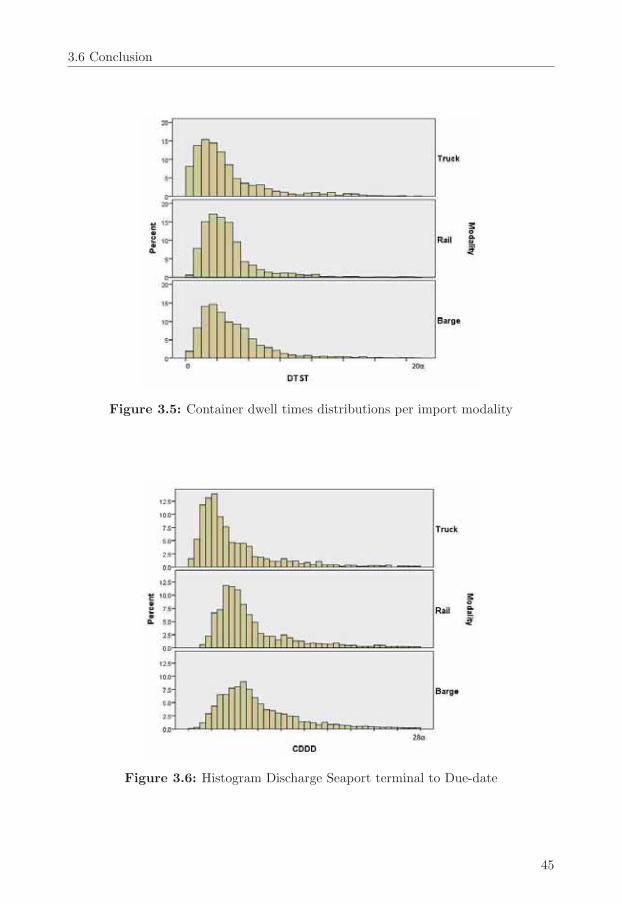
3.6 Conclusion
Figure 3.5: Container dwell times distributions per import modality
Figure 3.6: Histogram Discharge Seaport terminal to Due-date
45
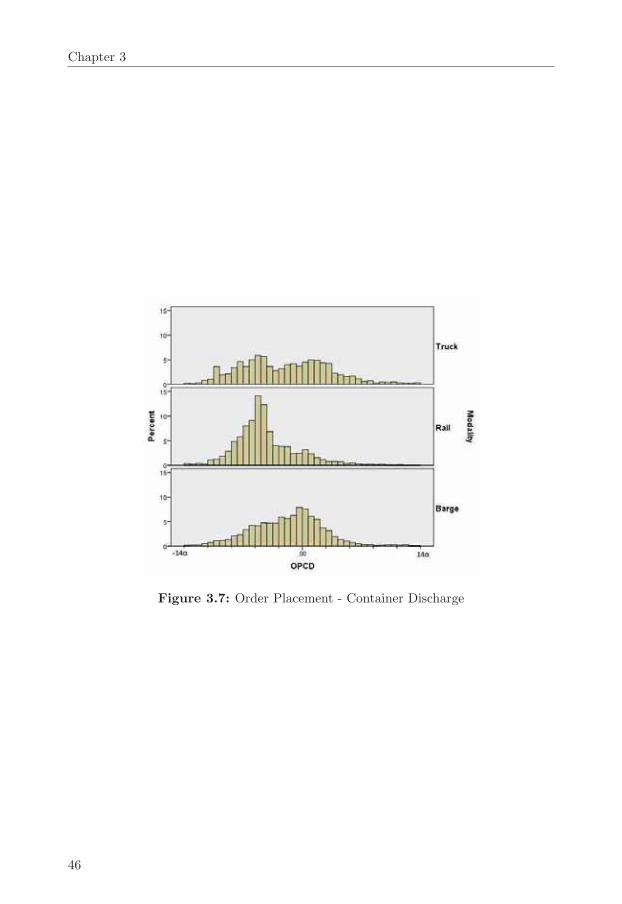
Chapter 3
Figure 3.7: Order Placement - Container Discharge
46

4 Joint Design and Pricing of
Intermodal Port - Hinterland
Network Services: Considering
Economies of Scale and Service
Time Constraints
Summary: Maritime container terminal operating companies have extended their
role from node operators to that of multimodal transport network operators. They
have extended the gates of their seaport terminals to the gates of inland terminals in
their network by means of frequent services of high capacity transport modes such
as river vessels (barges) and trains. These network operators face the following three
interrelated decisions: (1) determine which inland terminals act as extended gates of
the seaport terminal, (2) determine capacities of the corridors, i.e. size of the trans-
port modes and frequency of service, and (3) set the prices for the transport services
on the network. We propose a bi-level programming model to jointly design and price
extended gate network services for profit maximization. The network operator does
so while anticipating the decisions of the customers who choose minimum cost paths
to their final destinations, and who always have the option to choose direct trucking
offered by the competition.
The model in this chapter extends existing bi-level models in a multimodal format
by including service time constraints and economies of scale. Considering the special
structure of our problem, we propose a heuristic that provides near optimal solutions
to our problem in substantially less time than commercial solvers. Through exper-
imental results in some realistic instances, we study optimal network designs while
comparing seaport-to-door and seaport to inland port services and situations where
transit time requirements do and do not apply. Our results show that when demand
47

Chapter 4
is relatively low, there are significant differences in the optimal network designs for
port-to-door versus port-to-port services. In the case of port-to-door services, the
prices of services are determined through the competition and not by the design
of the network, so the network is designed against minimum costs, and economies
of scale are achieved by consolidating flows through a limited number of extended
gates. The case of port-to-port services is different, i.e. revenues are enhanced not
so much by reducing costs through the exploitation of economies of scale, but by
exploiting the possibilities to dedicate extended gates to market segments for which
the competition leaves room for higher port-to-port tariffs.
4.1 Introduction
Maritime container terminal operating companies around the globe have recently
started to actively participate in land-side transport networks to enhance their con-
nectivity to destinations inland while relieving some of the negative effects of freight
transportation. Container terminal operators have done so by extending their role
from node operators to that of multimodal transport network operators. They have
extended the gates of their seaport terminals to the gates of inland terminals in their
network by means of frequent services of high capacity transport modes such as river
vessels (barges) and trains. Moreover, customs clearance and other added value ac-
tivities can be postponed until the containers leave the inland terminal gates instead
of the seaport terminal gates (Veenstra et al., 2012). The operator of this network of
transport connections between deep sea ports and inland terminals is referred to as
extended gate operator, and we will use this term from now on. The extended gate
operator at the tactical design of the land-side transport network faces the following
three decisions: (1) determine which inland terminals act as extended gates of the
seaport terminal, (2) determine capacities of corridors, size of the transport modes
and frequency of service, and (3) set the prices for the transport services on the net-
work. The three decisions are interrelated, because inland terminals are located in
relatively close distances, usually close to industrial regions, so the hinterland of in-
land terminals is contestable. Thus, the network operator could connect the seaport
terminal either to a limited number of inland terminals while using high frequent
and high capacity transport services, or it could connect with more inland terminals
while using less frequent services or lower capacity transport means. The price per
TEU at each corridor should make the routing of all containers through that corri-
dor cost effective compared to the service provided by the competition. It follows
48

4.1 Introduction
that, when an extended gate is meant to attract demand destined to regions other
than its captive hinterland, for flow consolidation purposes, the price setting at its
corresponding corridor should be low enough to make the path to the distant regions
also cost effective. This reduction in the prices would affect also the revenues the
extended gate operators receive from clients located in the captive hinterland of the
extended gate.
Port-Hinterland intermodal transportation is usually referred to in the literature as
combined transport (Fremont and Franc, 2010), so this term will be used throughout
this chapter, and can take either the rail-road or waterway-road scheme indicating
that usually the end haulage trip is performed by trucks. The international ship-
ping of containers can be organized either under merchant haulage or under carrier
haulage. Port - hinterland transport of containers can also be offered under the so
called terminal operator haulage (Notteboom, 2008). In the latter case, transport
services are offered either as port-to-port services or port-to-door services. In case
of port-to-door services, the terminal operator, that acts as an extended gate opera-
tor, orchestrates the transport of containers from the port to their final destination,
while under port-to-port services he only offers transport from the seaport terminal
to inland terminals. In other words, under port-to-door service the extended gate
operator is assumed to control all links and nodes over the inland network while
under port-to-port service it controls only flows on the high capacity corridors while
the remaining is outsourced to competition. Under port-to-port service the prices
should be set low enough such that they make the combined transport path, via
the extended gates, at least cost neutral to the best alternative service offered by
the competition (Roso and Lumsden, 2010) for all containers routed through it. In
this setting, the design of the inland transport network and the pricing scheme are
interrelated. On the contrary, under port-to-door service the price of transport from
seaport to final destination mainly depends on the best alternative transport service
offered by the competition and does not depend on the routing of the containers
through the network since it is assumed that also the end haulage legs performed
by trucks are offered by the extended gate operator. Thus for port-to-door services
pricing and network design decisions do not have to be considered jointly. The term
competition is used to denote other intermodal carriers or trucking companies that
can offer alternative transport solutions to shippers than the ones offered by the
extended gate operator. The last leg of transport is usually performed by trucking
companies who also benefit from the use of the extended gate concept since congested
roads to seaport terminals are avoided. While the pick up and drop off of containers
49

Chapter 4
is performed at the inland terminals, the above can sufficiently increase the number
of trips they can perform per day.
The profitability of the extended gate operator, apart from the pricing, also depends
on the cost of delivering the network services, where the effective utilization of high
capacity transport means provides the opportunity for economies of scale. Moreover,
higher frequency of transport services reduces the average throughput times of con-
tainers which enlarges the market potential for such services. The trade-off between
customer demand characteristics and carrier strategies should be considered, as it is
supposed to lead to the development of a variety of possible inland container routing
patterns (Notteboom, 2008). Finally, consolidation helps to hedge against demand
uncertainty (Lium et al., 2009).
In this chapter, we propose a model to jointly design and price extended gate network
services to reap possible benefits. We contribute to the existing body of knowledge by
extending joint design and pricing bi-level formulations, as proposed by (Brotcorne
et al., 2005, Brotcorne et al., 2008), to fit the port-hinterland multimodal network de-
sign by including service time constraints and high capacity modalities. Considering
the special structure of our problem we propose a heuristic that provides near optimal
solutions to our problem in substantially less time than it takes CPLEX to solve the
MIP equivalent formulation of our problem. Finally, through experimental results in
some realistic instances we analyze the optimal network configurations under service
type, demand and service time scenarios. Our results show that when demand is
relatively low, which can be the case for several inland regions, there is a significant
difference in the optimal network configuration between considering port-to-port and
port-to-door services. Moreover, the consideration of service time constraints in tac-
tical network design shows that demand penetration through frequent services has a
larger effect than achieving economies of scale through the use of larger barges.
4.2 Theoretical background in joint design and pricing
of networks
In addition to the the literature review presented in Chapter 2 of this thesis, which
focused on general and port-hinterland intemodal network design literature, in this
section we review contributions on the joint design and pricing of transportation
services which is the core modelling technique in this chapter. Our view of the
50
4.2 Theoretical background in joint design and pricing of networks
problem on hand is that the extended gate operator aims at optimizing the design
of his hinterland network while anticipating the routing decisions by the shippers of
containers. Shippers can route their containers via links controlled by the extended
gate operator or by its competitors or by a combination. Bi-level formulations of the
network design problem capture the decisions of these three different actors involved.
The joint design and pricing of transportation networks is mainly modeled by bi-
level mathematical models. Bi-level models are seen as a static version of the non-
cooperative Stackelberg game. Most of them have in common that they try to maxi-
mize the revenues of an actor that is considered to be the leader and controls a set of
arcs and nodes of the network while minimizing the total cost faced by the users of
the network. These features are in line with our view of an extended gate operator
that endeavors to maximize his profitability by attracting flows through his network.
The proposed network design must add value to the shippers by reducing their total
cost. The main assumption of such formulations is that the competitors do not react
to the final configuration proposed by the leader of the network. Due to the difficul-
ties that arise when solving such formulations, which are proven to be NP-hard even
in the simplest linear case, most papers focus on alternative modeling formulations
of the problem and on the development of novel solution procedures. Contributions
with managerial relevance in the sense of what is the impact of considering joint
design and pricing in a network are yet limited.
Brotcorne et al. (2000) introduce the freight tariff setting problem in which the ob-
jective is to maximize the revenues of a carrier who controls a set of arcs of the
network, by setting the tariffs for using these arcs, while the flows over the network
are determined in the second level minimizing the total transport cost faced by the
users of the network. This is the simplest formulation since all terms are assumed to
be continuous. The authors develop the single level equivalent bi-linear formulation
of the problem with disjoint constraints, and solve it with heuristics based on the
primal-dual heuristic proposed by Gendreau et al. (1996). Brotcorne et al. (2001)
extend their previous work by considering a multicommodity network in which the
leader maximizes his revenues by setting the tolls on the set of arcs he controls. In
this setting, again a primal-dual based heuristic is used with an extension that forces
tolls applied for each commodity to be equal.Moreover an arc sequential heuristic is
proposed.
Brotcorne et al. (2005) further extend their previous model by considering the joint
pricing and capacity setting problem in a multicommodity transportation network.
51

Chapter 4
This problem is formulated as a mixed integer bi-level program and is again solved
by using a primal-dual based heuristic. This model incorporates the tradeoffs be-
tween revenue and cost generated for the leader when designing his network. The
paper states that until then these issues were treated separately although they are
intrinsically linked and should be treated jointly. The economies of scale principle
is assumed to be satisfied by assuming the marginal cost of increasing capacity to
be decreasing. In Brotcorne et al. (2008) the authors consider the joint design and
pricing of a network by assuming that investment fixed cost apply to the leader for
operating arcs over the network. This case is formulated as a mixed integer bi-level
program with binary decision variables indicating whether or not an arc is used in a
multicommodity transportation network. A novel heuristic based on Lagrangian re-
laxation is applied to incorporate the binary design variables in the solution method.
An exact algorithm for solving the pricing problems on a network by partially and
efficiently generating candidate solutions is presented in Brotcorne et al. (2011), while
a tabu search algorithm is presented in Brotcorne et al. (2012).
To the best of our knowledge, only a few bi-level formulations of the intermodal
network design problem exist in the literature. Crevier et al. (2012) propose a path
based bi-level formulation of the rail-road integrated operations planning and revenue
management problem, at an operational level, while proposing some exact algorithms
for its solution. The pricing of services depends on the prices set by the competition
for the different service levels while the capacities of the corridors are obtained by
solving a service network design model at the tactical level.
The joint design and pricing of an intermodal network has been addressed also in
other than bi-level programming formats. Li and Tayur (2005) jointly design and
price an intermodal network by using a traditional marketing research approach for
the pricing part. In this approach, a customer chooses an intermodal service based
on its expected service level and is charged based on the best alternative transport
solution cost which provides the same service level. The paradox of this approach is
that customers with different service level characteristics pay different prices while
experiencing the same service level. So the pricing with the design gets disconnected.
4.3 Modeling
The extended gate operator aims to design the capacities, frequencies, and prices of
combined transport services on its network in such a way that profits are maximized.
52

4.3 Modeling
Table 4.1: Notation of sets
i ∈ N Nodes(i, j) ∈ A Arcs on the network, A = A1 ∪ A2
(i, j) ∈ A1 Arcs on the network controlled by the network operator(i, j) ∈ A2 Arcs on the network controlled by competitionc ∈ C Commoditiesb ∈ B Set of Bargesr ∈ R ={1, 2, 3, ..}
Barge round trip
He does so while anticipating the decisions of the customers who choose minimum
cost paths to their final destinations, possibly under service time related constraints.
We model the extended gate operator as a Stackelberg leader, followed by its cus-
tomers. We formulate the above situation as a bi-level mathematical program where
on the first level, the extended gate operator maximizes its profits which are given by
the revenue of the extended gate services minus the fixed and variable costs of oper-
ating the extended gates. On the second level, the collective of customers minimizes
the total system cost which consist of transportation cost and handling charges at the
container terminals. The total network consists of links and nodes controlled either
by the extended gate operator or by the competition. In particular, each hinterland
destination can also be served by a direct trucking option offered by the competi-
tion. Therefore, prices set by the extended gate operator are always constrained by
a competitive price from above. The model formulation extends the one proposed by
Brotcorne et al. (2008) in a multimodal format by the consideration of economies of
scale when assigning high capacity modalities to corridors and by the formulation of
connection frequency dependent service times.
4.3.1 Notation
Let us consider an underlying network G = (N ,A) with node set N and arc set A.
We assume that a node can be a supply, demand or a transhipment node in case
it represents a deep sea terminal, client, and inland terminal, respectively. The set
of arcs A is partitioned in two subsets; the set A1 which represents the candidate
corridors to extended gates which are controlled by the leader and the set A2 which
represents all remaining arcs which are controlled by the competition.
53

Chapter 4
Table 4.2: Characteristics of commodities
Oc Origin of commodity c, Oc ∈ NDc Destination of commodity c Dc ∈ Ntc Maximum expected service time of commodity c ∈ Cf cij Minimum frequency of commodity c ∈ C on corridor
(i, j) ∈ A1
dc Expected demand in TEUs of commodity c ∈ C
4.3.1.1 Commodities
We consider a multicommodity formulation of the problem in which each commodity,
c ∈ C, represents a share of the weekly container demand for a specific origin and
destination (OD) pair, (Oc, Dc) ∈ N × N , under some service time requirement.
The demand volume of a commodity c expressed in TEUs is denoted by dc, and
represents the level of demand for both inbound and outbound flows regardless of
whether the containers are full or empty. In reality, some empty containers dwell at
the inland terminals until some demand for export containers is generated so they
are full also on their return trip. Usually, there exist weight and balance constraints
for the loading of containers on barges and trains but such issues are addressed at an
operational level and are out of the scope of this study. The desired service level is
assumed to be expressed either as an upper bound for the expected service time, tc,
or as a minimum weekly frequency constraint, f cij for all (i, j) ∈ A1, for the combined
transport services. Considering the above demand formulation, we aim at analyzing
the market penetration of combined services compared to direct transport based on
the service frequency of high capacity modalities. The demand data requirements
for the model can be derived by analyzing historical data or by having experts in the
field approximating them.
To facilitate our modeling, we use:
dcj =
⎧⎪⎪⎪⎨⎪⎪⎪⎩
dc,
−dc,
0,
j = Dc
j = Oc
otherwise
.
4.3.1.2 Costs
We assume that cost of transport operated by the competition is linear in volume.
The transport cost per unit (TEU) on an arc is denoted by Cij for all (i, j) ∈ A2 and
54

4.3 Modeling
Table 4.3: Cost and Capacity Parameters
Cij Trucking cost per TEU for traveling link (i, j) ∈ AHij Handling cost per TEU for traveling link (i, j) ∈ AQb Capacity in TEUs of barge b ∈ Bwb : Weekly cost for leasing barge b ∈ Bvbij Variable cost of barge b ∈ B traveling in arc (i, j) ∈ A1
nbij Maximum number of round trips of barge b ∈ B in arc
(i, j) ∈ A1per time horizon
the container handling charges at the transhipment nodes are also linear in volume
and denoted byHij for all (i, j) ∈ A1
⋃A2. The handling cost applies to all arcs since
every arc starts or ends at a seaport or inland terminal; the main difference between
combined and road transport is that in the former handling charges are applied twice
both at the seaport and the inland terminal compared to just the seaport handling
charges that apply in the latter.
We consider a set of barges, b ∈ B, with different cost and capacity characteristics.
The cost of operating barges, from a barge operator’s perspective, consists of several
components, such as assets, crew, fuel, and maintenance (Braekers et al., 2012). The
cost faced by the extended gate operator, assuming that it does not use its own
barges, is the price scheme proposed by barge operating companies which consists
of the above costs enhanced by a profit margin for the barge operator. The leasing
cost of a barge for a week is denoted by wb for all b ∈ B which includes both asset
and staff cost required to navigate and operate the barges. Economies of scale apply
in this leasing cost when higher capacity barges are selected; crew cost for barge
navigation and operation are concave in the capacity of the barge. A variable cost
per round trip, vbij for all (i, j) ∈ A1, b ∈ B, is also considered to represent the fuel
cost of barges which is assumed to be linear to distance traveled but variable to the
size (capacity), Qb, of the barge. The number of round trips per time horizon that a
barge can perform to an extended gate, nbij for all (i, j) ∈ A1, b ∈ B is bounded from
above by physical and technical characteristics like the distances traveled, sailing
speed, handling times on seaport and inland terminals, and delays.
4.3.1.3 Decision variables
At the first level, the extended gate operator designs and prices its services. First,
the prices T ij for all (i, j) ∈ A1 are modeled as the price per TEU transferred
55

Chapter 4
Table 4.4: Decision variables
Tij Price per TEU for traveling on arc (i, j) ∈ A1
ubij Number of barges, b ∈ B, assigned to corridor (i, j) ∈ A1
ybij Number of shuttle services performed per barge b ∈ B oncorridor (i, j) ∈ A1
yij Frequency of services on corridor (i, j) ∈ A1
ycij ∈ 0, 1 Denoting whether commodity c ∈ C can be routed throughlink (i, j) ∈ A1 with respect to the time constraints.
Y cij Amount of TEUs of commodity c ∈ C assigned in arc
(i, j) ∈ A1
Xcij Amount of TEUs of commodity c ∈ C assigned in arc
(i, j) ∈ A2
tdij Frequency delays, inversely proportional to theconnection’s frequency on arc (i, j) ∈ A1
through a corridor to and from an extended gate. This decision variable determines
the revenue for the extended gate operator at the first level and part of the cost
faced by the shippers at the second level. Second, the design variables ubij for all
(i, j) ∈ A1, b ∈ B denote the number of barges of type b that are assigned to each
extended gate. The integer design variables ybij for all (i, j) ∈ A1, b ∈ B denote
the number of trips a barge of type b will perform at corridor (i, j), and yij for all
(i, j) ∈ A1 denote the frequency of service on the candidate extended gate corridors.
We also introduce the auxiliary Boolean variable ycij for all (i, j) ∈ A1, c ∈ C that
denotes whether commodity c can be routed through link (i, j) ∈ A1 with respect
to the time constraints. On the second level, the collective of customers chooses the
minimum cost paths to transport their containers by deciding on the flow variables,
Y cij for all (i, j) ∈ A1, c ∈ C and Xc
ij for all (i, j) ∈ A2, c ∈ C which denote the
amount of TEUs assigned to each arc of the network.
4.3.1.4 Time parameters
We assume the transport times, tbij for all (i, j) ∈ A1, b ∈ B and ttij for all (i, j) ∈ A2
for barges and trucks respectively. The expected dwell time of containers at seaport
terminals is assumed to consist of two components. First, a customs delay tnij for
all (i, j) ∈ A1
⋃A2 that would be the average time it takes for a container to be
released by customs so that containers could leave the seaport terminal. Under the
extended gate concept, containers are transported to the inland terminals under the
customs license of the extended gate operator so these customs delays are considerably
56

4.3 Modeling
Table 4.5: Time Parameters
tbij Transportation time of barge b ∈ B traveling on arc(i, j) ∈ A1
ttij Transportation time of trucks traveling on arc (i, j) ∈ A2
tnij Customs delay associated with travelling on arc(i, j) ∈ A1
⋃A2
lower than the ones realized by direct trucking. Second, the frequency delays tdij for
all (i, j) ∈ A1 which are assumed to be inversely proportional to the connection’s
frequency and can be calculated by tdij = 12yij
. The frequency delays represent the
expected time a container would have to dwell at the seaport terminal until the
next barge itinerary would depart. For arcs served by trucks infinite frequency is
assumed and thus zero frequency delays are considered for direct truck transport.
The frequency of connections is a design variable in our model and thus the service
time of combined transport is also a design variable that determines the market
penetration of combined services.
The parameter M represents a relatively large value for which we assume that M ≥∑c∈C
dc.
4.3.2 The model
In this section the mathematical formulation of our bilevel model is presented.
4.3.2.1 First level (FL)
FL : maxT,Y,u,y
∑c∈C
∑(i,j)∈A1
T ijYcij −
∑b∈B
∑(i,j)∈A1
wbubij −
∑b∈B
∑(i,j)∈A1
vbijybij (4.1)
∑c∈C
Y cij ≤
∑b∈B
Qbybij ∀ (i, j) ∈ A1 (4.2)
ybij ≤ nbiju
bij ∀ (i, j) ∈ A1, b ∈ B (4.3)
57

Chapter 4
yij =∑b∈B
ybij ∀ (i, j) ∈ A1 (4.4)
ycOck ≤ 2 · (tc − tnOck − tbOck − ttkDc
) · yOck ∀ (Oc, k) ∈ A1, c ∈ C (4.5)
Y cij ≤ ycijM ∀ (i, j) ∈ A1, c ∈ C (4.6)
ycij ∈ {0, 1} ∀ (i, j) ∈ A1, c ∈ C (4.7)
yij ∈ N0 ∀ (i, j) ∈ A1 (4.8)
ubij ∈ N
0 ∀ (i, j) ∈ A1, b ∈ B (4.9)
The first level objective (4.1) represents the profits of the extended gate operator
and consists of the revenue from the extended gate services diminished by the cost
of operating the extended gate corridors. The capacity constraints are given in (4.2)
which guarantee that the sum of the flows in each corridor is less than its capacity.
Constraints (4.3) and (4.4) determine the service frequency in a corridor when several
barges are assigned to it. Service time constraints are introduced in (4.5) and (4.6)
that guarantee that the expected service time for each commodity should be less or
equal than its desired service time, tc. It should be noted that in order to obtain a
feasible solution it should hold that tc ≥ tnOcDc + ttOcDc for all c ∈ C; that is that thetime restriction set by each commodity can always be satisfied by the quickest path,
which is direct trucking.
Constraints (4.5) are the linear equivalent of constraint (4.10) in which the left hand
58
4.3 Modeling
side expresses the expected service time for combined transport while the right hand
side is the desired level of service time as expressed by the shippers for each com-
modity.
ycOck
(1
2yOck+ tnOck + tbOck + ttkDc
)≤ tc
∀ (Oc, k) ∈ A1, (k,Dc) ∈ A2, c ∈ C (4.10)
The service time constraints could also be expressed as a minimum frequency at each
corridor, f cij , so in that case constraints (4.5) should be substituted by constraint
(4.11). The minimum frequency requirements f cij can be derived from the desired
service time tc according to f cij =
⌈1
2·(tc−tnOck
−tbOck
−ttkDc)
⌉∀ (Oc, k) ∈ A1, (k,D
c) ∈A2, c ∈ C.
f ciky
cik ≤ yik ∀ (i, k) ∈ A1, c ∈ C (4.11)
4.3.2.2 Second level (SL)
SL : minX,Y
∑ij∈A1
(T ij +Hij)∑c∈C
Y cij +
∑ij∈A2
(Cij +Hij)∑c∈C
Xcij (4.12)
∑i∈N
(Y cij +Xc
ij
)− ∑i∈N
(Y cji +Xc
ji
)= dcj ∀j ∈ N , c ∈ C (4.13)
Xcij , Y
cij ≥ 0 ∀ (i, j) ∈ A1,A2, c ∈ C (4.14)
The second objective (4.12) minimizes the total system cost. This cost consists of
transport cost in arcs controlled both by the extended gate operator (what is seen as
revenue for the leader is seen as cost for the follower) and by the competition, and
of the container handling charges on both seaport and inland terminals. Constraints
(4.13) are the flow conservation constraints.
59

Chapter 4
4.3.2.3 Moving constraints to the upper Level
In general bi-level programs, constraints that contain decision variables of both the
first and second level should apply at the second level. Moving such constraints
between the levels changes both the feasible region and the optimal solutions of the
problem. So both capacity constraints (4.2) and minimum frequency constraints (4.6)
should originally apply at the second level.
Brotcorne et al. (2008) showed, for the general case, that a problem P2 where capacity
constraints apply on the upper level is a restriction of an equivalent problem P1
where the same constraints apply on the lower level but it is a special feature of joint
design and pricing class of problems that the optimal solution is not affected by this
operation.
In particular she showed that general capacity constraints with A · x ≤ b format,
that could result for given design vectors, can be freely moved from one level to the
other. Both our capacity constraints∑c∈C
Y cij ≤ ∑
b∈BQbybij , and minimum frequency
constraints Y cij ≤ ycijM , can take the above format with the appropriate A and b
vectors, when the design parameters ybij and ycij are given. So the corollary 1 given
by Brotcorne et al. (2008) will also hold for this case and the sets of constraints (4.2)
and (4.6) can be moved to the upper level, without affecting the optimal solution
space.
4.3.3 MIP equivalent formulation (MIP EQ)
In this section, we define the MIP equivalent formulation of our problem in order to
be able to solve to optimality instances of our problem using commercial solvers like
CPLEX. The difficulty in solving this problem lies in the bi-level structure of our
model and in the bi-linear term, TijYcij , in the objectives. The bi-linear term in the
objective is usually eliminated by the use of its complementarity slackness constraints
while the second level objective is replaced by its primal dual optimality conditions
(Brotcorne et al. 2008, 2005). This approach in addition to the constraints that force
the equality of the primal and dual lower level objectives restricts every commodity
to be routed exclusively through its minimum cost path. The above may be sufficient
if one considers the uncapacitated version of the problem, where routing through the
minimum cost path always provides the optimal solution for both the upper and
lower levels of the problem, but can have significant impact when capacities over the
60
4.3 Modeling
arcs of the network are considered. In the latter case, the flows of a commodity might
be routed through several paths either controlled by the extended gate operator or
by the competition if the total flows on a corridor exceed its capacity. Flows of
containers are attracted to corridors controlled by the extended gate operator when
they result in path cost lower or equal to the minimum cost path offered by the
competition.
We propose an alternative approach to address the problems arising by the bi-linear
term in the objective, in which we obtain a linear equivalent formulation of this
term. In our case, every port-to-door path can go through at most one tariff arc
controlled by the extended gate operator. This simplifies the pricing scheme, since
prices in different corridors do not interact. So we introduce the equilibrium level of
the prices, γcij for all (i, j) ∈ A1, c ∈ C, that would make the routing of a commodity
through a corridor economically effective. Setting the price at a corridor above or
below that equilibrium level would prohibit or allow the flow of the corresponding
commodity through that corridor. These levels of prices should make the combined
transport path cost neutral to the tariff free path offered by the competition, and we
can obtain them according to γcOcj +HOcj + CjDc +HjDc = COcDc +HOcj for all
(Oc, j) ∈ A1, c ∈ C . The γcij takes both positive and negative values but of course
the optimal price at a corridor, Tij , will take positive values such that revenues will
be generated and will take the value of the equilibrium level of the price for some
commodity. The auxiliary Boolean variable, βcij for all (i, j) ∈ A1, c ∈ C, denotes
which exactly equivalent level of price of commodities will be the price at each corridor
such that T ijYcij = γe
ijβeijY
cij for all (i, j) ∈ A1, c ∈ C, e ∈ C. The new formulation
of the revenues is still bi-linear, since it is the product of Boolean and continuous
variables, but such a bi-linearity can be easily linearized by the introduction of a
continuous variable, δc,eij = βeijY
cij for all (i, j) ∈ A1, c ∈ C, e ∈ C and the set of
constraints (4.16)− (4.20).
We substitute the second level (SL) problem with its optimality conditions (4.21)−(4.26). For this purpose some additional notation is used. The auxiliary Boolean
variables Y cij for all (i, j) ∈ A1, c ∈ C and Xc
ij for all (i, j) ∈ A2, c ∈ C denotes whether
flows from commodity c can be routed through the associated links with respect to
the total cost of the path they belong to. The price per commodity and arc is denoted
by T cij for all (i, j) ∈ A1, c ∈ C and is restricted to take the same value for containers
routed through the same corridor by constraints (4.24) − (4.25). Constraints (4.23)
impose that flows can be routed through a corridor controlled by the leader only if
they result in path cost lower than the one offered by the competition; that means
61
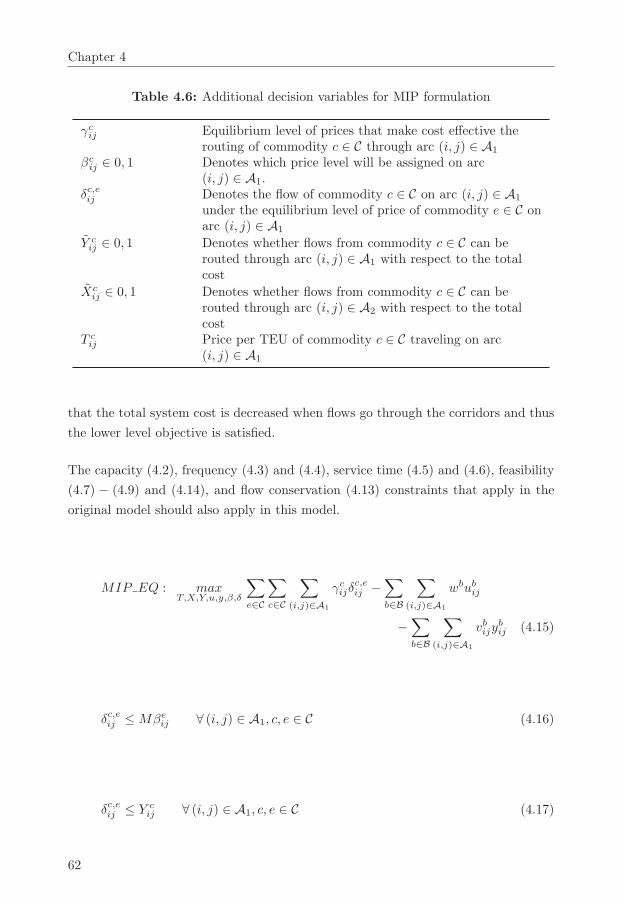
Chapter 4
Table 4.6: Additional decision variables for MIP formulation
γcij Equilibrium level of prices that make cost effective the
routing of commodity c ∈ C through arc (i, j) ∈ A1
βcij ∈ 0, 1 Denotes which price level will be assigned on arc
(i, j) ∈ A1.δc,eij Denotes the flow of commodity c ∈ C on arc (i, j) ∈ A1
under the equilibrium level of price of commodity e ∈ C onarc (i, j) ∈ A1
Y cij ∈ 0, 1 Denotes whether flows from commodity c ∈ C can be
routed through arc (i, j) ∈ A1 with respect to the totalcost
Xcij ∈ 0, 1 Denotes whether flows from commodity c ∈ C can be
routed through arc (i, j) ∈ A2 with respect to the totalcost
T cij Price per TEU of commodity c ∈ C traveling on arc
(i, j) ∈ A1
that the total system cost is decreased when flows go through the corridors and thus
the lower level objective is satisfied.
The capacity (4.2), frequency (4.3) and (4.4), service time (4.5) and (4.6), feasibility
(4.7) − (4.9) and (4.14), and flow conservation (4.13) constraints that apply in the
original model should also apply in this model.
MIP EQ : maxT,X,Y,u,y,β,δ
∑e∈C
∑c∈C
∑(i,j)∈A1
γcijδ
c,eij −
∑b∈B
∑(i,j)∈A1
wbubij
−∑b∈B
∑(i,j)∈A1
vbijybij (4.15)
δc,eij ≤ Mβeij ∀ (i, j) ∈ A1, c, e ∈ C (4.16)
δc,eij ≤ Y cij ∀ (i, j) ∈ A1, c, e ∈ C (4.17)
62

4.3 Modeling
δc,eij ≥ Y cij −M
(1− βe
ij
) ∀ (i, j) ∈ A1, c, e ∈ C (4.18)
T ij =∑c∈C
γcijβ
cij ∀ (i, j) ∈ A1 (4.19)
∑c∈C
βcij ≤ 1 ∀ (i, j) ∈ A1 (4.20)
Y cij ≤ M · Y c
ij ∀ (i, j) ∈ A1 (4.21)
Xcij ≤ M · Xc
ij ∀ (i, j) ∈ A2 (4.22)
T cOcj +HOcj Y
cOcj + (CjDc +HjDc) Xc
ij ≤ COcDc +HOcDc
∀ (Oc, j) ∈ A1, c ∈ C (4.23)
−M ·(1− Y c
ij
)≤ T c
ij − Tij ≤ M ·(1− Y c
ij
)∀ (i, j) ∈ A1, c ∈ C (4.24)
−M · Y cij ≤ T c
ij ≤ M · Y cij ∀ (i, j) ∈ A1, c ∈ C (4.25)
βcij , Y
cij , X
cij ∈ {0, 1} ∀ (i, j) ∈ A1, c ∈ C (4.26)
63

Chapter 4
δc,eij ≥ 0 ∀ (i, j) ∈ A1, c, e ∈ C (4.27)
4.3.4 Experimental design
In this section, we discuss some of the main assumptions that underlie the Joint
Design and Pricing models and compare them with the assumptions that underly
the usual network design models. Moreover we propose a transformation of our
original model in a single level network design model to assess the effect of joint
design and pricing.
4.3.4.1 Port-to-port service
Our model in the present format fits the definition of port-to-port transport service.
That is the extended gate operator provides transportation services only among the
seaport and inland terminals with high capacity modalities while the last leg of the
transportation path from the inland terminal to the customer premises is organized
by the competition. It follows that the prices over the extended gate services should
be such that the total cost of the path through the extended gates should be at least
cost neutral to the direct path provided by the competition.
4.3.4.2 Port-to-door service
In other cases, the extended gate operator can offer port-to-door transport services. If
so, prices do not depend on the routing of the containers but on the best alternative
transport solution to that specific destination. Thus we can derive an alternative
port-to-door network design model by fixing the prices per commodity for the entire
path, T c. This will determine the revenues of the carrier which will be diminished
by all costs for leasing and operating the barges as much as the transport cost and
handling charges in order to obtain its profits, so the objective function will be equal
to (4.28). The capacity (4.2), frequency (4.3) and (4.4), service time (4.5) and (4.6),
feasibility (4.7)−(4.9) and (4.14), and flow conservation (4.13) constraints that apply
in the original model should also apply in this model. Since the prices are considered
fixed, for the port to door case, the bi-linear term in the objective is eliminated, so
a classical single level MIP is considered.
64
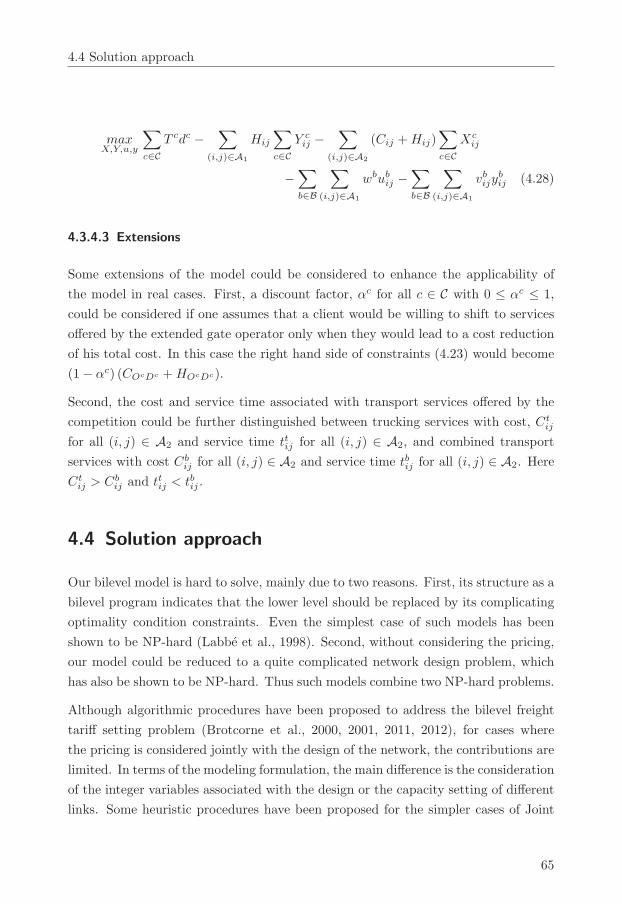
4.4 Solution approach
maxX,Y,u,y
∑c∈C
T cdc −∑
(i,j)∈A1
Hij
∑c∈C
Y cij −
∑(i,j)∈A2
(Cij +Hij)∑c∈C
Xcij
−∑b∈B
∑(i,j)∈A1
wbubij −
∑b∈B
∑(i,j)∈A1
vbijybij (4.28)
4.3.4.3 Extensions
Some extensions of the model could be considered to enhance the applicability of
the model in real cases. First, a discount factor, αc for all c ∈ C with 0 ≤ αc ≤ 1,
could be considered if one assumes that a client would be willing to shift to services
offered by the extended gate operator only when they would lead to a cost reduction
of his total cost. In this case the right hand side of constraints (4.23) would become
(1− αc) (COcDc +HOcDc).
Second, the cost and service time associated with transport services offered by the
competition could be further distinguished between trucking services with cost, Ctij
for all (i, j) ∈ A2 and service time ttij for all (i, j) ∈ A2, and combined transport
services with cost Cbij for all (i, j) ∈ A2 and service time tbij for all (i, j) ∈ A2. Here
Ctij > Cb
ij and ttij < tbij .
4.4 Solution approach
Our bilevel model is hard to solve, mainly due to two reasons. First, its structure as a
bilevel program indicates that the lower level should be replaced by its complicating
optimality condition constraints. Even the simplest case of such models has been
shown to be NP-hard (Labbe et al., 1998). Second, without considering the pricing,
our model could be reduced to a quite complicated network design problem, which
has also be shown to be NP-hard. Thus such models combine two NP-hard problems.
Although algorithmic procedures have been proposed to address the bilevel freight
tariff setting problem (Brotcorne et al., 2000, 2001, 2011, 2012), for cases where
the pricing is considered jointly with the design of the network, the contributions are
limited. In terms of the modeling formulation, the main difference is the consideration
of the integer variables associated with the design or the capacity setting of different
links. Some heuristic procedures have been proposed for the simpler cases of Joint
65
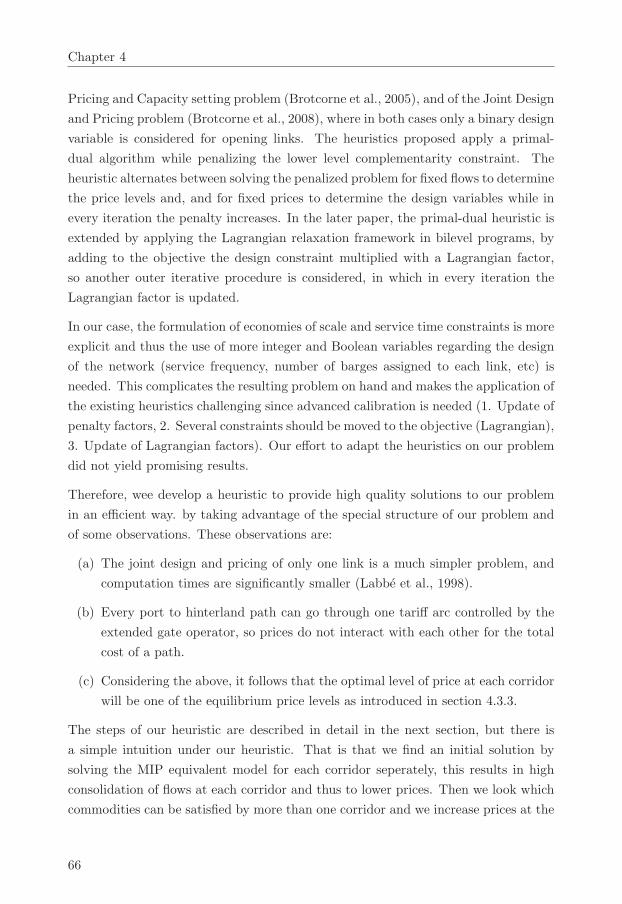
Chapter 4
Pricing and Capacity setting problem (Brotcorne et al., 2005), and of the Joint Design
and Pricing problem (Brotcorne et al., 2008), where in both cases only a binary design
variable is considered for opening links. The heuristics proposed apply a primal-
dual algorithm while penalizing the lower level complementarity constraint. The
heuristic alternates between solving the penalized problem for fixed flows to determine
the price levels and, and for fixed prices to determine the design variables while in
every iteration the penalty increases. In the later paper, the primal-dual heuristic is
extended by applying the Lagrangian relaxation framework in bilevel programs, by
adding to the objective the design constraint multiplied with a Lagrangian factor,
so another outer iterative procedure is considered, in which in every iteration the
Lagrangian factor is updated.
In our case, the formulation of economies of scale and service time constraints is more
explicit and thus the use of more integer and Boolean variables regarding the design
of the network (service frequency, number of barges assigned to each link, etc) is
needed. This complicates the resulting problem on hand and makes the application of
the existing heuristics challenging since advanced calibration is needed (1. Update of
penalty factors, 2. Several constraints should be moved to the objective (Lagrangian),
3. Update of Lagrangian factors). Our effort to adapt the heuristics on our problem
did not yield promising results.
Therefore, wee develop a heuristic to provide high quality solutions to our problem
in an efficient way. by taking advantage of the special structure of our problem and
of some observations. These observations are:
(a) The joint design and pricing of only one link is a much simpler problem, and
computation times are significantly smaller (Labbe et al., 1998).
(b) Every port to hinterland path can go through one tariff arc controlled by the
extended gate operator, so prices do not interact with each other for the total
cost of a path.
(c) Considering the above, it follows that the optimal level of price at each corridor
will be one of the equilibrium price levels as introduced in section 4.3.3.
The steps of our heuristic are described in detail in the next section, but there is
a simple intuition under our heuristic. That is that we find an initial solution by
solving the MIP equivalent model for each corridor seperately, this results in high
consolidation of flows at each corridor and thus to lower prices. Then we look which
commodities can be satisfied by more than one corridor and we increase prices at the
66
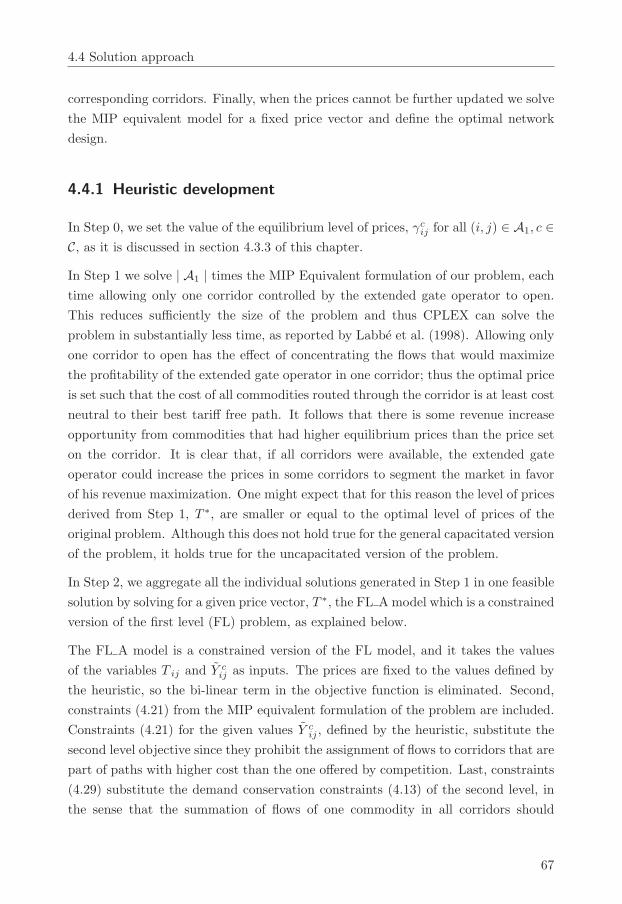
4.4 Solution approach
corresponding corridors. Finally, when the prices cannot be further updated we solve
the MIP equivalent model for a fixed price vector and define the optimal network
design.
4.4.1 Heuristic development
In Step 0, we set the value of the equilibrium level of prices, γcij for all (i, j) ∈ A1, c ∈
C, as it is discussed in section 4.3.3 of this chapter.
In Step 1 we solve | A1 | times the MIP Equivalent formulation of our problem, each
time allowing only one corridor controlled by the extended gate operator to open.
This reduces sufficiently the size of the problem and thus CPLEX can solve the
problem in substantially less time, as reported by Labbe et al. (1998). Allowing only
one corridor to open has the effect of concentrating the flows that would maximize
the profitability of the extended gate operator in one corridor; thus the optimal price
is set such that the cost of all commodities routed through the corridor is at least cost
neutral to their best tariff free path. It follows that there is some revenue increase
opportunity from commodities that had higher equilibrium prices than the price set
on the corridor. It is clear that, if all corridors were available, the extended gate
operator could increase the prices in some corridors to segment the market in favor
of his revenue maximization. One might expect that for this reason the level of prices
derived from Step 1, T ∗, are smaller or equal to the optimal level of prices of the
original problem. Although this does not hold true for the general capacitated version
of the problem, it holds true for the uncapacitated version of the problem.
In Step 2, we aggregate all the individual solutions generated in Step 1 in one feasible
solution by solving for a given price vector, T ∗, the FL A model which is a constrained
version of the first level (FL) problem, as explained below.
The FL A model is a constrained version of the FL model, and it takes the values
of the variables T ij and Y cij as inputs. The prices are fixed to the values defined by
the heuristic, so the bi-linear term in the objective function is eliminated. Second,
constraints (4.21) from the MIP equivalent formulation of the problem are included.
Constraints (4.21) for the given values Y cij , defined by the heuristic, substitute the
second level objective since they prohibit the assignment of flows to corridors that are
part of paths with higher cost than the one offered by competition. Last, constraints
(4.29) substitute the demand conservation constraints (4.13) of the second level, in
the sense that the summation of flows of one commodity in all corridors should
67

Chapter 4
Step 0Initialization.γcOcj ← COcDc − CjDc +HjDc ∀ (Oc, j) ∈ A1, c ∈ C .
Step 1For each (i, j) ∈ A1, set Y
cij′ = 0 | ∀ (i, j′) �= (i, j) , c ∈ C and solve MIP EQ.
=⇒ T ∗ij ,Yc∗ij .
Step 2Take T ∗ij ∀ (i, j) ∈ A1, Y
c∗ij ∀ (i, j) ∈ A1, ∀c ∈ C as input and solve the FL A.
=⇒ z∗.
Step 3Let C1 =
{c ∈ C | ∑
(i,j)∈A1
Y cij ≥ 2
}.
Step 4
Let C2 ={c ∈ C | γc
ij= T ij ∃ ¯(i, j) ∈ A1
}.
Step 5If C1 ∩ C2 ∈ ∅then go to Step 8else go to Step 6.Step 6For each c ∈ C1 ∩ C2,Y cij← 0 and T ij ← γ
′ijwhen γ
′ij= min
(γcij| Y c∗
ij= 1
)and solve the FL A problem.
=⇒zc.=⇒ z = max (zc) and c be the corresponding commodity.Step 7If z > z∗thenz∗ ←− zT ∗
ij←− γ
′ij
Y c∗ij ←− 0
go to Step 3elsego to Step 8Step 8For fixed T ∗ij ∀ (i, j) ∈ A1 solve the MIP EQ
=⇒z∗,ub∗ij ,y
∗ij Y c∗
ij & Xc∗ij
Notation:←Assign Value to a parameter, =⇒Output is generated by a program
Figure 4.1: Heuristic
68

4.4 Solution approach
not exceed its demand volume. Some commodities can be routed through several
corridors controlled by the extended gate operator since their resulting path cost is
lower than the one offered by the competition. Considering the price vector of the
extended gate operator, they will be routed through the paths that generate the
highest profit for the extended gate operator. The solution of this problem is feasible
since both capacity and service level constraints are considered while the feasibility
of the second level is guaranteed by constraints (4.21) and (4.29).
∑(i,j)∈A1
Y cij ≤ dc ∀c ∈ C (4.29)
In Step 3, we identify which commodities are assigned to more than one extended gate
corridor. If no commodities are assigned to more than one corridor, the aggregation
of the individual solutions is the optimal solution.
In Step 4, we identify the commodities for which their equilibrium level of prices is
equal to the prices set on the corridors controlled by the extended gate operator.
In Step 5, we check whether the intersection of the two sets of commodities obtained
in Steps 3 and 4 is empty. If it is empty, our heuristic terminates in Step 8. Otherwise
it continues to Step 6. In case a commodity, c, satisfies both conditions in Steps 3 and
4, then one may opt to increase the price at the corresponding extended gate corridor
and thus prohibit its routing through it. In this manner, the commodity is guided
via extended gates where the prices are higher, although it remains competitive.
The remaining flows in the former extended gate corridor will also generate higher
revenues.
In Step 6, for each commodity that satisfies the conditions in Steps 3 and 4, we try to
increase the price on the corresponding corridors and solve the FL A problem while
keeping the optimal solutions.
In Step 7, we check whether the maximum among the solutions obtained in Step 6
is higher than the best solution found until now. If it is better, the corresponding
variables are updated and the heuristic makes another iteration from Step 4 else it
terminates in Step 8.
In Step 8, we solve the MIP equivalent formulation of our original problem for the
tariffs obtained such that the design and flow decision variables are determined.
69

Chapter 4
The heuristic will always terminate after a number of iterations. The number of
iterations can vary and in the worst case scenario, were all price levels are tried for
all corridors, there will be |A1| · |C| iterations.
4.4.2 Heuristic assessment
In order to assess the performance of the heuristic described in section 4.4.1, we gen-
erated instances randomly and we solved them by both the MIP equivalent program
using CPLEX 12, and by our heuristic. Both the heuristic and the MIP equivalent
program were formulated and solved in MATLAB 2012b, while we set for CPLEX
a time limit of 500 sec to solve the problem. For the cases where this limit was
exceeded, we consider the optimal upper bound achieved.
The instance generator works as follows: first the skeleton of the network is generated
by defining the number of source, sink and transhipment nodes, the coordinates
of which are randomly generated in two-dimensional space following the uniform
distribution within a radius defined by the user. The source nodes are connected
with the sink nodes directly with arcs, and then the source nodes are connected with
the transhipment nodes; these will be the arcs controlled by the network operator,
finally the transhipment nodes are connected with all the sink nodes. The lengths
of all arcs are equal to the Euclidean distances between the nodes, and moreover
the associated cost is determined by a fixed cost and a variable cost linear in the
distance of each arc. Finally, the commodities are randomly generated by defining
the sink and source nodes, the amount of flow and service level requirements in terms
of minimum frequency required to assign the flows in a specific arc. We solved ten
instances for every setting in order to assess the performance of the algorithm.
The results are summarized in Tab. 4.7 where the average computation times and
the average gap from the optimal solutions are presented for 10 randomly generated
instances with the specifications stated in the first three columns of the matrix.
CPLEX needs significantly more computation time on average even for small or
medium sized instances, while we see that in both cases the computation time mainly
depends on the number of commodities considered while the number of nodes of the
network has significant effect only on the computation time of CPLEX. The gap
between the optimal solution and the one obtained by the heuristics seems to be less
than 2% in average.
70

4.5 Experimental results
Table 4.7: Heuristic Assessment
Instance InlandTermi-nals
ClientNodes
Commodities CPLEXCPU(Sec)(Limit500 Sec)
HeuristicCPU(Sec)
OptimalSolution
%
1 10 20 30 25.53 4.46 99.38%2 10 20 60 141.97 10.62 98.56%3 10 30 30 32.67 4.29 98.22%4 10 30 60 367.48 13.62 97.99%5 20 20 30 395.95 6.34 99.77%6 20 20 60 500.13 18.60 99.58%7 20 30 30 320.56 8.23 99.30%8 20 30 60 500.27 26.24 99.28%
4.5 Experimental results
In this section we formulate a stylized but realistic example and run experiments
in order to assess the effect of the different considerations on the network design
problem. In particular, we study whether there are any differences in the optimal
network design when we assume port-to-port versus port-to-door services and also we
assess the effect of considering service level constraints in the tactical service network
design. The optimal multimodal network design is case specific and may depend on
physical characteristics of the network, the demand distributions over the network
and other parameters, so our results may not be generalized but they do demonstrate
the capabilities of our model to capture the tradeoffs among revenue maximization
in offering services, cost minimization in setting up the combined transport network,
and demand penetration through frequent services on corridors.
Although we develop a stylized example, all cost structures considered in this chapter
are inspired by real cost structures covered by a confidentiality factor, i.e. so we use
monetary units, m; full details on the cost structures can be found in Van Riessen
et al. (2013). We consider a network consisting of one seaport terminal and 3 inland
terminals; see Fig. 4.2. That means that container demand for one inland region
can be served via an extended gate located in another region. The costs of road
transport are presented in Tab. 4.8 and are calculated based on the formula: Cij =
76.4+ 1.06 · distance (i, j). In order to simplify the network we assume that demand
is destined to the inland regions of inland terminals, so only the fixed cost applies
71

Chapter 4
Figure 4.2: Stylized Example Physical Network
Table 4.8: Transportation Cost via Road (m/TEU)
ST IT1 IT2 IT3
ST 76.4 232.4 263.6 336.4IT1 232.4 76.4 118 190.8IT2 263.6 118 76.4 159.6IT3 336.4 190.8 159.6 76.4
for the end haulage leg from the inland terminal to the customer’s premises located
in the same region. The weekly fixed costs for barge leasing and the variable costs
per barge trip are presented in Tab. 4.9. The additional handling charges at inland
terminals is set equal to 23m/TEU.
In order to assess the performance and the main differences of using the different
network design formulations we set up an experiment by differentiating the demand
volumes over the stylized network, which ranges from 180 to 2.340 TEUs per week.
Table 4.9: Barge Types and Characteristics
#Capacity(TEUs)
Weekly Cost Variable Cost per Trip
ST-IT1 ST-IT2 ST-IT3
Max Number of RoundTrips 3 3 2
1 100 7.500m 225m 270m 375m
2 200 10.000m 285m 342m 475m
72

4.5 Experimental results
Table 4.10: Experimental Setting
OD pair CommoditiesMinimumServiceFrequency
Percentile
ST-IT11 1 20%2 3 50%3 6 30%
ST-IT24 1 20%5 3 50%6 6 30%
ST-IT37 1 20%8 3 50%9 6 30%
We assume that the demand is equally distributed among the OD pairs. Finally,
the demand is further organized in commodities to capture the different service time
requirements which are shown by the minimum service frequency (Tab. 4.10).
The results of the experiment are presented graphically in several figures. Fig. 4.3
and Fig. 4.4 concentrate the results for the cases with and without considering service
time constraints, respectively.
The graphs in Fig. 4.3 and Fig. 4.4 should be evaluated with care and be read as fol-
lows. There are four main cases tested; 1) port-to-port with service time constraints
(Fig. 4.3a,c, and e), 2) port-to-door with service time constraints (Fig. 4.3b,d, and f),
3) port-to-port without service time constraints (Fig. 4.4a,c, and e), 4) port-to-door
with service time constraints (Fig. 4.4b,d, and f). For each case, in the horizontal
axis of each graph, a weekly demand scenario is considered. The weekly container
demand, a variable in our experiment, is considered to be equally distributed over the
three inland regions and also further organized in commodities according to Tab. 4.10.
The optimal capacity setting (Fig. 4.3.a and Fig. 4.3.b, Fig. 4.4.a and Fig. 4.4.b), con-
nection frequency on the corridors (Fig. 4.3.c and Fig. 4.3.d, Fig. 4.4.c and Fig. 4.4.d),
and the flows of containers over the network are shown (Fig. 4.3.e and Fig. 4.3.f,
Fig. 4.4.e and Fig. 4.4.f).
The results can be read in two ways. First, for each case one can observe what is
the difference in the optimal designs for increasing demand. Second, for the same
demand instances one could contrast the differences in the optimal designs among
the different cases.
73

Chapter 4
4.5.1 Port-to-port vs port-to-door haulage
In this section we study whether any significant differences appear when assuming
port-to-port versus port-to-door services while solving the two models discussed in
sections 4.4.1 and 4.4.2. The main modeling difference between the two is that for
the port-to-door model the pricing is disconnected from the design of the network, so
it is mainly a cost minimization problem, while for the port to port model the joint
design and pricing of network services is considered, and thus the pricing affects the
routing of flows through the networks discussed previously in this chapter.
We observe that when demand is low flows are concentrated
Fig. 4.5 and Fig. 4.6 present the network configurations for some selected demand
instances where the optimal designs significantly differ. In addition to the information
provided in the previous figures now also the number and size of barges is presented
as much as the path each commodity is assigned to.
When demand is low (180 TEUs per week) only the central one ST-IT2 is opened with
one and two small barges, for port to port and port to door cases respectively. In case
of port to door services a frequency of 6 trips per week is achieved and all flows are
consolidated on that corridor since the service time constraints for all commodities
are met when routed through the ST-IT2 corridor. In case of port-to-port service,
when pricing is considered, only one barge is assigned to the central corridor and a
frequency of 3 trips per week is achieved, thus only medium and slow moving flows
are assigned to that corridor. Reducing the price of the central corridor in order to
make the routing of flows destined IT3 through the central corridor cost effective
would result in lower net revenues for the network operator.
In case of port-to-door service this remains the optimal design until the demand
over the network exceeds the capacity of the corridor (Fig. 4.6.a and Fig. 4.6.b). On
the other hand, if port-to-port service is assumed, the ST-IT1 corridor is opened
earlier for the achievement of revenue maximization through pricing (Fig. 4.5.b). In
both cases, there is a range of demand where both ST-IT1 and ST-IT2 corridors are
opened by assigning to them one (3 trips per week) and two (6 trips per week) small
barges respectively (Fig. 4.5.b and Fig. 4.5.c), where containers destined to the IT1
region with high service level requirements (Commodity 3) are routed through the
ST-IT2 corridor. The above design configuration remains in the optimal solutions of
even higher demand instances in case of port-to-door services (Fig. 4.6.d) such that
economies of scale are achieved by the assignment of larger barges in ST-IT1 corridor
74

4.5 Experimental results
with lower frequency. On the other hand, in case of port-to-port services, above a
demand threshold each commodity is satisfied by its corresponding corridor such that
revenues are maximized through pricing.
It is obvious that considering joint design and pricing has a significant effect on the
optimal network configurations compared to the usual cost minimization network
design. First, considering the port-to-door services provides more flexibility for the
routing of containers through the network with the result of more flow consolidation
in fewer corridors, especially when demand is low. Second, when port-to-port services
are considered, revenue maximization has a significant effect and high frequencies are
set in all corridors to meet service frequency requirements of all commodities such
that more dedicated services are offered.
Assuming that demand originates or is destined at the inland regions and that de-
mand is equally distributed among the inland regions may not be realistic. Never-
theless, our results show significant differences in the optimal network designs and
assuming unbalanced demand and the actual locations of shippers only has greater
effect on the differences among the optimal network designs for port-to-port and
port-to door services.
4.5.2 Impact of service level constraints
In this section we consider the same instances without considering the service time
constraints and compare them with the results presented in the previous section. The
graphs in Fig. 4.4 should be read in comparison with those presented in Fig. 4.3.
First we observe that considering service level constraints had a significant impact
on the optimal network design, especially when demand is relatively low. We observe
that the effect of economies of scale through the use of bigger barges dominates the
optimal network configurations. So high frequent connections are achieved only when
demand is high. Second, we observe that all corridors are opened for lower demand
realizations; that is because for this case it is assumed that all demand can be satisfied
even with low frequency services. That means that beyond a demand threshold in
each region, a corridor to that region is opened. Higher demand will also be covered
by the same corridor although the capacity on that corridor will increase accordingly.
This means that the quality of service provided in each corridor, controlled by its
frequency, does not influence the routing of containers based on their service time
characteristics. Again one can observe differences between assuming port-to-door
75

Chapter 4
and port-to-port services since in the latter the revenue maximization through pricing
forces the extended gates to open earlier than they do in the former.
4.6 Conclusions
In this chapter we presented two models for the tactical design of multimodal port-
hinterland transport services, namely for the design of port-to-port and port-to-
door services. The models capture the trade-offs between revenue maximization,
economies of scale and market penetration through the service frequency setting. We
contribute to the existing body of modeling literature by extending the joint design
and pricing bi-level formulations to the multimodal nature of such services and we
add service time constraints to capture the different transport time performances
among different modalities. We propose a simple heuristic approach that provides
near optimal solutions in substantially less time than CPLEX.
In addition to the modeling contributions of this work, some managerial insights
can be drawn from our research. First, it seems that the cost of installing capacity
on corridors compared to the possible realization of revenues does not prohibit the
setting up of high-frequency services to meet service time constraints and increase
their market penetration. High-frequency connections are set up even for instances
with low demand, and larger barges are selected only after high-frequency services
have been established. In most of the solutions though, it is clear that the installed
capacity on the corridors is underutilized; this can be explained by the low break-even
utilization points of barges. Installing high-capacity corridors both lowers total cost
and provides buffer capacity to carriers to hedge against demand variability (Lium
et al., 2009).
Port-to-door services provide more consolidation opportunities because they give
more flexibility in the routing of commodities due to the disconnection between rout-
ing and pricing. When port-to-port services are assumed, the revenue management
(or market segmentation) through pricing that results in more dedicated services is
more important than achieving economies of scale through the use of larger barges.
It should be noted, though, that different assumptions underlie the two service types
and this leads to different optimal combined transport network configurations. So
in the case of port-to-port services, where not all links are controlled by the same
authority, the optimization models should be adjusted accordingly.
76

4.6 Conclusions
Moreover, our results show that, when an extended gate operator serves several close
regions, he has more flexibility in the design of the hinterland network. For example,
he can set up frequent services in one central corridor (or with higher flows) to meet
the requirements of fast-moving containers for all close regions while also setting up
lower-frequency services to transport slow-moving containers at a lower total cost.
The present chapter considers the competitive environment to be exogenous. An
extension of the research in this chapter could concern the interaction between two
or more extended gate operators that both design and price sub-networks to serve
the needs of a contestable hinterland. The above would require a Mathematical
Programming with Equilibrium Constraints (MPEC) formulation of the problem
which has still not been studied extensively in literature, but could also capture the
seaport calling selection of shipping lines based on their hinterland connectivity.
Appendix I
FLA : maxY,u,y
∑c∈C
∑(i,j)∈A1
T ijYcij −
∑b∈B
∑(i,j)∈A1
wbubij −
∑b∈B
∑(i,j)∈A1
vbijybij (4.30)
∑c∈C
Y cij ≤
∑b∈B
Qbybij ∀ (i, j) ∈ A1 (4.31)
ybij ≤ nbiju
bij ∀ (i, j) ∈ A1, b ∈ B (4.32)
yij =∑b∈B
ybij ∀ (i, j) ∈ A1 (4.33)
ycOck ≤ 2 · (tc − tnOck − tbOck − ttkDc
) · yOck ∀ (Oc, k) ∈ A1, c ∈ C (4.34)
Y cij ≤ ycijM ∀ (i, j) ∈ A1, c ∈ C (4.35)
77

Chapter 4
ycij ∈ {0, 1} ∀ (i, j) ∈ A1, c ∈ C (4.36)
yij ∈ N0 ∀ (i, j) ∈ A1 (4.37)
ubij ∈ N
0 ∀ (i, j) ∈ A1, b ∈ B (4.38)
Y cij ≤ M · Y c
ij ∀ (i, j) ∈ A1 (4.39)
∑(i,j)∈A1
Y cij ≤ dc ∀c ∈ C (4.40)
78

4.6 Conclusions
(a) port-to-port (b) port-to-door
(c) port-to-port (d) port-to-door
(e) port-to-port (f) port-to-door
Figure 4.3: Experiment results - With service level constraints
79

Chapter 4
(a) port-to-port (b) port-to-door
(c) port-to-port (d) port-to-door
(e) port-to-port (f) port-to-door
Figure 4.4: Experiment results - Without service level constraints
80
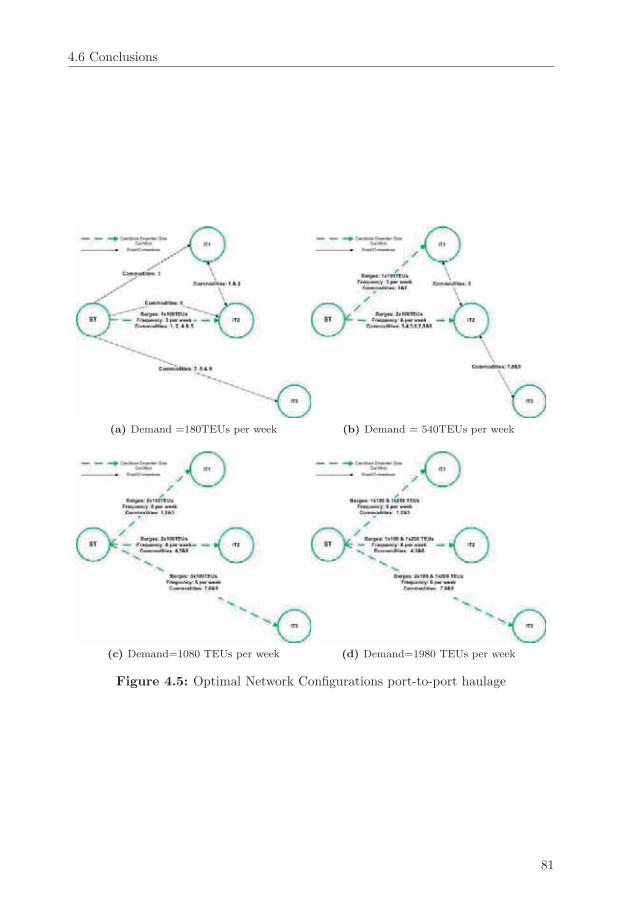
4.6 Conclusions
(a) Demand =180TEUs per week (b) Demand = 540TEUs per week
(c) Demand=1080 TEUs per week (d) Demand=1980 TEUs per week
Figure 4.5: Optimal Network Configurations port-to-port haulage
81

Chapter 4
(a) Demand =180TEUs per week (b) Demand = 540TEUs per week
(c) Demand=1080 TEUs per week (d) Demand=1980 TEUs per week
Figure 4.6: Optimal Network Configurations port-to-door haulage
82

5 Joint fleet deployment and barge
rotation network design: The case
of horizontal cooperation of
dryports
Summary: Offering frequent services of high capacity modes can make intermodal
transportation of containers between a seaport and inland locations competitive with
uni-modal road transport both from time and cost perspectives. The tactical design
of scheduled barge transport services involves decisions regarding both the fleet com-
position and its routing through the inland waterway network. Integrating these
decisions would make the resulting network more competitive in satisfying expected
demand and service time requirements set by the shippers. We develop some analyt-
ical expressions that support the further understanding of how the design variables
affect the corresponding cost and service time trade-offs made in the joint deploy-
ment and routing of a fleet. Moreover, an MIP formulation for the Fleet Size and
Mix Vehicle Routing (FSMVRP) specially adapted to the Port-Hinterland intermodal
barge network design is developed. We consider the case of horizontal cooperation of
dryport container terminals that aim at efficient capacity sharing. Our results show
that in case of cooperation not only cost savings emerge but also the service level
offered to customers can be enhanced.
5.1 Introduction
The first and the last leg of international door to door container transport constitutes
a big share of the total transportation costs and the total lead time, although the
distance covered is usually just a small portion of the total distance (Fremont and
Franc, 2010). Several processes and actors are involved, and several transportation
83

Chapter 5
schemes have been proposed to accommodate the needs of this part of the trans-
portation chain. The successful execution of port-hinterland networks lies in the
effective design of the network and the services associated with it as much as coordi-
nation issues among the different actors involved. Intermodal transport for the first
transportation leg from the port to hinterland destinations is usually referred to as
combined transport and involves barges or trains used for the transport of containers
to inland terminals while containers are finally delivered to customers via trucks. In
a reverse fashion, the last transportation leg is executed.
Inland terminals usually adapt to the “Dryport” concept (Roso et al. 2009; Roso
and Lumsden 2010) in order to facilitate better port-hinterland connectivity. The
implementation of such concept presupposes the extensive use of inland terminals,
which are connected to seaport terminals via high capacity transport modes such as
barges and trains. Thus, such concepts are in favor of a modal split shift to more
sustainable modalities while suggesting several other benefits for the actors involved.
The core activity of inland terminals is the handling and storage of containers while
providing added value activities. In addition, inland terminals that adapt to the
dryport concept provide transport services by organizing self - operated high capacity
itineraries to enhance their connectivity with main ports. In such cases, the dryport
operator extends its role to a network operator, and designs his hinterland network
by composing a fleet and deploying it over the given physical network of rails and
waterways in order to accommodate the expected demand for container transport
between seaport and inland terminals.
The successful implementation of combined transports relies, among others, on the
efficient utilization of high capacity modes. This in its turn mainly depends on con-
solidation of container flows such that economies of scale are achieved while providing
frequent services to customers. Business examples show that when implemented suc-
cessfully, combined transport can compete with uni-modal truck transport both in
cost and time even for relatively short distances. Consolidation of flows is usually
achieved in two ways. First, hub and spoke networks concentrate flows in corridors
that connect main hubs, resulting in economies of scale. Routing barges along several
terminals helps to consolidate flows originating or destined to the various locations.
The main question to be addressed in barge network design is: How to balance the
various design possibilities such that barges are deployed at minimum costs and such
that service requirements are met? A framework to address this issue is developed
by Konings (2003). The design tradeoffs and perfomance indicators in barge net-
84

5.1 Introduction
Table 5.1: Barge design tradeoffs and performance indicators
Design Tradeoffs PerformanceIndicators
Number of Barges CostsSize of Barges Capacity InstalledNumber of calls Service Frequency
Distribution of callsbetween inland andseaport terminals
work design are summarized in Tab. 5.1. The economies of scale emerge from the
deployment of bigger barges that are effectively utilized. The utilization on its turn
depends on fill rates but also on the number of round trips per time horizon that can
be achieved when the circulation times of barges are considered. When high demand
flows are concentrated on an OD pair, point-to-point services can be established that
keep circulation times low. When point-to-point flow volumes are small, rotation of
barges along multiple terminals can be used to consolidate these flows. Although
this improves the space utilization of the barges, time utilization decreases as the
circulation time increases, caused by delays at each stop. Delays occur especially
when calling at the congested seaport terminals, since deep sea vessels tend to get
priority in berthing over barges. Konings (2007) proposes the reorganization of ser-
vices of barge operators by splitting services in trunk line operation in the hinterland
and collection/distribution services in the seaport area In this way, fewer calls are
performed at the seaport area so the utilization of barges increases. A barge visiting
the port of Rotterdam, for instance, calls on average eight terminals (Douma et al.,
2009). Shippers opt for cost and time effective services that relate both to transport
time but also to dwell times connected to the frequency of services. Considering
the above, the design of a multimodal hinterland network should not only aim at
achieving economies of scale but also at providing shippers with frequent services.
To achieve this, we formulate a MIP model for the Fleet Size and Mix Vehicle Routing
problem (FSMVRP) with multiple depots especially adapted for the tactical design
of port hinterland intermodal services. The model aims to support tactical decisions
regarding: 1) the fleet size and mix selection, 2) Routing of the fleet over the network
for a long time horizon in order to satisfy demand under some service time related
constraints, and 3) the assignment of container flows to given services in order to as-
sess the performance of the proposed network design. FSMVRP models are NP-hard
85

Chapter 5
since they can be reduced to the VRP. We take advantage of the special structure of
the problem in our case by the use of some artificial variables.We provide a compact
MIP formulation that enables the easy construction of round trips that can be solved
with commercial solvers. Moreover, the model is applied to a real case of an alliance
of clustered dryports located in the Brabant region of The Netherlands that connect
with container terminals located within the port of Rotterdam. We investigate the
impact of cooperation, i.e. sharing transport capacity, between these dryport termi-
nals on costs but also on service frequency. Moreover, we consider the construction
of round trips in depth by also investigating their relationship with other variables
like the size of barges used and the expected service times. Our results show that
cooperation between clustered dryports enhances their performance in terms of both
costs and service level, especially when higher minimum frequencies are imposed.
Moreover, we observe that especially for scenarios with high delays at the seaport
terminals there is a shift of the location of calls from seaport terminals to inland
terminals; so a lower number of calls at the seaport terminals are realized resulting
in more barge trips.
For particular instances, the FSMVRP can be used to find the optimal design, and
this is done in Section 5.4. However, we aim to analyze the structure of these optimal
solutions in terms of trade-offs made. We introduce these trade-offs in Section 5.2
by means of a simple example. In Section 5.5, we develop an analytical model that
will help us to analyze the trade-offs more explicitly. The optimization model does
not provide us with these insights. The analytical model can be considered a stylized
version of the optimization model introduced in Section 5.4 and we demonstrate how
it can be used to interpret solutions provided by the FSMVRP as the result of basic
trade-offs. It will also become clear that the analytical model does not provide us
with optimal solutions, and that the optimization model is of value in that respect.
Section 5.3 discussesthe theoritical background in which we buildup our model, while
finally section 5.6 provides the conclusions of this chapter.
5.2 Basic Trade-offs in Port-Hinterland Barge Network
design
The problem of an intermodal barge operator that aims to connect a set of inland con-
tainer terminals with a set of seaport container terminals by frequent barge services
to satisfy expected demand is analyzed. Port hinterland container transport demand
86
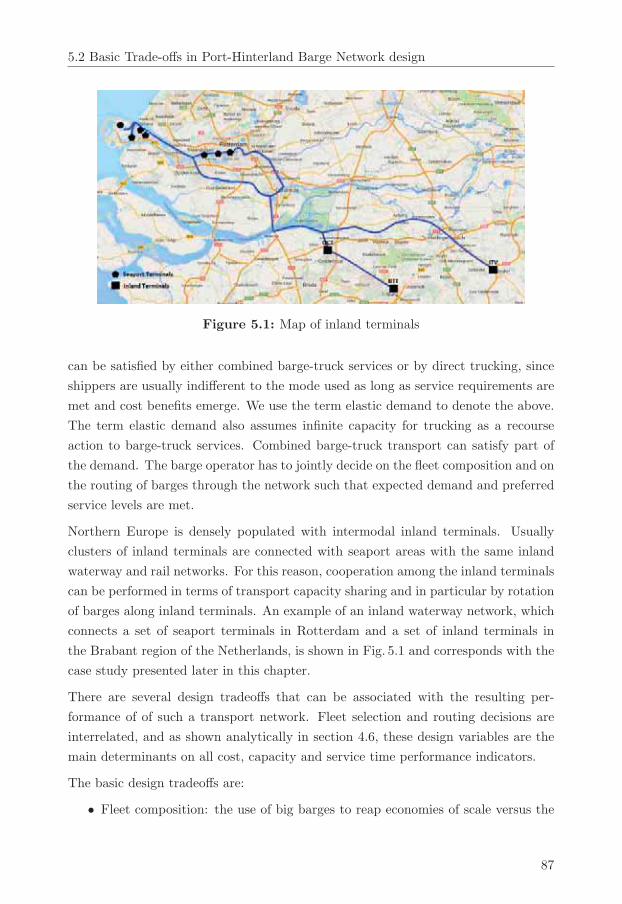
5.2 Basic Trade-offs in Port-Hinterland Barge Network design
Figure 5.1: Map of inland terminals
can be satisfied by either combined barge-truck services or by direct trucking, since
shippers are usually indifferent to the mode used as long as service requirements are
met and cost benefits emerge. We use the term elastic demand to denote the above.
The term elastic demand also assumes infinite capacity for trucking as a recourse
action to barge-truck services. Combined barge-truck transport can satisfy part of
the demand. The barge operator has to jointly decide on the fleet composition and on
the routing of barges through the network such that expected demand and preferred
service levels are met.
Northern Europe is densely populated with intermodal inland terminals. Usually
clusters of inland terminals are connected with seaport areas with the same inland
waterway and rail networks. For this reason, cooperation among the inland terminals
can be performed in terms of transport capacity sharing and in particular by rotation
of barges along inland terminals. An example of an inland waterway network, which
connects a set of seaport terminals in Rotterdam and a set of inland terminals in
the Brabant region of the Netherlands, is shown in Fig. 5.1 and corresponds with the
case study presented later in this chapter.
There are several design tradeoffs that can be associated with the resulting per-
formance of of such a transport network. Fleet selection and routing decisions are
interrelated, and as shown analytically in section 4.6, these design variables are the
main determinants on all cost, capacity and service time performance indicators.
The basic design tradeoffs are:
• Fleet composition: the use of big barges to reap economies of scale versus the
87

Chapter 5
use of small barges to operate at a higher frequency
• Fleet routing: routes with many stops to consolidate demand and to provide
high frequency of services versus routes with few stops to have short circulation
times.
Both trade-offs need not be made similarly for all barges and all routes, so that the
fleet composition and its routing are a mixture of these trade-offs.
To illustrate let us assume a very simplistic case where the circulation time of a
round trip consists of a fixed time, 12 hours (for sailing the common part of the
inland waterway connecting the seaport and the inland terminal) and for a variable
handling time depending on the number of calls at seaport and inland terminals, let
them be 6 and 4 hours respectively. Moreover, we look at two cases: First, 2 barges
of 90 TEUs capacity constantly sail according to the structure of the round trips,
and second, only one barge of the double capacity, 180 TEUs, is used. The scenarios
that correspond to the use of one bigger barge lead to reduced cost since economies of
scale can be achieved. We summarize the results of this simple example in Tab. 5.2.
Even for this small stylized example there are clear tradeoffs between capacity set-
ting, service level provided to customers, and cost efficiency that are related to fleet
selection and its routing structures. First, we observe that the structure of the round
trips can significantly affect both the capacity installed over the network and the
number of services offered to customers. Given the same number and type of barges,
the capacity installed can be enhanced by reducing the number of calls per round
trip since the circulation times are reduced and more round trips are achieved per
planning horizon. But reducing the number of calls also reduces the OD pairs that
can be served per round trip and thus such round trip structures would result in
lower service frequency levels. The service frequency increases linearly in the number
of vehicles used for the same round trip structures but using fewer and bigger barges
can lead to economies of scale. The optimal design is case specific and would de-
pend on the demand, travel distances, cost data and other relevant parameters that
we will discuss later in this chapter. Solving the optimal fleet selection and routing
problem for real sized instances requires can be a very complex challenge. In order
to support such decisions we develop a MIP model for the mixed fleet and routing
problem that is presented in section 5.4 while we further assess the main tradeoffs
with the analytical model presented in section 5.6.
88

5.2 Basic Trade-offs in Port-Hinterland Barge Network design
Table 5.2: Simplistic Numerical Example
# Inland
Termi-
nal
Calls
Seaport
Termi-
nal
Calls
Number
and Type of
Barges
Expected
Circulation
time
Expected
Number of
Round trips
(144 hours)
Number
of Weekly
Services
Installed
Capacity
1 1 1 2x90 TEUs 22 hours 6.54 13.08 1177.2
2 1 2 2x90 TEUs 28 hours 5.14 10.28 925.7
3 2 1 2x90 TEUs 26 hours 5.54 11.08 996.9
4 2 2 2x90 TEUs 32 hours 4.50 9 810.0
5 2 3 2x90 TEUs 38 hours 3.79 7.58 682.1
6 3 2 2x90 TEUs 36 hours 4.00 8 720.0
7 3 3 2x90 TEUs 42 hours 3.43 6.86 617.1
8 1 1 1x180
TEUs
22 hours 6.54 6.54 1177.2
9 1 2 1x180
TEUs
28 hours 5.14 5.14 925.7
10 2 1 1x180
TEUs
26 hours 5.54 5.54 996.9
11 2 2 1x180
TEUs
32 hours 4.50 4.50 810.0
12 2 3 1x180
TEUs
38 hours 3.79 3.79 682.1
13 3 2 1x180
TEUs
36 hours 4.00 4.00 720.0
14 3 3 1x180
TEUs
42 hours 3.43 3.43 617.1
89

Chapter 5
5.3 Theoretical background
The tactical decisions related to barge network design mainly relate to the selection
of the optimal fleet and its effective routing through the network such that service
levels offered to customers are met. The general case of such problems is addressed in
the literature by the solution of the Fleet Size and Mix Vehicle Routing problem (FS-
MVRP). The FSMVRP was introduced by Golden et al. (1984) as an extension of the
vehicle routing problem by considering a heterogeneous fleet of vehicles. Salhi and
Rand (1993) review models on vehicle fleet composition problems and highlight the
importance of incorporating vehicle routing in such decisions. Since its introduction,
several extensions of the problem have been proposed in literature like considering
multiple depots by Salhi and Sari (1997) or the consideration of time windows by
Liu and Shen (1999). Given the difficulty of solving such problems, literature con-
tributions in this field are mainly focusing on the development of efficient heuristic
procedures for the solution of the problem.
The aim of this chapter is to support the tactical joint fleet deployment and routing
of barges in port hinterland networks. The optimal fleet should be selected based
on its expected operational performance and that is why routing plans for barges
should be considered simultaneously. In this sense, the utilization of the fleet should
not only be based on the consolidation of flows but also on the construction of round
trips that achieve low circulation times and thus more round trips per barge whithin
the planning horizon. Moreover, by considering the routing of the fleet, we look at
the expected service level that shippers of the network will experience by controlling
the minimum frequency per OD pair serviced. In the case of port hinterland services,
demand can always be satisfied via trucking so the multimodal nature of the problem
should be considered. Thus the modal split between barge and truck transport should
be connected via cost and service time performance of each mode. The optimal barge
network design seems to depend, on the demand consolidation opportunities, on the
characteristics of the waterway network (distances, depth, bridges, locks, etc), and
on demand characteristics like service time requirements, cost elasticity, service time
elasticity on different modalities. Our research contributes to existing literature by
proposing models that take all the above factors into consideration.
90

5.4 Model formulation
5.4 Model formulation
We develop a model for the tactical joint fleet selection and barge routing in order to
provide intermodal port-hinterland transport services. The model aims to provide an
optimal scheduled network design in which the Fleet Size and Mix Vehicle Routing
Problem is addressed. The utilization of the fleet is not only optimized by achieving
a high fill rate of their capacity but also by achieving more trips through an efficient
routing. The above can be achieved by the explicit consideration of time in our
formulation.
As discussed already in the literature review section the FSMVRP is NP-hard and
usually difficult to solve even for small and medium size instances. In order to solve
our problem we formulate a compact and tight MIP formulation of the problem that
significantly reduces its size, without deviating its scope, while it can be solved to
near optimality with commercial MIP solvers. We achieve the above by three main
modeling tricks. First, we provide a special structure on our network to facilitate the
construction of round trips for barges. By the introduction of some artificial nodes
the number of available arcs in the network significantly reduces since their number
increases linearly in an increasing number of nodes. Second, we reduce the number
of commodities by organizing them as the collectively expected weekly demand of
customers in Origin - Destination (OD) pairs that can be satisfied by a number of
services spread over the week. We control that by imposing minimum frequency
constraints for each OD pair that is served. Third, we provide an upper bound for
our objective by considering elastic demand by allowing the trucking option for all
OD pairs.
5.4.1 Notation
The main idea of the structure and the construction of the routes that we implement
is presented schematically in Fig. 5.2. A round trip of a barge in our regime is as
follows. The barge loads containers at the inland region and discharges them at
the seaport terminals, where it loads others that in their turn are discharged at the
inland terminals. That completes a barge’s round trip and the barge is then ready
to start its next round trip. It should be noted that during a round trip some inland
terminals can be visited twice while each seaport terminal can be visited at most one
time.
91

Chapter 5
Figure 5.2: Construction of barge routes
5.4.1.1 Sets
Let us consider an underlying directed network G = (N ,A) with node set N and arc
set A.
5.4.1.2 Commodities
We consider the multicommodity formulation of the problem in which each commod-
ity, c ∈ C, is associated with the expected weekly container demand for a specific
Origin and Destination (OD) pair, (Oc, Dc) ∈ N ×N , under some service time con-
straints. The demand volume of a commodity c expressed in TEUs is denoted by dc,
and represents the level of demand for both inbound and outbound flows regardless
of whether the containers are full or empty. The inbound and outbound flows of con-
tainers are assumed to be balanced, since any inbound flow of full containers would
lead to the return of an empty and vice versa. In reality, some empty containers dwell
at the inland terminals until some demand for export containers is generated. So they
are full also on their return trip. Usually there exist weight and balance constraints
for the loading of containers on barges and trains but such issues are addressed at an
operational level and are out of the scope of this chapter. The desired service level is
assumed to be expressed as a minimum weekly frequency constraint, f c for all c ∈ C,
for the combined transport services. Considering the above demand formulation, we
92
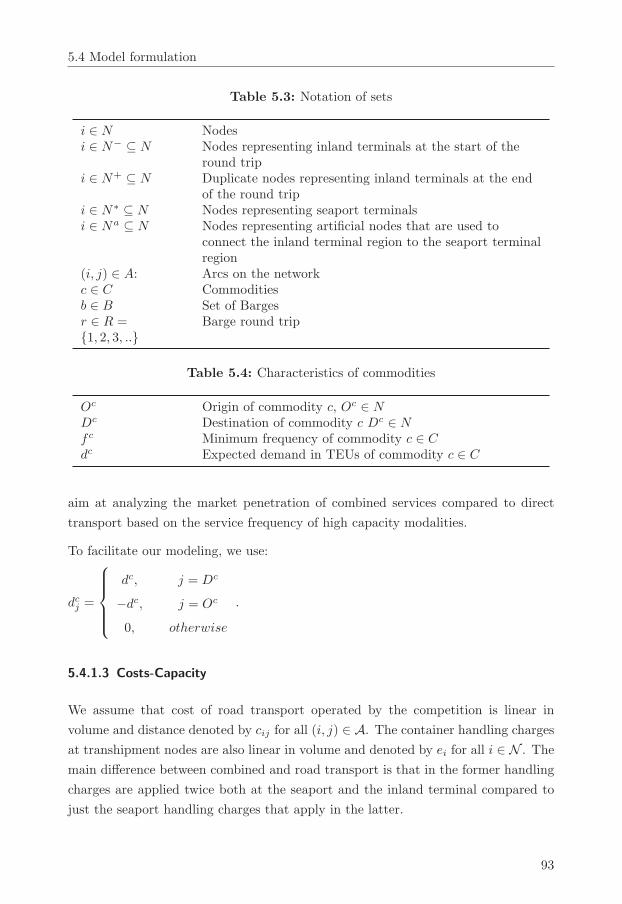
5.4 Model formulation
Table 5.3: Notation of sets
i ∈ N Nodesi ∈ N− ⊆ N Nodes representing inland terminals at the start of the
round tripi ∈ N+ ⊆ N Duplicate nodes representing inland terminals at the end
of the round tripi ∈ N∗ ⊆ N Nodes representing seaport terminalsi ∈ Na ⊆ N Nodes representing artificial nodes that are used to
connect the inland terminal region to the seaport terminalregion
(i, j) ∈ A: Arcs on the networkc ∈ C Commoditiesb ∈ B Set of Bargesr ∈ R ={1, 2, 3, ..}
Barge round trip
Table 5.4: Characteristics of commodities
Oc Origin of commodity c, Oc ∈ NDc Destination of commodity c Dc ∈ Nf c Minimum frequency of commodity c ∈ Cdc Expected demand in TEUs of commodity c ∈ C
aim at analyzing the market penetration of combined services compared to direct
transport based on the service frequency of high capacity modalities.
To facilitate our modeling, we use:
dcj =
⎧⎪⎪⎪⎨⎪⎪⎪⎩
dc,
−dc,
0,
j = Dc
j = Oc
otherwise
.
5.4.1.3 Costs-Capacity
We assume that cost of road transport operated by the competition is linear in
volume and distance denoted by cij for all (i, j) ∈ A. The container handling charges
at transhipment nodes are also linear in volume and denoted by ei for all i ∈ N . The
main difference between combined and road transport is that in the former handling
charges are applied twice both at the seaport and the inland terminal compared to
just the seaport handling charges that apply in the latter.
93

Chapter 5
Table 5.5: Cost and Capacity Parameters
Qb Capacity in TEUs of barge b ∈ BW b : Weekly cost for leasing barge b ∈ Bvbij Variable cost of barge b ∈ B traveling in arc (i, j) ∈ Aei Transhipment cost at node i ∈ Ncij Trucking cost per TEU for traveling link (i, j) ∈ A
We consider a set of barges, b ∈ B, with different cost and capacity characteristics.
The cost of operating barges, from a barge operator’s perspective, consists of several
components, such as assets, crew, fuel, and maintenance (Braekers et al., 2012). On
the other hand, the cost faced by a dryport operator, assuming that it does not use
its own barges, is the price scheme proposed by barge operating companies which
consists of the above costs enhanced by a profit margin for the barge operator. The
leasing cost of a barge for a week is denoted by W b for all b ∈ B which includes both
asset and staff cost required to navigate and operate the barges. Economies of scale
apply in this leasing cost when higher capacity barges are selected; crew cost for
barge navigation and operation are concave in the capacity of the barge. A variable
cost vbij for all (i, j) ∈ A, b ∈ B, is also considered to represent the fuel cost of barges
which is assumed to be linear to distance traveled and variable to the size (capacity),
Qb, of the barge.
5.4.1.4 Time parameters
For the consideration of time, we assume the travel times tbij of barges to be linear
in the distance of the traveled arcs but variable in the different barge types. We also
consider a handling time hi per container loaded or unloaded on a barge in order
to assess the minimum time spent on a call at a terminal which is variable in the
terminal called. Finally, we consider delays li faced at seaport and inland terminals.
The delays consist of mooring and unmooring times but also from the actual delays
faced at calls until there is sufficient space and time to berth. At seaport terminals
delays can account for several hours per call since deep sea vessels get priority over
barges while delays on inland terminals are usually quite low.
94

5.4 Model formulation
Table 5.6: Cost and Capacity Parameters
tbij Transportation time of barge b ∈ B traveling on arc(i, j) ∈ A
li : Expected delay at terminal i ∈ Nhi Handling time for loading/ unloading a TEU at terminal
i ∈ N
5.4.1.5 Decision variables
We can separate the decision variables into four different sets according to their
use. First, the Boolean variables Yb denotes whether barge b is selected and the
Boolean variables yb,r denotes whether barge b will perform route r. Second, we
have variables associated with the construction of the routes. The Boolean variables
sb,ri denotes whether node i is part of the route r of barge b and mb,rij denotes whether
arc (i, j) ∈ A will be part of the route r of barge b; these two variables are connected
via the vehicle routing constraints. Third, we have variables associated with the
assignment of flows to specific transport services. The Boolean variables gb,rc denote
whether demand associated with commodity c will be satisfied by barge b in route
r, while zb,rij,c represents the amount of TEUs of commodity c on barge b on route
r traveling in arc ij. The amount of TEUs of commodity c transported by trucks
is denoted by wc. Finally, we have continuous time variables tb,ri which denote the
arrival time of barge b on route r on node i and ub,r that denotes the end time of
route r of barge b or else the time the barge becomes available for its next route.
5.4.2 MIP formulation
In this section the mixed integer formulation of the problem is presented.
min∑b
Y bW b +∑b,r,ij
mb,rij vbij +
∑b,r,n,c
∣∣∣xb,ri,c
∣∣∣ ei +∑c
cOcDcwc (5.1)
∑b,r,j
zb,rij,c −∑b,r,j
zb,rji,c =
⎧⎪⎪⎪⎨⎪⎪⎪⎩
dc − wc
0
wc − dc
i = Oc
else
i = Dc
∀i ∈ I, ∀c ∈ C (5.2)
95

Chapter 5
Table 5.7: Decision variables
Yb ∈ 0, 1 Denoting whether barge b ∈ B is usedyb,r ∈ 0, 1 Denoting whether route r ∈ R will be performed by
bargeb ∈ Bsb,ri ∈ 0, 1 Denoting whether node i ∈ N will be called by barge
b ∈ B in route r ∈ Rmb,r
ij ∈ 0, 1 Denoting whether arc (i, j) ∈ A will be used by bargeb ∈ B in route r ∈ R
gb,rc Denoting whether demand of commodity c ∈ C will bepartly satisfied by barge b ∈ B in route r ∈ R.
zb,rij,c Amount of TEUs of commodity c ∈ C is transported in arc(i, j) ∈ A by barge b ∈ B in route r ∈ R
wc Amount of TEUs from commodity c ∈ C satisfied bytrucks
xb,ri,c Amount of TEUs transshipped in node i ∈ N for
commodity c ∈ C barge b ∈ B in route r ∈ Rtb,ri Arrival of barge b ∈ B in route r ∈ R at node i ∈ Nub,r End of route r ∈ R of barge b ∈ B
xb,ri,c =
∑j
zb,rij,c −∑j
zb,rji,c ∀i ∈ I, ∀c ∈ C, ∀b ∈ B, ∀r ∈ R (5.3)
∑j
mb,rij = sb,ri ∀i ∈ I, ∀b ∈ B, ∀r ∈ R (5.4)
∑j
mb,rji = sb,ri ∀i ∈ I, ∀b ∈ B, ∀r ∈ R (5.5)
∑c
zb,rij,c ≤ Qbmb,rij ∀ij ∈ A,b ∈ B, ∀r ∈ R (5.6)
∑r
yb,r ≤ Y bM ∀b ∈ B (5.7)
96

5.4 Model formulation
∑ij
mb,rij ≤ yb,rM ∀i ∈ I, ∀j ∈ J , ∀b ∈ B, ∀r ∈ R (5.8)
tb,rj − tb,ri ≥ mb,rij tbij +
∑i,c
hi · xb,ri,c + li −M
(1−mb,r
ij
)
∀i, j ∈ I, ∀b ∈ B, ∀r ∈ R (5.9)
ub,r ≥ tb,ri ∀i ∈ I, ∀b ∈ B, ∀r ∈ R (5.10)
tb,r+1i ≥ ub,r ∀i ∈ I, ∀b ∈ B, ∀r ∈ R (5.11)
2 · gb,rc ≤ sb,rOc + sb,rDc ∀c ∈ C, ∀b ∈ B, ∀r ∈ R (5.12)
f c · zb,rij,c ≤ dc · gb,rc ∀ij ∈ A, c ∈ C, ∀b ∈ B, ∀r ∈ R (5.13)
The objective function (5.1) minimizes all incurred costs. The costs consist of the
weekly costs of leasing barges, the variable costs associated with the routing of barges,
the handling costs for loading and unloading barges and finally the trucking costs
for containers that are going to be transported by trucks. The objective function
is bounded from above since all containers can be moved by trucks to their final
destination. Constraints (5.2) stand for the flow conservation constraints while with
constraints (5.3), the loading and unloading of containers to barges are calculated.
Constraints (5.4) − (5.5) are the vehicle routing constraints that guarantee that an
arc starts and ends at each node that is called in every round trip. Constraints (5.6)
are the capacity constraints. Constraints (5.7) allow a round trip to be constructed
97

Chapter 5
for a barge only if the barge is selected while constraints (5.8) allow arcs to open only
when a round trip is opened.
The arrival times of barges at specific nodes are formulated in constraint (4.9) as
follows; if barge b on route r travels on link ij the arrival time on node j, tb,rj , is
equal to its arrival time on node i, tb,ri , enhanced by the travel time between nodes i
and j, the handling time of loading and unloading containers at node i and the delay
occurred at node i. Constraints (5.10) − (5.11) ensure time continuation between
successive trips of barge b.
Constraints (5.12) ensure that a commodity can be assigned to a route of a spe-
cific barge only if both its origin and destination nodes are called at the specific
route. Constraints (5.13) represent the demand balancing or minimum frequency
constraints. These constraints ensure that not all weekly demand can be consoli-
dated in a single barge trip, which makes sense since demand arrivals are spread
over the week as much as their due dates so usually several services per OD pair are
performed per week and consolidation is performed mainly with other commodities.
So the minimum frequency is used here also as a consolidation factor: the higher it
is the less consolidation can be achieved in a single OD commodity.
5.5 Case study and results
We develop an experiment to assess how the optimal fleet selection and routing
decisions change under different parameters and characteristics assumptions. We
develop a realistic case based on a network design problem of Brabant Intermodal
(BIM), which is an alliance of five dryports located in the Brabant region of The
Netherlands in the proximity of the port of Rotterdam and the port of Antwerp. In
particular, we analyze a part of the network in which BIM provides transport services,
as depicted in Fig. 5.1. The case of cooperation for capacity sharing for three dryports
is considered. These dryports are OCT in Oosterhout, BTT in Tilburg and ITV in
Veghel that are connected to the port of Rotterdam through the same waterway.
Barges can start from either BTT or ITV, and pass by the OCT terminal with a very
small detour. Cost and demand data are realistic but not the actual numbers since
the actual data were confidential to BIM.
The experiment presented in this section is not meant to solve the actual problem of
BIM, but to depict the capabilities of the model presented in the previous section,
and moreover to identify design characteristics and assess how these characteristics
98

5.5 Case study and results
Table 5.8: Expected weekly demand in OD pairs for Low/High scenarios
DDE DDW EMX APM
BTT 90/180 40/80 80/160 35/70OCT 70/140 60/120 40/80 40/80ITV 70/140 30/60 55/110 35/70
affect the optimal design. We focus on four dimensions: (1) cooperation of inland
terminals, (2) the consideration of service frequency constraints in such a regime,
(3) the demand volume, and (4) the expected delays before the barges berth at the
seaport terminals. By analyzing the results we show for each of the four dimensions
how the optimal solutions change in terms of cost performance, fleet selection and
routing structure.
5.5.1 Experiment
The demand considered for our case is presented in Tab. 5.8 while cost data derived
from BIM are not presented due to confidentiality. In order to assess the impact of
cooperation we first apply our model to each dryport individually and we aggregate
the solutions, and then we apply our model for the case where all dryports cooperate.
We run 8 scenarios that correspond to different demand volumes (High - Low), delays
at seaport terminals (High-Low) and Minimum frequency (0 - 4 times per week).
The different scenarios are coded with four characters codes, in the abcd format:
(a) {I, C}: C denotes the case of cooperation of inland terminals and I denotes
the aggregated solution of each inland terminal considered independently.
(b) {H,L} : H denotes scenarios with high delays and L with low delays.
(c) {1, 4} : 1 denotes scenarios with no minimum frequency constraints 4 with
minimum frequency constraints.
(d) {H,L} : H denotes scenarios with high demand and L with low demand.
5.5.2 Results
We summarize the results of our experiment in Tab. 5.9. Moreover, some of the
results are also graphically illustrated in Fig. 5.3-Fig. 5.9.
99

Chapter 5
Table 5.9: Results MIP model
Scenario Capacity
Installed
Total
Cost
Network
Coverage
Containers
on Barge
Number
of Barges
Average
Barge
Size
Average
Calls/
Trip
IL1L 810 31.207 1,00 100,0% 3 90 2,33
IL1H 1500 36.968 1,50 100,0% 3 110 2,29
IL4L 480 41.544 1,67 51,1% 2 60 3,50
IL4H 1320 55.114 2,92 82,3% 3 110 3,92
CL1L 750 16.235 1,00 96,1% 1 150 3,20
CL1H 1500 29.245 1,25 99,2% 2 150 2,50
CL4L 630 31.925 3,33 84,3% 2 90 5,00
CL4H 1410 41.217 4,25 100,0% 3 130 4,55
IH1L 810 31.207 1,00 100,0% 3 90 2,33
IH1H 1500 38.760 1,25 100,0% 3 150 2,50
IH4L 0 44.000 0,00 0,0% 0 0 0,00
IH4H 1440 67.911 4,00 98,4% 6 90 4,00
CH1L 660 23.189 1,25 100,0% 2 120 3,17
CH1H 1350 28.964 1,33 98,4% 2 150 2,78
CH4L 450 38.745 2,50 63,5% 2 90 5,00
CH4H 1230 54.897 3,50 88,7% 4 90 3,27
In Fig. 5.3 the costs resulting from each scenario are presented. There is a clear cost
benefit resulting from cooperation among the dryports; the cost savings range form
12% to 48%. Moreover, as expected imposing minimum frequency constraints, or
considering higher delays increase overall costs. The drivers of the cost increase are
still not clear so we have to further analyze the solutions.
First, we look at the optimal fleet selection for each scenario in Fig. 5.4. In case of
cooperation, less and bigger barges are selected in the optimal solutions compared
to the case where each dryport is considered individually, such that economies of
scale are achieved. Moreover, imposing minimum frequency constraints has also an
impact on the optimal fleet selection: smaller barges have to be deployed so that more
round trips can be achieved; this is particularly clear when high delays at the seaport
terminals are considered. There are some cases where this is not realized though.
This is due to the elastic demand formulation; so for the scenarios with low demand
and minimum frequency constraints we observe that in the optimal solutions, only a
small part of the demand is satisfied via barges while the rest is satisfied via trucks,
as shown in Fig. 5.5. The relationship between network coverage and the percentage
of demand satisfied by barges is shown in Fig. 5.6, in which the consideration of
100

5.5 Case study and results
(a) Low Delays (b) High Delays
Figure 5.3: Cost benefit from dryport cooperation
(a) Low Delays (b) High Delays
Figure 5.4: Fleet Selection
minimum frequency constraints separates the optimal solutions in two distinctive
groups. For scenario IH4L all demand is satisfied by trucking since meeting the
minimum frequency requirements when delays are high and demand is low would
result in costs higher than trucking all containers. Overall, one can observe that
when the minimum frequency constraints are not considered, the network coverage
and modal split are disconnected, while when they are considered it is easier to achieve
higher network coverage and thus modal split in favor of barges when cooperation is
considered.
Second, we look at the number of round trips constructed at each solution as much
as the average number of calls at both seaport and inland terminals visited in each
trip. This is shown in Fig. 5.7. The total number of round trips decreases when
cooperation is considered while usually bigger barges are selected except for the cases
101

Chapter 5
(a) Low Delays (b) High Delays
Figure 5.5: Frequency on corridors and flow assignment
Figure 5.6: Network Coverage vs Containers on barge
102
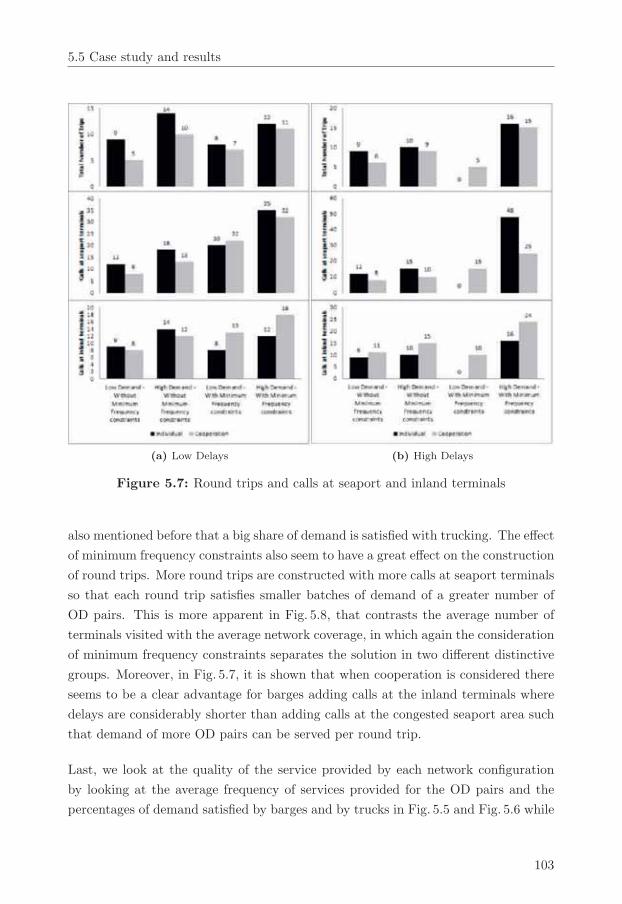
5.5 Case study and results
(a) Low Delays (b) High Delays
Figure 5.7: Round trips and calls at seaport and inland terminals
also mentioned before that a big share of demand is satisfied with trucking. The effect
of minimum frequency constraints also seem to have a great effect on the construction
of round trips. More round trips are constructed with more calls at seaport terminals
so that each round trip satisfies smaller batches of demand of a greater number of
OD pairs. This is more apparent in Fig. 5.8, that contrasts the average number of
terminals visited with the average network coverage, in which again the consideration
of minimum frequency constraints separates the solution in two different distinctive
groups. Moreover, in Fig. 5.7, it is shown that when cooperation is considered there
seems to be a clear advantage for barges adding calls at the inland terminals where
delays are considerably shorter than adding calls at the congested seaport area such
that demand of more OD pairs can be served per round trip.
Last, we look at the quality of the service provided by each network configuration
by looking at the average frequency of services provided for the OD pairs and the
percentages of demand satisfied by barges and by trucks in Fig. 5.5 and Fig. 5.6 while
103

Chapter 5
Figure 5.8: Network Coverage vs Number of calls
we contrast the network coverage with the capacity installed in Fig. 5.9, in which
again the solutions are separated in two distinctive groups by the implication of the
minimum frequency constraints. On the one hand, when no minimum frequency
constraints are considered, almost all demand is satisfied by barge trips while the
frequency of services for each OD pair increases only when it is dictated by higher
demand. In that way, barges call at fewer terminals and that lowers the circulation
times of their round trips such that more round trips can be achieved. On the other
hand, when minimum frequency constraints are imposed, smaller batches of demand
for each OD pair have to be consolidated in round trips such that efficient round
trips can be formed. Of course considering minimum frequency constraints makes
solutions more realistic since it is hardly ever the case that weekly demand of an
OD pair can be satisfied by one or two itineraries. In our model not meeting the
minimum frequency constraints leads to higher truck usage.
5.5.3 Experimental results summary
The effects of the main experimental dimensions on the optimal barge network design
are summarized in Tab. 5.10.
Our results show that all dimensions considered have a significant effect on the op-
timal design of such networks. On the one hand, the optimal network design can be
considered to be case specific, and thus only some directions can be drawn on how the
different characteristics affect the optimal solutions.We develop an analytical model
in the next section to study how these design trade-offs interact. On the other hand,
our observation regarding the significance of considering the service time constraints
104
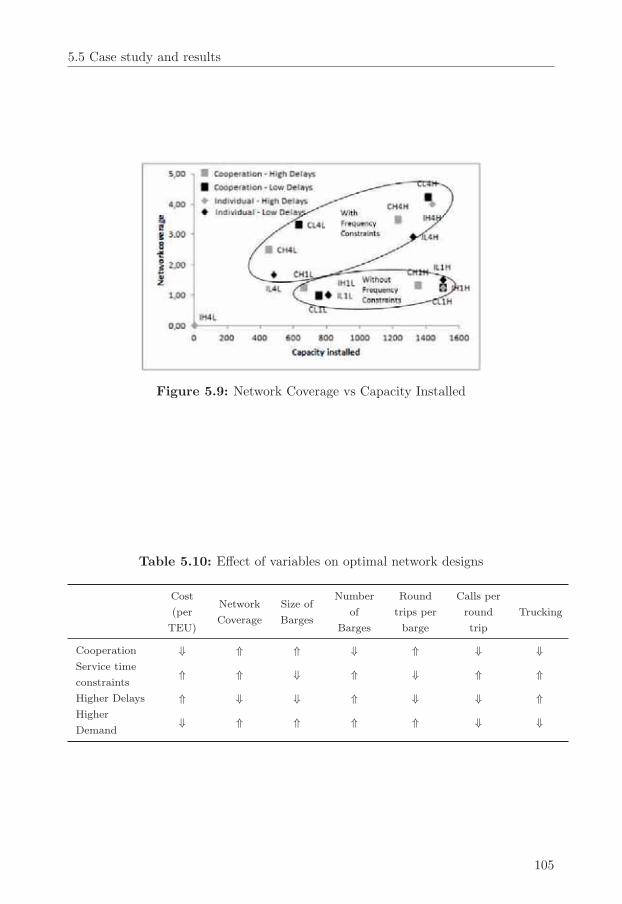
5.5 Case study and results
Figure 5.9: Network Coverage vs Capacity Installed
Table 5.10: Effect of variables on optimal network designs
Cost
(per
TEU)
Network
Coverage
Size of
Barges
Number
of
Barges
Round
trips per
barge
Calls per
round
trip
Trucking
Cooperation ⇓ ⇑ ⇑ ⇓ ⇑ ⇓ ⇓Service time
constraints⇑ ⇑ ⇓ ⇑ ⇓ ⇑ ⇑
Higher Delays ⇑ ⇓ ⇓ ⇑ ⇓ ⇓ ⇑Higher
Demand⇓ ⇑ ⇑ ⇑ ⇑ ⇓ ⇓
105

Chapter 5
(as show in Fig. 5.6, Fig. 5.8, and Fig. 5.9) has a more general effect. In case service
time constraints are considered, the network coverage is not only driven by demand
volume but also by demand characteristics. This is quite crucial when planning high
capacity mode services at the tactical or strategic levels and such demand character-
istics should be considered. Considering them leads to more realistic solutions, since
demand is distributed over several services on the planning horizon. Moreover, high
capacity services compete with road transportation not only in terms of costs but
also in terms of service times. The above is crucial to the effective modeling of such
systems at the tactical and strategic levels.
5.6 Stylized analytical model to illustrate design
trade-offs
The optimal fleet selection and routing is always case specific and will depend on
several characteristics like expected demand, delays, distances, available resources
and others. This is supported by the results of the optimization model that has
been presented in section 5.4. To better understand and appreciate the outcomes of
the optimization model, we discuss in this section a simplified analytical model that
provides a better understanding of how the different design parameters can affect the
different performance characteristics of such networks. At the end of this section, we
compare the outcomes of the analytical model with the outcomes of the optimization
model. This will allow us to intuitively understand how the optimal solutions are
driven by basic trade-offs already captured by the analytical model and where the
optimal solutions are tuned to more complex features of the decision problem at
hand.
The analytical model presented in this section is not completely equivalent to the
MIP model presented in the previous section, since several assumptions and simpli-
fications have been considered for its formulation. The assumptions that underlie
the analytical model are the following: (a) demand is equally distributed among
OD pairs, (b) the design variables (number of barges, barge size, number of calls,
frequency) are assumed to be continuous, (c) the actual cost data are replaced by
approximating continuous cost functions, (d) the circulation time of a round trip is
assumed to only depend on the number of calls and not the routing itself, (e) trucking
is not considered since the design parameters are continuous and elastic demand need
not to be considered.
106

5.6 Stylized analytical model to illustrate design trade-offs
Table 5.11: Notation
Sets Decision Variables
N I : Set of inland terminals(3 used)
Q: Size of barges
NS : Set of Seaport Terminals (4used)
x: Number of barges
Costs nr: Average number of terminalsvisited per round trip
W : Cost of leasing barge.W = fw (Q) ≈ u1 + u2Q(Economies of scale)
W = 5000 + 50Q (used)
NrI and Nr
S : Average number ofinland and seaport terminals
visited per round trip
v: Variable cost per round trip of abarge. v = fv (Q) ≈ u3 + u4Q
(Economies of scale)v = 300 +Q
pI : Percentage of calls at inlandterminals such that Nr
I = nrpI andNr
S = nr (1− pI)
Time Performance IndicatorsT : Planning horizon (168 hours) SOD: Average number of OD pairs
served per round tripτ : Fixed time per round trip (16
hours)CT : Average circulation time of a
round tripdI , dS : Variable time per call in around trip (dI : 2hours, ds: 4 or 8
hours)
RT : Average number of roundtrips per barge
TotalCost : Estimated cost of planCapacity: Port hinterland capacity
installed over the networkNetworkCoverage: Averageservice frequency per OD pair
5.6.1 Analytical expressions
The model presented in this section provides some analytical expressions that connect
performance indicators like the cost, capacity and network coverage with different
design parameters like size of barges, number of calls per round trip, distribution of
calls between seaport and inland terminals.
The notation used in this section and the values of some parameters fixed in this
study are summarized in Tab. 5.11. A network is considered consisting of the node
sets N I and NS denoting inland and seaport terminals respectively. It follows that∣∣N I∣∣·∣∣NS
∣∣ undirected (O, D) pairs are considered, each associated with some demand
107

Chapter 5
that will be satisfied by a number of transport services. Vehicles of different types are
considered, that would result in an average barge size of TEUs. The fixed (leasing)
and variable (routing) costs of using barges are assumed to depend on their size,
which allows us to model economies of scale. The barges are assumed to perform
round trips continuously over the planning horizon. The round trips are characterized
by their expected average circulation time, CT , which is inversely proportional to the
expected number of round trips that a barge can perform during the time horizon.
The expected circulation time (CT), equation (5.2) , is calculated as a fixed sailing
time, τ , connecting the seaport with the hinterland areas enhanced by the variable
delay times, dI , dS , associated with the additional time needed for calling at inland
and seaport terminals (sailing, mooring, unmooring, handling, delays). In our case
we consider a hinterland and a seaport area where terminals in each area are located
relatively close to each other so the main difference in the variable times is in the
delays faced which are much higher at the seaport terminals. Considering the above
it is clear that the expected circulation time of round trips is connected with the
average number of inland terminals nI , and seaport terminals, nS . The number
of calls and the distribution among inland and seaport terminals also affects the
expected number of OD pairs that are served per round trip, SOD, as calculated in
equation (5.16).
The three performance indicators, namely the expected total cost, installed capacity,
and network coverage can be calculated by means of formulas (5.17) − (5.19). It is
clear that all measures are linearly proportional to the number of barges used.
The expected total cost (5.17) is calculated as the product of the average fixed and
variable cost of a barge per time horizon and the number of barges. The fixed and
variable costs are calculated with functions that depict economies of scale and are
connected with the average size of the barges used.The capacity installed (5.18) is
calculated as the product of the average barge size, the number of barges, and the
expected number of round trips. The network coverage measure (5.19) depicts the
expected frequency of services per OD pair and is calculated as the product of the
average number of OD pairs served per round trip (5.16), the expected number of
round trips per barge (5.15), and the number of barges divided by the number of OD
pairs considered.
CT = τ + 2dInI + dSnS (5.14)
108

5.6 Stylized analytical model to illustrate design trade-offs
RT =T
CT(5.15)
SOD = nI · nS (5.16)
TotalCost = (W + vRT )x
=
(fw (Q) + fv (Q)
T
τ + 2dInI + dSnS
)x (5.17)
Capacity = Q ·RT · x
= Q · T
τ + 2dInI + dSnS· x (5.18)
NetworkCoverage =SOD
|N I | |NS | ·RT · x
=nInS
|N I | |NS | ·T
τ + 2dInI + dSnS· x (5.19)
We evaluate formulas (5.17) − (5.19) for a range of their input parameters in order
to identify how the different network design characteristics interact and affect the
performance indicators of such a network. There are several input parameters, so
for a better illustration of the results we construct grids, each is associated with a
specific number of barges, while each line is associated with either a barge size or a
number of terminals included in a round trip.
The tradeoffs between capacity installed and network coverage are shown in Fig. 5.10.
The capacity can be increased by employing more and bigger barges while reducing
the average number of terminals per round trip, while the network coverage can be
increased by either employing more barges or by increasing the average number of
109

Chapter 5
Figure 5.10: Capacity installed vs Network coverage
terminals visited per trip. It is clear that the same capacity and network coverage
levels can be achieved with several combinations of the design parameters, but these
different combinations can result in considerably different costs.
The relationship between network coverage and capacity installed with costs for sev-
eral characteristics are shown in Fig. 5.11 and Fig. 5.12, respectively. The total costs
mainly depend on the number of barges employed. Reducing the average number
of calls increases the total costs, while increasing capacity and decreasing network
coverage as discussed previously.
5.6.2 Analytical optimization model
Considering the above analytical expressions we could formulate a nonlinear con-
strained optimization problem with the same format as the MIP model presented in
Section 5.4. In that sense, we would have the following nonlinear problem.
minQ,x,ns,nI
TotalCost (Q, x, ns, nI) (5.20)
110

5.6 Stylized analytical model to illustrate design trade-offs
Figure 5.11: Capacity installed vs Total cost
Figure 5.12: Network coverage vs Total costs
111

Chapter 5
subject to:
Capacity (Q, x, ns, nI) ≥ d (5.21)
where d denotes the demand volume or the minimum capacity to be installed over
the network, and
NetworkCoverage (x, ns, nI) ≥ f (5.22)
where f denotes the minimum sailing frequency per time period T .
The objective function was given by (5.17) , while the constraint functions where
given by (5.18) and (5.19) respectively.
The above problem has an analytical unique optimal solution. Since the objective
function is increasing in x and Q, their optimal values x∗ and Q∗ can be found as a
function of nI and nS by solving the constraints with respect to them. The above
yields the optimal number of barges
x∗ (nI , nS) = fτ + 2dInI + dSnS
T
NINS
nInS(5.23)
and optimal average barge size
Q∗ (nI , nS) =d (τ + 2dInI + dSnS)
Tx∗(5.24)
respectively. By substituting (5.23) in (5.24), we obtain:
Q∗ (nI , nS) =d
f
nInS
NINS(5.25)
The constraints indicate that the minimum attainable cost is given by (5.25) which
112

5.6 Stylized analytical model to illustrate design trade-offs
Table 5.12: Results analytical model
Scenario Capacity
Installed
Total
Cost
Network
Coverage
Containers
on Barge
Number
of Barges
Average
Barge Size
Average
Calls/
Trip
IL1L 650 25.420 2,42 100,0% 3,00 41.17 2,84
IL1H 1300 31.576 1,50 100,0% 3,00 72.22 2,00
IL4L 650 27.375 4.00 100,0% 3,00 54,2 5,00
IL4H 1300 36.150 4.00 100,0% 3,00 108,3 5,00
CL1L 650 13.560 1.00 100,0% 1,00 127,7 3,08
CL1H 1300 20.593 1.00 100,0% 1,00 255,3 3,08
CL4L 650 19.811 4.00 100,0% 1,67 108,3 6,00
CL4H 1300 29.482 4.00 100,0% 1,70 210,2 5,88
IH1L 650 26.598 1.29 100,0% 3,00 42.13 2,00
IH1H 1300 33.567 1.29 100,0% 3,00 84.26 2,00
IH4L 650 37.652 4.00 100,0% 4,33 54,2 5,00
IH4H 1300 49.919 4.00 100,0% 4,50 98,5 4,64
CH1L 650 14.975 1.00 100,0% 1,00 162,5 3,50
CH1H 1300 23.710 1.00 100,0% 1,06 297,32 3,37
CH4L 650 26.749 4.00 100,0% 2,36 105,1 5,88
CH4H 1300 38.621 4.00 100,0% 2,79 148,7 4,74
is a function of nI and nS .
TotalCost∗ (nI , nS) =(fw (Q∗ (nI , nS)) + fv (Q
∗ (nI , nS))T
τ+2dInI+dSnS
)x∗ (nI , nS)
(5.26)
The optimal nI and nS can be derived by solving the system of equations that results
from the partial derivatives of the cost function with respect to nI and nS . Although
the above can lead to some complex analytical expressions depending on the assumed
cost functions fw and fv, it can be easily approximated by using mathematical pro-
gramming languages.
So we solved the same experiment as the one discussed in section 5.5 with the ana-
lytical model and we present the results in Tab. ??.
By analyzing the results of the analytical model the barge design tradeoffs become
clear. The number of barges and successively the number of calls per round trip
is determined such that the minimum service frequency is achieved. The resulting
service frequency exceeds the minimum required level only when its “free”; e.g. due
113

Chapter 5
to the minimum number of barges (scenarios IL1L and IL1H) where cooperation is
not considered and at least one barge should be assigned for each inland terminal.
The minimum service frequency is achieved first by increasing the number of calls,
and thus the average number of demand OD pairs served per round trip, which has
a small impact on cost, and then by increasing the number of barges which has a
higher impact on cost. After a routing plan has been determined the optimal barge
size is determined such that the resulting capacity meets the assumed demand. Of
course this simplistic sequential optimization would not hold in the real case where
design variables can only take discrete values. Overall, the results of the simplified
model make clear and verify our observations based on the results of the MIP model.
5.7 Conclusions
In this paper, the heterogeneous fleet selection and barge routing problem in a port-
hinterland network, connecting a set of closely located seaport container terminals
with a set of closely located dryport terminals has been introduced. The analysis of
the problem has been done based on a MIP and an analytical model, that have been
proposed.
We formulated the MIP model at a tactical level such that the demand over a time
horizon is served by a number of services distributed over that time horizon. The
utilization of the barges is considered not only in terms of space utilization of their
capacity but also in terms of time, by considering a continuous time formulation of
the model. We take advantage of the special structure of the problem and provide a
tight formulation that keeps down the number of variables and enables the efficient
construction of round trips such that commercial solvers can be used to find near
optimal solutions in relatively low computation times.
We developed a case and solved it with both the MIP and the analytical model
aiming first to assess the impact of cooperation of closely located dryport terminals
for capacity sharing, when visiting a main port area that consists of several con-
tainer terminals, and second, to assess the main design tradeoffs in the optimal barge
network design of such a case. In our experiment, we vary several parameters like
the demand volume, the expected delays, and minimum frequency requirements, as
described previously.
For the former case, the analysis of the results indicates that for our case cooperation
will always lead to cost reductions varying from 12% to 48%. For the latter case,
114
5.7 Conclusions
the optimal solutions were qualitatively analyzed. Bigger barges were deployed when
cooperation was considered, while each barge in a round trip served more OD pairs
but with smaller batch sizes; this is how a high frequency for every OD pair is
achieved. Moreover, in case of cooperation, barges in most round trips seem to call
more at the inland terminals instead at the congested seaport terminals.
The main driver of cost is the number and size of barges used. Network coverage is
mainly affected by the number of barges and their rotation over the network. With
bigger barges economies of scale can be achieved but their effective utilization usually
leads to longer round trips with more calls at terminals such that demand for more
OD pairs can be aggregated. This usually leads to increased circulation times and
higher in-transit times for cargo. On the other hand, smaller barges usually can be
used effectively for the formation of frequent shuttle services that satisfy demand for
a single or few OD pairs. Shuttle services or routes with few calls usually achieve
lower circulation times and more round trips can be realized within a given time
horizon. Moreover, the number of calls during a round trip can affect the scheduling
complexity as much as the reliability of transport times.
Although the case developed is rather small and results cannot be generalized easily,
the main tradeoffs in such a design emerge. Moreover, our results demonstrate some
features that seem to be critical for the tactical port hinterland network design and
that models in this regime should incorporate. Our paper extends existing litera-
ture on port hinterland network design in this direction by proposing models on the
tactical fleet selection and barge routing design incorporating these critical features.
115


6 Conclusion
This thesis contributes to the literature in two ways. From the technical side, new
mathematical models aimed at port hinterland network design are formulated and
heuristic procedures for their solutions are developed. The main technical contribu-
tions of this thesis are summarized in Tab. 6.1. From the managerial side, the data
analysis and the experimental cases solved with the models provide insights for the
main drivers that should be considered in the optimal design of freight combined
transport services. The main managerial contributions are summarized in Tab. 6.2.
Below we discuss the contribution of this thesis by going through the contents of
the three chapters, and then in the following section we propose directions for future
research in this regime.
Table 6.1: Technical contributions of this thesis
1. Information flow framework for combined transport
Chapter 12. Regression model to explain container dwell times atseaport terminals
3. Clustering analysis of shippers.
1. Bi-level MIP formulation for the multimodalport-hinterland network design with frequency dependenteconomies of scale and frequency-dependent service times
Chapter 22. Development of MIP -equivalent formulation of the bi-levelproblem
3. Development of heuristic procedure for solving the bi-levelmodel
1. Analytical expressions for calculating the expected cost,capacity and average frequency
Chapter 32. MIP formulation of Joint Mix Fleet deployment andRouting problem for the port hinterland network design
3. Efficient formulation solved by commercial solvers
117
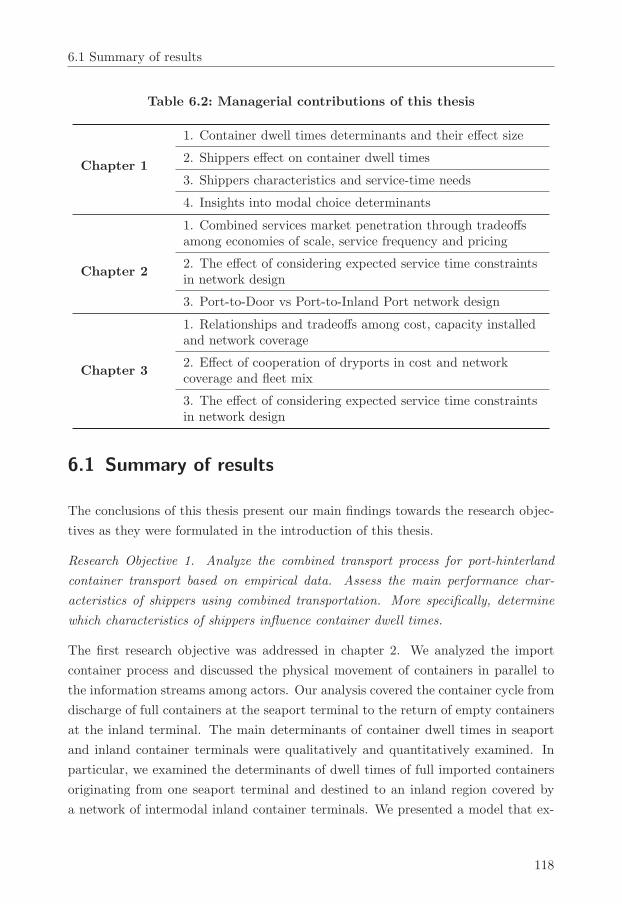
6.1 Summary of results
Table 6.2: Managerial contributions of this thesis
1. Container dwell times determinants and their effect size
Chapter 12. Shippers effect on container dwell times
3. Shippers characteristics and service-time needs
4. Insights into modal choice determinants
1. Combined services market penetration through tradeoffsamong economies of scale, service frequency and pricing
Chapter 22. The effect of considering expected service time constraintsin network design
3. Port-to-Door vs Port-to-Inland Port network design
1. Relationships and tradeoffs among cost, capacity installedand network coverage
Chapter 32. Effect of cooperation of dryports in cost and networkcoverage and fleet mix
3. The effect of considering expected service time constraintsin network design
6.1 Summary of results
The conclusions of this thesis present our main findings towards the research objec-
tives as they were formulated in the introduction of this thesis.
Research Objective 1. Analyze the combined transport process for port-hinterland
container transport based on empirical data. Assess the main performance char-
acteristics of shippers using combined transportation. More specifically, determine
which characteristics of shippers influence container dwell times.
The first research objective was addressed in chapter 2. We analyzed the import
container process and discussed the physical movement of containers in parallel to
the information streams among actors. Our analysis covered the container cycle from
discharge of full containers at the seaport terminal to the return of empty containers
at the inland terminal. The main determinants of container dwell times in seaport
and inland container terminals were qualitatively and quantitatively examined. In
particular, we examined the determinants of dwell times of full imported containers
originating from one seaport terminal and destined to an inland region covered by
a network of intermodal inland container terminals. We presented a model that ex-
118

6.1 Summary of results
plains and predicts dwell times at container terminals. In particular, 48% of the dwell
time variance is explained by factors related to the shippers involved. In contrast to
the common assumption that the container terminal performance is the main deter-
minant of dwell times, the shipper has emerged as the most important actor in control
of the import process and we showed that other factors exogenous to the container
terminal significantly influence dwell times. To the best of our knowledge, this is the
first study that quantitatively assesses the impact of such factors. Our results show
connections between dwell times and time criticality, and the value of information in
the reduction of dwell times. The assumption that dwell time performance can be
treated as a purely endogenous capacity performance criterion of seaport terminals
is challenged. The identification of the main determinants of container dwell times is
useful to policy makers at container terminals and port authorities when identifying
measures for the reduction of container dwell times; an effective measure would be
be to incentivize or penalize shippers to accelerate the process.
Moreover, clusters of shippers are identified with different characteristics and different
performances in terms of dwell times and modal choice. It was shown that shippers
have different service time needs regarding the inland transport of their containers.
The above observation motivated the research performed in the next chapters, in
which we considered that including the resulting service level offered to clients is
crucial to the effective design of port-hinterland services. This was a main modeling
concern relevant to addressing Research Objectives 2 and 3.
In particular, we consider three elements to be crucial for the effective design of port
hinterland networks: The different actors involved, the resulting service level offered
(measured either by expected service times or by service frequency), and the expected
cost of the proposed services.
The modeling of port-hinterland combined services is challenging and differs from
usual service network design. The main difference lies in the fact that demand for
combined port-hinterland transport services is elastic. That means that demand
can always be satisfied via trucking, the quickest and most flexible modality. Given
the above, effective models in this regime at the strategic and tactical levels should
consider the penetration of combined transport compared to road trucking and other
services provided by the competition. The penetration of combined services is based
on three pillars: cost, service times, and sustainability.
Research Objective 2. Establish a model to design a multimodal hinterland transport
network at the tactical level, by establishing shuttle services of high capacity modes
119
6.1 Summary of results
between seaport terminals and inland container terminals. The model should balance
costs faced by the carrier, and costs and service levels faced by the shippers that
arise from the network design related decisions, such as the optimal mode size, the
frequency of connections and pricing of services. The design of such a network and in
particular the tariffs and the expected service times establish the market penetration
of proposed services, while considering services offered by competitors.
The second research objective is addressed in chapter 3. We discussed the case of
extended gate operators in which maritime container terminal operating companies
have extended their role from node operators to that of multimodal transport net-
work operators. They have extended the gates of their seaport terminals to the gates
of the inland terminals in their network by means of frequent shuttle services of high
capacity transport modes such as river barges and trains. These network operators
face the following three interrelated decisions: (1) determine which inland terminals
act as extended gates of the seaport terminal, (2) determine capacities of the cor-
ridors, i.e. capacity of the transport means and frequency of service, and (3) set
the prices for the transport services on the corridors. The network operator does so
while anticipating the decisions of the customers, with different time requirements,
who choose minimum cost paths to their final destinations, and who always have the
option to choose alternative services offered by competitors. A bi-level MIP model
to jointly design and price extended gate network services for profit maximization
was proposed. The model extends existing bi-level models in a multimodal format
by including service time constraints and economies of scale that are crucial for the
efficient formulation of the multimodal nature of the problem. The resulting model
was NP hard and its bi-level structure with the existence of bi-linear terms prohib-
ited the use of commercial solvers. We proposed an alternative way to obtain a
linear equivalent MIP formulation of the problem and to find optimal solutions for
small instances. Considering the special structure of our problem, we proposed a
heuristic that achieves near optimal solutions to larger instances of our problem in
substantially less time.
Through experimental results for some realistic instances, we studied optimal net-
work designs while comparing seaport-to-door and seaport-to-inland port services
and situations where transit time requirements do and do not apply. Technically, our
analysis revealed that network design and pricing of services decisions are interrelated,
and that including service time constraints significantly affects the optimal network
configurations. Managerially, our results show that when demand is relatively low,
there are significant differences in the optimal network designs for port-to-door ver-
120
6.1 Summary of results
sus port-to-port services. In the case of port-to-door services, the prices of services
are determined by the competition and not by the design of the network, so the
network is designed against minimum costs, and economies of scale are achieved by
consolidating flows through a limited number of extended gates. The case of port-to-
port services is different, i.e. revenues are enhanced not so much by reducing costs
through the exploitation of economies of scale, but by exploiting the possibilities to
dedicate extended gates to market segments for which the competition leaves room
for higher port-to-port tariffs. Thus container terminals participating in an extended
gate concept should provide port-to-door services instead of port-to-port services.
The research in chapter 3 is calibrated to fit the case of extended gate operators but
the model developed can be actually used in more general settings. The connections
among the design and pricing of network services and service level offered to cus-
tomers may be relevant in a lot of freight network design cases. Moreover, it may be
applied to the design of public transport services, where the expected transport time,
frequency of connections, and tariffs directly affect the modal choice of customers.
The model in chapter 3 is limited to the design of point-to-point connections and
consolidation mainly happens on some corridors. There are other cases, where point-
to-point connections may not be a viable option, and consolidation is best achieved
by the rotation of resources, like barges, trains and trucks along terminals, hubs
etc. In chapter 4, we consider such a case where the optimal fleet is selected and its
deployment on a network of inland terminals is explored.
Research Objective 3. Establish a model to design a multimodal hinterland transport
network at the tactical level, by establishing rotation services of high capacity modes
along seaport terminals and inland terminals. The model should design the optimal
fleet and its deployment on a network, in such a way that costs are minimized while
demand is satisfied and expected service levels required by the shippers are met.
The third research objective is addressed in chapter 4. We studied the case of inland
intermodal carriers that schedule barge rotations to satisfy demand between seaport
and inland terminals. At the tactical level, the optimal fleet composition has to be
determined and rotation plans have to be proposed such that capacity is installed
over the network, while anticipating demand realization. We developed a MIP model
for Fleet Size and Mixed Vehicle Routing problem (FSMVRP) with multiple depots
especially adapted for the tactical design of port hinterland intermodal services. The
model aims to support tactical decisions regarding: (1). the fleet size and mix se-
lection, (2). the routing of the fleet over the network for a long time horizon in
121

6.2 Discussion and future research
order to satisfy demand under some service time related constraints, and (3). the
assignment of container flows to given services in order to assess the performance
of the proposed network design. FSMVRP models are NP-hard since they can be
reduced to the VRP but we took advantage of the special structure of the problem
in our case, and we provided a compact MIP formulation that enables the easy con-
struction of round trips that can be solved with commercial solvers. The utilization
over time is assessed by allowing multiple round trips per vessel during the time
horizon while considering the circulation times of round trips, that consist of sailing
times, handling times and expected delays. The model was applied to a real case
of an alliance of closely located dryports that connect with container terminals in a
seaport area, and we studied the impact of cooperation by capacity sharing, demand
variations and delay scenarios. Our results show that the fleet size and mix should
be jointly considered with its routing, since together they determine the capacity
installed, the resulting cost and the network coverage of the proposed collective of
services. Our case study shows that the collaboration of closely located dryports, for
capacity sharing, not only results in lower costs by the achievement of economies of
scale through the selection of bigger vessels but also to a higher market penetration
of barge services through the achievement of higher network coverage. Moreover,
there is a capacity boost associated with more calls at the inland side where delays
are usually lower, which results in lower circulation times and more round trips are
achieved.
Our analysis showed some trends on how the different design parameters can affect
the performance in terms of both costs and service levels, but also revealed that the
optimal design is case specific. So, we developed some analytical expressions that
depict the connection between design parameters like the number of vehicles, their
size and their routing characteristics, and performance measures like the total cost,
the capacity installed and network coverage.
6.2 Discussion and future research
The supply side of transport networks has been studied extensively in literature.
Most contributions are focused on vehicle routing and network design models and
their extensions. Most models concern decisions that are somewhere in between the
operational and tactical levels. Much effort is given to the development of efficient
heuristic procedures to solve these computationally intensive models for real sized
122
6.2 Discussion and future research
instances.
In practice though, these generic models have to be adapted to fit effectively the
specific needs and structures of every industry, especially at the tactical level. This is
usually done by modifying the objective functions and constraints used in the model
or by considering nonlinear relationships between decision variables and parameters.
The above, on the one hand, makes solutions more realistic and with higher practical
impact, but on the other hand, does not allow the use of already defined algorithms
for their efficient solution, since usually these are built to solve generic problems.
Since computational power increases continuously and commercial solvers become
more and more efficient, efforts should be given in literature to define models that
fit reality better. This can be achieved by addressing two main issues. First, in most
transport systems several actors are involved, at least the service operator and the
service receiver, usually with different objectives and constraints; the perspectives of
which should be considered for the realization of effective optimal solutions. Second,
several decisions that are interrelated are treated separately in literature, in order to
reduce the computational intensiveness.
So, our main proposition for future research in the field would the development of
optimization models with higher practical impact. Several optimization modeling
structures exist that would allow the consideration of the above issues but very few
are applied in a real context. This especially holds true for port-hinterland net-
work design. Bilevel, multilevel, non Linear, stochastic programming, mathematical
programming with equilibrium constraints (MPEC) formulations allow for a more
realistic representation of systems, but still there are very few contributions on these
types with high practical impact.
The models in this thesis can be considered first steps toward these goals, since
integrated decisions and multiple stakeholders are model elements in chapters 3 and
4. Our research could be extended in several ways. In particular, we discuss bellow
some possible extensions of the research performed in this thesis.
Regarding the analysis of container dwell times, the container export process could
also be considered since at the same time both import and export containers are
stored in container terminal yard. Moreover, the analysis could be extended for
several container terminals and inland carriers. In that way, the impact of all the
different possible determinants on container dwell times could be assessed simulta-
neously and findings could be generalized.
123
6.2 Discussion and future research
The analysis we did in the second chapter also revealed that the shippers have differ-
ent characteristics, and needs, and that they can affect the port-hinterland transport
process with their actions and selections. We considered this and incorporated the
expected service times offered to shippers in the models developed in chapters 3 and
4. But the demand side of port-hinterland container transport should be analyzed
in more depth, such that factors that determine mode and service selection should
become clear. Then, the demand side should be incorporated more explicitly when
designing the supply side of such networks. For example, hinterland multimodal net-
works offer to shippers many transport alternatives: different modalities, combined
transport services, transport services combined with other added value activities,
door-to-door services or port-to-port services, just in time services etc. All these
different options result in different costs, internal and external, and different service
times and services levels. So the demand side should be studied extensively in order
to better understand which shipper characteristics and needs are the main drivers of
transport service selection.
Finally, all the different transport services are offered to shipper by several parties,
competitors, and thus the competition should also be considered in the tactical design
of transport services. This is especially the case for multimodal inland carriers, that
design multimodal hinterland networks in which they offer transport services. These
hinterland networks are usually overlapping and the competitive position of the net-
work operators depend on services offered compared to those offered by competition.
In chapter 3, we explicitly considered the competition in terms of pricing while in
chapter 4 we considered the competition in terms of recourse actions (trucking). But
the competition should be considered more explicitly when one is interested on pen-
etration of the designed services. For example, an MPEC formulation could be used
to extend the bilevel formulation we proposed on chapter 3 to consider several inland
network operators offering transport services in overlapping networks.
124

Bibliography
Anghinolfi, D., Paolucci, M., Sacone, S., Siri, S., 2011. Freight transportation in rail-
way networks with automated terminals: A mathematical model and mip heuristic
approaches. European Journal of Operational Research 214 (3), 588–594.
Bauer, J., Bectas, T., Crainic, T., 2009. Minimizing greenhouse gas emissions in
intermodal freight transport: an application to rail service design. Operational
Research Society 61 (2), 530–542.
Behdani, B., Fan, Y., Wiegmans, B., Zuidwijk, R., 2014. Multimodal schedule design
for synchromodal freight transport systems. Available at SSRN 2438851.
Braekers, K., Caris, A., Janssens, G., 2012. Optimal shipping routes and vessel size
for intermodal barge transport with empty container repositioning. Computers in
Industry 64 (2), 155–164.
Brotcorne, L., Cirinei, F., Marcotte, P., Savard, G., 2011. An exact algorithm for the
network pricing problem. Discrete Optimization 8 (2), 246–258.
Brotcorne, L., Cirinei, F., Marcotte, P., Savard, G., 2012. A tabu search algorithm
for the network pricing problem. Computers & Operations Research 39 (11), 2603–
2611.
Brotcorne, L., Labbe, M., Marcotte, P., Savard, G., 2000. A bilevel model and solu-
tion algorithm for a freight tariff-setting problem. Transportation Science 34 (3),
289–302.
Brotcorne, L., Labbe, M., Marcotte, P., Savard, G., 2001. A bilevel model for toll
optimization on a multicommodity transportation network. Transportation Science
35 (4), 345–358.
Brotcorne, L., Labbe, M., Marcotte, P., Savard, G., 2008. Joint design and pricing
on a network. Operations Research 56 (5), 1104–1115.
Brotcorne, L., Marcotte, P., Savard, G., Wiart, M., 2005. Joint pricing and net-
work capacity setting problem. Advanced OR and AL Methods in Transportation
125

Bibliography
(Jaszkiewicz, Kaczmarek, Zak and Kubiak, eds.). Publishing House of Poznan Uni-
versity of Technology.
Caris, A., Macharis, C., Janssens, G., 2008. Planning problems in intermodal freight
transport: accomplishments and prospects. Transportation Planning and Technol-
ogy 31 (3), 277–302.
Caris, A., Macharis, C., Janssens, G. K., 2012. Corridor network design in hinterland
transportation systems. Flexible Services and Manufacturing Journal 24 (3), 294–
319.
Castillo, B. D., Daganzo, C. F., 1993. Handling strategies for import containers at
marine terminals. Transportation Research Part B: Methodological 27 (2), 151–
166.
Chu, C., Huang, W., 2005. Determining container terminal capacity on the basis of
an adopted yard handling system. Transport Reviews 25 (2), 181–199.
Cochrane, R., 2008. The effects of market differences on the throughput of large con-
tainer terminals with similar levels of efficiency. Maritime Economics & Logistics
10 (1), 35–52.
Crainic, T., 2000. Service network design in freight transportation. European Journal
of Operational Research 122 (2), 272 – 288.
Crainic, T., DellOlmo, P., Ricciardi, N., Sgalambro, A., 2013. Optimizing dry-port-
based freight distribution planning. CIRRELT-2013-10.
Crainic, T., Kim, K., 2007. Chapter 8 intermodal transportation. In: Barnhart, C.,
Laporte, G. (Eds.), Transportation. Vol. 14 of Handbooks in Operations Research
and Management Science. Elsevier, pp. 467–537.
Crainic, T. G., Rousseau, J., 1986. Multicommodity, multimode freight transporta-
tion: A general modeling and algorithmic framework for the service network design.
Transportation Research Part B: Methodological 20 (3), 225–242.
Crevier, B., Cordeau, J.-F., Savard, G., 2012. Integrated operations planning and
revenue management for rail freight transportation. Transportation Research Part
B: Methodological 46 (1), 100–119.
Daschkovska, K., Scholz-Reiter, B., 2008. Electronic seals for efficient container logis-
tics. In: Haasis, H., Kreowski, H., Scholz-Reiter, B. (Eds.), Dynamics in Logistics.
pp. 305–312, 1st International Conference on Dynamics in Logistics, Bremen, 2007.
126

Bibliography
Douma, A., Schutten, M., Schuur, P., 2009. Waiting profiles: An efficient protocol
for enabling distributed planning of container barge rotations along terminals in
the port of rotterdam. Transportation Research Part C: Emerging Technologies
17 (2), 133–148.
Ebeling, C., 2009. Evolution of a box. Invention and Technology 23 (4), 8–9.
Fremont, A., Franc, P., 2010. Hinterland transportation in europe: Combined trans-
port versus road transport. Journal of Transport Geography 18 (4), 548–556.
Gelareh, S., Nickel, S., 2011. Hub location problems in transportation networks.
Transportation Research Part E: Logistics and Transportation Review 47 (6),
1092–1111.
Gendreau, M., Marcotte, P., Savard, G., 1996. A hybrid tabu-ascent algorithm for
the linear bilevel programming problem. Journal of Global Optimization 8 (3),
217–233.
Golden, B., Assad, A., Levy, L., Gheysens, F., 1984. The fleet size and mix vehicle
routing problem. Computers & Operations Research 11 (1), 49–66.
Hamzaoui, S., Ben-Ayed, O., 2011. Parcel distribution timetabling problem. Opera-
tions Management Research 4 (3-4), 138–149.
Horner, M., O’Kelly, M., 2001. Embedding economies of scale concepts for hub net-
work design. Journal of Transport Geography 9 (4), 255–265.
Iannone, F., Thore, S., 2010. An economics logistics model for the multimodal inland
distribution of maritime containers. International Journal of Transport Economics
37 (3), 281–326.
Ishfaq, R., Sox, C. R., 2012. Design of intermodal logistics networks with hub delays.
European Journal of Operational Research 220 (3), 629–641.
Janic, M., 2007. Modelling the full costs of an intermodal and road freight transport
network. Transportation Research Part D: Transport and Environment 12 (1), 33–
44.
Kimms, A., 2006. Economies of scale in hub & spoke network design models: We
have it all wrong. In: Perspectives on Operations Research. Springer, pp. 293–317.
Klincewicz, J., 2002. Enumeration and search procedures for a hub location problem
with economies of scale. Annals of Operations Research 110 (1-4), 107–122.
127

Bibliography
Konings, R., 2003. Network design for intermodal barge transport. Transportation
Research Record: Journal of the Transportation Research Board 1820 (1), 17–25.
Konings, R., 2007. Opportunities to improve container barge handling in the port of
rotterdam from a transport network perspective. Journal of Transport Geography
15 (6), 443–454.
Labbe, M., Marcotte, P., Savard, G., 1998. A bilevel model of taxation and its appli-
cation to optimal highway pricing. Management Science 44 (12(1)), 1608–1622.
Leveque, P., Roso, V., 2002. Dryport concept for seaport inland access with in-
termodal solutions. Master Thesis. Department of Logistics and Transportation.
Chalmers University of Technology.
Li, L., Tayur, S., 2005. Medium-term pricing and operations planning in intermodal
transportation. Transportation Science 39 (1), 73–86.
Little, J. D., Graves, S. C., 2008. Little’s law. In: Building Intuition. Springer, pp.
81–100.
Liu, F.-H., Shen, S.-Y., 1999. The fleet size and mix vehicle routing problem with
time windows. Journal of the Operational Research Society, 721–732.
Lium, A.-G., Crainic, T., Wallace, S., 2009. A study of demand stochasticity in
service network design. Transportation Science 43 (2), 144–157.
Macharis, C., Bontekoning, Y., 2004. Opportunities for or in intermodal freight trans-
port research: A review. European Journal of Operational Research 153 (2), 400–
416.
Meng, Q., Wang, S., 2011. Liner shipping service network design with empty con-
tainer repositioning. Transportation Research Part E: Logistics and Transportation
Review 47 (5), 695–708.
Merckx, F., 2005. The issue of dwell time charges to optimize container terminal
capacity. In: Proceedings of the IAME 2005 Annual Conference, Limassol, Cyprus.
Moini, N., Boile, M., Theofanis, S., Laventhal, W., 2012. Estimating the determinant
factors of container dwell times at seaports. Maritime Economics & Logistics 14 (2),
162–177.
Notteboom, T., 2008. The relationship between seaports and the inter-modal hinter-
land in light of global supply chains (2008/10).
128
Bibliography
Notteboom, T., Merckz, F., 2006. Freight integration in liner shipping: A strategy
serving global production networks. Growth and Change 37 (4), 550–569.
Notteboom, T., Rodrigue, J., 2005. Port regionalization: towards a new phase in
port development. Maritime Policy Management 32 (3), 297–313.
Notteboom, T., Rodrigue, J., 2007. Re-assessing port-hinterland relationships in the
context of global commodity chains. In: Wang, J., Olivier, D., Notteboom, T.,
Slack, B. (Eds.), Ports, Cities, and Global Supply Chains. Ashgate Publishing,Ltd,
pp. 51–69.
O’Kelly, M. E., Bryan, D., 1998. Hub location with flow economies of scale. Trans-
portation Research Part B: Methodological 32 (8), 605–616.
Ottjes, J. A., Veeke, H., Duinkerken, M., Rijsenbrij, J. C., Lodewijks, G., 2006.
Simulation of a multiterminal system for container handling. OR Spectrum 28 (4),
447–468.
Rodrigue, J.-P., Notteboom, T., 2009. The terminalization of supply chains: reassess-
ing the role of terminals in port/hinterland logistical relationships. Maritime Policy
& Management 36 (2), 165–183.
Roso, V., Lumsden, K., 2010. A review of dry ports. Maritime Economics & Logistics
12 (2), 196–213.
Roso, V., Woxenius, J., Lumsden, K., 2009. The dry port concept: connecting con-
tainer seaports with the hinterland. Journal of Transport Geography 17 (5), 338–
345.
Salhi, S., Rand, G. K., 1993. Incorporating vehicle routing into the vehicle fleet
composition problem. European Journal of Operational Research 66 (3), 313–330.
Salhi, S., Sari, M., 1997. A multi-level composite heuristic for the multi-depot vehicle
fleet mix problem. European Journal of Operational Research 103 (1), 95–112.
Sharypova, K., 2014. Optimization of hinterland intermodal container transportation.
Ph.D. Thesis, Technische Universiteit Eindhoven.
Sharypova, K., Crainic, T. G., van Woensel, T., Fransoo, J., 2012. Scheduled Service
Network Design with Synchronization and Transshipment Constraints for Inter-
modal Container Transportation Networks. Publication CIRRELT-2012-77, Cen-
tre interuniversitaire de recherche sur les reseaux d’entreprise, la logistique et le
transport, Universite de Montreal.
129

Bibliography
Shintani, K., Imai, A., Nishimura, E., Papadimitriou, S., 2007. The container ship-
ping network design problem with empty container repositioning. Transportation
Research Part E: Logistics and Transportation Review 43 (1), 39–59.
SteadieSeifi, M., Dellaert, N. P., Nuijten, W., Van Woensel, T., Raoufi, R., 2014.
Multimodal freight transportation planning: A literature review. European Journal
of Operational Research 233 (1), 1–15.
Steenken, D., Voss, S., Stahlbock, R., 2004. Container terminal operation and oper-
ations research - a classification and literature review. OR Spectrum 26 (1), 3–49.
Van Baalen, P., Zuidwijk, R., Van Nunen, J., 2009. Port inter-organizational informa-
tion systems: Capabilities to service global supply chains. Foundations and Trends
(R) in Technology, Information and Operations Management 2 (2-3), 81–241.
Van Riessen, B., Negenborn, R., Dekker, R., Lodewijks, G., 2013. Service network
design for an intermodal container network with flexible due dates/times and the
possibility of using subcontracted transport. Tech. rep., Erasmus School of Eco-
nomics (ESE).
Veeke, H., Ottjes, J., 2002. A generic simulation model for systems of container
terminals. In: Amborski, K., Meuth, H. (Eds.), Modelling and Simulation 2002.
pp. 581–587, 16th European Simulation Multiconference, Germany, 2002.
Veenstra, A., Zuidwijk, R., 2010. 17.the future of seaport hinterland networks. In:
Liber Amicorum, In memoriam Jo van Nunen. Dinalog, pp. 205–215.
Veenstra, A., Zuidwijk, R., van Asperen, E., 2012. The extended gate concept for
container terminals: Expanding the notion of dry ports. Maritime Economics &
Logistics 14 (1), 14–32.
Veenstra, A. W., Zuidwijk, R. A., 2015. Towards efficient multimodal hinterland net-
works. Logistics and Supply Chain Innovation: Bridging the Gap between Theory
and Practice, 55.
Vis, I. F., De Koster, R., 2003. Transshipment of containers at a container terminal:
An overview. European journal of operational research 147 (1), 1–16.
Wieberneit, N., 2008. Service network design for freight transportation: a review.
OR Spectrum 30, 77–112.
130

Summary
Globalization has led to a tremendous growth of international trade over the last
century amounting to $18.8 trillion in 2014. Approximately 90% of non-bulk cargo is
transported in shipping containers. The dominant mode in container transportation
is maritime, in which containers are transported from a seaport to another seaport
around the globe. Import containers are discharged in seaport container terminals
and are destined to inland locations, a reverse process happens for export containers.
The inland terminals can be close or far away from the seaport terminals where the
containers were discharged. The container transport between the seaport and the
inland locations is called port-hinterland transportation. Given the specific physical
characteristics and infrastructure of each area this part of the transportation chain
can be performed via trucks, trains or river vessels. The sequential use of multiple
transport modes in port-hinterland transport is called combined transport. The
main aim of this study is to analyze the port-hinterland transportation process and
to develop models that support the design, planning and execution of port-hinterland
transportation networks with high capacity modes such as barges and trains.
In the third chapter of this thesis we studied the port-hinterland intermodal trans-
port process. We analyze container transport data that demonstrate that shippers
have different needs regarding the port-hinterland container transport. Some opt to
transport their containers in the quickest possible way using trucks, while others opt
to use the seaport and inland terminal yards for shorter or longer storage until the
cargo of the container is actually needed. In the latter case containers can be moved
from the seaport to the inland terminal via trains or barges. The modality and type
of port-hinterland transport services may vary from time to time depending on the
urgency of the container delivery and available means.
In combined port-hinterland transport, the use of different modalities, the fleet selec-
tion, the capacity and frequency setting of services, the routing of assets in a network
can significantly affect the overall performance of the transportation network in terms
of costs, service times, modal split, sustainability, etc.
131

In this dissertation we studied two cases of port-hinterland intermodal network design
and developed models for their optimal design. The first study, focuses on container
terminal operating companies that have extended their role from node operators to
that of multimodal transport network operators. They have extended the gates of
their seaport terminals to the gates of inland terminals in their network by means of
frequent services of high capacity transport modes such as river vessels (barges) and
trains. These network operators face the following three interrelated decisions: (1)
determine which inland terminals act as extended gates of the seaport terminal, (2)
determine capacities of the corridors, i.e. size of the transport modes and frequency
of service, and (3) set the prices for the transport services on the network. We
proposed a bi-level programming model to jointly design and price extended gate
network services for profit maximization. Our results showed that the above decisions
are interrelated, and lead to different optimal designs compared to those that would
emerge if treated separately.
The second study, focuses on a case of a possible alliance of dryports closely located
in the hinterland that share capacity to efficiently transport containers from and to
a seaport area that consists of several container terminals. The tactical design of
scheduled barge transport services involves decisions regarding both the fleet com-
position and its routing through the inland waterway network. Integrating these
decisions would make the resulting network more competitive in satisfying expected
demand and service time requirements set by the shippers. We develop some analyt-
ical expressions and a MIP formulation for the Fleet Size and Mix Vehicle Routing
(FSMVRP) specially adapted to the Port-Hinterland intermodal barge network de-
sign. Our results not only show that in the case of cooperation of the dryports there
could be significant costs and service quality benefits but also that the fleet selection
and routing are interrelated decisions that should be treated simultaneously.
In this dissertation we develop models that support the design of combined services
in networks consisting of seaport and inland terminals such that consolidation op-
portunities emerge and high frequency services are achieved. We achieve that by
explicitly considering the time dimension, economies of scale in our modeling next to
other factors crucial to the effective modeling in this regime.
132
Samenvatting (Summary in Dutch)
Globalisering is gepaard gegaan met een enorme groei aan internationale handel en
deze had een waarde van maar liefst $18.8 triljoen in 2014. De grote hoeveelheid
lading die over grote afstanden moet worden vervoerd, buiten bulk lading, gaat voor
90% in gestandaardiseerde lading eenheden, zogeheten containers. Containers worden
het meest getransporteerd per zee, en dit gebeurt tussen havens wereldwijd. Import
containers worden gelost in de zeehaven via container terminals, en zijn bestemd voor
locaties landinwaarts, en omgekeerd geschiedt het proces voor export containers. De
terminals landinwaarts kunnen dicht bij de zeehaven liggen, maar ook wat verder
weg. Het containervervoer tussen de zeehaven en de landinwaartse locaties heet
haven-achterland transport.
Afhankelijk van de specifieke fysieke kenmerken en de infrastructuur van dit deel van
de transportketen, kan het transport plaatsvinden met gebruik van vrachtwagens,
treinen, of binnenvaartschepen. Het opeenvolgend inzetten van meerdere vervoer-
swijzen in haven-achterlandtransport van containers wordt intermodaal transport
genoemd.
Het belangrijkste doel van dit proefschrift is het analyseren en verbeteren van het
haven-achterlandtransportproces. Daartoe worden modellen ontwikkeld die het on-
twerp, de planning, en de uitvoering van haven-achterlandtransportnetwerken onder-
steunen. We richten ons hierbij vooral op vervoersmiddelen als binnenvaartschepen
en treinen, die een hoge capaciteit hebben. In het derde hoofdstuk van dit proefschrift
onderzoeken we het intermodaal transport proces van het haven-achterland. Uit de
data analyse omtrent container transport komt naar voren dat verladers, de verzen-
ders of ontvangers van de lading, verschillende behoeften hebben met betrekking tot
het haven-achterland containervervoer.
Sommige veladers kiezen ervoor om hun containers op de snelst mogelijke manier met
behulp van vrachtwagens te vervoeren, terwijl anderen ervoor kiezen om de zeehaven
en de landinwaartse terminals te gebruiken voor kortere of langere opslag, tot de
lading van de container daadwerkelijk nodig is. In het laatste geval kunnen containers
133

worden verplaatst van de zeehaven naar de landinwaartse terminals met gebruik van
treinen of binnenvaartschepen. Het gebruikte vervoersmiddel (schip of trein, maar
ook: omvang) kan varieren afhankelijk van de urgentie van de container levering en
de beschikbare vervoerswijzen. Bij gecombineerde haven-achterlandtransport kunnen
het gebruik van verschillende vervoersmiddelen, de beschikbare vloot, de capaciteit
en de frequentie van diensten, en de routering van vervoersmiddelen in een netwerk,
een aanzienlijke invloed hebben op de algehele prestaties van het vervoersnetwerk qua
kosten, service tijden, verdeling van transport over vervoersmiddelen, duurzaamheid
et cetera.
In dit proefschrift bestuderen we twee casussen omtrent het ontwerp van haven-
achterland intermodale netwerken en ontwikkelen we modellen voor optimalisatie van
het ontwerp. De eerste studie richt zich op container terminalbedrijven die hun rol
van beheerder van knooppunt hebben uitgebreid naar die van netbeheerder van mul-
timodaal vervoer. Zij hebben de poorten van hun zeehaven terminals in hun netwerk
uitgebreid naar de poorten van landinwaartse terminals via regelmatige diensten van
transportmiddelen met een hoge capaciteit zoals binnenvaartschepen en treinen. Deze
landinwaartse terminals worden dan ook wel dry ports genoemd. Deze netbeheerders
worden geconfronteerd met de volgende drie met elkaar samenhangende beslissin-
gen: (1) het bepalen welke landinwaartse terminals fungeren als verlengstuk van de
zeehaven terminals, (2) het bepalen welke capaciteiten deze paden hebben, dat wil
zeggen de grootte van de transportmiddelen en de frequentie van de diensten, en (3)
het bepalen van de prijs voor vervoersdiensten op het netwerk.
We presenteren een lineair programmeringsmodel met twee niveaus om gelijktijdig
netwerk diensten van voortgezet transport te ontwerpen en daarvan de prijs te bepalen
met als oogmerk winstmaximalisatie. Onze resultaten tonen aan dat de bovenge-
noemde beslissingen met elkaar verbonden zijn en leiden tot verschillende optimale
ontwerpen, vergeleken met een analyse waarbij deze factoren afzonderlijk zouden
worden behandeld.
Het tweede onderzoek richt zich op een casus van een mogelijke alliantie van dry
ports nabij het achterland die gezamenlijk capaciteit hebben om containers efficient te
vervoeren van en naar een zeehavengebied dat verschillende containerterminals bevat.
Het tactische ontwerp van geplande binnenvaarttransportdiensten betreft beslissingen
over zowel de samenstelling van de vloot als de routering ervan door het netwerk van
landinwaartse waterwegen.
Door het integreren van deze beslissingen zou het resulterende netwerk meer com-
134

petitief kunnen worden door beter te voldoen aan de verwachte vraag en gewenste
levertijden van de verladers. We ontwikkelen een aantal analytische uitdrukkingen
en een meer gedetailleerd optimaliseringsmodel voor de omvang en routering van de
vloot, speciaal aangepast aan het Haven-Achterland intermodale binnenvaart netwerk
ontwerp. Onze resultaten wijzen uit dat er niet alleen bij samenwerking van de dry
ports aanzienlijke verbeteringen in kosten en servicekwaliteit zijn, maar ook dat vloot
selectie en routering samenhangende beslissingen zijn die tegelijkertijd dienen te wor-
den beschouwd. In dit proefschrift ontwikkelen we modellen die het ontwerp van de
gecombineerde transportdiensten ondersteunen in netwerken van zeehavens en land-
inwaartse terminals zodanig dat er consolidatie mogelijkheden ontstaan en een hoge
frequente van diensten wordt bereikt. Dat bewerkstelligen we door nadrukkelijk
rekening te houden met de tijdsdimensie en schaalvoordelen in onze modellen. Ook
houden we rekening met een aantal andere factoren die van groot belang en specifiek
zijn voor het achterlandtransport.
135


Curriculum Vitae
Panagiotis Ypsilantis was born on April 30,
1984 in Athens, Greece. In 2008 he received
his Mechanical and Industrial Engineering
diploma from Aristotle’s University of
Thessaloniki in Greece. In 2010 he received
his M.Sc. degree in Econometrics and
Management science, with a specialization in
Operations Research and Quantitative
Logistics, from Erasmus University in
Rotterdam.
In 2011, Panagiotis started his Ph.D. program
at the Erasmus Research Institute of Management (ERIM) to work on network design
modeling on intermodal freight transportation systems. His research was part of the
ULTIMATE project which was funded by DINALOG. During this period he worked for
the Technology and Operations Management department of Rotterdam School of
Management (RSM). He lecture courses both in bachelor and master levels. His main
research interests are in Operations Research applications in freight transportation,
maritime industry, revenue management and customer segmentation.
Panagiotis has presented his research at various international conferences, such as
TRISTAN, TSL Workshop, IFORS, INFORMS, POMS, OR, and LOGMS. Currently,
Panagiotis is a Senior Data Analytics Consultant at Ernst and Young (EY).


Portfolio
PhD training
Courses
Statistical Methods (ERIM) 2011
Stochastic Programming (LNMB) 2011
Applied Econometrics (ERIM) 2012
Cooperative Game Theory (LNMB) 2011
Logistics and Freight Transport Systems Analysis
(TRAIL) 2011
Research Methodologies for Transport Systems
(TransportNet) 2012
Models for Logistics and Supply Chain Management
(DINALOG-BETA-TRAIL) 2012
Discrete Choice Modelling (TRAIL) 2011
Reading Group Stochastic Programming 2011
Seminars and workshops
The sixteenth ELA Doctorate Workshop 2012
Joint Technion – Erasmus Workshop: Optimization
Methods Applied to Operations Research and
Engineering
2011
TSL Workshop on Maritime Transportation & Port
Logistics 2013
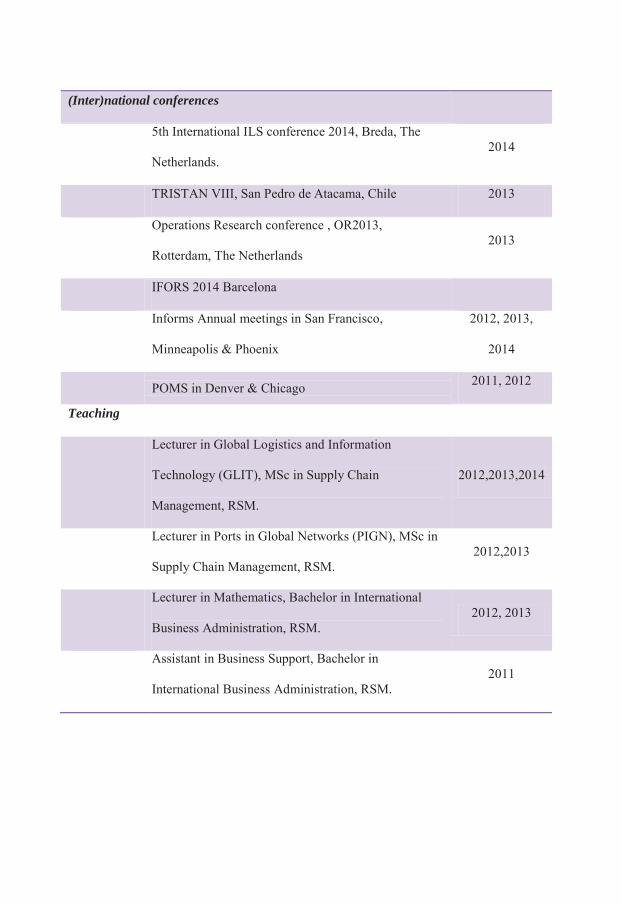
(Inter)national conferences
5th International ILS conference 2014, Breda, The
Netherlands. 2014
TRISTAN VIII, San Pedro de Atacama, Chile 2013
Operations Research conference , OR2013,
Rotterdam, The Netherlands 2013
IFORS 2014 Barcelona
Informs Annual meetings in San Francisco,
Minneapolis & Phoenix
2012, 2013,
2014
POMS in Denver & Chicago 2011, 2012
Teaching
Lecturer in Global Logistics and Information
Technology (GLIT), MSc in Supply Chain
Management, RSM.
2012,2013,2014
Lecturer in Ports in Global Networks (PIGN), MSc in
Supply Chain Management, RSM. 2012,2013
Lecturer in Mathematics, Bachelor in International
Business Administration, RSM. 2012, 2013
Assistant in Business Support, Bachelor in
International Business Administration, RSM. 2011
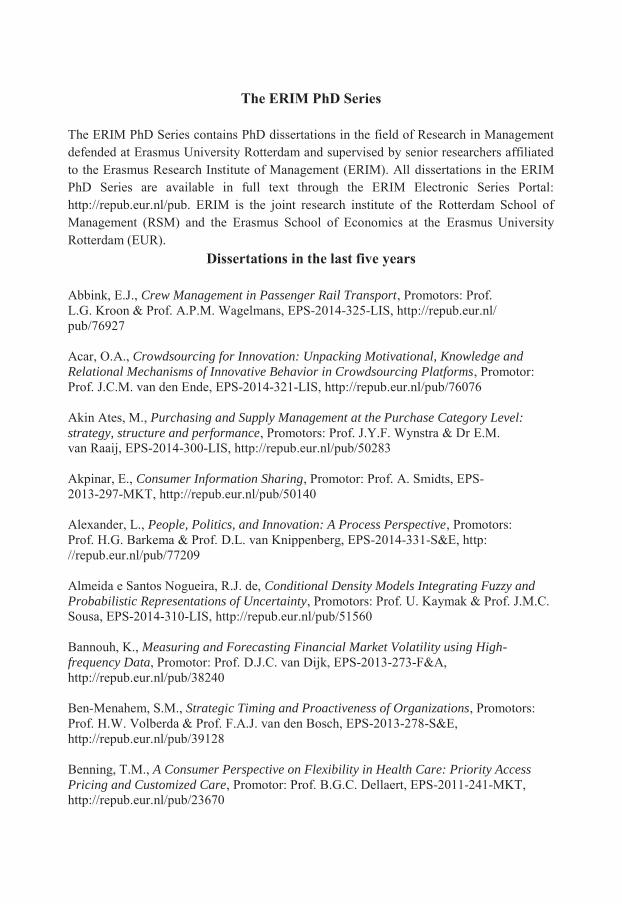
The ERIM PhD Series
The ERIM PhD Series contains PhD dissertations in the field of Research in Management defended at Erasmus University Rotterdam and supervised by senior researchers affiliated to the Erasmus Research Institute of Management (ERIM). All dissertations in the ERIM PhD Series are available in full text through the ERIM Electronic Series Portal: http://repub.eur.nl/pub. ERIM is the joint research institute of the Rotterdam School of Management (RSM) and the Erasmus School of Economics at the Erasmus University Rotterdam (EUR).
Dissertations in the last five years Abbink, E.J., Crew Management in Passenger Rail Transport, Promotors: Prof. L.G. Kroon & Prof. A.P.M. Wagelmans, EPS-2014-325-LIS, http://repub.eur.nl/ pub/76927 Acar, O.A., Crowdsourcing for Innovation: Unpacking Motivational, Knowledge and Relational Mechanisms of Innovative Behavior in Crowdsourcing Platforms, Promotor: Prof. J.C.M. van den Ende, EPS-2014-321-LIS, http://repub.eur.nl/pub/76076 Akin Ates, M., Purchasing and Supply Management at the Purchase Category Level: strategy, structure and performance, Promotors: Prof. J.Y.F. Wynstra & Dr E.M. van Raaij, EPS-2014-300-LIS, http://repub.eur.nl/pub/50283 Akpinar, E., Consumer Information Sharing, Promotor: Prof. A. Smidts, EPS- 2013-297-MKT, http://repub.eur.nl/pub/50140 Alexander, L., People, Politics, and Innovation: A Process Perspective, Promotors: Prof. H.G. Barkema & Prof. D.L. van Knippenberg, EPS-2014-331-S&E, http: //repub.eur.nl/pub/77209 Almeida e Santos Nogueira, R.J. de, Conditional Density Models Integrating Fuzzy and Probabilistic Representations of Uncertainty, Promotors: Prof. U. Kaymak & Prof. J.M.C. Sousa, EPS-2014-310-LIS, http://repub.eur.nl/pub/51560 Bannouh, K., Measuring and Forecasting Financial Market Volatility using High-frequency Data, Promotor: Prof. D.J.C. van Dijk, EPS-2013-273-F&A, http://repub.eur.nl/pub/38240 Ben-Menahem, S.M., Strategic Timing and Proactiveness of Organizations, Promotors: Prof. H.W. Volberda & Prof. F.A.J. van den Bosch, EPS-2013-278-S&E, http://repub.eur.nl/pub/39128 Benning, T.M., A Consumer Perspective on Flexibility in Health Care: Priority Access Pricing and Customized Care, Promotor: Prof. B.G.C. Dellaert, EPS-2011-241-MKT, http://repub.eur.nl/pub/23670

Benschop, N, Biases in Project Escalation: Names, frames & construal levels, Promotors: Prof. K.I.M. Rhode, Prof. H.R. Commandeur, Prof. M.Keil & Dr A.L.P. Nuijten, EPS-2015-375-S&E, hdl.handle.net/1765/79408 Berg, W.E. van den, Understanding Salesforce Behavior using Genetic Association Studies, Promotor: Prof. W.J.M.I. Verbeke, EPS-2014-311-MKT, http://repub.eur.nl/pub/51440 Betancourt, N.E., Typical Atypicality: Formal and Informal Institutional Conformity, Deviance, and Dynamics, Promotor: Prof. B. Krug, EPS-2012-262-ORG, http://repub.eur.nl/pub/32345 Beusichem, H.C. van, Firms and Financial Markets: Empirical Studies on the Informational Value of Dividends, Governance and Financial Reporting, Promotors: Prof. A. de Jong & Dr. G. Westerhuis, EPS-2016-378-F&A, http://repub.eur.nl/pub/93079 Bliek, R. de, Empirical Studies on the Economic Impact of Trust, Promotor: Prof. J. Veenman & Prof. Ph.H.B.F. Franses, EPS-2015-324-ORG, http://repub.eur.nl/pub/78159 Blitz, D.C., Benchmarking Benchmarks, Promotors: Prof. A.G.Z. Kemna & Prof. W.F.C. Verschoor, EPS-2011-225-F&A, http://repub.eur.nl/pub/22624 Boons, M., Working Together Alone in the Online Crowd: The Effects of Social Motivationsand Individual Knowledge Backgrounds on the Participation and Performance of Members of Online Crowdsourcing Platforms, Promotors: Prof. H.G. Barkema & Dr D.A. Stam, EPS-2014-306-S&E, http://repub.eur.nl/pub/50711 Brazys, J., Aggregated Marcoeconomic News and Price Discovery, Promotor: Prof. W.F.C. Verschoor, EPS-2015-351-F&A, http://repub.eur.nl/pub/78243 Burger, M.J., Structure and Cooptition in Urban Networks, Promotors: Prof. G.A. van der Knaap & Prof. H.R. Commandeur, EPS-2011-243-ORG, http://repub.eur. nl/pub/26178 Byington, E., Exploring Coworker Relationships: Antecedents and Dimensions of Interpersonal Fit,Coworker Satisfaction, and Relational Models, Promotor: Prof. D.L. van Knippenberg, EPS-2013-292-ORG, http://repub.eur.nl/pub/41508 Camacho, N.M., Health and Marketing: Essays on Physician and Patient Decision- Making, Promotor: Prof. S. Stremersch, EPS-2011-237-MKT, http://repub.eur.nl/pub/23604 Cancurtaran, P., Essays on Accelerated Product Development, Promotors: Prof. F. Langerak & Prof.G.H. van Bruggen, EPS-2014-317-MKT, http://repub.eur.nl/pub/76074

Caron, E.A.M., Explanation of Exceptional Values in Multi-dimensional Business Databases, Promotors: Prof. H.A.M. Daniels & Prof. G.W.J. Hendrikse, EPS-2013-296-LIS, http://repub.eur.nl/pub/50005 Carvalho, L. de, Knowledge Locations in Cities: Emergence and Development Dynamics, Promotor: Prof. L. Berg, EPS-2013-274-S&E, http://repub.eur.nl/pub/38449 Cranenburgh, K.C. van, Money or Ethics: Multinational corporations and religious organisations operating in an era of corporate responsibility, Prof. L.C.P.M. Meijs, Prof. R.J.M. van Tulder & Dr D. Arenas, EPS-2016-385-ORG, http://repub.eur.nl/pub/93104 Consiglio, I., Others: Essays on Interpersonal and Consumer Behavior, Promotor: Prof. S.M.J. van Osselaer, EPS-2016-366-MKT, http://repub.eur.nl/pub/79820 Cox, R.H.G.M., To Own, To Finance, and To Insure - Residential Real Estate Revealed, Promotor: Prof. D. Brounen, EPS-2013-290-F&A, http://repub.eur.nl/pub/40964 Darnihamedani, P. Individual Characteristics, Contextual Factors and Entrepreneurial Behavior, Promotors: A.R. Thurik & S.J.A. Hessels, EPS-2016-360-S&E, http://repub.eur.nl/pub/93280 Deichmann, D., Idea Management: Perspectives from Leadership, Learning, and Network Theory, Promotor: Prof. J.C.M. van den Ende, EPS-2012-255-ORG, http://repub.eur.nl/pub/31174 Deng, W., Social Capital and Diversification of Cooperatives, Promotor: Prof. G.W.J. Hendrikse, EPS-2015-341-ORG, http://repub.eur.nl/pub/77449 Desmet, P.T.M., In Money we Trust? Trust Repair and the Psychology of Financial Compensations, Promotor: Prof. D. de Cremer, EPS-2011-232-ORG, http://repub.eur.nl/pub/23268 Dollevoet, T.A.B., Delay Management and Dispatching in Railways, Promotor: Prof. A.P.M. Wagelmans, EPS-2013-272-LIS, http://repub.eur.nl/pub/38241 Doorn, S. van, Managing Entrepreneurial Orientation, Promotors: Prof. J.J.P. Jansen, Prof. F.A.J. van den Bosch, & Prof. H.W. Volberda, EPS-2012-258- STR, http://repub.eur.nl/pub/32166 Douwens-Zonneveld, M.G., Animal Spirits and Extreme Confidence: No Guts, No Glory? Promotor: Prof. W.F.C. Verschoor, EPS-2012-257-F&A, http://repub.eur.nl/pub/31914 Duca, E., The Impact of Investor Demand on Security Offerings, Promotor: Prof. A. de Jong, EPS-2011-240-F&A, http://repub.eur.nl/pub/26041 Duyvesteyn, J.G. Empirical Studies on Sovereign Fixed Income Markets, Promotors: Prof. P.Verwijmeren & Prof. M.P.E. Martens, EPS-2015-361-F&A, hdl.handle.net/1765/79033
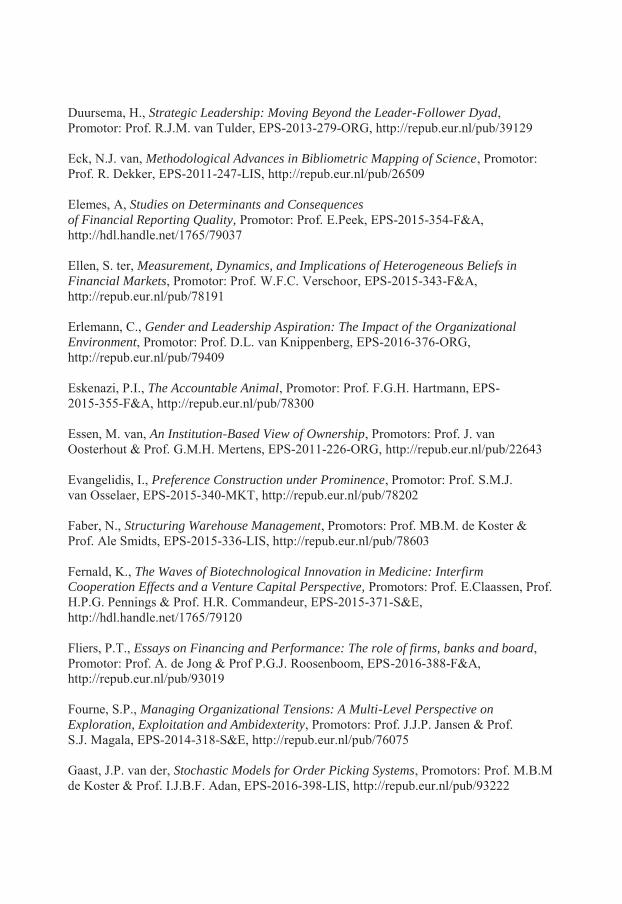
Duursema, H., Strategic Leadership: Moving Beyond the Leader-Follower Dyad, Promotor: Prof. R.J.M. van Tulder, EPS-2013-279-ORG, http://repub.eur.nl/pub/39129 Eck, N.J. van, Methodological Advances in Bibliometric Mapping of Science, Promotor: Prof. R. Dekker, EPS-2011-247-LIS, http://repub.eur.nl/pub/26509 Elemes, A, Studies on Determinants and Consequences of Financial Reporting Quality, Promotor: Prof. E.Peek, EPS-2015-354-F&A, http://hdl.handle.net/1765/79037 Ellen, S. ter, Measurement, Dynamics, and Implications of Heterogeneous Beliefs in Financial Markets, Promotor: Prof. W.F.C. Verschoor, EPS-2015-343-F&A, http://repub.eur.nl/pub/78191 Erlemann, C., Gender and Leadership Aspiration: The Impact of the Organizational Environment, Promotor: Prof. D.L. van Knippenberg, EPS-2016-376-ORG, http://repub.eur.nl/pub/79409 Eskenazi, P.I., The Accountable Animal, Promotor: Prof. F.G.H. Hartmann, EPS- 2015-355-F&A, http://repub.eur.nl/pub/78300 Essen, M. van, An Institution-Based View of Ownership, Promotors: Prof. J. van Oosterhout & Prof. G.M.H. Mertens, EPS-2011-226-ORG, http://repub.eur.nl/pub/22643 Evangelidis, I., Preference Construction under Prominence, Promotor: Prof. S.M.J. van Osselaer, EPS-2015-340-MKT, http://repub.eur.nl/pub/78202 Faber, N., Structuring Warehouse Management, Promotors: Prof. MB.M. de Koster & Prof. Ale Smidts, EPS-2015-336-LIS, http://repub.eur.nl/pub/78603 Fernald, K., The Waves of Biotechnological Innovation in Medicine: Interfirm Cooperation Effects and a Venture Capital Perspective, Promotors: Prof. E.Claassen, Prof. H.P.G. Pennings & Prof. H.R. Commandeur, EPS-2015-371-S&E, http://hdl.handle.net/1765/79120 Fliers, P.T., Essays on Financing and Performance: The role of firms, banks and board, Promotor: Prof. A. de Jong & Prof P.G.J. Roosenboom, EPS-2016-388-F&A, http://repub.eur.nl/pub/93019 Fourne, S.P., Managing Organizational Tensions: A Multi-Level Perspective on Exploration, Exploitation and Ambidexterity, Promotors: Prof. J.J.P. Jansen & Prof. S.J. Magala, EPS-2014-318-S&E, http://repub.eur.nl/pub/76075 Gaast, J.P. van der, Stochastic Models for Order Picking Systems, Promotors: Prof. M.B.M de Koster & Prof. I.J.B.F. Adan, EPS-2016-398-LIS, http://repub.eur.nl/pub/93222

Gharehgozli, A.H., Developing New Methods for Efficient Container Stacking Operations, Promotor: Prof. M.B.M. de Koster, EPS-2012-269-LIS, http://repub.eur.nl/pub/37779 Gils, S. van, Morality in Interactions: On the Display of Moral Behavior by Leaders and Employees, Promotor: Prof. D.L. van Knippenberg, EPS-2012-270-ORG, http://repub.eur.nl/pub/38027 Ginkel-Bieshaar, M.N.G. van, The Impact of Abstract versus Concrete Product Communications on Consumer Decision-making Processes, Promotor: Prof. B.G.C. Dellaert, EPS-2012-256-MKT, http://repub.eur.nl/pub/31913 Gkougkousi, X., Empirical Studies in Financial Accounting, Promotors: Prof. G.M.H. Mertens & Prof. E. Peek, EPS-2012-264-F&A, http://repub.eur.nl/pub/37170 Glorie, K.M., Clearing Barter Exchange Markets: Kidney Exchange and Beyond, Promotors: Prof. A.P.M. Wagelmans & Prof. J.J. van de Klundert, EPS-2014-329-LIS, http://repub.eur.nl/pub/77183 Hekimoglu, M., Spare Parts Management of Aging Capital Products, Promotor: Prof. R. Dekker, EPS-2015-368-LIS, http://hdl.handle.net/1765/79092 Heij, C.V., Innovating beyond Technology. Studies on how management innovation, co-creation and business model innovation contribute to firm’s (innovation) performance, Promotors: Prof. F.A.J. van den Bosch & Prof. H.W. Volberda, EPS-2012-370-STR, http://repub.eur.nl/pub/78651 Heyde Fernandes, D. von der, The Functions and Dysfunctions of Reminders, Promotor: Prof. S.M.J. van Osselaer, EPS-2013-295-MKT, http://repub.eur.nl/pub/41514 Heyden, M.L.M., Essays on Upper Echelons & Strategic Renewal: A Multilevel Contingency Approach, Promotors: Prof. F.A.J. van den Bosch & Prof. H.W. Volberda, EPS-2012-259-STR, http://repub.eur.nl/pub/32167 Hoever, I.J., Diversity and Creativity, Promotor: Prof. D.L. van Knippenberg, EPS-2012-267-ORG, http://repub.eur.nl/pub/37392 Hogenboom, A.C., Sentiment Analysis of Text Guided by Semantics and Structure, Promotors: Prof. U. Kaymak & Prof. F.M.G. de Jong, EPS-2015-369-LIS, http://hdl.handle.net/1765/79034 Hogenboom, F.P., Automated Detection of Financial Events in News Text, Promotors: Prof. U. Kaymak & Prof. F.M.G. de Jong, EPS-2014-326-LIS, http://repub.eur.nl/pub/77237

Hollen, R.M.A., Exploratory Studies into Strategies to Enhance Innovation-Driven International Competitiveness in a Port Context: Toward Ambidextrous Ports, Promotors: Prof. F.A.J. Van Den Bosch & Prof. H.W.Volberda, EPS-2015-372-S&E, hdl.handle.net/1765/78881 Hoogendoorn, B., Social Entrepreneurship in the Modern Economy: Warm Glow, Cold Feet, Promotors: Prof. H.P.G. Pennings & Prof. A.R. Thurik, EPS-2011-246-STR, http://repub.eur.nl/pub/26447 Hoogervorst, N., On The Psychology of Displaying Ethical Leadership: A Behavioral Ethics Approach, Promotors: Prof. D. de Cremer & Dr M. van Dijke, EPS-2011- 244-ORG, http://repub.eur.nl/pub/26228 Hout, D.H. van, Measuring Meaningful Differences: Sensory Testing Based Decision Making in an Industrial Context; Applications of Signal Detection Theory and Thurstonian Modelling, Promotors: Prof. P.J.F. Groenen & Prof. G.B. Dijksterhuis, EPS- 2014-304-MKT, http://repub.eur.nl/pub/50387 Houwelingen, G.G. van, Something To Rely On, Promotors: Prof. D. de Cremer & Prof. M.H. van Dijke, EPS-2014-335-ORG, http://repub.eur.nl/pub/77320 Hurk, E. van der, Passengers, Information, and Disruptions, Promotors: Prof. L.G. Kroon & Prof. P.H.M. Vervest, EPS-2015-345-LIS, http://repub.eur.nl/pub/78275 Hytonen, K.A., Context Effects in Valuation, Judgment and Choice: A Neuroscientific Approach, Promotor: Prof. A. Smidts, EPS-2011-252-MKT, http://repub.eur.nl/pub/30668 Iseger, P. den, Fourier and Laplace Transform Inversion with Applications in Finance, Promotor: Prof. R. Dekker, EPS-2014-322-LIS, http://repub.eur.nl/pub/76954 Jaarsveld, W.L. van, Maintenance Centered Service Parts Inventory Control, Promotor: Prof. R. Dekker, EPS-2013-288-LIS, http://repub.eur.nl/pub/39933 Jalil, M.N., Customer Information Driven After Sales Service Management: Lessons from Spare Parts Logistics, Promotor: Prof. L.G. Kroon, EPS-2011-222-LIS, http://repub.eur.nl/pub/22156 Kappe, E.R., The Effectiveness of Pharmaceutical Marketing, Promotor: Prof. S. Stremersch, EPS-2011-239-MKT, http://repub.eur.nl/pub/23610 Karreman, B., Financial Services and Emerging Markets, Promotors: Prof. G.A. van der Knaap & Prof. H.P.G. Pennings, EPS-2011-223-ORG, http://repub.eur.nl/pub/22280 Khanagha, S., Dynamic Capabilities for Managing Emerging Technologies, Promotor: Prof. H.W. Volberda, EPS-2014-339-S&E, http://repub.eur.nl/pub/77319

Kil, J., Acquisitions Through a Behavioral and Real Options Lens, Promotor: Prof. H.T.J. Smit, EPS-2013-298-F&A, http://repub.eur.nl/pub/50142 Klooster, E. van ’t, Travel to Learn: the Influence of Cultural Distance on Competence Development in Educational Travel, Promotors: Prof. F.M. Go & Prof. P.J. van Baalen, EPS-2014-312-MKT, http://repub.eur.nl/pub/51462 Koendjbiharie, S.R., The Information-Based View on Business Network Performance: Revealing the Performance of Interorganizational Networks, Promotors: Prof. H.W.G.M. van Heck & Prof. P.H.M. Vervest, EPS-2014-315-LIS, http://repub.eur.nl/pub/51751 Koning, M., The Financial Reporting Environment: The Role of the Media, Regulators and Auditors, Promotors: Prof. G.M.H. Mertens & Prof. P.G.J. Roosenboom, EPS-2014-330-F&A, http://repub.eur.nl/pub/77154 Konter, D.J., Crossing Borders with HRM: An Inquiry of the Influence of Contextual Differences in the Adoption and Effectiveness of HRM, Promotors: Prof. J. Paauwe & Dr L.H. Hoeksema, EPS-2014-305-ORG, http://repub.eur.nl/pub/50388 Korkmaz, E., Bridging Models and Business: Understanding Heterogeneity in Hidden Drivers of Customer Purchase Behavior, Promotors: Prof. S.L. van de Velde & Prof. D. Fok, EPS-2014-316-LIS, http://repub.eur.nl/pub/76008 Kroezen, J.J., The Renewal of Mature Industries: An Examination of the Revival of the Dutch Beer Brewing Industry, Promotor: Prof. P.P.M.A.R. Heugens, EPS-2014- 333-S&E, http://repub.eur.nl/pub/77042 Kysucky, V., Access to Finance in a Cros-Country Context, Promotor: Prof.dr. L. Norden, EPS-2015-350-F&A, http://repub.eur.nl/pub/78225 Lam, K.Y., Reliability and Rankings, Promotor: Prof. Ph.H.B.F. Franses, EPS- 2011-230-MKT, http://repub.eur.nl/pub/22977 Lander, M.W., Profits or Professionalism? On Designing Professional Service Firms, Promotors: Prof. J. van Oosterhout & Prof. P.P.M.A.R. Heugens, EPS-2012-253- ORG, http://repub.eur.nl/pub/30682 Langhe, B. de, Contingencies: Learning Numerical and Emotional Associations in an Uncertain World, Promotors: Prof. B. Wierenga & Prof. S.M.J. van Osselaer, EPS-2011-236-MKT, http://repub.eur.nl/pub/23504 Lee, C.I.S.G, Big Data in Management Research: Exploring New Avenues, Promotors: Prof. S.J. Magala & Dr W.A. Felps, EPS-2016-365-ORG, http://repub.eur.nl/pub/79818

Legault-Tremblay, P.O., Corporate Governance During Market Transition: Heterogeneous responses to Institution Tensions in China, Promotor: Prof. B. Krug, EPS-2015-362-ORG, http://repub.eur.nl/pub/78649 Lenoir, A.S. Are You Talking to Me? Addressing Consumers in a Globalised World, Promotors: Prof. S. Puntoni & Prof. S.M.J. van Osselaer, EPS-2015-363-MKT, http://hdl.handle.net/1765/79036 Leunissen, J.M., All Apologies: On the Willingness of Perpetrators to Apologize, Promotors: Prof. D. de Cremer & Dr. M. van Dijke, EPS-2014-301-ORG, http://repub.eur.nl/pub/50318 Li, D., Supply Chain Contracting for After-sales Service and Product Support, Promotor: Prof. M.B.M. de Koster, EPS-2015-347-LIS, http://repub.eur.nl/pub/78526 Li, Z., Irrationality: What, Why and How, Promotor(s): Prof. H. Bleichrodt, Prof. P.P. Wakker, & Prof. K.I.M. Rohde, EPS-2014-338-MKT, http://repub.eur.nl/pub/77205 Liang, Q.X., Governance, CEO Identity, and Quality Provision of Farmer Cooperatives, Promotor: Prof. G.W.J. Hendrikse, EPS-2013-281-ORG, http://repub.eur.nl/pub/39253 Liket, K., Why ’Doing Good’ is not Good Enough: Essays on Social Impact Measurement, Promotors: Prof. H.R. Commandeur & Dr K.E.H. Maas, EPS-2014-307-STR, http://repub.eur.nl/pub/51130 Loos, M.J.H.M. van der, Molecular Genetics and Hormones: New Frontiers in Entrepreneurship Research, Promotors: Prof. A.R. Thurik, Prof. P.J.F. Groenen, & Prof. A. Hofman, EPS-2013-287-S&E, http://repub.eur.nl/pub/40081 Lovric, M., Behavioral Finance and Agent-Based Artificial Markets, Promotors: Prof. J. Spronk & Prof. U. Kaymak, EPS-2011-229-F&A, http://repub.eur.nl/pub/22814 Lu, Y., Data-Driven Decision Making in Auction Markets, Promotors: Prof. H.W.G.M. van Heck & Prof. W. Ketter, EPS-2014-314-LIS, http://repub.eur.nl/pub/51543 Ma, Y., The Use of Advanced Transportation Monitoring Data for Official Statistics, Promotors: Prof. L.G. Kroon and Dr Jan van Dalen, EPS-2016-391-LIS, hdl.handle.net/1765/80174 Manders, B., Implementation and Impact of ISO 9001, Promotor: Prof. K. Blind, EPS-2014-337-LIS, http://repub.eur.nl/pub/77412 Markwat, T.D., Extreme Dependence in Asset Markets Around the Globe, Promotor: Prof. D.J.C. van Dijk, EPS-2011-227-F&A, http://repub.eur.nl/pub/22744 Mees, H., Changing Fortunes: How China’s Boom Caused the Financial Crisis, Promotor: Prof. Ph.H.B.F. Franses, EPS-2012-266-MKT, http://repub.eur.nl/pub/34930

Mell, J.N., Connecting Minds: On The Role of Metaknowledge in Knowledge Coordination, Promotor: Prof. D.L. van Knippenberg, EPS-2015-359-ORG, http://hdl.handle.net/1765/78951 Meuer, J., Configurations of Inter-firm Relations in Management Innovation: A Study in China’s Biopharmaceutical Industry, Promotor: Prof. B. Krug, EPS-2011-228-ORG, http://repub.eur.nl/pub/22745 Micheli, M.R., Business Model Innovation: A Journey across Managers’ Attention and Inter-Organizational Networks, Promotor: Prof. J.J.P. Jansen, EPS-2015-344-S&E, http://repub.eur.nl/pub/78241 Mihalache, O.R., Stimulating Firm Innovativeness: Probing the Interrelations between Managerial and Organizational Determinants, Promotors: Prof. J.J.P. Jansen, Prof. F.A.J. van den Bosch, & Prof. H.W. Volberda, EPS-2012-260-S&E, http://repub.eur.nl/pub/32343 Milea, V., News Analytics for Financial Decision Support, Promotor: Prof. U. Kaymak, EPS-2013-275-LIS, http://repub.eur.nl/pub/38673 Moniz, A, Textual Analysis of Intangible Information, Promotor(s): Prof C.B.M. van Riel, Prof. F.M.G de Jong & Dr G.A.J.M. Berens, EPS-2016-393-ORG, http://repub.eur.nl/pub/93001 Mulder, J. Network design and robust scheduling in liner shipping, Promotors: Prof. R. Dekker & Dr W.L. van Jaarsveld, Eps-2016-384-LIS, http://repub.eur.nl/pub/80258 Naumovska, I., Socially Situated Financial Markets: A Neo-Behavioral Perspective on Firms, Investors and Practices, Promotors: Prof. P.P.M.A.R. Heugens & Prof. A. de Jong, EPS-2014-319-S&E, http://repub.eur.nl/pub/76084 Neerijnen, P., The Adaptive Organization: the socio-cognitive antecedents of ambidexterity and individual exploration, Promotors: Prof. J.J.P. Jansen, P.P.M.A.R. Heugens & Dr T.J.M. Mom, EPS-2016-358-S&E, http://repub.eur.nl/pub/93274 Nielsen, L.K., Rolling Stock Rescheduling in Passenger Railways: Applications in short term planning and in disruption management, Promotor: Prof. L.G. Kroon, EPS- 2011-224-LIS, http://repub.eur.nl/pub/22444 Nuijten, A.L.P., Deaf Effect for Risk Warnings: A Causal Examination applied to Information Systems Projects, Promotors: Prof. G.J. van der Pijl, Prof. H.R. Commandeur & Prof. M. Keil, EPS-2012-263-S&E, http://repub.eur.nl/pub/34928 Oord, J.A. van, Essays on Momentum Strategies in Finance, Promotor: Prof. H.K. van Dijk, EPS-2016-380-F&A, hdl.handle.net/1765/80036
Osadchiy, S.E., The Dynamics of Formal Organization: Essays on bureaucracy and formal rules, Promotor: Prof. P.P.M.A.R. Heugens, EPS-2011-231-ORG, http://repub.eur.nl/pub/23250 Ozdemir, M.N., Project-level Governance, Monetary Incentives, and Performance in Strategic R&D Alliances, Promotor: Prof. J.C.M. van den Ende, EPS-2011-235-LIS, http://repub.eur.nl/pub/23550 Peers, Y., Econometric Advances in Diffusion Models, Promotor: Prof. Ph.H.B.F. Franses, EPS-2011-251-MKT, http://repub.eur.nl/pub/30586 Peters, M., Machine Learning Algorithms for Smart Electricity Markets, Promotor: Prof. W. Ketter, EPS-2014-332-LIS, http://repub.eur.nl/pub/77413 Porck, J., No Team is an Island: An Integrative View of Strategic Consensus between Groups, Promotors: Prof. P.J.F. Groenen & Prof. D.L. van Knippenberg, EPS- 2013-299-ORG, http://repub.eur.nl/pub/50141 Porras Prado, M., The Long and Short Side of Real Estate, Real Estate Stocks, and Equity, Promotor: Prof. M.J.C.M. Verbeek, EPS-2012-254-F&A, http://repub.eur.nl/pub/30848 Poruthiyil, P.V., Steering Through: How organizations negotiate permanent uncertainty and unresolvable choices, Promotors: Prof. P.P.M.A.R. Heugens & Prof. S.J. Magala, EPS-2011-245-ORG, http://repub.eur.nl/pub/26392 Pourakbar, M., End-of-Life Inventory Decisions of Service Parts, Promotor: Prof. R. Dekker, EPS-2011-249-LIS, http://repub.eur.nl/pub/30584 Pronker, E.S., Innovation Paradox in Vaccine Target Selection, Promotors: Prof. H.J.H.M. Claassen & Prof. H.R. Commandeur, EPS-2013-282-S&E, http://repub.eur.nl/pub/39654 Protzner, S. Mind the gap between demand and supply: A behavioral perspective on demand forecasting, Promotors: Prof. S.L. van de Velde & Dr L. Rook, EPS-2015-364-LIS, http://repub.eur.nl/pub/79355 Pruijssers, J.K., An Organizational Perspective on Auditor Conduct, Promotors: Prof. J. van Oosterhout & Prof. P.P.M.A.R. Heugens, EPS-2015-342-S&E, http://repub.eur.nl/pub/78192 Retel Helmrich, M.J., Green Lot-Sizing, Promotor: Prof. A.P.M. Wagelmans, EPS- 2013-291-LIS, http://repub.eur.nl/pub/41330 Rietdijk, W.J.R. The Use of Cognitive Factors for Explaining Entrepreneurship, Promotors: Prof. A.R. Thurik & Prof. I.H.A. Franken, EPS-2015-356-S&E, http://repub.eur.nl/pub/79817

Rietveld, N., Essays on the Intersection of Economics and Biology, Promotors: Prof. A.R. Thurik, Prof. Ph.D. Koellinger, Prof. P.J.F. Groenen, & Prof. A. Hofman, EPS-2014-320-S&E, http://repub.eur.nl/pub/76907 Rijsenbilt, J.A., CEO Narcissism: Measurement and Impact, Promotors: Prof. A.G.Z. Kemna & Prof. H.R. Commandeur, EPS-2011-238-STR, http://repub.eur.nl/pub/23554 Rösch, D. Market Efficiency and Liquidity, Promotor: Prof. M.A. van Dijk, EPS-2015-353-F&A, http://hdl.handle.net/1765/79121 Roza, L., Employee Engagement In Corporate Social Responsibility: A collection of essays, Promotor: L.C.P.M. Meijs, EPS-2016-396-ORG, http://repub.eur.nl/pub/93254 Roza-van Vuren, M.W., The Relationship between Offshoring Strategies and Firm Performance: Impact of innovation, absorptive capacity and firm size, Promotors: Prof. H.W. Volberda & Prof. F.A.J. van den Bosch, EPS-2011-214-STR, http://repub.eur.nl/pub/22155 Rubbaniy, G., Investment Behaviour of Institutional Investors, Promotor: Prof. W.F.C. Verschoor, EPS-2013-284-F&A, http://repub.eur.nl/pub/40068 Schoonees, P. Methods for Modelling Response Styles, Promotor: Prof.dr P.J.F. Groenen, EPS-2015-348-MKT, http://repub.eur.nl/pub/79327 Schouten, M.E., The Ups and Downs of Hierarchy: the causes and consequences of hierarchy struggles and positional loss, Promotors; Prof. D.L. van Knippenberg & Dr L.L. Greer, EPS-2016-386-ORG, http://repub.eur.nl/pub/80059 Shahzad, K., Credit Rating Agencies, Financial Regulations and the Capital Markets, Promotor: Prof. G.M.H. Mertens, EPS-2013-283-F&A, http://repub.eur.nl/pub/39655 Sousa, M.J.C. de, Servant Leadership to the Test: New Perspectives and Insights, Promotors: Prof. D.L. van Knippenberg & Dr D. van Dierendonck, EPS-2014-313-ORG, http://repub.eur.nl/pub/51537 Spliet, R., Vehicle Routing with Uncertain Demand, Promotor: Prof. R. Dekker, EPS-2013-293-LIS, http://repub.eur.nl/pub/41513 Staadt, J.L., Leading Public Housing Organisation in a Problematic Situation: A Critical Soft Systems Methodology Approach, Promotor: Prof. S.J. Magala, EPS-2014-308- ORG, http://repub.eur.nl/pub/50712 Stallen, M., Social Context Effects on Decision-Making: A Neurobiological Approach, Promotor: Prof. A. Smidts, EPS-2013-285-MKT, http://repub.eur.nl/pub/39931
Tarakci, M., Behavioral Strategy: Strategic Consensus, Power and Networks, Promotor: Prof. D.L. van Knippenberg & Prof. P.J.F. Groenen, EPS-2013-280-ORG, http://repub.eur.nl/pub/39130 Teixeira de Vasconcelos, M., Agency Costs, Firm Value, and Corporate Investment, Promotor: Prof. P.G.J. Roosenboom, EPS-2012-265-F&A, http://repub.eur.nl/pub/37265 Troster, C., Nationality Heterogeneity and Interpersonal Relationships at Work, Promotor: Prof. D.L. van Knippenberg, EPS-2011-233-ORG, http://repub.eur.nl/pub/23298 Tsekouras, D., No Pain No Gain: The Beneficial Role of Consumer Effort in Decision- Making, Promotor: Prof. B.G.C. Dellaert, EPS-2012-268-MKT, http://repub.eur.nl/pub/37542 Tuijl, E. van, Upgrading across Organisational and Geographical Configurations, Promotor: Prof. L. van den Berg, EPS-2015-349-S&E, http://repub.eur.nl/pub/78224 Tuncdogan, A., Decision Making and Behavioral Strategy: The Role of Regulatory Focus in Corporate Innovation Processes, Promotors: Prof. F.A.J. van den Bosch, Prof. H.W. Volberda, & Prof. T.J.M. Mom, EPS-2014-334-S&E, http://repub.eur.nl/pub/76978 Uijl, S. den, The Emergence of De-facto Standards, Promotor: Prof. K. Blind, EPS-2014-328-LIS, http://repub.eur.nl/pub/77382 Vagias, D., Liquidity, Investors and International Capital Markets, Promotor: Prof. M.A. van Dijk, EPS-2013-294-F&A, http://repub.eur.nl/pub/41511 Valogianni, K. Sustainable Electric Vehicle Management using Coordinated Machine Learning, Promotors: Prof. H.W.G.M. van Heck & Prof. W. Ketter, Eps-2016-387-LIS, http://repub.eur.nl/pub/93018 Veelenturf, L.P., Disruption Management in Passenger Railways: Models for Timetable, Rolling Stock and Crew Rescheduling, Promotor: Prof. L.G. Kroon, EPS-2014-327- LIS, http://repub.eur.nl/pub/77155 Venus, M., Demystifying Visionary Leadership: In search of the essence of effective vision communication, Promotor: Prof. D.L. van Knippenberg, EPS-2013-289- ORG, http://repub.eur.nl/pub/40079 Vermeer, W., Propagation in Networks:The impact of information processing at the actor level on system-wide propagation dynamics, Promotor: Prof. P.H.M.Vervest, EPS-2015-373-LIS, http://repub.eur.nl/pub/79325 Versluis, I., Prevention of the Portion Size Effect, Promotors: Prof. Ph.H.B.F. Franses & Dr E.K. Papies, EPS-2016-382-MKT, http://repub.eur.nl/pub/79880
Vishwanathan, P., Governing for Stakeholders: How Organizations May Create or Destroy Value for their Stakeholders, Promotors: Prof. J. van Oosterhout & Prof. L.C.P. M. Meijs, EPS-2016-377-ORG, http://repub.eur.nl/pub/93016 Visser, V.A., Leader Affect and Leadership Effectiveness: How leader affective displays influence follower outcomes, Promotor: Prof. D.L. van Knippenberg, EPS-2013- 286-ORG, http://repub.eur.nl/pub/40076 Vlam, A.J., Customer First? The Relationship between Advisors and Consumers of Financial Products, Promotor: Prof. Ph.H.B.F. Franses, EPS-2011-250-MKT, http://repub.eur.nl/pub/30585 Vries, J. de, Behavioral Operations in Logistics, Promotors: Prof. M.B.M de Koster & Prof. D.A. Stam, EPS-2015-374-LIS, http://repub.eur.nl/pub/79705 Wagenaar, J.C., Practice Oriented Algorithmic Disruption Management in Passenger Railways, Prof. L.G. Kroon & Prof. A.P.M. Wagelmans, EPS-2016-390-LIS, http://repub.eur.nl/pub/93177 Waltman, L., Computational and Game-Theoretic Approaches for Modeling Bounded Rationality, Promotors: Prof. R. Dekker & Prof. U. Kaymak, EPS-2011-248- LIS, http://repub.eur.nl/pub/26564 Wang, P., Innovations, status, and networks, Promotors: Prof. J.J.P. Jansen & Dr V.J.A. van de Vrande, EPS-2016-381-S&E, http://repub.eur.nl/pub/93176 Wang, T., Essays in Banking and Corporate Finance, Promotors: Prof. L. Norden & Prof. P.G.J. Roosenboom, EPS-2015-352-F&A, http://repub.eur.nl/pub/78301 Wang, Y., Information Content of Mutual Fund Portfolio Disclosure, Promotor: Prof. M.J.C.M. Verbeek, EPS-2011-242-F&A, http://repub.eur.nl/pub/26066 Wang, Y., Corporate Reputation Management: Reaching Out to Financial Stakeholders, Promotor: Prof. C.B.M. van Riel, EPS-2013-271-ORG, http://repub.eur.nl/pub/38675 Weenen, T.C., On the Origin and Development of the Medical Nutrition Industry, Promotors: Prof. H.R. Commandeur & Prof. H.J.H.M. Claassen, EPS-2014-309-S&E, http://repub.eur.nl/pub/51134 Wolfswinkel, M., Corporate Governance, Firm Risk and Shareholder Value, Promotor: Prof. A. de Jong, EPS-2013-277-F&A, http://repub.eur.nl/pub/39127 Yang, S., Information Aggregation Efficiency of Prediction Markets, Promotor: Prof. H.W.G.M. van Heck, EPS-2014-323-LIS, http://repub.eur.nl/pub/77184

Yuferova, D. Price Discovery, Liquidity Provision, and Low-Latency Trading, Promotors: Prof. M.A. van Dijk & Dr D.G.J. Bongaerts, EPS-2016-379-F&A, http://repub.eur.nl/pub/93017 Zaerpour, N., Efficient Management of Compact Storage Systems, Promotor: Prof. M.B.M. de Koster, EPS-2013-276-LIS, http://repub.eur.nl/pub/38766 Zhang, D., Essays in Executive Compensation, Promotor: Prof. I. Dittmann, EPS- 2012-261-F&A, http://repub.eur.nl/pub/32344 Zwan, P.W. van der, The Entrepreneurial Process: An International Analysis of Entry and Exit, Promotors: Prof. A.R. Thurik & Prof. P.J.F. Groenen, EPS-2011-234-ORG, http://repub.eur.nl/pub/23422

Erasmus University Rotterdam (EUR)Erasmus Research Institute of ManagementMandeville (T) Building
Burgemeester Oudlaan 50
3062 PA Rotterdam, The Netherlands
P.O. Box 1738
3000 DR Rotterdam, The Netherlands
T +31 10 408 1182
W www.erim.eur.nl
The purpose of this thesis is the analysis and design of intermodal port-hinterland container transport
networks. In this line, we go through and discuss relevant academic literature and position our work
while identifying gaps that we try to address. We explore the port - hinterland intermodal transport
process, by analyzing container transport data given by a major container terminal (ECT) and two major
intermodal carriers (EGS of ECT and Brabant Intermodal) in the Netherlands. Our analysis demonstrates
the diff erent transport needs of shippers in both time and modality choices. Additionally we investigate
the optimal network design confi gurations of two major intermodal carriers in the Netherlands, by
considering the underlying tradeoff s and propose optimization models in this direction. In combined
port-hinterland transport, the use of diff erent modalities, the fl eet selection, the capacity and frequency
setting of services, the routing of assets in a network can signifi cantly aff ect the overall performance of
the transportation network in terms of costs, service times, modal split, sustainability, etc. In the fi rst study,
we focus on container terminal operating companies that have extended their role from node operators
to that of multimodal transport network operators. These network operators face the following three
interrelated decisions: (1) determine which inland terminals act as extended gates of the seaport terminal,
(2) determine capacities of the corridors, i.e. size of the transport modes and frequency of service,
and (3) set the prices for the transport services on the network. We proposed a bi-level programming
model to jointly design and price extended gate network services for profi t maximization. The second
study, focuses on a case of a possible alliance of dryports closely located in the hinterland that share
capacity to effi ciently transport containers from and to a seaport area that consists of several container
terminals. The tactical design of scheduled barge transport services involves decisions regarding both
the fl eet composition and its routing through the inland waterway network. Integrating these decisions
would make the resulting network more competitive in satisfying expected demand and service time
requirements set by the shippers.
The Erasmus Research Institute of Management (ERIM) is the Research School (Onderzoekschool) in
the fi eld of management of the Erasmus University Rotterdam. The founding participants of ERIM are the
Rotterdam School of Management (RSM), and the Erasmus School of Economics (ESE). ERIM was founded
in 1999 and is offi cially accredited by the Royal Netherlands Academy of Arts and Sciences (KNAW). The
research undertaken by ERIM is focused on the management of the fi rm in its environment, its intra- and
interfi rm relations, and its business processes in their interdependent connections.
The objective of ERIM is to carry out fi rst rate research in management, and to off er an advanced doctoral
programme in Research in Management. Within ERIM, over three hundred senior researchers and PhD
candidates are active in the diff erent research programmes. From a variety of academic backgrounds and
expertises, the ERIM community is united in striving for excellence and working at the forefront of creating
new business knowledge.
ERIM PhD Series Research in Management
Top Related