


Languages
Pages
Legal


PRODUCT & PACKAGE TESTING VIBRATION & SHOCK
Dec 2015
Herb Schueneman Chairman, WESTPAK, Inc.
PRODUCT & PACKAGE VIBRATION TESTING
Herb Schueneman Founder, Chairman
WESTPAK, INC. March 2016
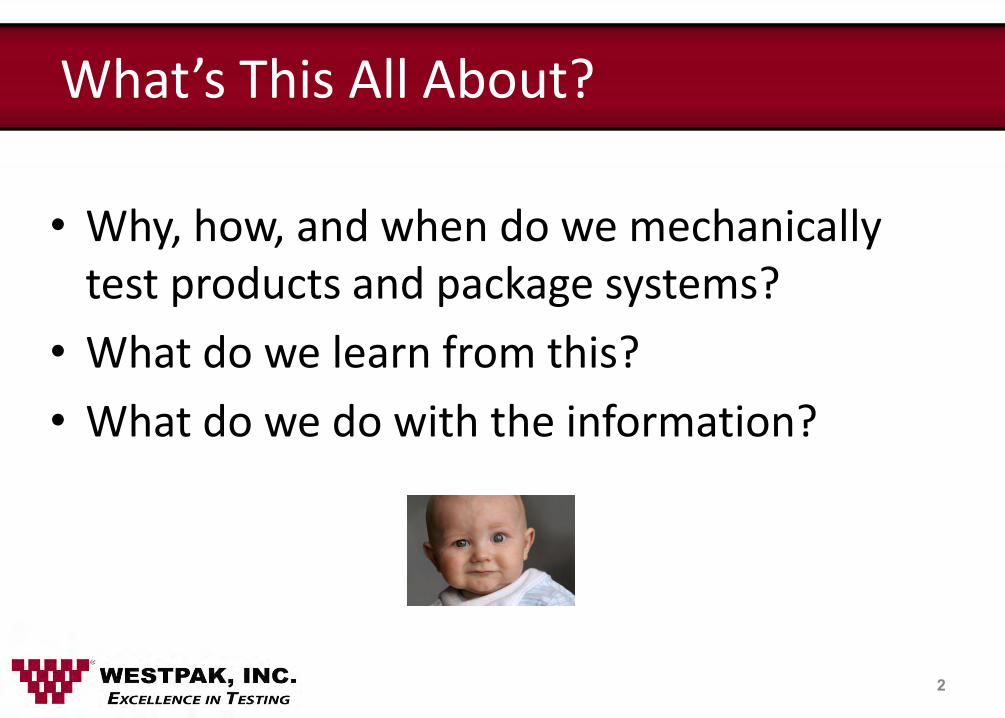
What’s This All About?
2
• Why, how, and when do we mechanically test products and package systems?
• What do we learn from this?
• What do we do with the information?

Agenda
• Background, terminology, etc.
• Vibration Dynamics
– Spring/Mass Models; Forces vs. Free Response
– Types of Excitation; Sine, Random, Acoustic, Sources of input
– Resonance, Transmissibility, Damping, Fatigue
– Package Cushioning (springs), A/A plots
– Design for Vibration
3

Dynamics
• The study of mass that is moving in a flexible environment
• “Flexibility” implies springs so the study of dynamics starts with a thorough understanding of “Spring/Mass Systems”
4

5
SDOF Spring/Mass System
MASS

6
AN INPUT APPLIED HERE RESULTS IN “FREE VIBRATION” OF THE MASS
AN INPUT APPLIED HERE RESULTS IN “FORCED VIBRATION” OF THE MASS
SDOF Spring/Mass System
MASS

7
SDOF Spring/Mass System
MASS
Maximum strain energy
Maximum velocity
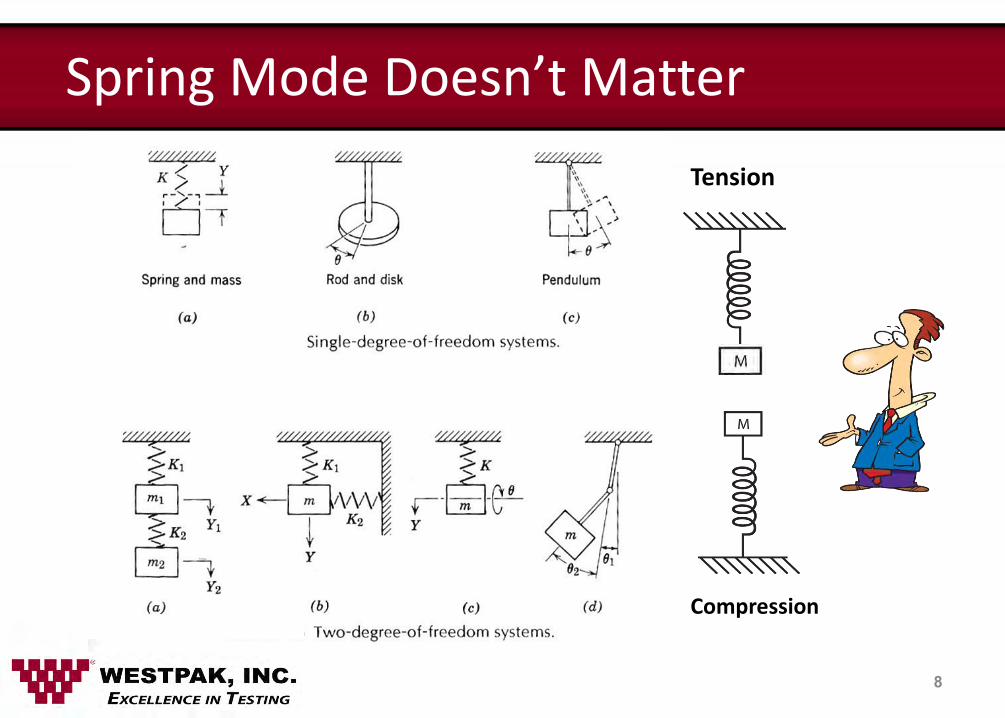
Spring Mode Doesn’t Matter
8
Tension
Compression

Natural Frequency
113.313.3
2
1
M
K
M
Kf
n
9
K
M

Natural or Resonant Frequency
10
As earlier noted, excitation of the mass results in motion we call free vibration or “Natural Frequency”, fn.
Excitation of the base results in “forced vibration” of the mass. When the forcing frequency = fn, the mass response is max and is said to be in resonance.

SDOF vs. MDOF “Normal” products are pretty complex. A multiple degree of freedom (MDOF) model is more appropriate however much more complex and difficult to analyze.
11

Spring Types
12
Almost all products or product/package systems can be analyzed and modeled as complex spring/mass systems. But maybe not “Linear Springs”…..
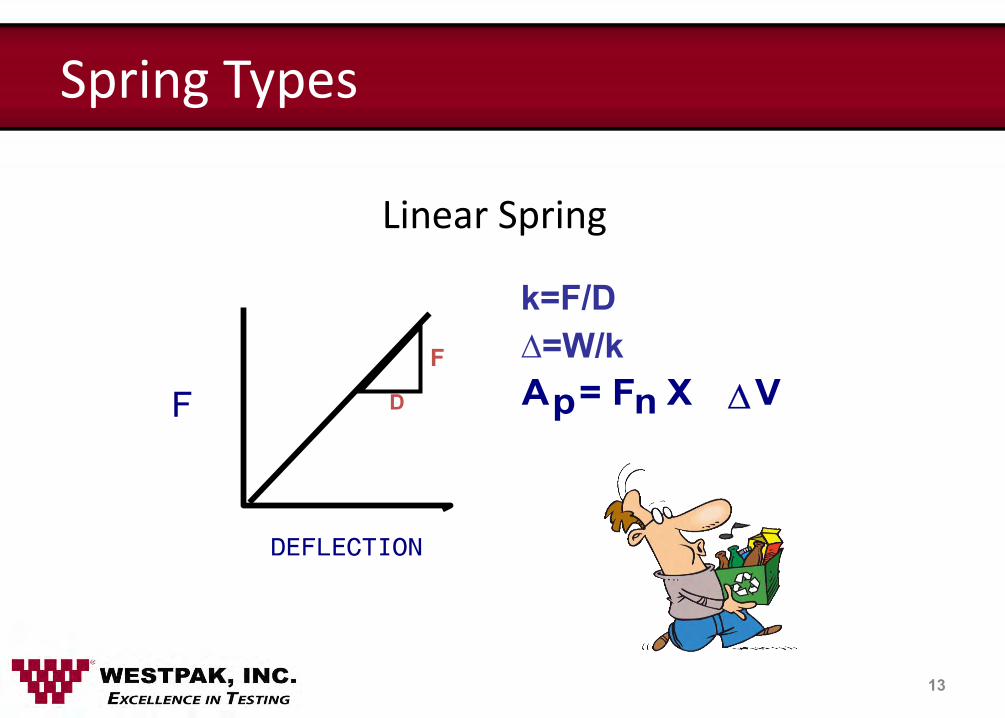
Linear Spring
13
A = F X V p n D
F
k=F/D ∆=W/k
Spring Types

Non-Linear / Hardening Spring
14
dd
k
2kd
tan (def)
2d SPRING FORCE =
Spring Types
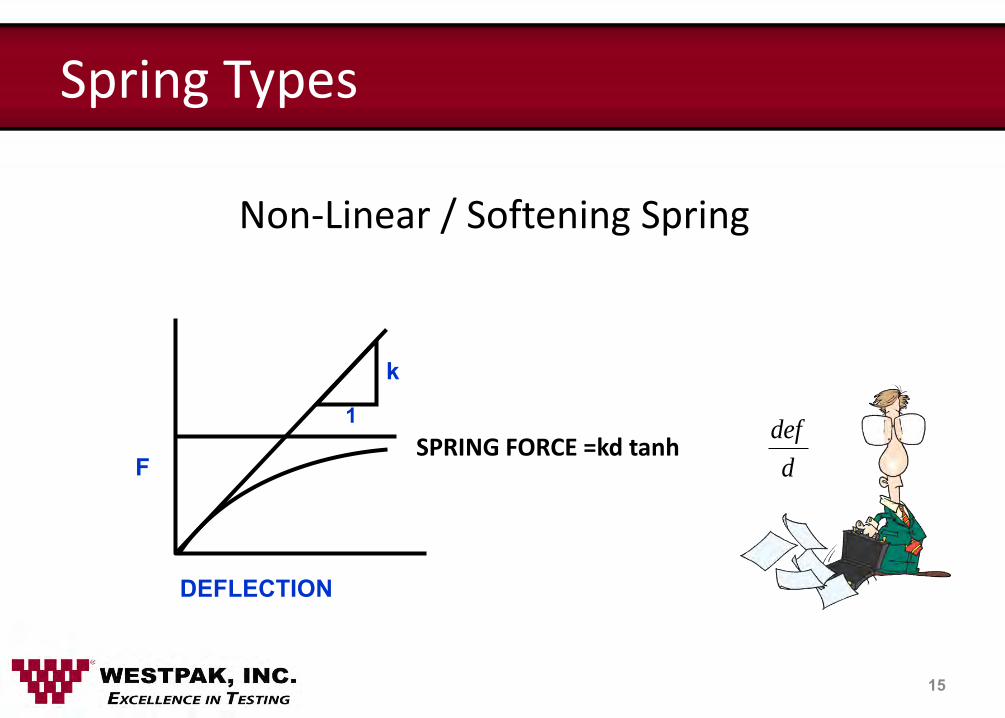
Non-Linear / Softening Spring
15
DEFLECTION
F
1
k
SPRING FORCE =kd tanh d
def
Spring Types

• SDOF models assume linear springs
• Most flexibility in systems is non-linear
• However, most systems can be analyzed in a “near linear” portion of their deflection range so that’s why we use the linear model
16
Spring Types
(Printed Circuit Boards)

Coupling
M
A B
F1
F2
F 3
17
Coupled vs. Uncoupled Motion
• The mass is a homogenous rigid block with center of gravity (cg) at point A.
• The response of the block to F1 is pure vertical motion.
• The response of the block to F2 is pure rotational motion.
• The response of the block to F3 is pure horizontal motion.

18
Coupled vs. Uncoupled Motion
• If (cg) is at point B, F1
produces both vertical and rotational motion of the block. In this case, the motion is said to be coupled.
• With (cg) at point B, F3 produces uncoupled horizontal motion.
Coupling
M
A B
F1
F2
F 3

19
Time for Questions !

Resonance occurs when a component or system is forced at its fn.
20
• Spring/Mass response is amplified at resonance.
• This is where damage, fatigue, etc. is most likely to happen.
Resonance
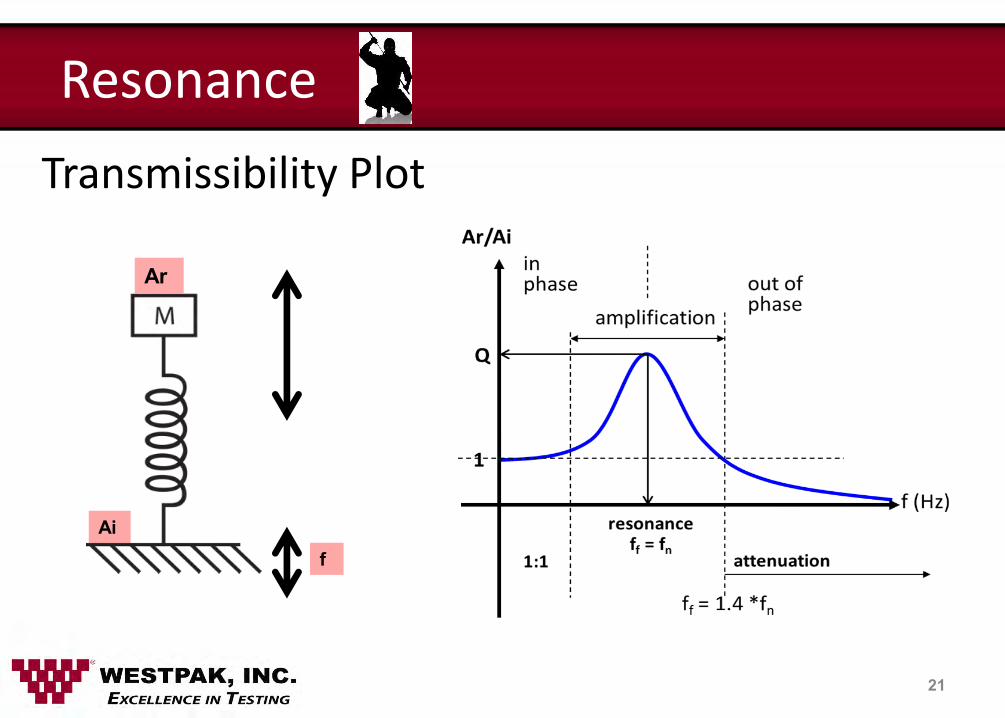
Transmissibility Plot
21
Ar
Ai f
Resonance

22
Vibration Machine
Example
Types of Equipment • Electrodynamic shaker • Hydraulic shaker
• Single or multi-axis • Acoustic (reverberant) chamber
How the Test is Conducted
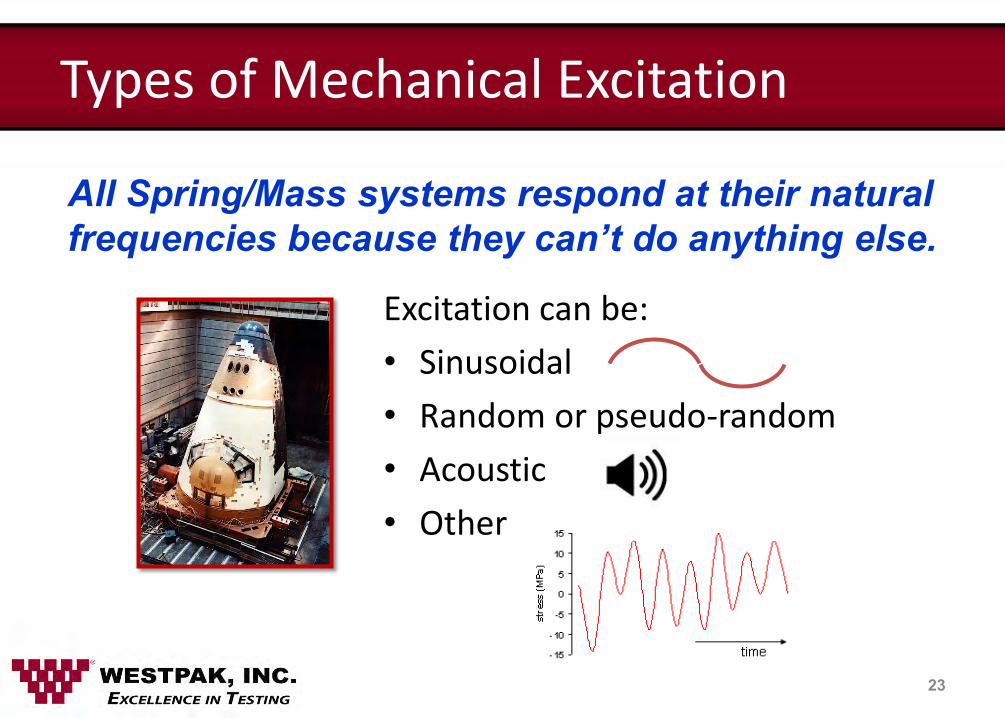
Excitation can be:
• Sinusoidal
• Random or pseudo-random
• Acoustic
• Other
23
Types of Mechanical Excitation
All Spring/Mass systems respond at their natural frequencies because they can’t do anything else.
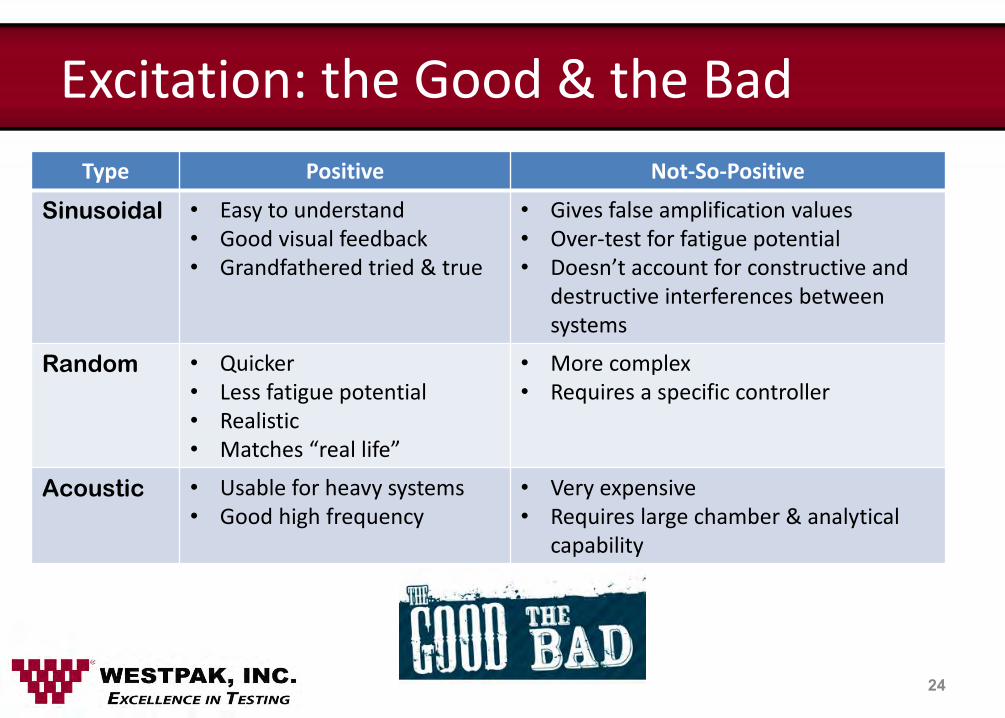
Type Positive Not-So-Positive
Sinusoidal • Easy to understand • Good visual feedback • Grandfathered tried & true
• Gives false amplification values • Over-test for fatigue potential • Doesn’t account for constructive and
destructive interferences between systems
Random • Quicker • Less fatigue potential • Realistic • Matches “real life”
• More complex • Requires a specific controller
Acoustic
• Usable for heavy systems • Good high frequency
• Very expensive • Requires large chamber & analytical
capability
24
Excitation: the Good & the Bad

25
Damping (Rc) is expressed as a ratio of observed damping to “Critical Damping” in a system.
Damping
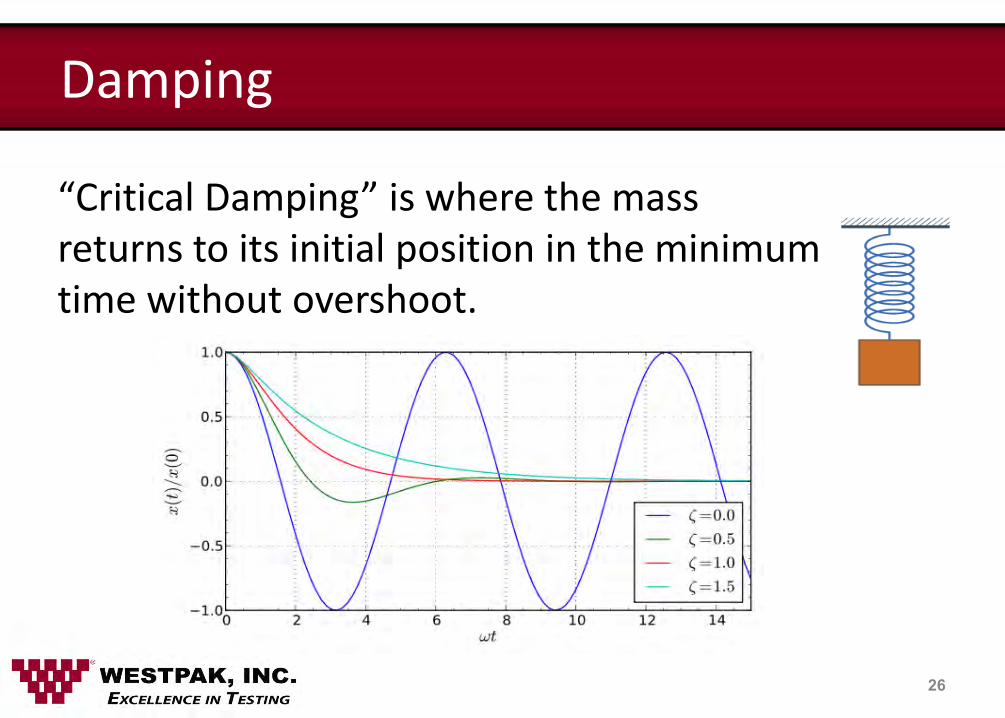
“Critical Damping” is where the mass returns to its initial position in the minimum time without overshoot.
26
Damping

Fatigue is the weakening of a material caused by repeatedly applied loads. It is the progressive and localized structural damage that occurs when a material is subjected to cyclic loading. Resonance is the prime contributor. Non-critical damping is a factor.
27
Mechanical Fatigue
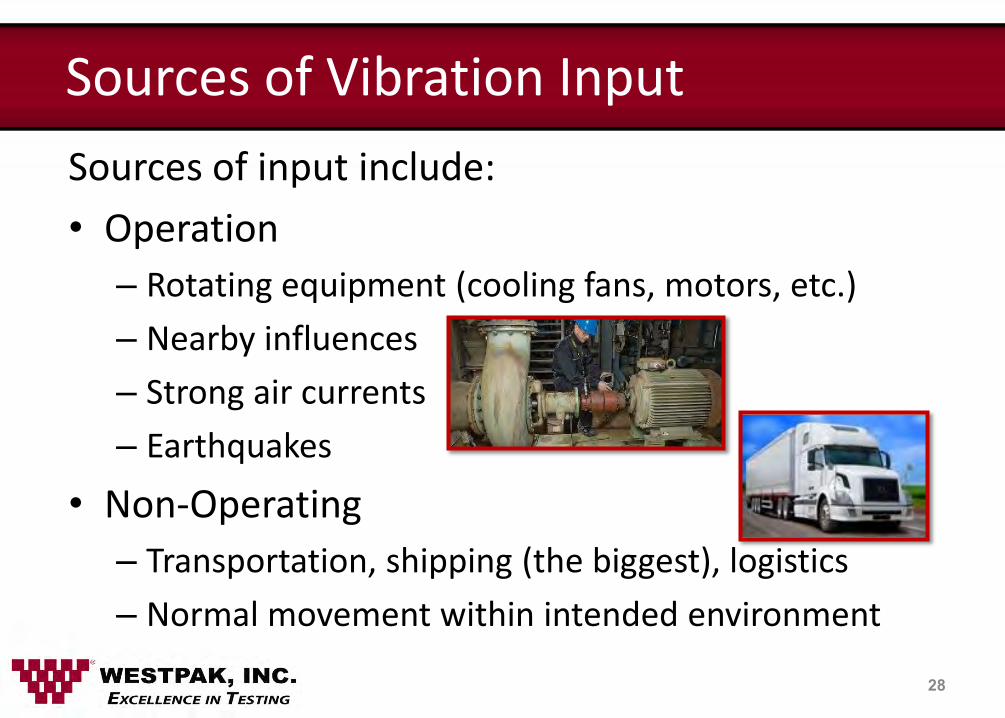
Sources of Vibration Input
Sources of input include:
• Operation
– Rotating equipment (cooling fans, motors, etc.)
– Nearby influences
– Strong air currents
– Earthquakes
• Non-Operating
– Transportation, shipping (the biggest), logistics
– Normal movement within intended environment
28

Typical Test Procedures
• Sine search & dwell is still used (problems..)
• Random dwell is more common
• Margin test (to failure) has gained wide acceptance (HALT)
• Imposed by third party
• Attempt to duplicate the in-use environment (military vehicles & weapons)
• Lots of creativity in test procedures…. (be VERY careful here….)
29

Common Test Specs
• ASTM D3580 (doesn’t say much)
• IEC 60068-2-6, -47 (similar)
• Federal Std 101-C (very dated)
• ISO – various standards
• JIS - Japanese Industrial Standards
• MIL STD 167, 810
• Telcordia GR-63 CORE (Bell System origin; POTS – Plain Old
Telephone System)
30
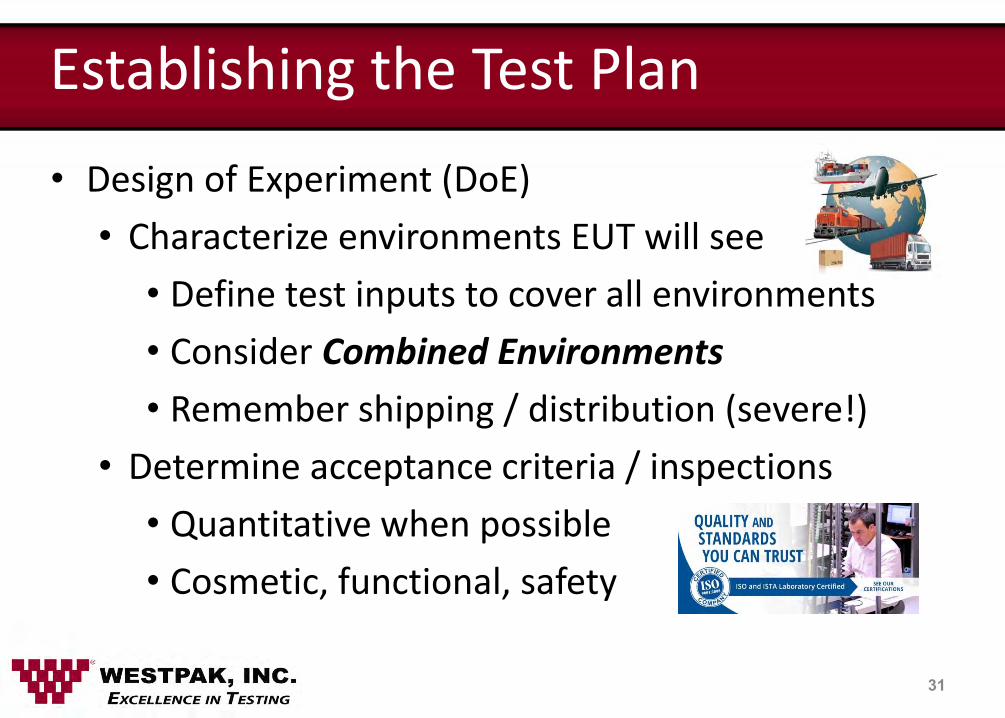
Establishing the Test Plan
• Design of Experiment (DoE)
• Characterize environments EUT will see
• Define test inputs to cover all environments
• Consider Combined Environments
• Remember shipping / distribution (severe!)
• Determine acceptance criteria / inspections
• Quantitative when possible
• Cosmetic, functional, safety
31

Establishing the Test Plan
• Start Small
• First: Test temperature and basic mechanical vibration
• Second: Comprehensive testing (single environment)
• Third: Combined Environment testing (as applicable)
32

Combined Environment Test Inputs
• Every product will see different environments
• Sample EUT: Ruggedized Laptop Computer
• Test inputs discussed
• Temperature + Vibration
• Impact Testing + Temperature Extremes
• Freefall Drop Testing + Temperature Extremes
• Mechanical Cycling + Temperature Extremes
• Temperature + Pressure
• Fluid Submersion + Temperature + Pressure
• Thermal Shock
33
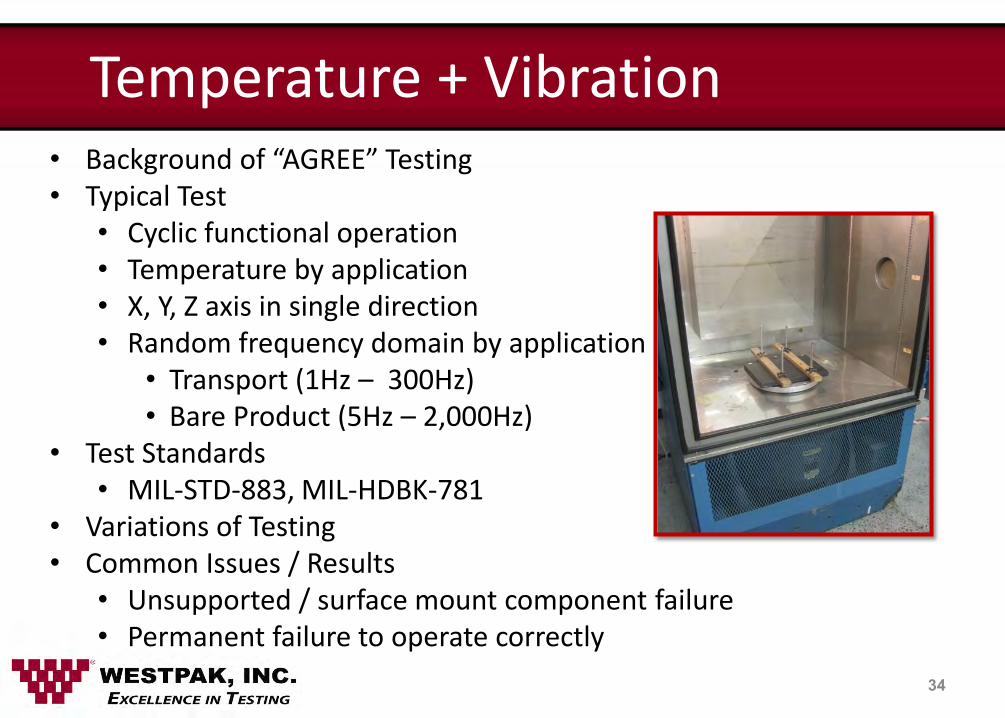
Temperature + Vibration • Background of “AGREE” Testing • Typical Test
• Cyclic functional operation • Temperature by application • X, Y, Z axis in single direction • Random frequency domain by application
• Transport (1Hz – 300Hz) • Bare Product (5Hz – 2,000Hz)
• Test Standards • MIL-STD-883, MIL-HDBK-781
• Variations of Testing • Common Issues / Results
• Unsupported / surface mount component failure • Permanent failure to operate correctly
34

End Result
• Ruggedized product
• Free of latent mechanical defects
• Good to great reliability out of the box
• A prioritized list of improvements to be made
• Verification for meeting a spec requirement
35
How About the Package Cushion?
• One of the functions of a cushion system is to dampen vibration input at those frequencies where the product is sensitive.
• In essence, we need to know the dynamic spring rate of the cushion.
• Now we know the PRODUCT vibration sensitivity.
• Now we need to determine the CUSHION vibration characteristics so that an optimum package system can be designed.
36
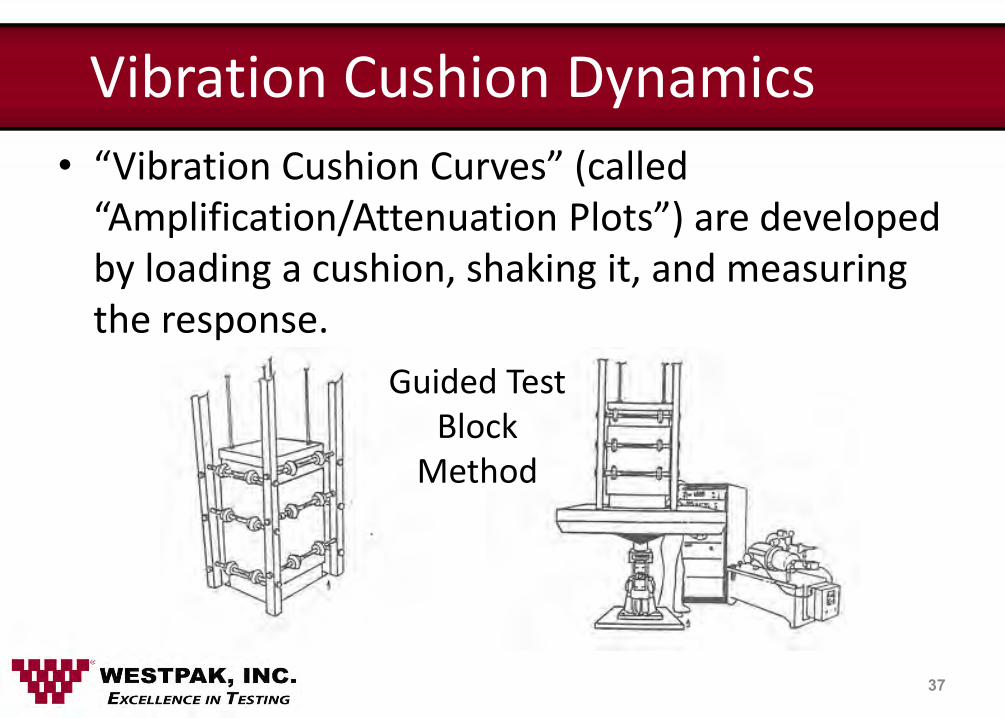
Vibration Cushion Dynamics
• “Vibration Cushion Curves” (called “Amplification/Attenuation Plots”) are developed by loading a cushion, shaking it, and measuring the response.
37
Guided Test Block
Method

38
Alternate Method
Vibration Cushion Dynamics
CUSHION
CUSHION
CUSHION
RESPONSE ACCELEROMETER
INPUT ACCELEROMETER
VIBRATION TABLE VIBRATION TABLE
CUSHION
CUSHION
MASS ADHERED TO FOAM
SO THAT THE “SPRING”
(CUSHION) WORKS IN BOTH
TENSION AND COMPRESSION
MASS ISOLATED BETWEEN
TWO “SPRINGS”
(CUSHIONS) THAT WORK
IN COMPRESSION ONLY
MASS
MASS
T-C MODEL C-C MODEL

39
Vibration Cushion Dynamics
CUSHION TEST SAMPLE
CUSHION TEST SAMPLE
ELECTRODYNAMIC SHAKER
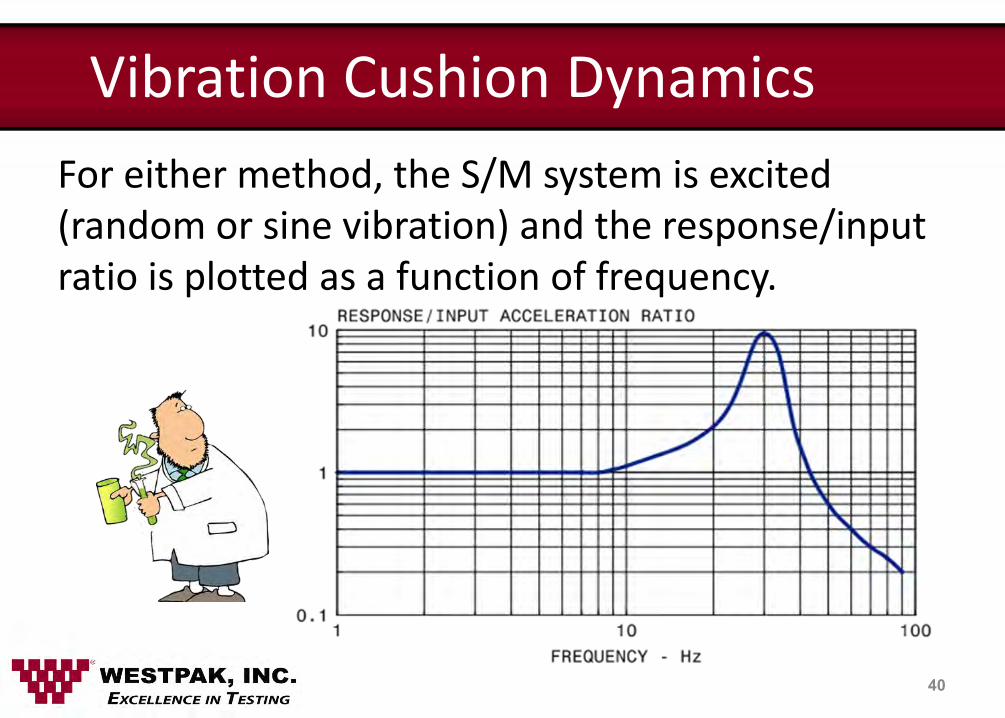
For either method, the S/M system is excited (random or sine vibration) and the response/input ratio is plotted as a function of frequency.
40
Vibration Cushion Dynamics

The important points on this plot are identified here:
41
A
C B
Vibration Cushion Dynamics
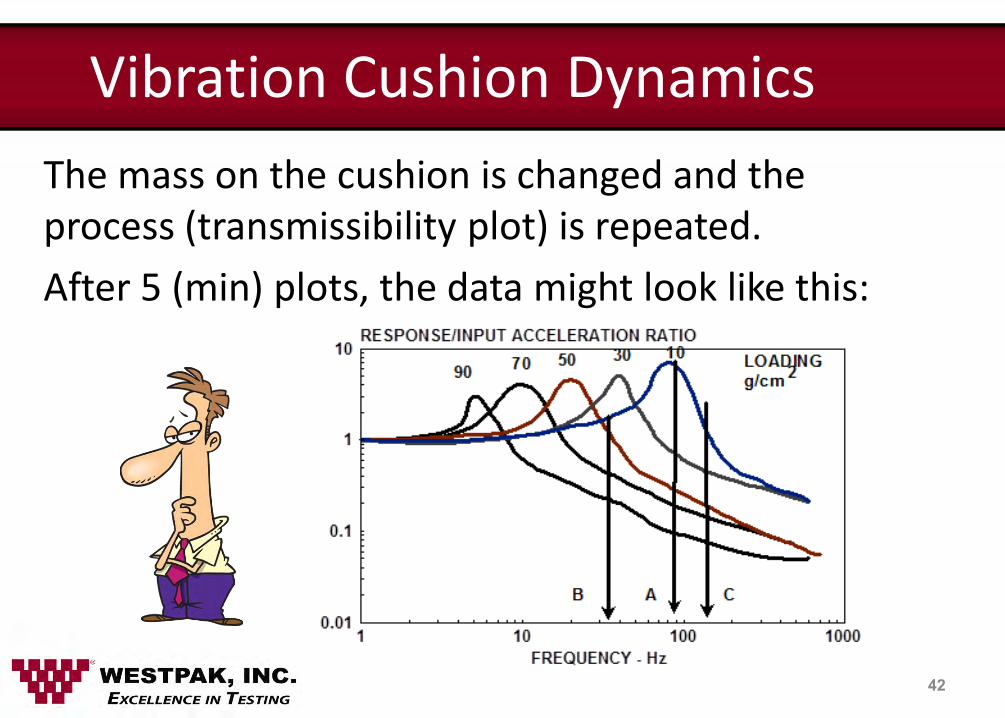
The mass on the cushion is changed and the process (transmissibility plot) is repeated.
After 5 (min) plots, the data might look like this:
42
Vibration Cushion Dynamics

The data is then transferred to the Amplification/Attenuation plot
43
Vibration Cushion Dynamics

Here’s how the data is used:
44
Vibration Cushion Dynamics

45
Time for Questions !
46
About WESTPAK, INC.
Two Locations:
San Jose Laboratory San Diego Laboratory
83 Great Oaks Boulevard 10326 Roselle Street
San Jose, CA 95119 San Diego, CA 92121
408-224-1300 858-623-8100
www.westpak.com
Contact Us

47
THANK YOU !
Please Contact Us with any questions or testing assistance needs. We are here to help you!
Herb Schueneman Founder, Chairman
WESTPAK, INC.
Top Related