


Languages
Pages
Legal

Overview
Descriptive Statistics & Graphical
Presentation of Data
Statistical Inference
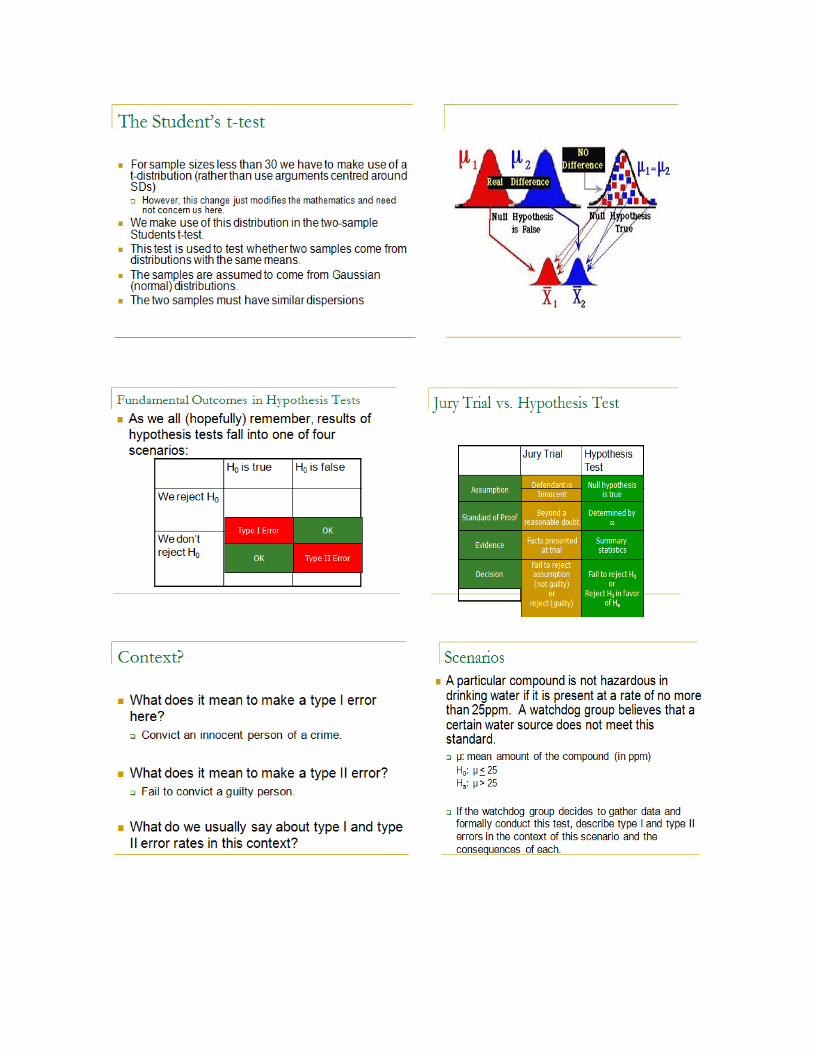
Hypothesis Tests & Confidence Intervals
T-tests (Paired/Two-sample)
Regression (SLR & Multiple Regression)
ANOVA/ANCOVA
Intended as an interview. Will provide slides
after lectures
What’s in the lectures?...5
6
Overview
7
Lecture 1 Lecture 2 Lecture 3 Lecture 4
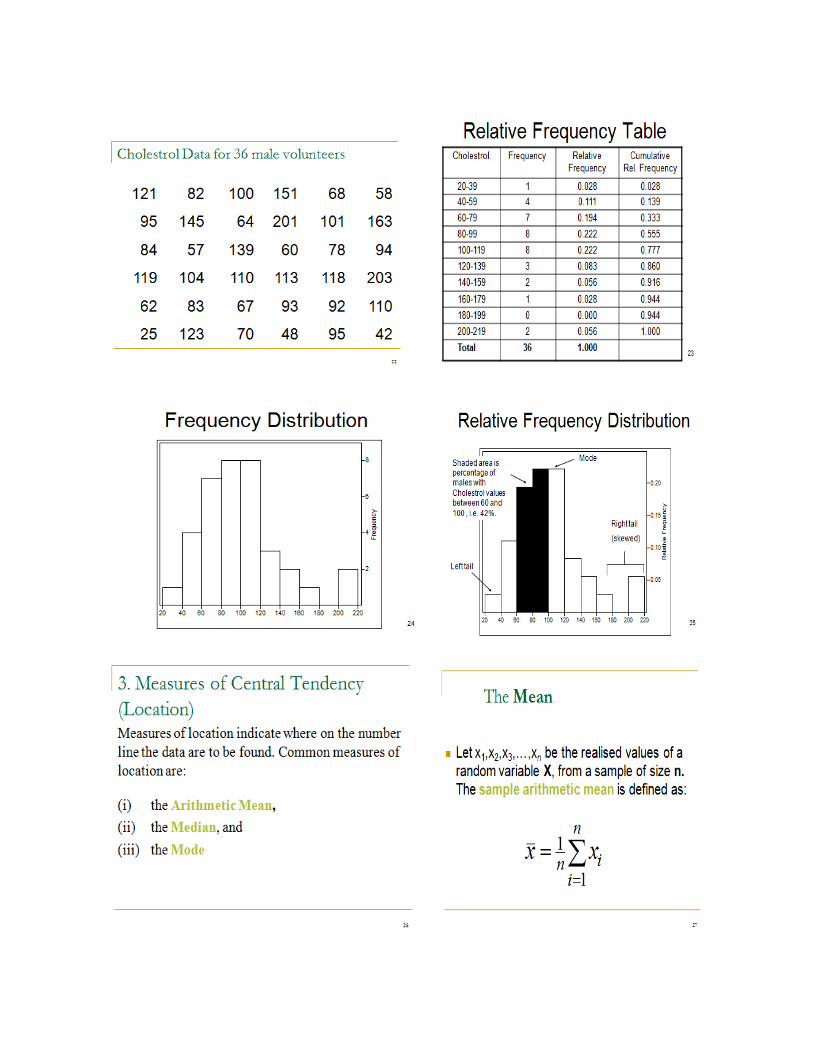
Descriptive Statistics and Graphical
Presentation of Data
1. Terminology
2. Frequency Distributions/Histograms
3. Measures of data location
4. Measures of data spread
5. Box-plots
6. Scatter-plots
7. Clustering (Multivariate Data)


Top Related