


Languages
Pages
Legal

OUR DIGITAL STATE2012
FUSION.COM.AU/OURDIGITALSTATE

FUSION.COM.AU/OURDIGITALSTATE 1
CONTENTS Introduction 3
Research objectives 7
Executive assessment 11
Key findings 27
References & authors 57

FUSION.COM.AU/OURDIGITALSTATE 2
INTRODUCTION

FUSION.COM.AU/OURDIGITALSTATE 5
INTRODUCTION Fusion is pleased to present the final report on the South Australian population’s digital behaviour. Frustrated with a lack of local marketplace insights, Fusion worked with research firm Intuito to gain a valuable local perspective into what, how, when and why South Australians are going online. Our Digital State reports on the connectedness of metro and regional South Australians, the devices they use, their internet behaviour as well as their social media and purchasing habits. “In times of rapid change it’s important to gain insights into what that change looks like. Having local knowledge is very important in South Australia, as we are unique in position and population. Our Digital State 2012 provides a real insight into our local digital behaviour. We are making this research freely available to help give businesses, brands and the marketing industry the knowledge to make informed digital decisions for 2013." Damien Mair, Fusion Co-founder. Download the entire Our Digital State report for free from fusion.com.au/ourdigitalstate
Background to the brief It’s relatively easy to find national and global statistics to support the importance of businesses investing in the development of sustainable digital strategy and activities. It’s far more difficult, if not impossible, to find the equivalent stats for South Australia. Fusion identified this lack of local statistics on the incidence of Internet usage, social media usage, and ecommerce. There are a number of relevant national and international studies on these topics that are available, such as:
• Google’s Mobile Planet: Australia study that examined the mobile consumer (May, 2012) • The Yellow Social Media Report: Australia (2012) • Sensis Social Media Report (May, 2011) • comScore’s State of the Internet: Australia (February, 2011)
However the depth of information in each of these studies is lacking at a local state level. For this reason, Fusion commissioned Intuito to conduct a local (metropolitan and regional) study of the general population to fill in the gaps of information to better inform local businesses of the current status of digital use in South Australia. The study was in the field between 7 August 2012 and 17 September 2012.

FUSION.COM.AU/OURDIGITALSTATE 6
RESEARCH OBJECTIVES

FUSION.COM.AU/OURDIGITALSTATE 9
RESEARCH OBJECTIVES The overarching research objective for this project was to gain an understanding of the Internet use and multi-device behaviour of consumers living in the metropolitan and regional areas of South Australia, and to compare this behaviour with that of the national monitors available. The specific research objectives were: • Determine what percentage of the population has no internet connectivity, who they are
and why they do not. • Determine South Australian penetration of various devices (computers, internet,
mobile/smartphones, tablets, etc.) • Determine what South Australians use the internet for and what are the benefits of the
internet. • Determine reasons for using the internet. • Determine frequency and duration of use of the internet. • Determine who shops online, what is purchased and what the major reasons are for
shopping online and if purchasing online is more frequent than a year ago. • Determine usage of smartphones and what they are used for and if people do not have a
smartphone what are the major reasons. • Determine usage of social media such as Facebook, Twitter, LinkedIn, MySpace, and other
social media sites. • Determine what social networking sites are used for. • Determine what consumers wish to get from businesses and brands that they follow on
social media. • Determine incidence of ‘unliking’ businesses or brands on Facebook. • Determine who tweets and incidence of un-following businesses and brands on Twitter. • Determine the products and services most researched on social networking sites. • Provide demographics for lines of enquiry throughout the report.

FUSION.COM.AU/OURDIGITALSTATE 10
EXECUTIVEASSESSMENT

FUSION.COM.AU/OURDIGITALSTATE 13
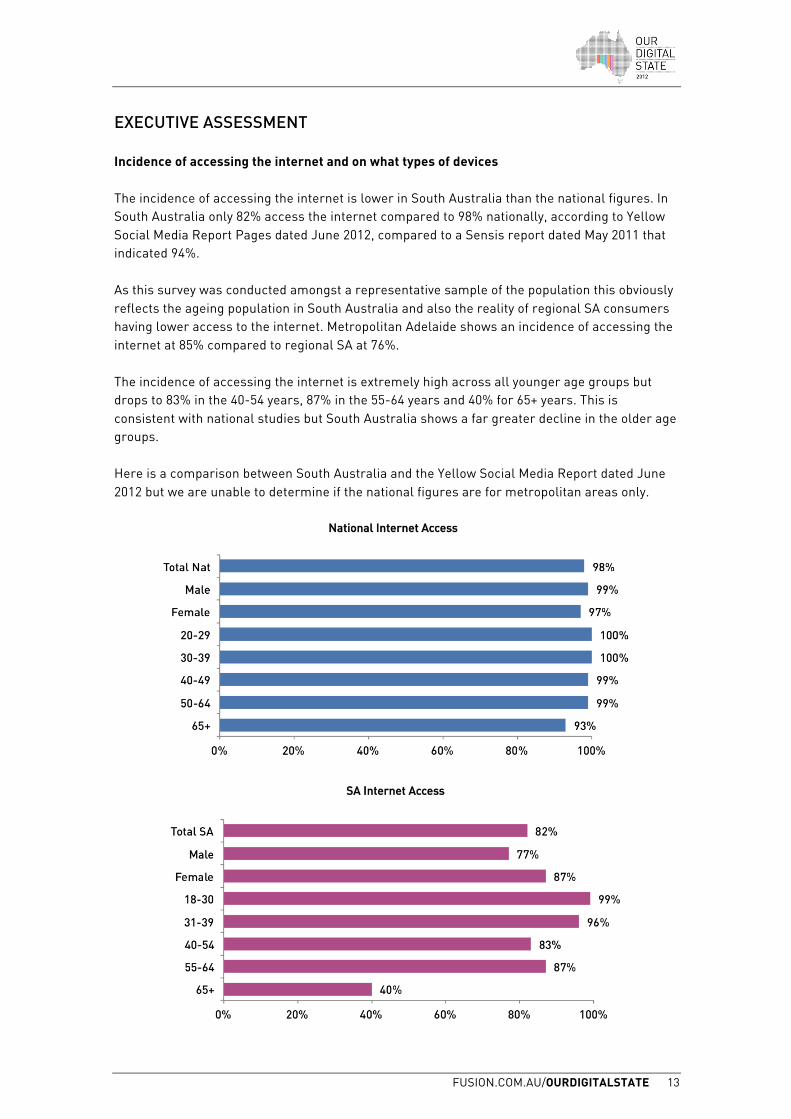
EXECUTIVE ASSESSMENT Incidence of accessing the internet and on what types of devices The incidence of accessing the internet is lower in South Australia than the national figures. In South Australia only 82% access the internet compared to 98% nationally, according to Yellow Social Media Report Pages dated June 2012, compared to a Sensis report dated May 2011 that indicated 94%. As this survey was conducted amongst a representative sample of the population this obviously reflects the ageing population in South Australia and also the reality of regional SA consumers having lower access to the internet. Metropolitan Adelaide shows an incidence of accessing the internet at 85% compared to regional SA at 76%. The incidence of accessing the internet is extremely high across all younger age groups but drops to 83% in the 40-54 years, 87% in the 55-64 years and 40% for 65+ years. This is consistent with national studies but South Australia shows a far greater decline in the older age groups. Here is a comparison between South Australia and the Yellow Social Media Report dated June 2012 but we are unable to determine if the national figures are for metropolitan areas only.
FUSION.COM.AU/OURDIGITALSTATE 14
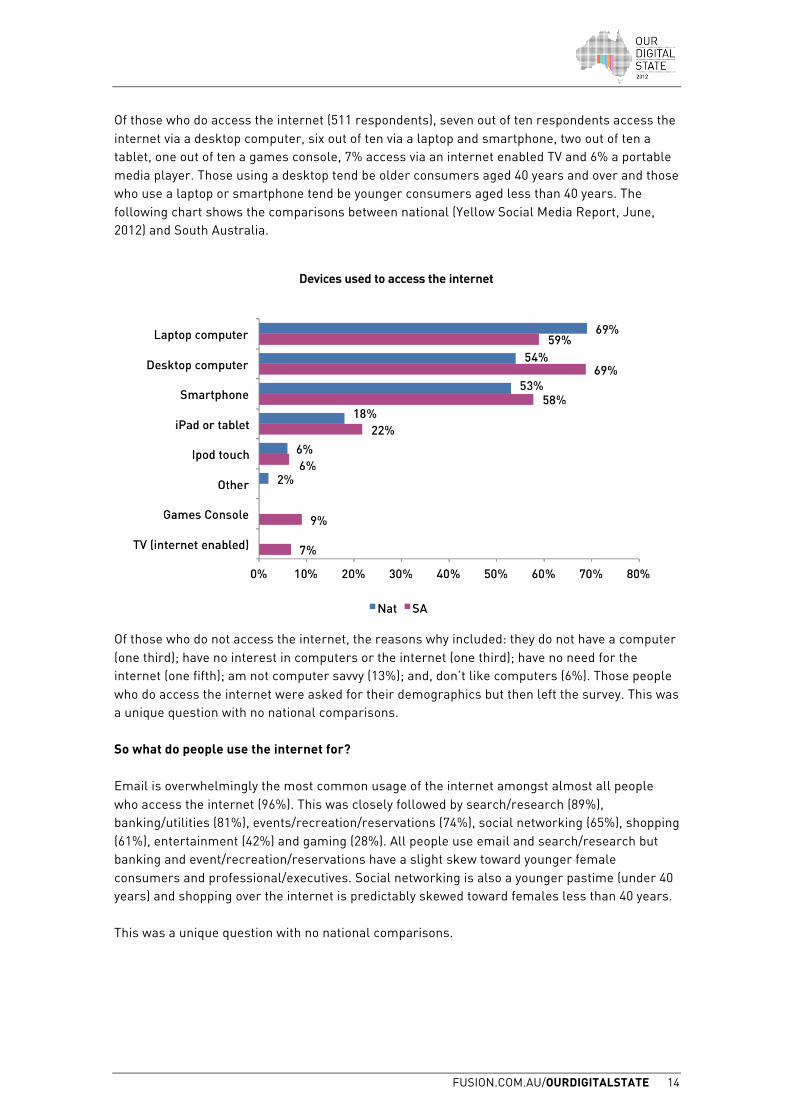
Of those who do access the internet (511 respondents), seven out of ten respondents access the internet via a desktop computer, six out of ten via a laptop and smartphone, two out of ten a tablet, one out of ten a games console, 7% access via an internet enabled TV and 6% a portable media player. Those using a desktop tend be older consumers aged 40 years and over and those who use a laptop or smartphone tend be younger consumers aged less than 40 years. The following chart shows the comparisons between national (Yellow Social Media Report, June, 2012) and South Australia.
Of those who do not access the internet, the reasons why included: they do not have a computer (one third); have no interest in computers or the internet (one third); have no need for the internet (one fifth); am not computer savvy (13%); and, don’t like computers (6%). Those people who do access the internet were asked for their demographics but then left the survey. This was a unique question with no national comparisons. So what do people use the internet for? Email is overwhelmingly the most common usage of the internet amongst almost all people who access the internet (96%). This was closely followed by search/research (89%), banking/utilities (81%), events/recreation/reservations (74%), social networking (65%), shopping (61%), entertainment (42%) and gaming (28%). All people use email and search/research but banking and event/recreation/reservations have a slight skew toward younger female consumers and professional/executives. Social networking is also a younger pastime (under 40 years) and shopping over the internet is predictably skewed toward females less than 40 years. This was a unique question with no national comparisons.
FUSION.COM.AU/OURDIGITALSTATE 15
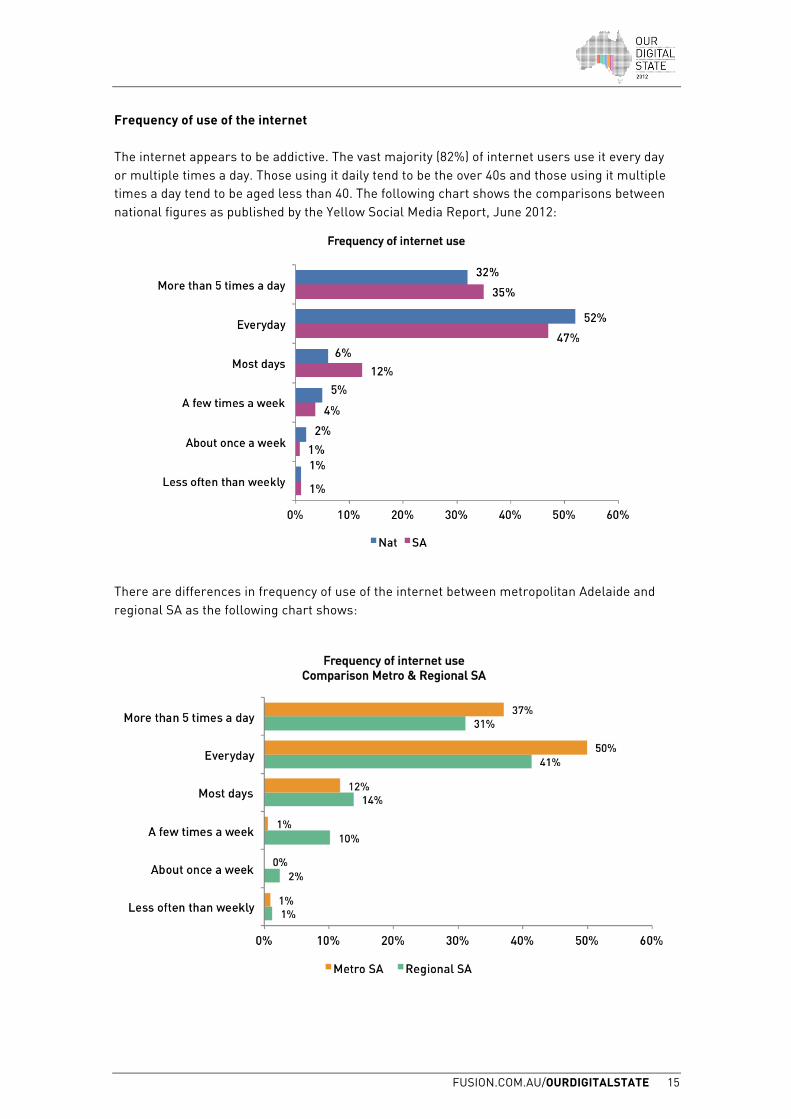
Frequency of use of the internet The internet appears to be addictive. The vast majority (82%) of internet users use it every day or multiple times a day. Those using it daily tend to be the over 40s and those using it multiple times a day tend to be aged less than 40. The following chart shows the comparisons between national figures as published by the Yellow Social Media Report, June 2012:
There are differences in frequency of use of the internet between metropolitan Adelaide and regional SA as the following chart shows:
FUSION.COM.AU/OURDIGITALSTATE 16
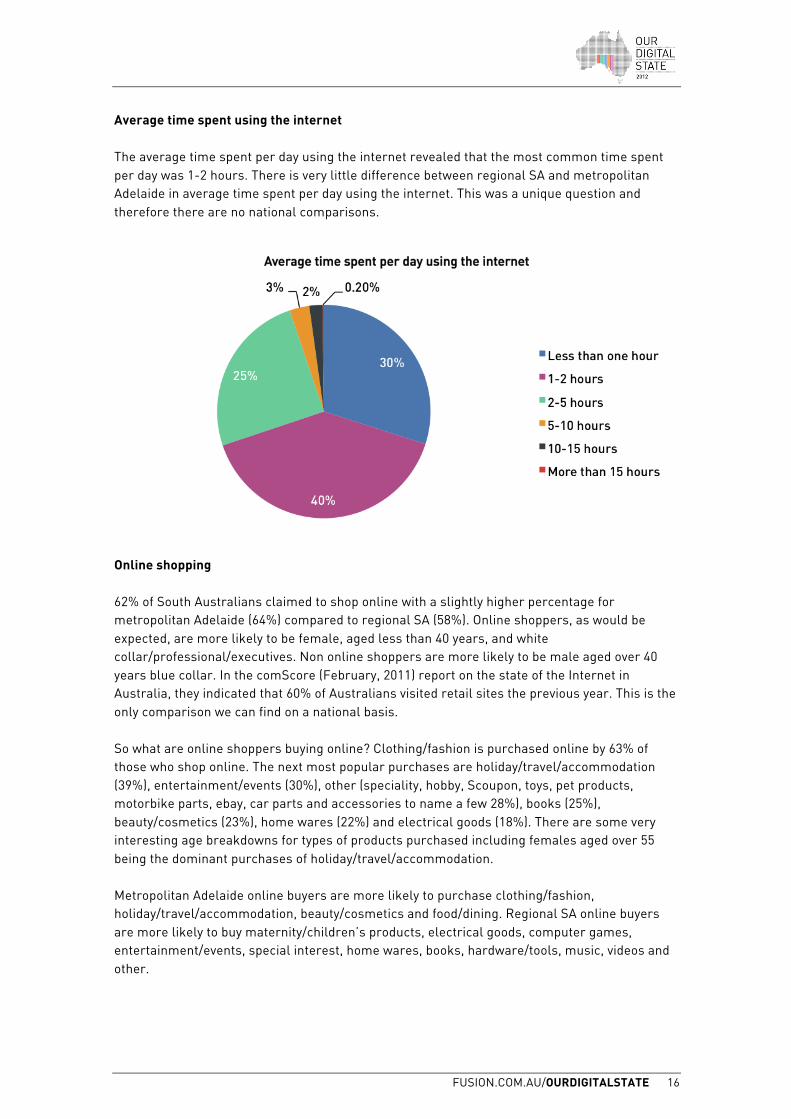
Average time spent using the internet The average time spent per day using the internet revealed that the most common time spent per day was 1-2 hours. There is very little difference between regional SA and metropolitan Adelaide in average time spent per day using the internet. This was a unique question and therefore there are no national comparisons.
Online shopping 62% of South Australians claimed to shop online with a slightly higher percentage for metropolitan Adelaide (64%) compared to regional SA (58%). Online shoppers, as would be expected, are more likely to be female, aged less than 40 years, and white collar/professional/executives. Non online shoppers are more likely to be male aged over 40 years blue collar. In the comScore (February, 2011) report on the state of the Internet in Australia, they indicated that 60% of Australians visited retail sites the previous year. This is the only comparison we can find on a national basis. So what are online shoppers buying online? Clothing/fashion is purchased online by 63% of those who shop online. The next most popular purchases are holiday/travel/accommodation (39%), entertainment/events (30%), other (speciality, hobby, Scoupon, toys, pet products, motorbike parts, ebay, car parts and accessories to name a few 28%), books (25%), beauty/cosmetics (23%), home wares (22%) and electrical goods (18%). There are some very interesting age breakdowns for types of products purchased including females aged over 55 being the dominant purchases of holiday/travel/accommodation. Metropolitan Adelaide online buyers are more likely to purchase clothing/fashion, holiday/travel/accommodation, beauty/cosmetics and food/dining. Regional SA online buyers are more likely to buy maternity/children’s products, electrical goods, computer games, entertainment/events, special interest, home wares, books, hardware/tools, music, videos and other.
FUSION.COM.AU/OURDIGITALSTATE 17
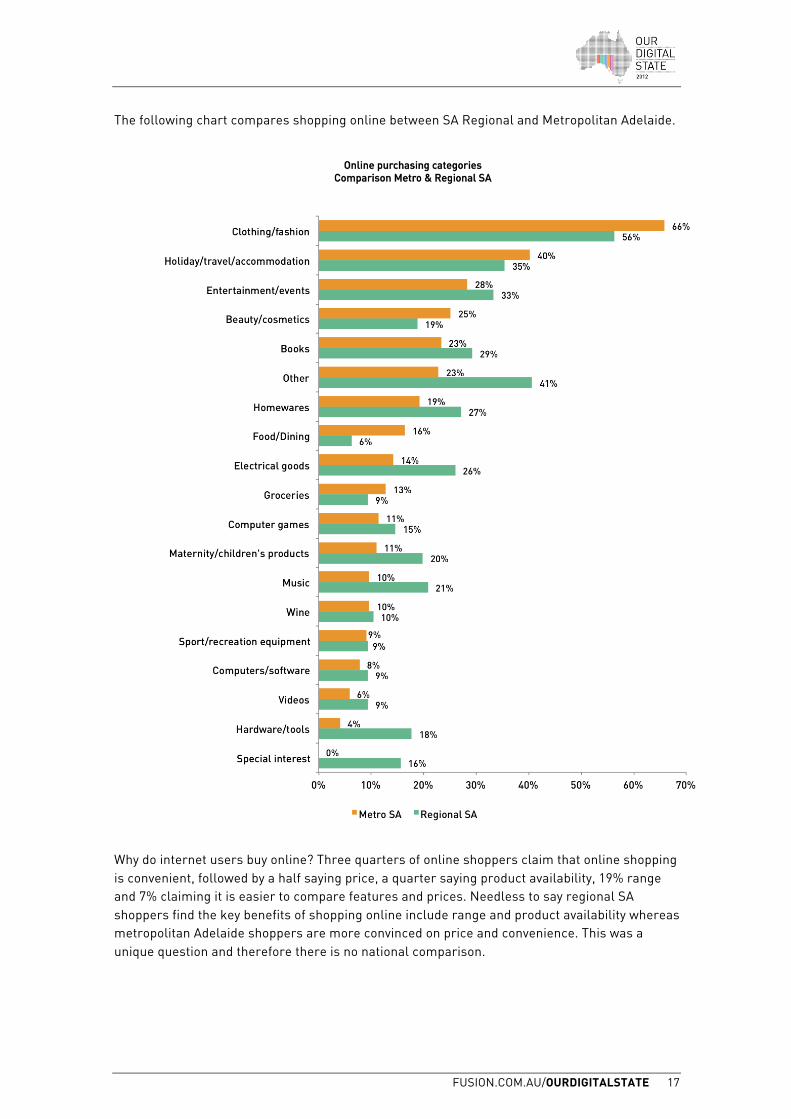
The following chart compares shopping online between SA Regional and Metropolitan Adelaide.
Why do internet users buy online? Three quarters of online shoppers claim that online shopping is convenient, followed by a half saying price, a quarter saying product availability, 19% range and 7% claiming it is easier to compare features and prices. Needless to say regional SA shoppers find the key benefits of shopping online include range and product availability whereas metropolitan Adelaide shoppers are more convinced on price and convenience. This was a unique question and therefore there is no national comparison.
FUSION.COM.AU/OURDIGITALSTATE 18
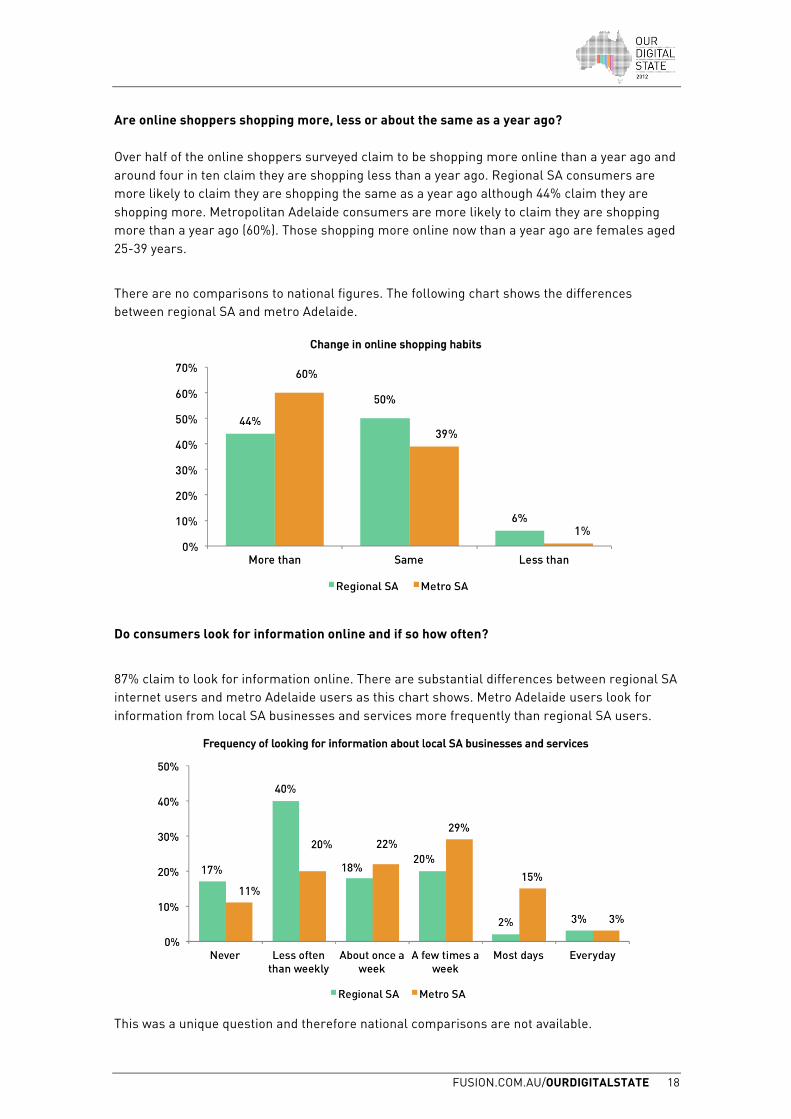
Are online shoppers shopping more, less or about the same as a year ago? Over half of the online shoppers surveyed claim to be shopping more online than a year ago and around four in ten claim they are shopping less than a year ago. Regional SA consumers are more likely to claim they are shopping the same as a year ago although 44% claim they are shopping more. Metropolitan Adelaide consumers are more likely to claim they are shopping more than a year ago (60%). Those shopping more online now than a year ago are females aged 25-39 years.
There are no comparisons to national figures. The following chart shows the differences between regional SA and metro Adelaide.
Do consumers look for information online and if so how often?
87% claim to look for information online. There are substantial differences between regional SA internet users and metro Adelaide users as this chart shows. Metro Adelaide users look for information from local SA businesses and services more frequently than regional SA users.
This was a unique question and therefore national comparisons are not available.
FUSION.COM.AU/OURDIGITALSTATE 19
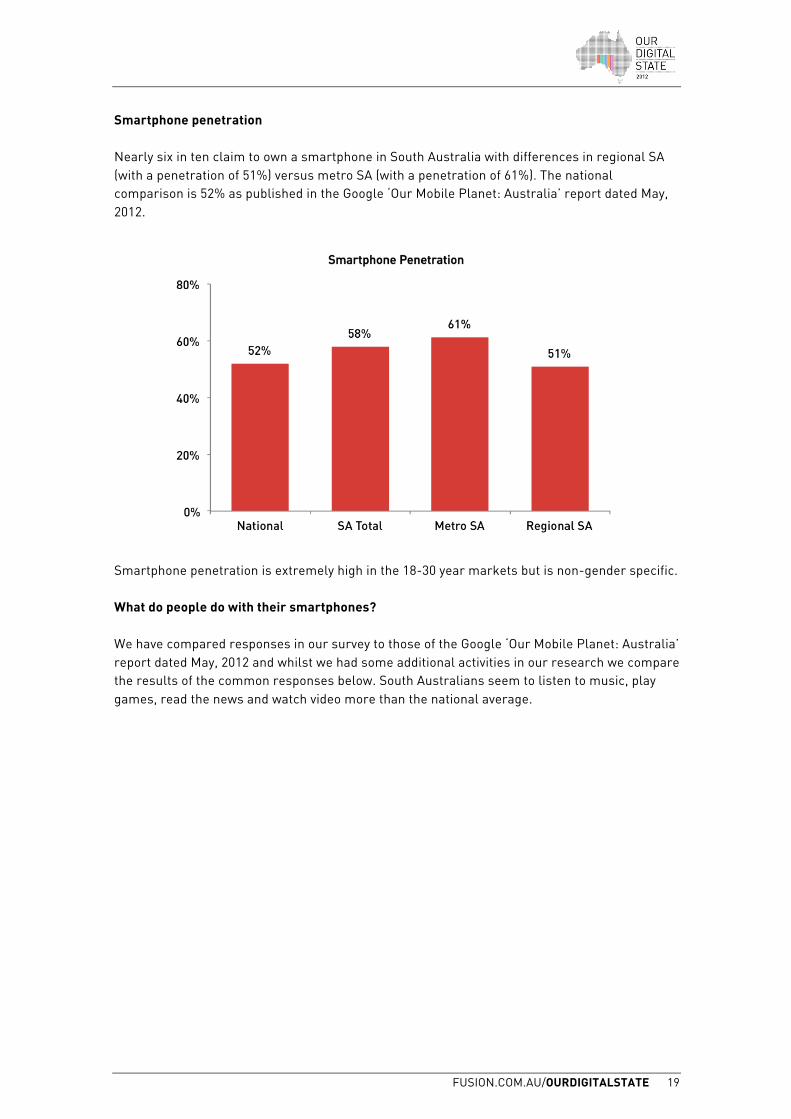
Smartphone penetration Nearly six in ten claim to own a smartphone in South Australia with differences in regional SA (with a penetration of 51%) versus metro SA (with a penetration of 61%). The national comparison is 52% as published in the Google ‘Our Mobile Planet: Australia’ report dated May, 2012.
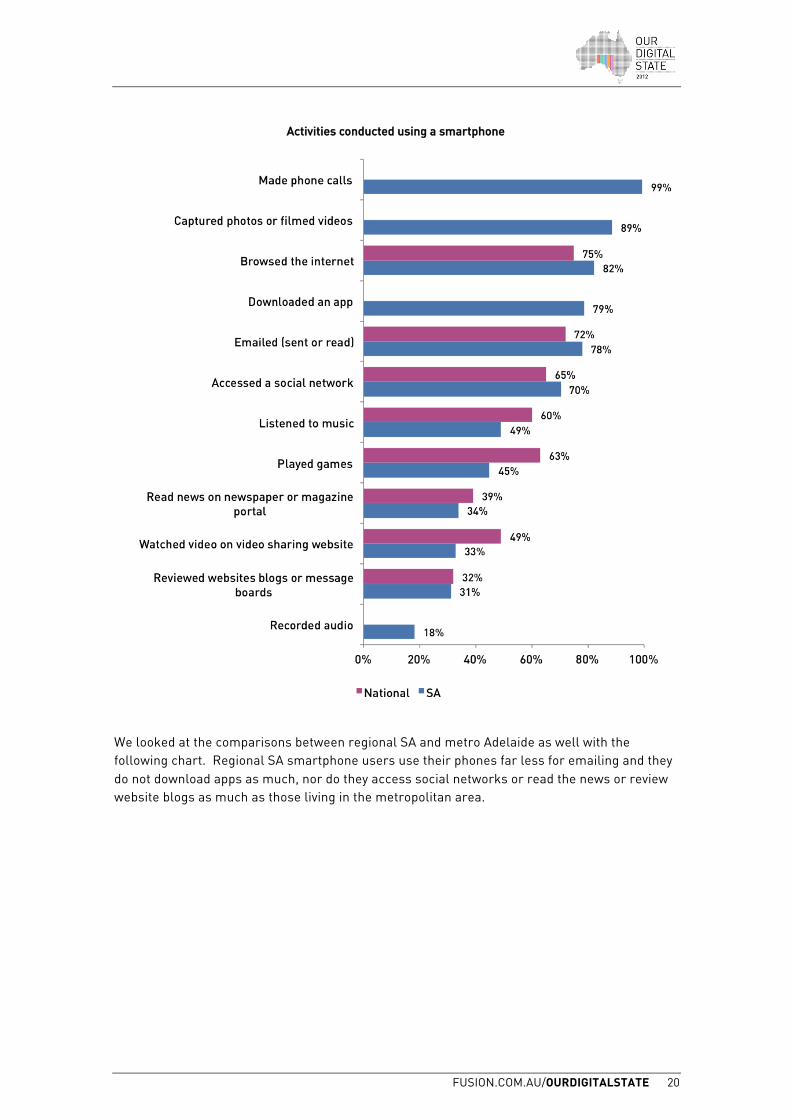
Smartphone penetration is extremely high in the 18-30 year markets but is non-gender specific. What do people do with their smartphones? We have compared responses in our survey to those of the Google ‘Our Mobile Planet: Australia’ report dated May, 2012 and whilst we had some additional activities in our research we compare the results of the common responses below. South Australians seem to listen to music, play games, read the news and watch video more than the national average.
FUSION.COM.AU/OURDIGITALSTATE 20
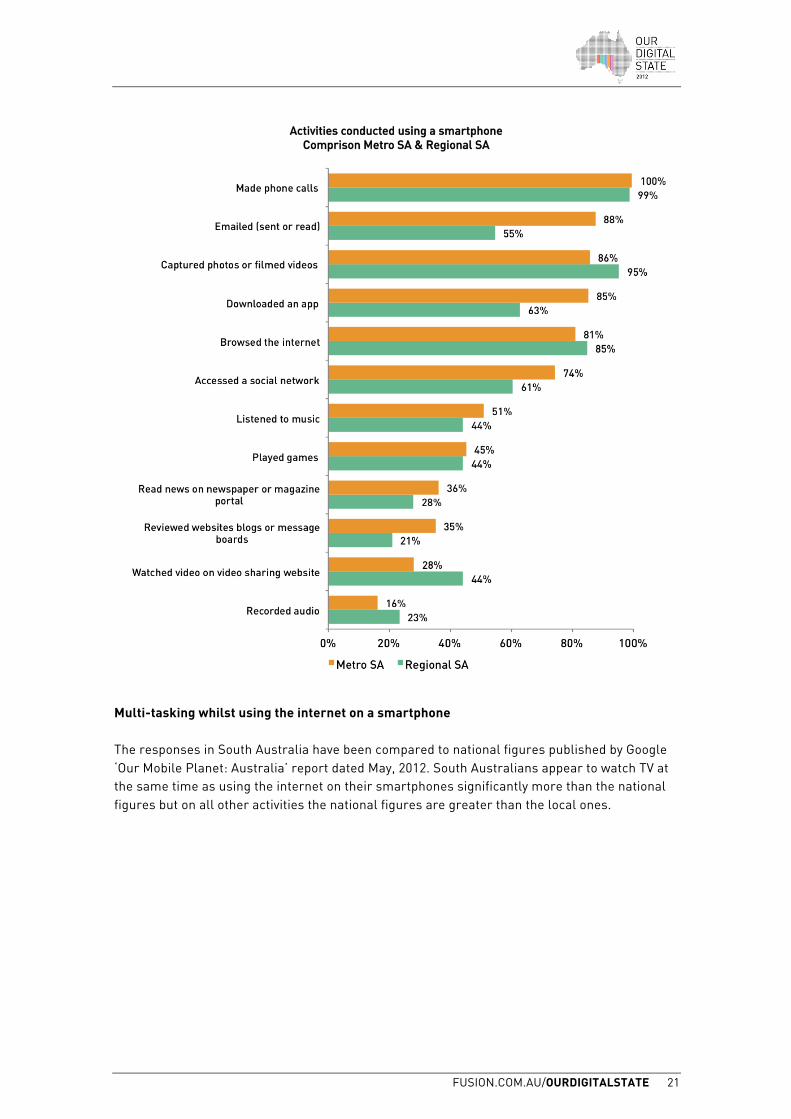
We looked at the comparisons between regional SA and metro Adelaide as well with the following chart. Regional SA smartphone users use their phones far less for emailing and they do not download apps as much, nor do they access social networks or read the news or review website blogs as much as those living in the metropolitan area.
FUSION.COM.AU/OURDIGITALSTATE 21
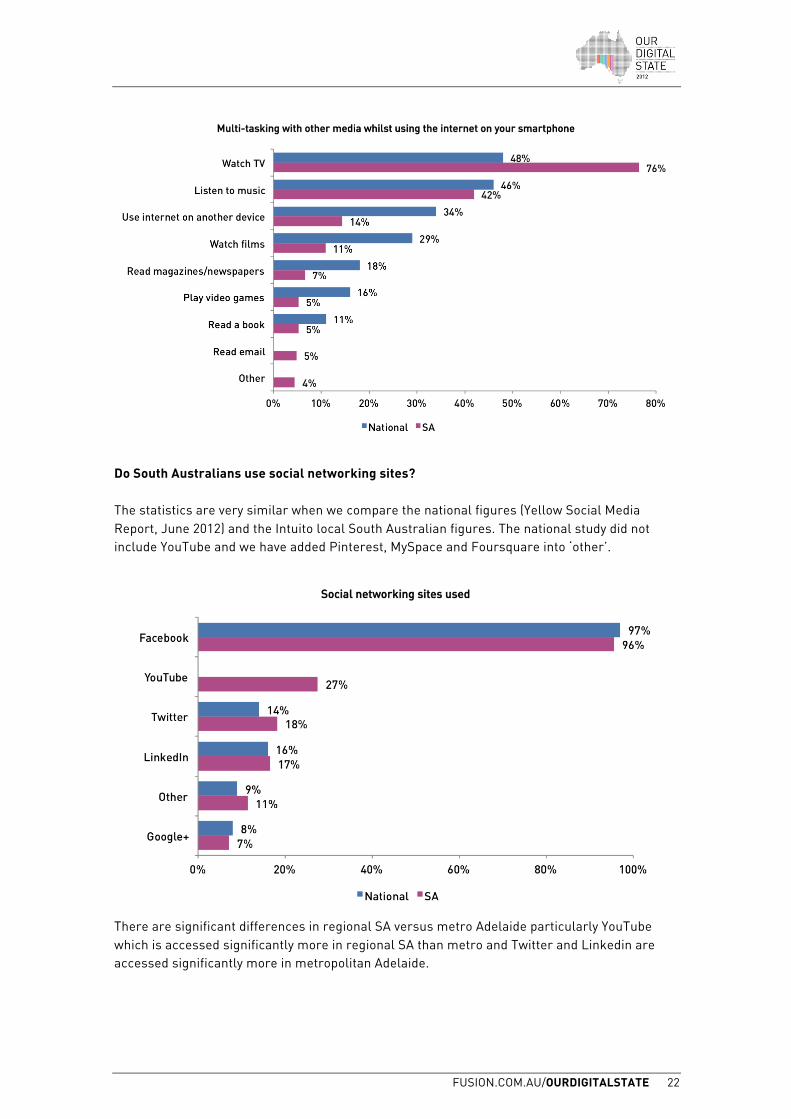
Multi-tasking whilst using the internet on a smartphone The responses in South Australia have been compared to national figures published by Google ‘Our Mobile Planet: Australia’ report dated May, 2012. South Australians appear to watch TV at the same time as using the internet on their smartphones significantly more than the national figures but on all other activities the national figures are greater than the local ones.
FUSION.COM.AU/OURDIGITALSTATE 22
Do South Australians use social networking sites? The statistics are very similar when we compare the national figures (Yellow Social Media Report, June 2012) and the Intuito local South Australian figures. The national study did not include YouTube and we have added Pinterest, MySpace and Foursquare into ‘other’.
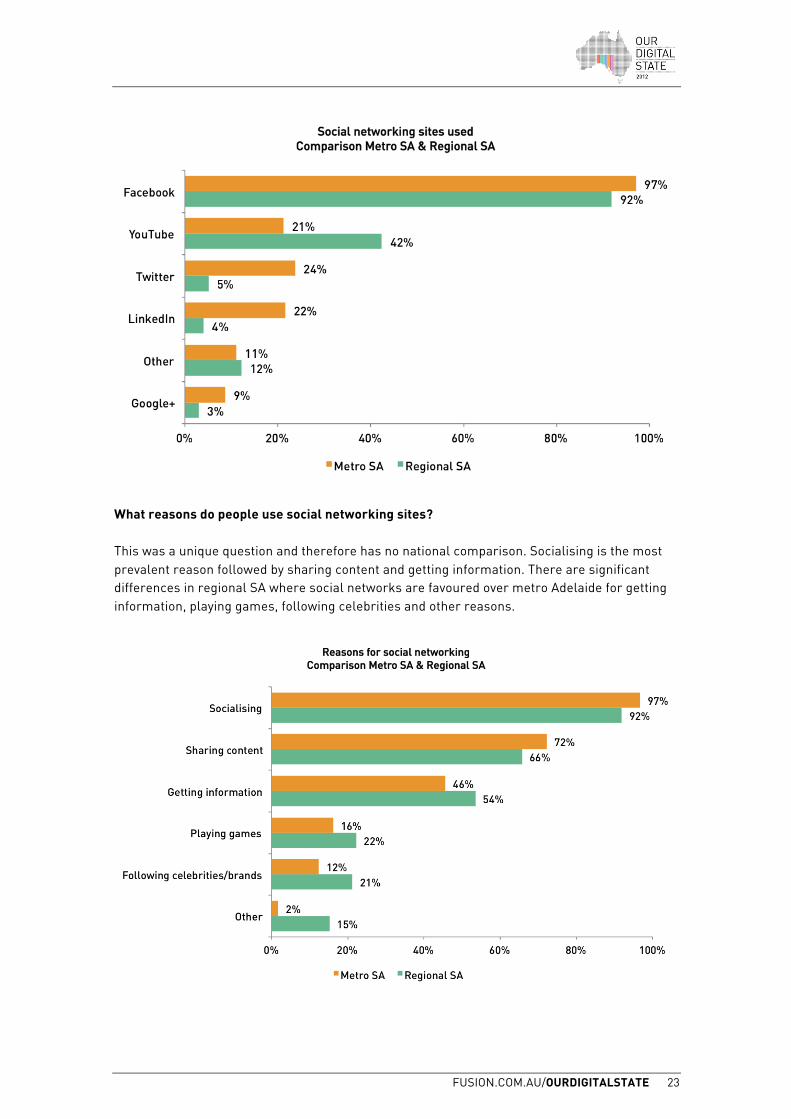
There are significant differences in regional SA versus metro Adelaide particularly YouTube which is accessed significantly more in regional SA than metro and Twitter and Linkedin are accessed significantly more in metropolitan Adelaide.
FUSION.COM.AU/OURDIGITALSTATE 23
What reasons do people use social networking sites? This was a unique question and therefore has no national comparison. Socialising is the most prevalent reason followed by sharing content and getting information. There are significant differences in regional SA where social networks are favoured over metro Adelaide for getting information, playing games, following celebrities and other reasons.
FUSION.COM.AU/OURDIGITALSTATE 24
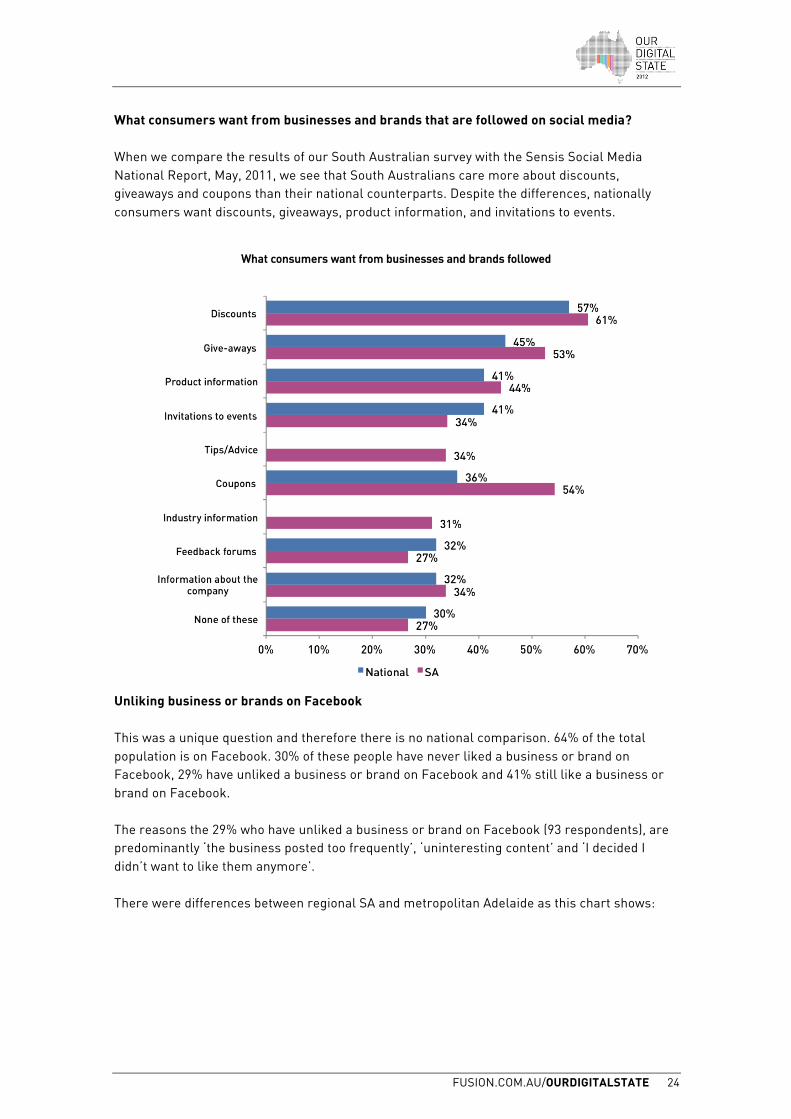
What consumers want from businesses and brands that are followed on social media? When we compare the results of our South Australian survey with the Sensis Social Media National Report, May, 2011, we see that South Australians care more about discounts, giveaways and coupons than their national counterparts. Despite the differences, nationally consumers want discounts, giveaways, product information, and invitations to events.
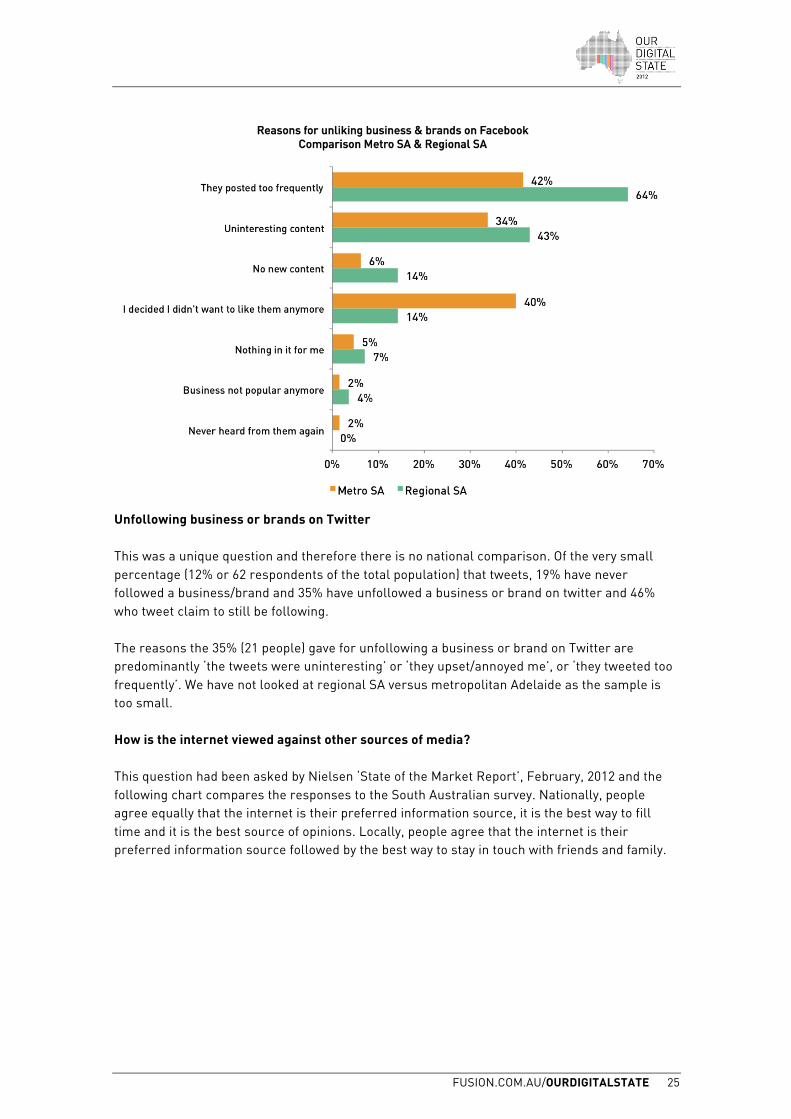
Unliking business or brands on Facebook This was a unique question and therefore there is no national comparison. 64% of the total population is on Facebook. 30% of these people have never liked a business or brand on Facebook, 29% have unliked a business or brand on Facebook and 41% still like a business or brand on Facebook. The reasons the 29% who have unliked a business or brand on Facebook (93 respondents), are predominantly ‘the business posted too frequently’, ‘uninteresting content’ and ‘I decided I didn’t want to like them anymore’. There were differences between regional SA and metropolitan Adelaide as this chart shows:
FUSION.COM.AU/OURDIGITALSTATE 25
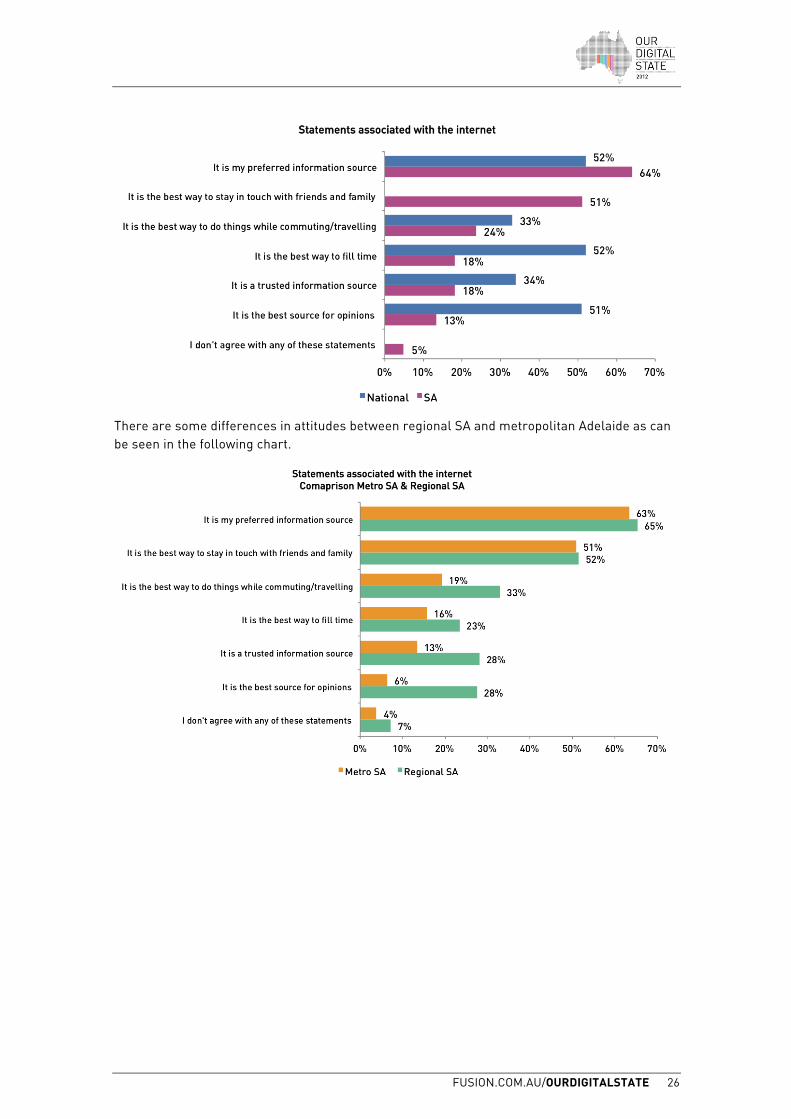
Unfollowing business or brands on Twitter This was a unique question and therefore there is no national comparison. Of the very small percentage (12% or 62 respondents of the total population) that tweets, 19% have never followed a business/brand and 35% have unfollowed a business or brand on twitter and 46% who tweet claim to still be following. The reasons the 35% (21 people) gave for unfollowing a business or brand on Twitter are predominantly ‘the tweets were uninteresting’ or ‘they upset/annoyed me’, or ‘they tweeted too frequently’. We have not looked at regional SA versus metropolitan Adelaide as the sample is too small. How is the internet viewed against other sources of media? This question had been asked by Nielsen ‘State of the Market Report’, February, 2012 and the following chart compares the responses to the South Australian survey. Nationally, people agree equally that the internet is their preferred information source, it is the best way to fill time and it is the best source of opinions. Locally, people agree that the internet is their preferred information source followed by the best way to stay in touch with friends and family.
FUSION.COM.AU/OURDIGITALSTATE 26
There are some differences in attitudes between regional SA and metropolitan Adelaide as can be seen in the following chart.
KEY FINDINGS

FUSION.COM.AU/OURDIGITALSTATE 29
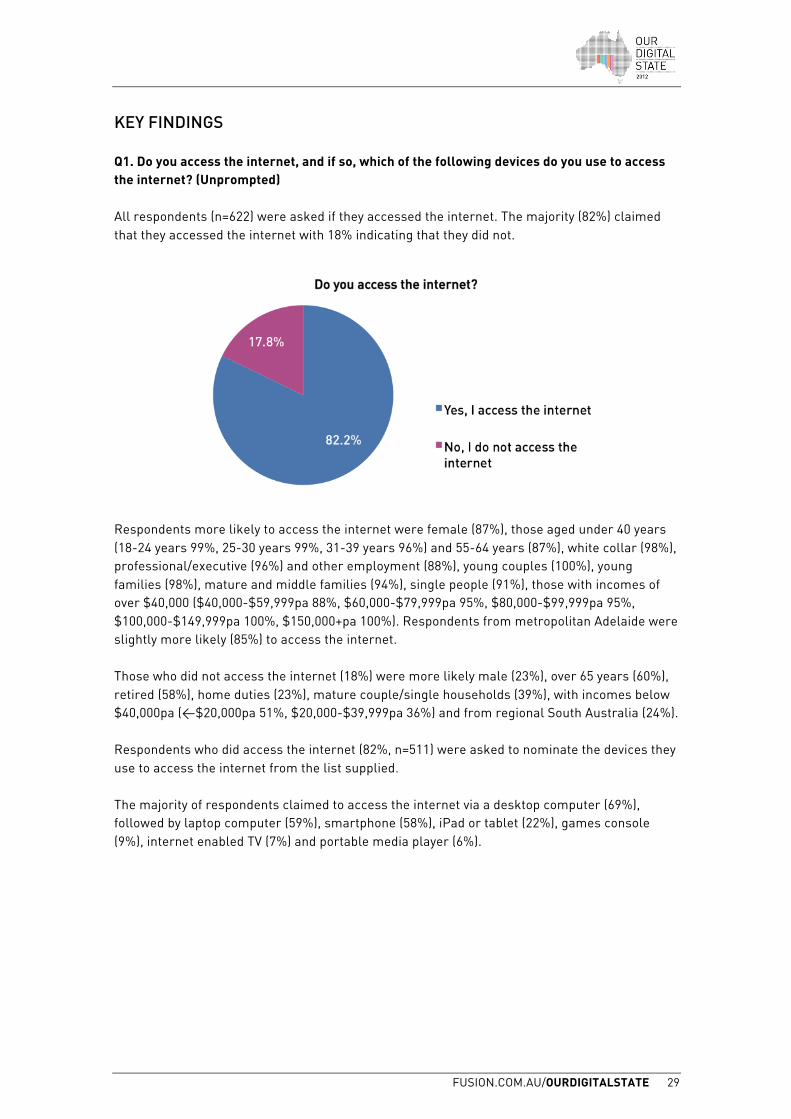
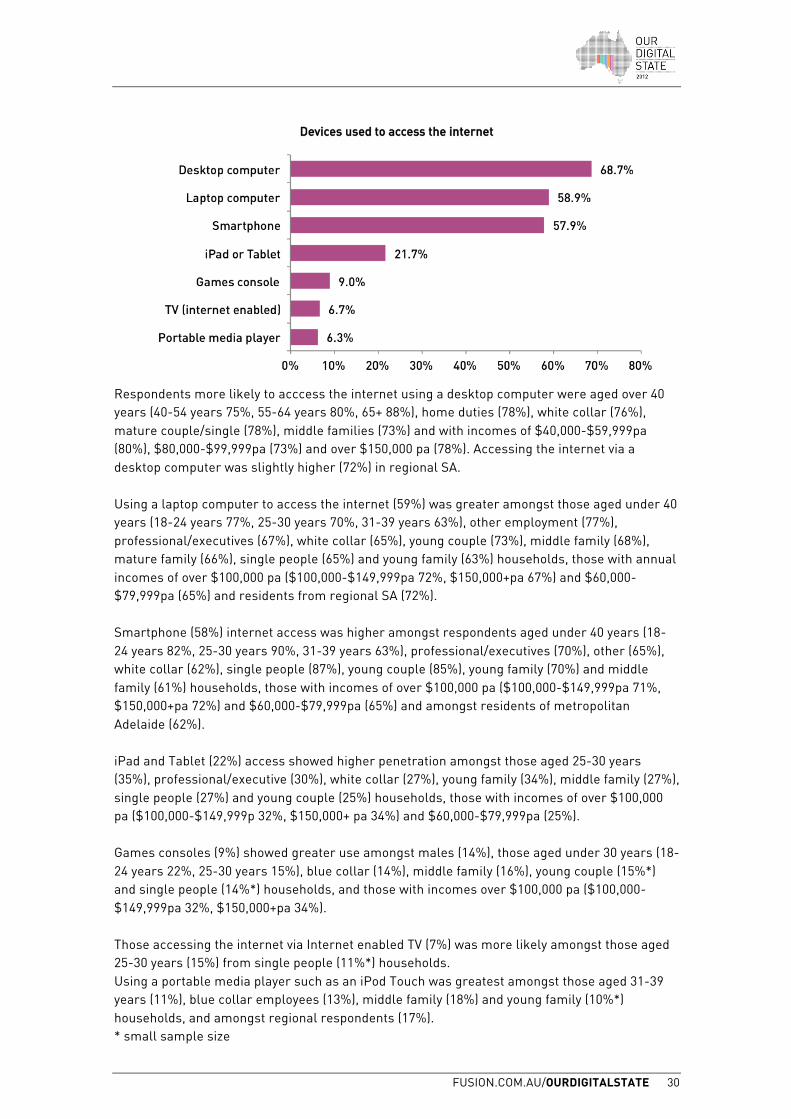
KEY FINDINGS Q1. Do you access the internet, and if so, which of the following devices do you use to access the internet? (Unprompted) All respondents (n=622) were asked if they accessed the internet. The majority (82%) claimed that they accessed the internet with 18% indicating that they did not.
Respondents more likely to access the internet were female (87%), those aged under 40 years (18-24 years 99%, 25-30 years 99%, 31-39 years 96%) and 55-64 years (87%), white collar (98%), professional/executive (96%) and other employment (88%), young couples (100%), young families (98%), mature and middle families (94%), single people (91%), those with incomes of over $40,000 ($40,000-$59,999pa 88%, $60,000-$79,999pa 95%, $80,000-$99,999pa 95%, $100,000-$149,999pa 100%, $150,000+pa 100%). Respondents from metropolitan Adelaide were slightly more likely (85%) to access the internet. Those who did not access the internet (18%) were more likely male (23%), over 65 years (60%), retired (58%), home duties (23%), mature couple/single households (39%), with incomes below $40,000pa (<$20,000pa 51%, $20,000-$39,999pa 36%) and from regional South Australia (24%). Respondents who did access the internet (82%, n=511) were asked to nominate the devices they use to access the internet from the list supplied. The majority of respondents claimed to access the internet via a desktop computer (69%), followed by laptop computer (59%), smartphone (58%), iPad or tablet (22%), games console (9%), internet enabled TV (7%) and portable media player (6%).
FUSION.COM.AU/OURDIGITALSTATE 30
Respondents more likely to acccess the internet using a desktop computer were aged over 40 years (40-54 years 75%, 55-64 years 80%, 65+ 88%), home duties (78%), white collar (76%), mature couple/single (78%), middle families (73%) and with incomes of $40,000-$59,999pa (80%), $80,000-$99,999pa (73%) and over $150,000 pa (78%). Accessing the internet via a desktop computer was slightly higher (72%) in regional SA. Using a laptop computer to access the internet (59%) was greater amongst those aged under 40 years (18-24 years 77%, 25-30 years 70%, 31-39 years 63%), other employment (77%), professional/executives (67%), white collar (65%), young couple (73%), middle family (68%), mature family (66%), single people (65%) and young family (63%) households, those with annual incomes of over $100,000 pa ($100,000-$149,999pa 72%, $150,000+pa 67%) and $60,000-$79,999pa (65%) and residents from regional SA (72%). Smartphone (58%) internet access was higher amongst respondents aged under 40 years (18-24 years 82%, 25-30 years 90%, 31-39 years 63%), professional/executives (70%), other (65%), white collar (62%), single people (87%), young couple (85%), young family (70%) and middle family (61%) households, those with incomes of over $100,000 pa ($100,000-$149,999pa 71%, $150,000+pa 72%) and $60,000-$79,999pa (65%) and amongst residents of metropolitan Adelaide (62%). iPad and Tablet (22%) access showed higher penetration amongst those aged 25-30 years (35%), professional/executive (30%), white collar (27%), young family (34%), middle family (27%), single people (27%) and young couple (25%) households, those with incomes of over $100,000 pa ($100,000-$149,999p 32%, $150,000+ pa 34%) and $60,000-$79,999pa (25%). Games consoles (9%) showed greater use amongst males (14%), those aged under 30 years (18-24 years 22%, 25-30 years 15%), blue collar (14%), middle family (16%), young couple (15%*) and single people (14%*) households, and those with incomes over $100,000 pa ($100,000-$149,999pa 32%, $150,000+pa 34%). Those accessing the internet via Internet enabled TV (7%) was more likely amongst those aged 25-30 years (15%) from single people (11%*) households. Using a portable media player such as an iPod Touch was greatest amongst those aged 31-39 years (11%), blue collar employees (13%), middle family (18%) and young family (10%*) households, and amongst regional respondents (17%). * small sample size
FUSION.COM.AU/OURDIGITALSTATE 31
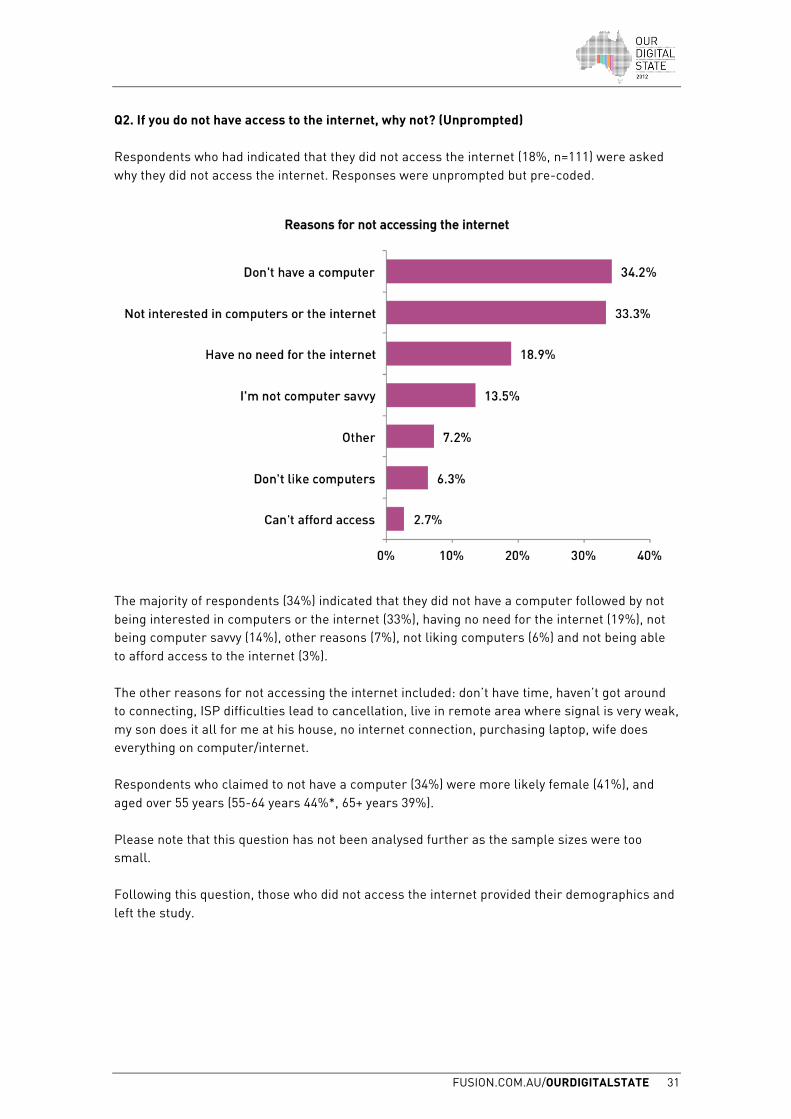
Q2. If you do not have access to the internet, why not? (Unprompted) Respondents who had indicated that they did not access the internet (18%, n=111) were asked why they did not access the internet. Responses were unprompted but pre-coded.
The majority of respondents (34%) indicated that they did not have a computer followed by not being interested in computers or the internet (33%), having no need for the internet (19%), not being computer savvy (14%), other reasons (7%), not liking computers (6%) and not being able to afford access to the internet (3%). The other reasons for not accessing the internet included: don’t have time, haven’t got around to connecting, ISP difficulties lead to cancellation, live in remote area where signal is very weak, my son does it all for me at his house, no internet connection, purchasing laptop, wife does everything on computer/internet. Respondents who claimed to not have a computer (34%) were more likely female (41%), and aged over 55 years (55-64 years 44%*, 65+ years 39%). Please note that this question has not been analysed further as the sample sizes were too small. Following this question, those who did not access the internet provided their demographics and left the study.
FUSION.COM.AU/OURDIGITALSTATE 32
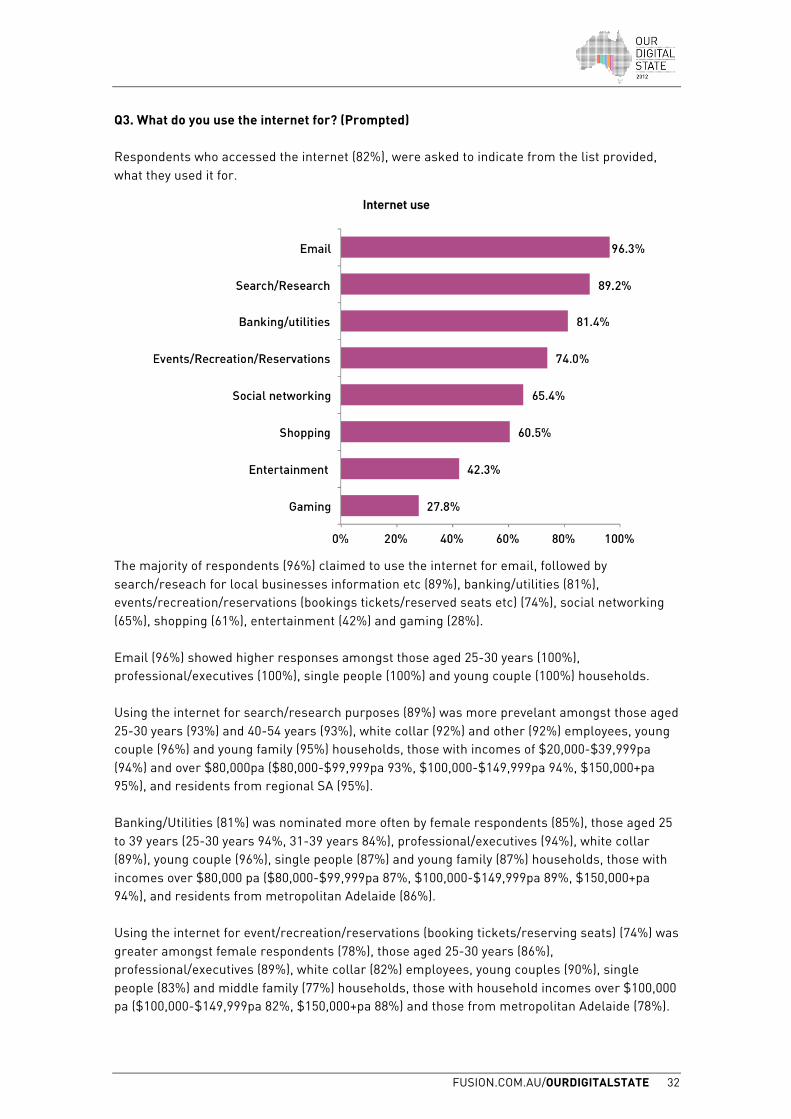
Q3. What do you use the internet for? (Prompted) Respondents who accessed the internet (82%), were asked to indicate from the list provided, what they used it for.
The majority of respondents (96%) claimed to use the internet for email, followed by search/reseach for local businesses information etc (89%), banking/utilities (81%), events/recreation/reservations (bookings tickets/reserved seats etc) (74%), social networking (65%), shopping (61%), entertainment (42%) and gaming (28%). Email (96%) showed higher responses amongst those aged 25-30 years (100%), professional/executives (100%), single people (100%) and young couple (100%) households. Using the internet for search/research purposes (89%) was more prevelant amongst those aged 25-30 years (93%) and 40-54 years (93%), white collar (92%) and other (92%) employees, young couple (96%) and young family (95%) households, those with incomes of $20,000-$39,999pa (94%) and over $80,000pa ($80,000-$99,999pa 93%, $100,000-$149,999pa 94%, $150,000+pa 95%), and residents from regional SA (95%). Banking/Utilities (81%) was nominated more often by female respondents (85%), those aged 25 to 39 years (25-30 years 94%, 31-39 years 84%), professional/executives (94%), white collar (89%), young couple (96%), single people (87%) and young family (87%) households, those with incomes over $80,000 pa ($80,000-$99,999pa 87%, $100,000-$149,999pa 89%, $150,000+pa 94%), and residents from metropolitan Adelaide (86%). Using the internet for event/recreation/reservations (booking tickets/reserving seats) (74%) was greater amongst female respondents (78%), those aged 25-30 years (86%), professional/executives (89%), white collar (82%) employees, young couples (90%), single people (83%) and middle family (77%) households, those with household incomes over $100,000 pa ($100,000-$149,999pa 82%, $150,000+pa 88%) and those from metropolitan Adelaide (78%).
FUSION.COM.AU/OURDIGITALSTATE 33
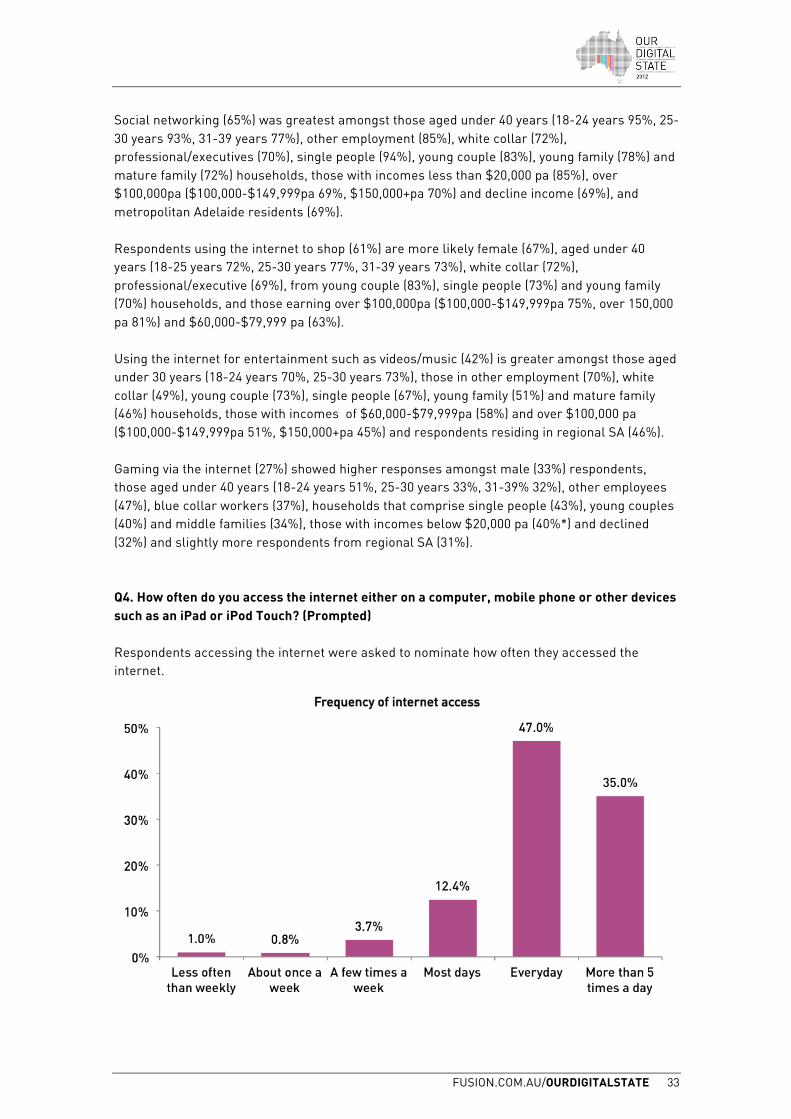
Social networking (65%) was greatest amongst those aged under 40 years (18-24 years 95%, 25-30 years 93%, 31-39 years 77%), other employment (85%), white collar (72%), professional/executives (70%), single people (94%), young couple (83%), young family (78%) and mature family (72%) households, those with incomes less than $20,000 pa (85%), over $100,000pa ($100,000-$149,999pa 69%, $150,000+pa 70%) and decline income (69%), and metropolitan Adelaide residents (69%). Respondents using the internet to shop (61%) are more likely female (67%), aged under 40 years (18-25 years 72%, 25-30 years 77%, 31-39 years 73%), white collar (72%), professional/executive (69%), from young couple (83%), single people (73%) and young family (70%) households, and those earning over $100,000pa ($100,000-$149,999pa 75%, over 150,000 pa 81%) and $60,000-$79,999 pa (63%). Using the internet for entertainment such as videos/music (42%) is greater amongst those aged under 30 years (18-24 years 70%, 25-30 years 73%), those in other employment (70%), white collar (49%), young couple (73%), single people (67%), young family (51%) and mature family (46%) households, those with incomes of $60,000-$79,999pa (58%) and over $100,000 pa ($100,000-$149,999pa 51%, $150,000+pa 45%) and respondents residing in regional SA (46%). Gaming via the internet (27%) showed higher responses amongst male (33%) respondents, those aged under 40 years (18-24 years 51%, 25-30 years 33%, 31-39% 32%), other employees (47%), blue collar workers (37%), households that comprise single people (43%), young couples (40%) and middle families (34%), those with incomes below $20,000 pa (40%*) and declined (32%) and slightly more respondents from regional SA (31%). Q4. How often do you access the internet either on a computer, mobile phone or other devices such as an iPad or iPod Touch? (Prompted) Respondents accessing the internet were asked to nominate how often they accessed the internet.
FUSION.COM.AU/OURDIGITALSTATE 34
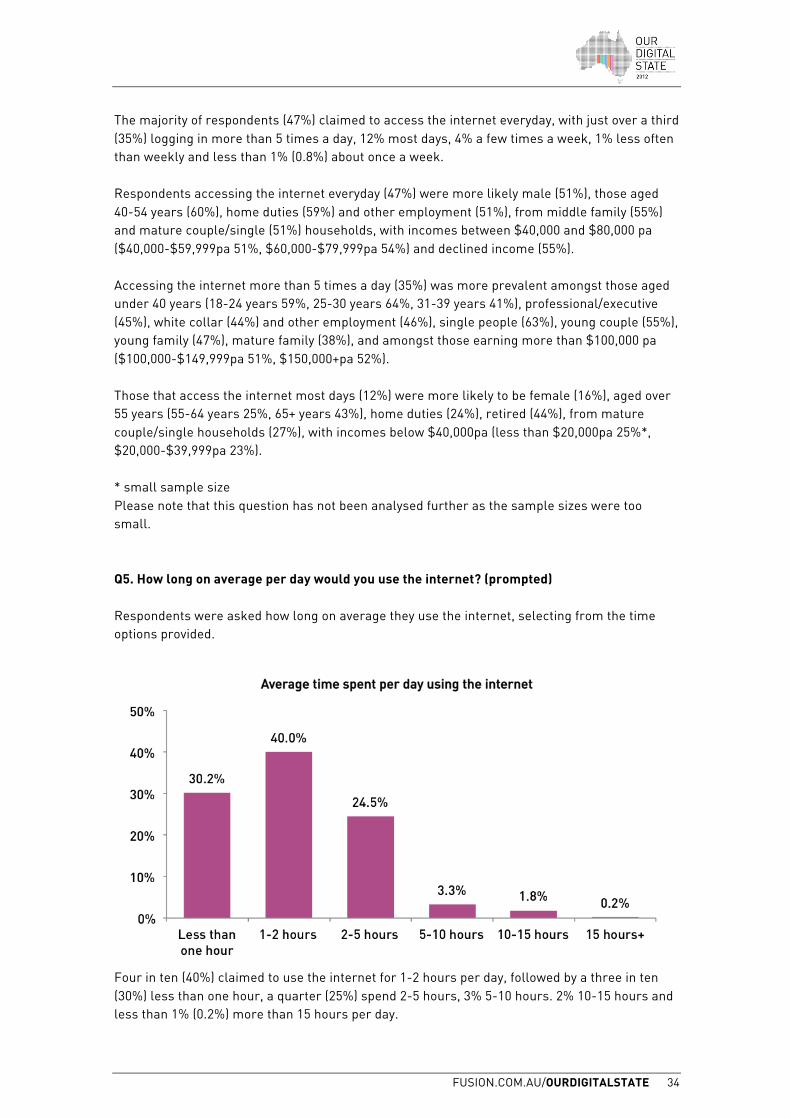
The majority of respondents (47%) claimed to access the internet everyday, with just over a third (35%) logging in more than 5 times a day, 12% most days, 4% a few times a week, 1% less often than weekly and less than 1% (0.8%) about once a week. Respondents accessing the internet everyday (47%) were more likely male (51%), those aged 40-54 years (60%), home duties (59%) and other employment (51%), from middle family (55%) and mature couple/single (51%) households, with incomes between $40,000 and $80,000 pa ($40,000-$59,999pa 51%, $60,000-$79,999pa 54%) and declined income (55%). Accessing the internet more than 5 times a day (35%) was more prevalent amongst those aged under 40 years (18-24 years 59%, 25-30 years 64%, 31-39 years 41%), professional/executive (45%), white collar (44%) and other employment (46%), single people (63%), young couple (55%), young family (47%), mature family (38%), and amongst those earning more than $100,000 pa ($100,000-$149,999pa 51%, $150,000+pa 52%). Those that access the internet most days (12%) were more likely to be female (16%), aged over 55 years (55-64 years 25%, 65+ years 43%), home duties (24%), retired (44%), from mature couple/single households (27%), with incomes below $40,000pa (less than $20,000pa 25%*, $20,000-$39,999pa 23%). * small sample size Please note that this question has not been analysed further as the sample sizes were too small. Q5. How long on average per day would you use the internet? (prompted) Respondents were asked how long on average they use the internet, selecting from the time options provided.
Four in ten (40%) claimed to use the internet for 1-2 hours per day, followed by a three in ten (30%) less than one hour, a quarter (25%) spend 2-5 hours, 3% 5-10 hours. 2% 10-15 hours and less than 1% (0.2%) more than 15 hours per day.
FUSION.COM.AU/OURDIGITALSTATE 35
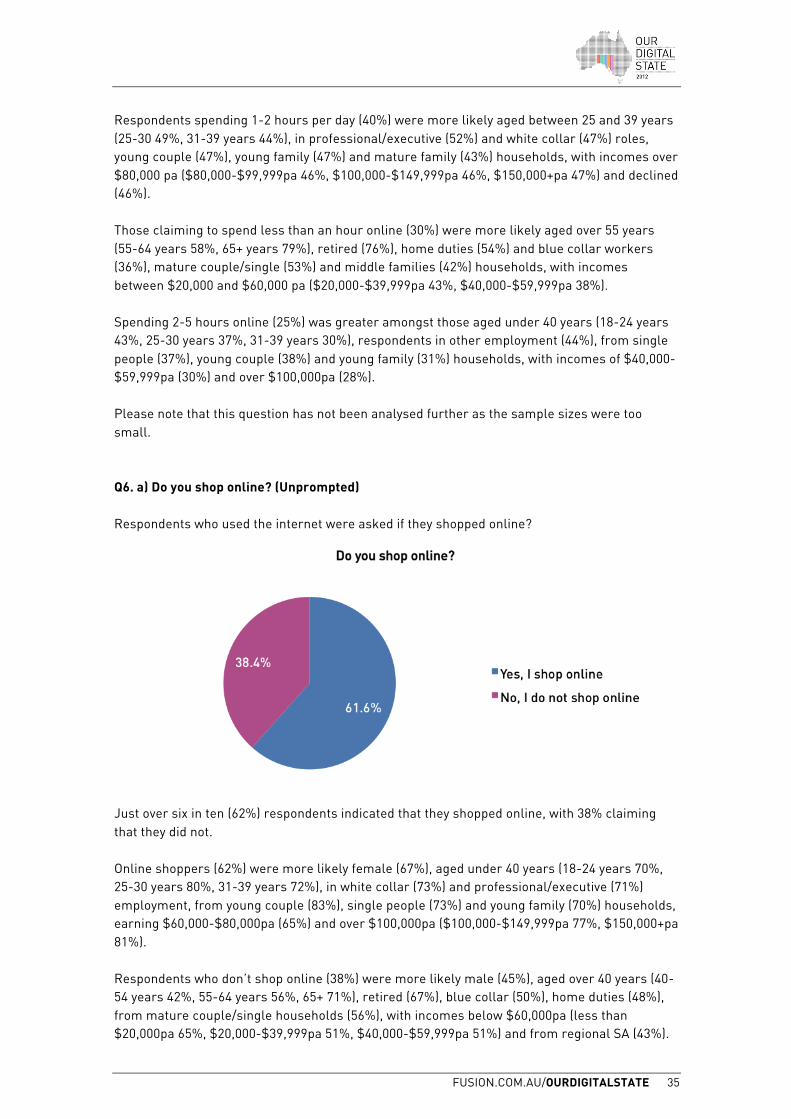
Respondents spending 1-2 hours per day (40%) were more likely aged between 25 and 39 years (25-30 49%, 31-39 years 44%), in professional/executive (52%) and white collar (47%) roles, young couple (47%), young family (47%) and mature family (43%) households, with incomes over $80,000 pa ($80,000-$99,999pa 46%, $100,000-$149,999pa 46%, $150,000+pa 47%) and declined (46%). Those claiming to spend less than an hour online (30%) were more likely aged over 55 years (55-64 years 58%, 65+ years 79%), retired (76%), home duties (54%) and blue collar workers (36%), mature couple/single (53%) and middle families (42%) households, with incomes between $20,000 and $60,000 pa ($20,000-$39,999pa 43%, $40,000-$59,999pa 38%). Spending 2-5 hours online (25%) was greater amongst those aged under 40 years (18-24 years 43%, 25-30 years 37%, 31-39 years 30%), respondents in other employment (44%), from single people (37%), young couple (38%) and young family (31%) households, with incomes of $40,000-$59,999pa (30%) and over $100,000pa (28%). Please note that this question has not been analysed further as the sample sizes were too small. Q6. a) Do you shop online? (Unprompted) Respondents who used the internet were asked if they shopped online?
Just over six in ten (62%) respondents indicated that they shopped online, with 38% claiming that they did not. Online shoppers (62%) were more likely female (67%), aged under 40 years (18-24 years 70%, 25-30 years 80%, 31-39 years 72%), in white collar (73%) and professional/executive (71%) employment, from young couple (83%), single people (73%) and young family (70%) households, earning $60,000-$80,000pa (65%) and over $100,000pa ($100,000-$149,999pa 77%, $150,000+pa 81%). Respondents who don’t shop online (38%) were more likely male (45%), aged over 40 years (40-54 years 42%, 55-64 years 56%, 65+ 71%), retired (67%), blue collar (50%), home duties (48%), from mature couple/single households (56%), with incomes below $60,000pa (less than $20,000pa 65%, $20,000-$39,999pa 51%, $40,000-$59,999pa 51%) and from regional SA (43%).
FUSION.COM.AU/OURDIGITALSTATE 36
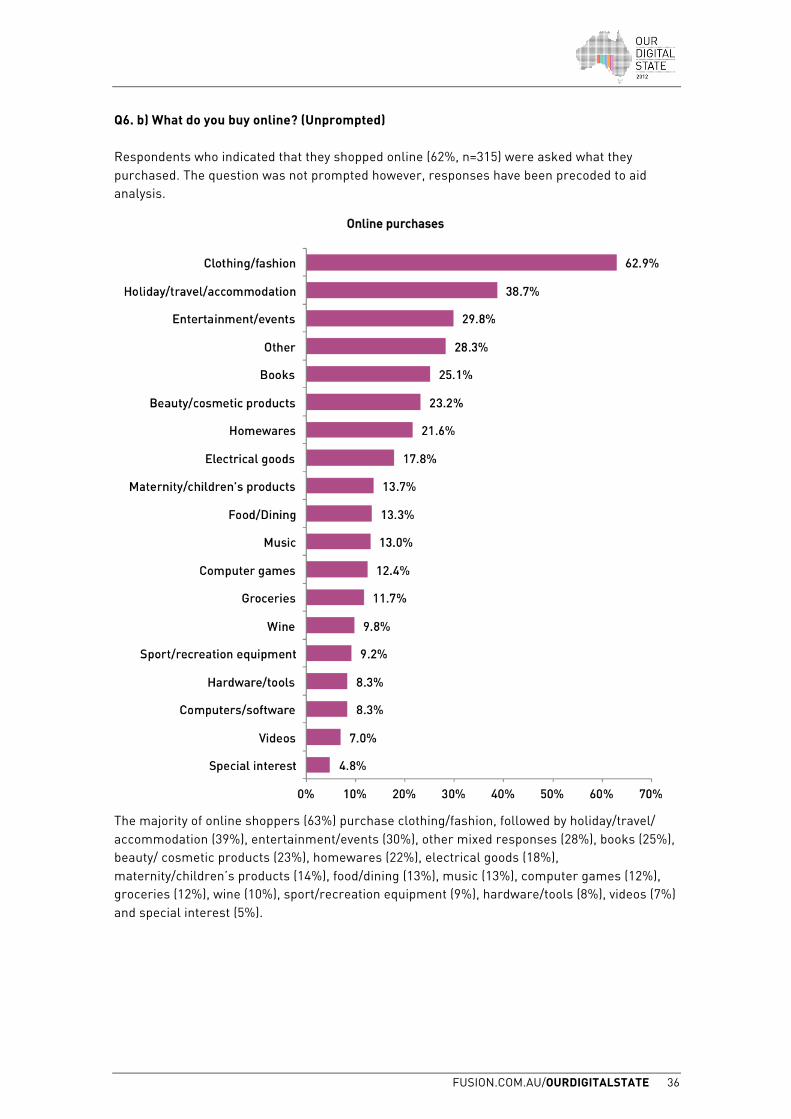
Q6. b) What do you buy online? (Unprompted) Respondents who indicated that they shopped online (62%, n=315) were asked what they purchased. The question was not prompted however, responses have been precoded to aid analysis.
The majority of online shoppers (63%) purchase clothing/fashion, followed by holiday/travel/ accommodation (39%), entertainment/events (30%), other mixed responses (28%), books (25%), beauty/ cosmetic products (23%), homewares (22%), electrical goods (18%), maternity/children’s products (14%), food/dining (13%), music (13%), computer games (12%), groceries (12%), wine (10%), sport/recreation equipment (9%), hardware/tools (8%), videos (7%) and special interest (5%).
FUSION.COM.AU/OURDIGITALSTATE 37
Other responses included: Auto parts (2 responses) Camping gear (2 responses) Car (2 responses) Car Parts and Accessories (8 responses) Cars, kitchen fittings Cars/boats Computer equipment and motorbike parts Drum parts eBay (10 responses) Electronics Fabrics and Craft Equipment (3 responses) Farm equipment, e.g. motors, pumps Farm Machinery Parts (2 responses) Farm supplies Farm Vehicle, sheep yards Fishing gear, coupons, auctions Garden equipment and tools Gardening and organic Go carts Health products Hobby gear
Horse rugs and shoes Jewellery, Shoes, Handbags Luxury items Magazines and Shoes Mobile phone accessories, uniforms Model railway parts Motorbike parts (5 responses) Motorsport equipment Pet Products (Supplies and Food) (7 responses) Pharmacy items, Medication, Blood Testing (4 responses) Phone accessories Plants Printer supplies Scoupon (18 responses) Screen door parts and fittings, office supplies Shoes (3 responses) Tanks Toys (4 responses)
Respondents more likely to have purchased clothing/fashion (63%) online were female (76%), aged under 40 years (18-24 years 71%, 25-30 years 72%, 31-39 years 72%), home duties (79%) and professional/executive (69%), from young family (76%) and young couple (75%) households, with incomes of $100,000-$149,999pa (72%) and $60,000-$79,999pa (68%). Holiday/travel/accommodation (39%) is more more likely purchased online by female (43%) respondents, those aged over 55 years (55-64 years 58%, 65+ years 92%), professional/executives (51%), retirees (50%*), home duties (43%), mature couple/single (58%) households, and those earning in excess of $150,000pa (58%) and $60,000-$79,999pa (42%). Online purchase of entertainment/events (30%) related items is greater amongst respondents aged under 40 years (18-24 years 40%, 25-30 years 33%, 31-39 years 35%), white collar (35%) and blue collar (34%) employees, young family (36%), single people (34%), young couple (33%) and mature family (33%) households, those earning $60,000-$79,999pa (40%) and in excess of $100,000pa ($100,000-$149,999pa 39%, $150,000+pa 36%), and slightly more respondents from regional SA (33%). Books (25%) are purchased online more often by those aged 18-24 years (38%), other employment (48%), single people (32%), young couple (31%) and mature family (31%) households, those earning less than $20,000pa (67%*) and $60,000-$79,999pa (29%) and from regional SA (29%). Those purchasing beauty/cosmetics (23%) online are more likely to be female (37%), aged over 55 years (31%) and 31-39 years (28%), professional/executive (31%), home duties (43%), from
FUSION.COM.AU/OURDIGITALSTATE 38
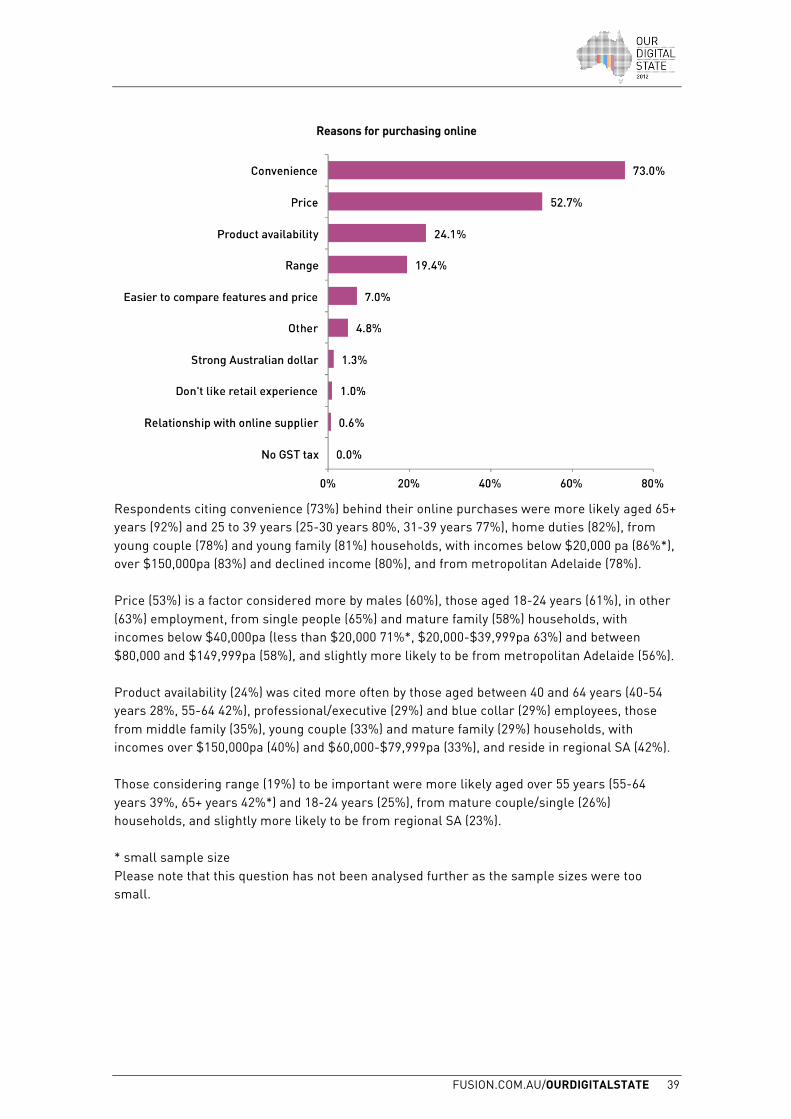
young family (31%) and middle family (27%) households, with incomes over $100,000 pa ($100,000-$149,999pa 35%, $150,000+pa 28%). Homewares (22%) are purchased online more often by female (26%) respondents, those aged between 31 and 54 years (31-39 years 27%, 40-54 years 32%) and 65+ years (31%*), home duties (46%), retired (36%*), professional/executive (31%), middle family (30%), mature couple/single (27%) and young family (26%) households, those earning over $150,000pa (39%) and respondents from regional SA (27%). Online purchase of electrical goods (18%) is greater amongst males (27%), those aged 25-30 years (32%), white collar (24%) employees, young couple (26%) and single people (26%) households, with incomes of between $60,000 and $100,000pa ($60,000-$79,999pa 26%, $80,000-$99,999pa 29%), amongst those from regional SA (26%). Maternity/children’s products (14%) is purchased online more by females (20%), those aged 31-39 years (30%), home duties (46%), young family (43%) and middle family (22%) households, from regional SA (20%). Those purchasing food/dining (13%) is greater amongst those who describe themselves as professional/executive (25%), retired (43%*), from mature couple/single (19%) households, earning over $150,000pa (29%) and slightly more likely from metropolitan Adelaide (16%). Online music purchases (13%) are slighly more likely amongst male respondents (16%) and those aged 18-24 years (26%), blue collar (24%) and other employment (24%), those from young couple (26%) households, and from regional SA (21%). Computer games (12%) purchased online showed higher penetration amongst males (21%), those aged under 30 years (18-24 years 35%, 25-30 years 19%), in other (26%) and blue collar (20%*) employment, from single people (30%) households. * small sample size Please note that this question has not been analysed further as the sample sizes were too small. Q7. Why do you buy products and services online? (Unprompted) Respondents who claimed to shop online (62%, n=315) were asked why they bought products and services online. The question was not prompted however, responses have been precoded to aid analysis. Almost three quarters (73%) of those who shopped online claimed it was for convenience, followed by price (53%), product availability (24%), range (19%), easier to compare features and price (7%), other mixed responses (4%), strong Australian dollar (1.3%), don’t like retail experience (1%) and having a relationship with an online supplier, less than 1% (0.6%). There were no responses for no GST tax. Other responses included: auto parts are only available online, delivery to door, free delivery (2 responses), less hassle, location/isolation/too far from better shops (4 responses), my kids research it themselves then I make final decision/gives kids input, open 24/7 day and night, quicker than going around to shops or travelling in Adelaide, quicker than ordering by mail, time factor, worldwide choices.
FUSION.COM.AU/OURDIGITALSTATE 39
Respondents citing convenience (73%) behind their online purchases were more likely aged 65+ years (92%) and 25 to 39 years (25-30 years 80%, 31-39 years 77%), home duties (82%), from young couple (78%) and young family (81%) households, with incomes below $20,000 pa (86%*), over $150,000pa (83%) and declined income (80%), and from metropolitan Adelaide (78%). Price (53%) is a factor considered more by males (60%), those aged 18-24 years (61%), in other (63%) employment, from single people (65%) and mature family (58%) households, with incomes below $40,000pa (less than $20,000 71%*, $20,000-$39,999pa 63%) and between $80,000 and $149,999pa (58%), and slightly more likely to be from metropolitan Adelaide (56%). Product availability (24%) was cited more often by those aged between 40 and 64 years (40-54 years 28%, 55-64 42%), professional/executive (29%) and blue collar (29%) employees, those from middle family (35%), young couple (33%) and mature family (29%) households, with incomes over $150,000pa (40%) and $60,000-$79,999pa (33%), and reside in regional SA (42%). Those considering range (19%) to be important were more likely aged over 55 years (55-64 years 39%, 65+ years 42%*) and 18-24 years (25%), from mature couple/single (26%) households, and slightly more likely to be from regional SA (23%). * small sample size Please note that this question has not been analysed further as the sample sizes were too small.
FUSION.COM.AU/OURDIGITALSTATE 40
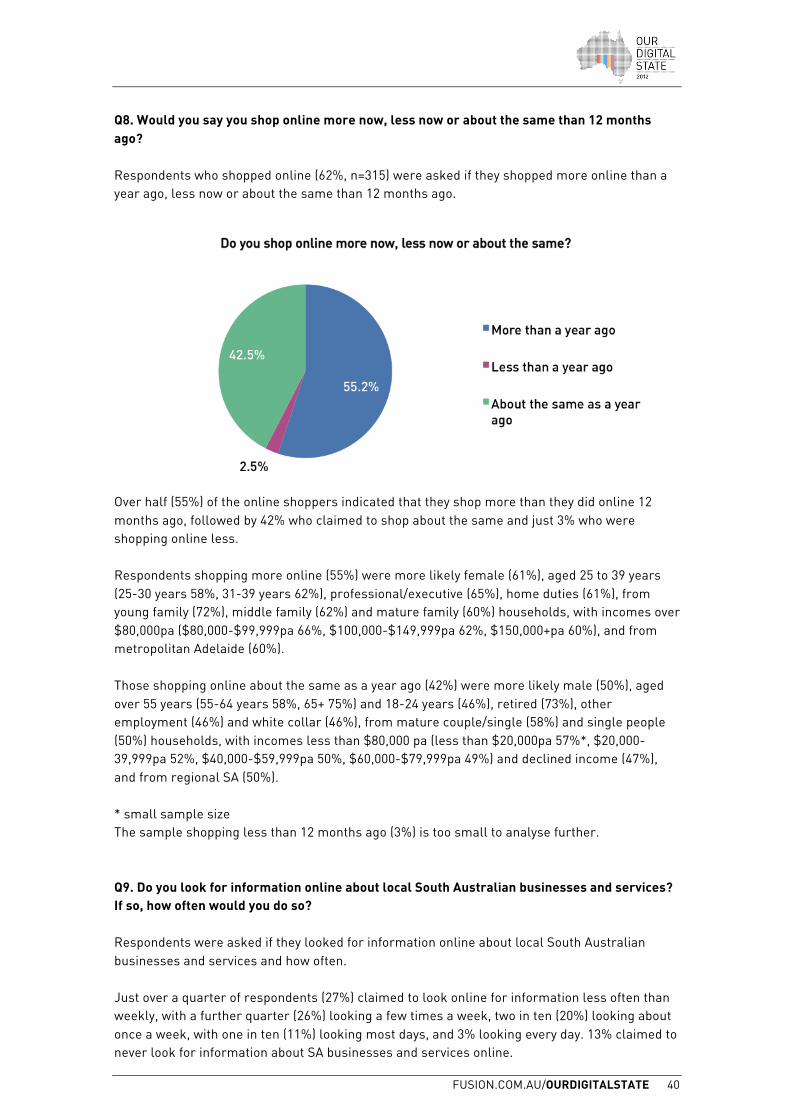
Q8. Would you say you shop online more now, less now or about the same than 12 months ago? Respondents who shopped online (62%, n=315) were asked if they shopped more online than a year ago, less now or about the same than 12 months ago.
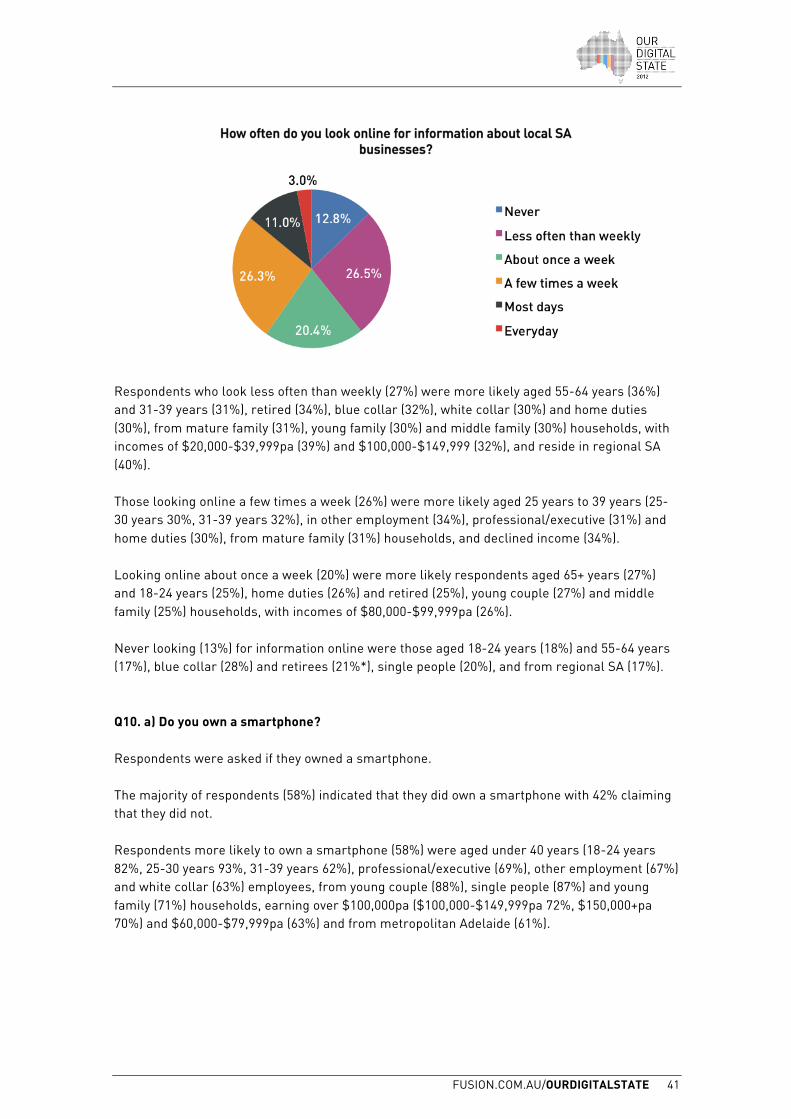
Over half (55%) of the online shoppers indicated that they shop more than they did online 12 months ago, followed by 42% who claimed to shop about the same and just 3% who were shopping online less. Respondents shopping more online (55%) were more likely female (61%), aged 25 to 39 years (25-30 years 58%, 31-39 years 62%), professional/executive (65%), home duties (61%), from young family (72%), middle family (62%) and mature family (60%) households, with incomes over $80,000pa ($80,000-$99,999pa 66%, $100,000-$149,999pa 62%, $150,000+pa 60%), and from metropolitan Adelaide (60%). Those shopping online about the same as a year ago (42%) were more likely male (50%), aged over 55 years (55-64 years 58%, 65+ 75%) and 18-24 years (46%), retired (73%), other employment (46%) and white collar (46%), from mature couple/single (58%) and single people (50%) households, with incomes less than $80,000 pa (less than $20,000pa 57%*, $20,000-39,999pa 52%, $40,000-$59,999pa 50%, $60,000-$79,999pa 49%) and declined income (47%), and from regional SA (50%). * small sample size The sample shopping less than 12 months ago (3%) is too small to analyse further. Q9. Do you look for information online about local South Australian businesses and services? If so, how often would you do so? Respondents were asked if they looked for information online about local South Australian businesses and services and how often. Just over a quarter of respondents (27%) claimed to look online for information less often than weekly, with a further quarter (26%) looking a few times a week, two in ten (20%) looking about once a week, with one in ten (11%) looking most days, and 3% looking every day. 13% claimed to never look for information about SA businesses and services online.
FUSION.COM.AU/OURDIGITALSTATE 41
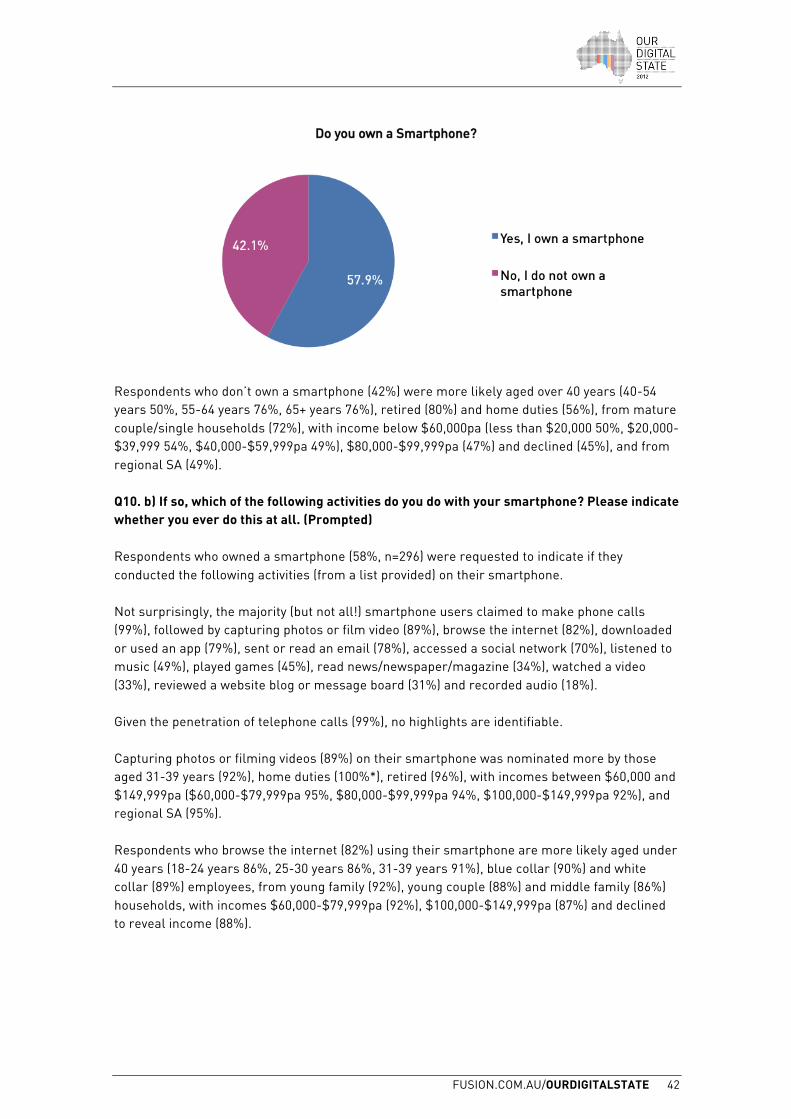
Respondents who look less often than weekly (27%) were more likely aged 55-64 years (36%) and 31-39 years (31%), retired (34%), blue collar (32%), white collar (30%) and home duties (30%), from mature family (31%), young family (30%) and middle family (30%) households, with incomes of $20,000-$39,999pa (39%) and $100,000-$149,999 (32%), and reside in regional SA (40%). Those looking online a few times a week (26%) were more likely aged 25 years to 39 years (25-30 years 30%, 31-39 years 32%), in other employment (34%), professional/executive (31%) and home duties (30%), from mature family (31%) households, and declined income (34%). Looking online about once a week (20%) were more likely respondents aged 65+ years (27%) and 18-24 years (25%), home duties (26%) and retired (25%), young couple (27%) and middle family (25%) households, with incomes of $80,000-$99,999pa (26%). Never looking (13%) for information online were those aged 18-24 years (18%) and 55-64 years (17%), blue collar (28%) and retirees (21%*), single people (20%), and from regional SA (17%). Q10. a) Do you own a smartphone? Respondents were asked if they owned a smartphone. The majority of respondents (58%) indicated that they did own a smartphone with 42% claiming that they did not. Respondents more likely to own a smartphone (58%) were aged under 40 years (18-24 years 82%, 25-30 years 93%, 31-39 years 62%), professional/executive (69%), other employment (67%) and white collar (63%) employees, from young couple (88%), single people (87%) and young family (71%) households, earning over $100,000pa ($100,000-$149,999pa 72%, $150,000+pa 70%) and $60,000-$79,999pa (63%) and from metropolitan Adelaide (61%).
FUSION.COM.AU/OURDIGITALSTATE 42
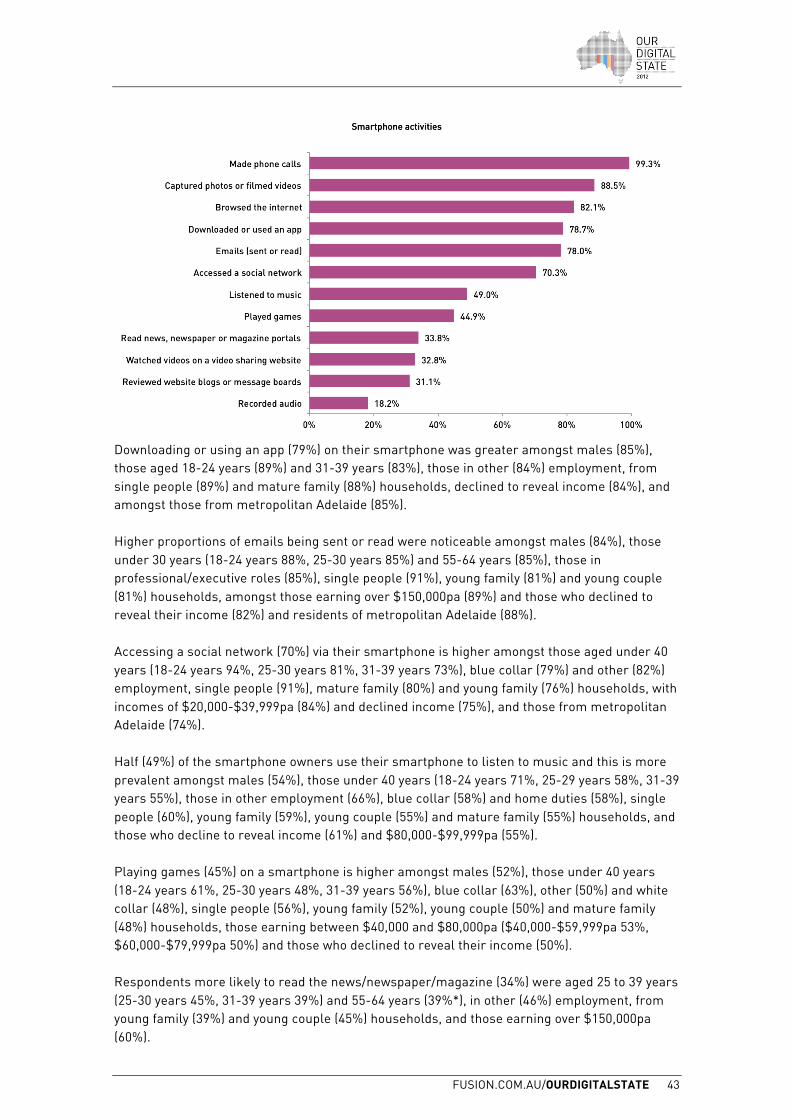
Respondents who don’t own a smartphone (42%) were more likely aged over 40 years (40-54 years 50%, 55-64 years 76%, 65+ years 76%), retired (80%) and home duties (56%), from mature couple/single households (72%), with income below $60,000pa (less than $20,000 50%, $20,000-$39,999 54%, $40,000-$59,999pa 49%), $80,000-$99,999pa (47%) and declined (45%), and from regional SA (49%). Q10. b) If so, which of the following activities do you do with your smartphone? Please indicate whether you ever do this at all. (Prompted) Respondents who owned a smartphone (58%, n=296) were requested to indicate if they conducted the following activities (from a list provided) on their smartphone. Not surprisingly, the majority (but not all!) smartphone users claimed to make phone calls (99%), followed by capturing photos or film video (89%), browse the internet (82%), downloaded or used an app (79%), sent or read an email (78%), accessed a social network (70%), listened to music (49%), played games (45%), read news/newspaper/magazine (34%), watched a video (33%), reviewed a website blog or message board (31%) and recorded audio (18%). Given the penetration of telephone calls (99%), no highlights are identifiable. Capturing photos or filming videos (89%) on their smartphone was nominated more by those aged 31-39 years (92%), home duties (100%*), retired (96%), with incomes between $60,000 and $149,999pa ($60,000-$79,999pa 95%, $80,000-$99,999pa 94%, $100,000-$149,999pa 92%), and regional SA (95%). Respondents who browse the internet (82%) using their smartphone are more likely aged under 40 years (18-24 years 86%, 25-30 years 86%, 31-39 years 91%), blue collar (90%) and white collar (89%) employees, from young family (92%), young couple (88%) and middle family (86%) households, with incomes $60,000-$79,999pa (92%), $100,000-$149,999pa (87%) and declined to reveal income (88%).
FUSION.COM.AU/OURDIGITALSTATE 43
Downloading or using an app (79%) on their smartphone was greater amongst males (85%), those aged 18-24 years (89%) and 31-39 years (83%), those in other (84%) employment, from single people (89%) and mature family (88%) households, declined to reveal income (84%), and amongst those from metropolitan Adelaide (85%). Higher proportions of emails being sent or read were noticeable amongst males (84%), those under 30 years (18-24 years 88%, 25-30 years 85%) and 55-64 years (85%), those in professional/executive roles (85%), single people (91%), young family (81%) and young couple (81%) households, amongst those earning over $150,000pa (89%) and those who declined to reveal their income (82%) and residents of metropolitan Adelaide (88%). Accessing a social network (70%) via their smartphone is higher amongst those aged under 40 years (18-24 years 94%, 25-30 years 81%, 31-39 years 73%), blue collar (79%) and other (82%) employment, single people (91%), mature family (80%) and young family (76%) households, with incomes of $20,000-$39,999pa (84%) and declined income (75%), and those from metropolitan Adelaide (74%). Half (49%) of the smartphone owners use their smartphone to listen to music and this is more prevalent amongst males (54%), those under 40 years (18-24 years 71%, 25-29 years 58%, 31-39 years 55%), those in other employment (66%), blue collar (58%) and home duties (58%), single people (60%), young family (59%), young couple (55%) and mature family (55%) households, and those who decline to reveal income (61%) and $80,000-$99,999pa (55%). Playing games (45%) on a smartphone is higher amongst males (52%), those under 40 years (18-24 years 61%, 25-30 years 48%, 31-39 years 56%), blue collar (63%), other (50%) and white collar (48%), single people (56%), young family (52%), young couple (50%) and mature family (48%) households, those earning between $40,000 and $80,000pa ($40,000-$59,999pa 53%, $60,000-$79,999pa 50%) and those who declined to reveal their income (50%). Respondents more likely to read the news/newspaper/magazine (34%) were aged 25 to 39 years (25-30 years 45%, 31-39 years 39%) and 55-64 years (39%*), in other (46%) employment, from young family (39%) and young couple (45%) households, and those earning over $150,000pa (60%).
FUSION.COM.AU/OURDIGITALSTATE 44
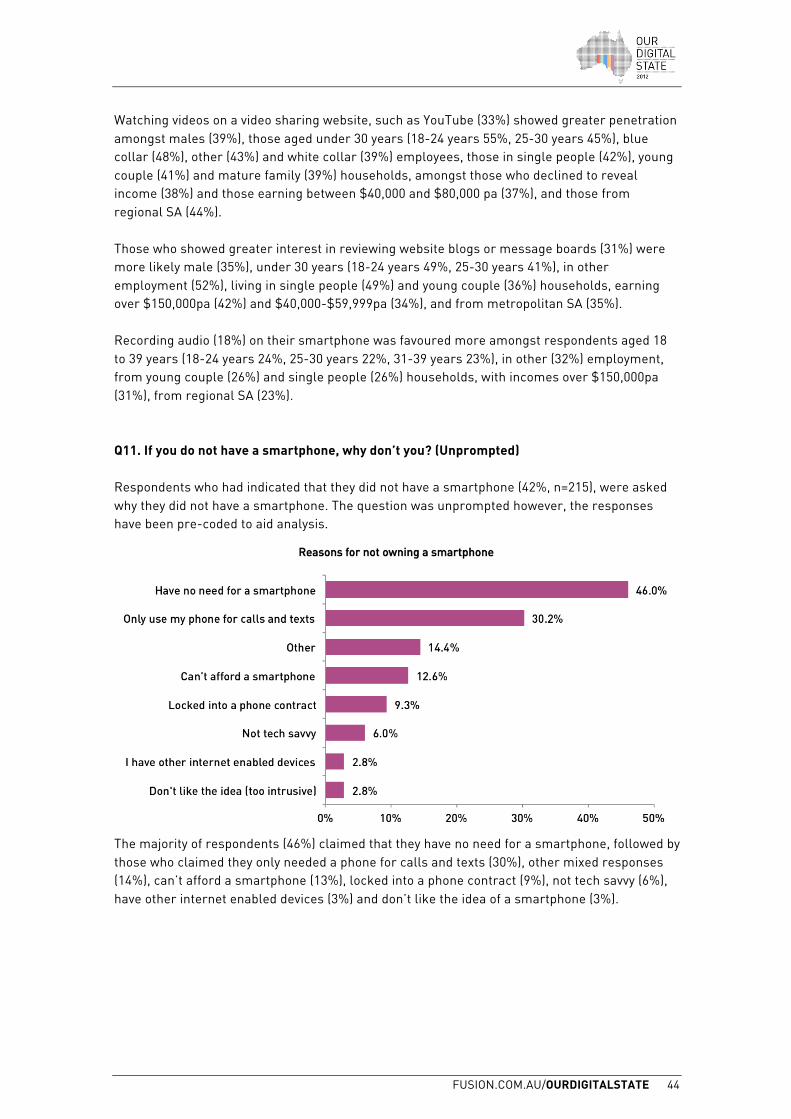
Watching videos on a video sharing website, such as YouTube (33%) showed greater penetration amongst males (39%), those aged under 30 years (18-24 years 55%, 25-30 years 45%), blue collar (48%), other (43%) and white collar (39%) employees, those in single people (42%), young couple (41%) and mature family (39%) households, amongst those who declined to reveal income (38%) and those earning between $40,000 and $80,000 pa (37%), and those from regional SA (44%). Those who showed greater interest in reviewing website blogs or message boards (31%) were more likely male (35%), under 30 years (18-24 years 49%, 25-30 years 41%), in other employment (52%), living in single people (49%) and young couple (36%) households, earning over $150,000pa (42%) and $40,000-$59,999pa (34%), and from metropolitan SA (35%). Recording audio (18%) on their smartphone was favoured more amongst respondents aged 18 to 39 years (18-24 years 24%, 25-30 years 22%, 31-39 years 23%), in other (32%) employment, from young couple (26%) and single people (26%) households, with incomes over $150,000pa (31%), from regional SA (23%). Q11. If you do not have a smartphone, why don’t you? (Unprompted) Respondents who had indicated that they did not have a smartphone (42%, n=215), were asked why they did not have a smartphone. The question was unprompted however, the responses have been pre-coded to aid analysis.
The majority of respondents (46%) claimed that they have no need for a smartphone, followed by those who claimed they only needed a phone for calls and texts (30%), other mixed responses (14%), can’t afford a smartphone (13%), locked into a phone contract (9%), not tech savvy (6%), have other internet enabled devices (3%) and don’t like the idea of a smartphone (3%).
FUSION.COM.AU/OURDIGITALSTATE 45
Other responses included: Activates the internet when not in use and costs me money if I go over my data usage Don't have a mobile Don't know Don't like touch screens Don't need one Don't want (2 responses) Have work phone only I am vision impaired so concerned about ability to use the screens, but am getting one with next contract I prefer to be able to push buttons on phone Just like my current phone (4 responses) No Interest None Not got around to getting one Old one not worn out Phone wouldn’t stand up to my work - I would break the screen Recently had one but was stolen - will get another one soon Touchscreens not reliable in our region (on edge of mobile phone range) Was stolen With southern phone co for regional Australia and mobile coverage is very poor, supposed to be 98% Won't work in area/poor/no reception (8 responses)
Respondents claiming that they have no need for a smartphone (46%) were more likely to be aged over 55 years (55-64 years 57%, 65+ years 50%), blue collar (51%) and professional/executives (50%), from middle family (52%) and mature couple/single (51%) households, with incomes over $100,000pa ($100,000-$149,999pa 63%, over $150,000pa 53%), and live in regional SA (51%). Those claiming to only use their phone for calls and texts (30%) was higher amongst females (37%), those aged over 65 years (53%), home duties (53%), retirees (44%), professional/executives (38%), mature couple/single households (41%), those who declined to reveal their income (39%) and those earning between $20,000 and $60,000pa ($20,000-$39,999pa 35%, $40,000-$59,999pa 38%). The remaining options were too small to analyse further.
FUSION.COM.AU/OURDIGITALSTATE 46
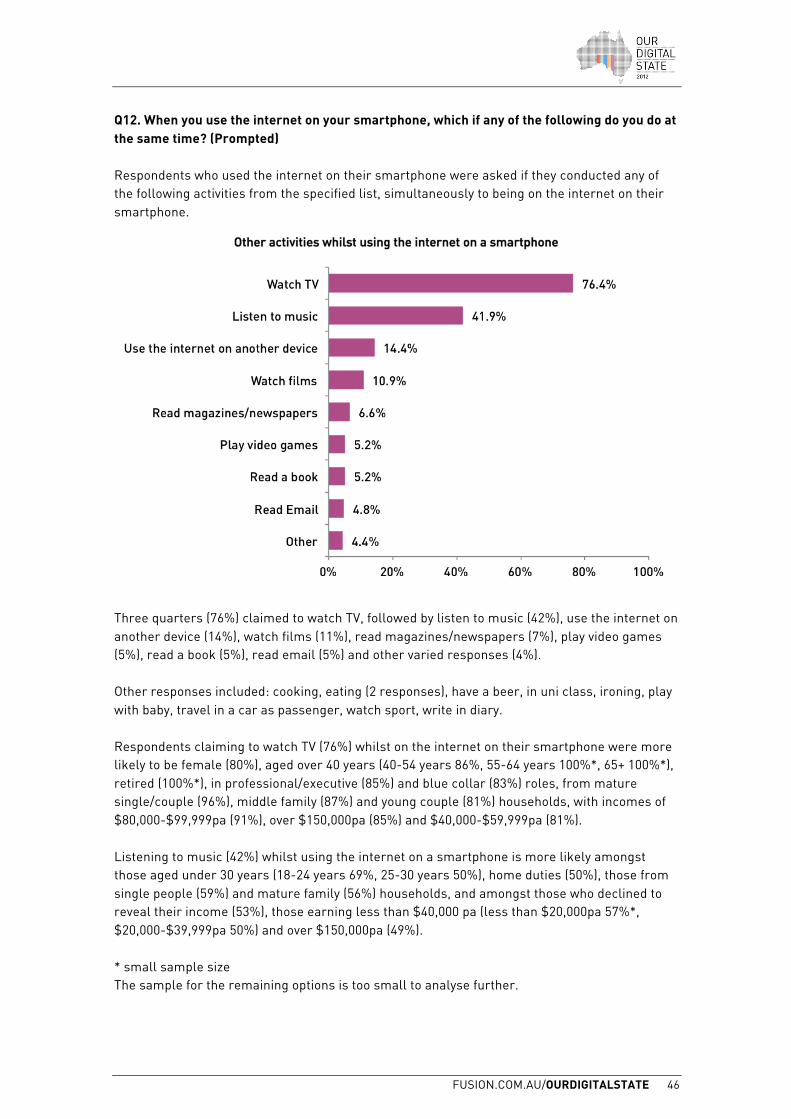
Q12. When you use the internet on your smartphone, which if any of the following do you do at the same time? (Prompted) Respondents who used the internet on their smartphone were asked if they conducted any of the following activities from the specified list, simultaneously to being on the internet on their smartphone.
Three quarters (76%) claimed to watch TV, followed by listen to music (42%), use the internet on another device (14%), watch films (11%), read magazines/newspapers (7%), play video games (5%), read a book (5%), read email (5%) and other varied responses (4%). Other responses included: cooking, eating (2 responses), have a beer, in uni class, ironing, play with baby, travel in a car as passenger, watch sport, write in diary. Respondents claiming to watch TV (76%) whilst on the internet on their smartphone were more likely to be female (80%), aged over 40 years (40-54 years 86%, 55-64 years 100%*, 65+ 100%*), retired (100%*), in professional/executive (85%) and blue collar (83%) roles, from mature single/couple (96%), middle family (87%) and young couple (81%) households, with incomes of $80,000-$99,999pa (91%), over $150,000pa (85%) and $40,000-$59,999pa (81%). Listening to music (42%) whilst using the internet on a smartphone is more likely amongst those aged under 30 years (18-24 years 69%, 25-30 years 50%), home duties (50%), those from single people (59%) and mature family (56%) households, and amongst those who declined to reveal their income (53%), those earning less than $40,000 pa (less than $20,000pa 57%*, $20,000-$39,999pa 50%) and over $150,000pa (49%). * small sample size The sample for the remaining options is too small to analyse further.
FUSION.COM.AU/OURDIGITALSTATE 47
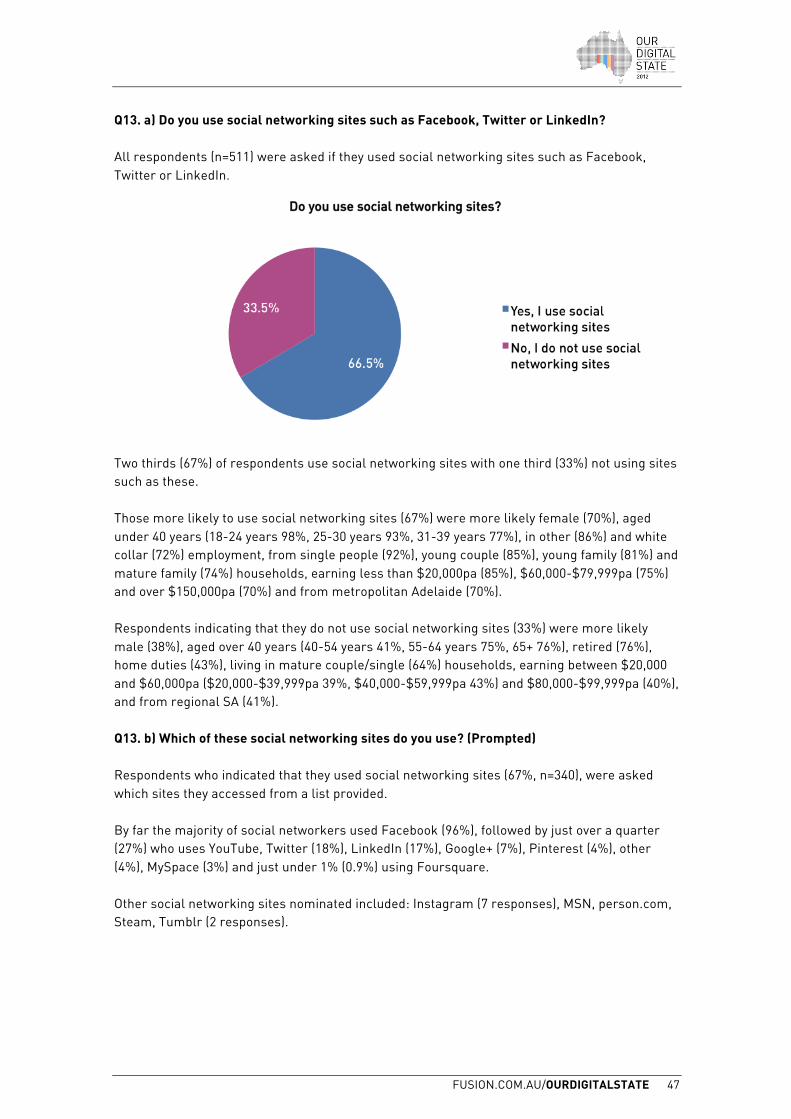
Q13. a) Do you use social networking sites such as Facebook, Twitter or LinkedIn? All respondents (n=511) were asked if they used social networking sites such as Facebook, Twitter or LinkedIn.
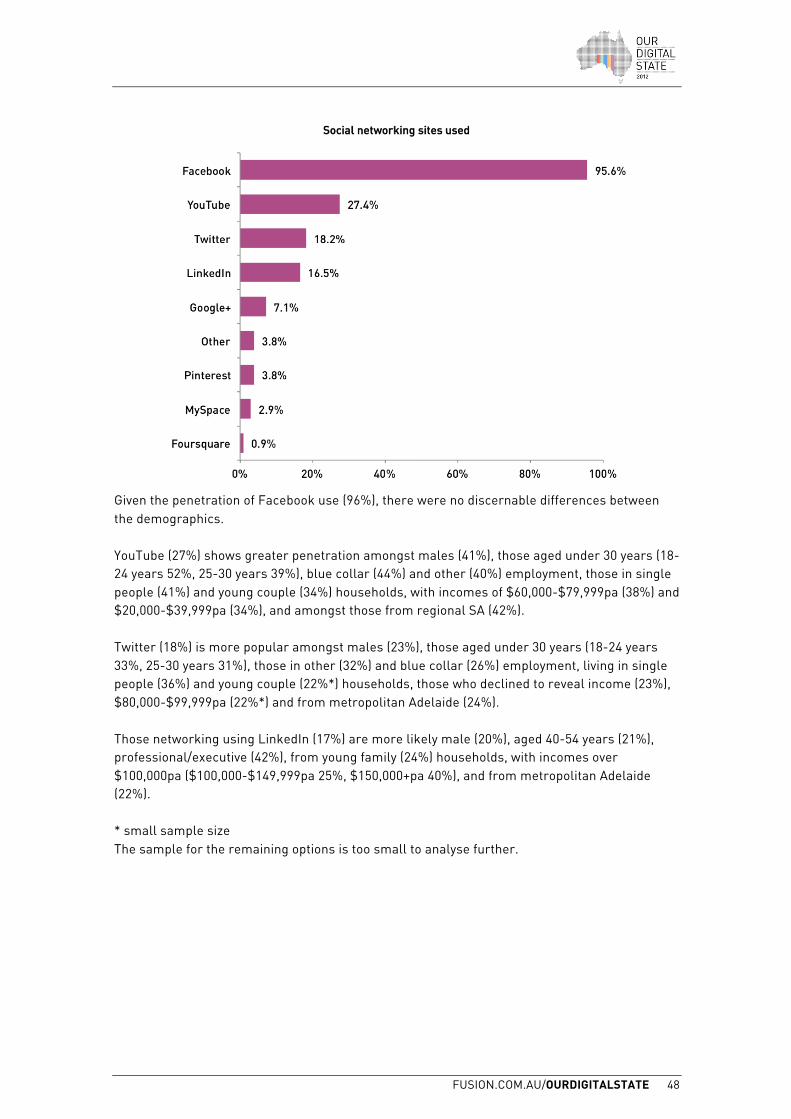
Two thirds (67%) of respondents use social networking sites with one third (33%) not using sites such as these. Those more likely to use social networking sites (67%) were more likely female (70%), aged under 40 years (18-24 years 98%, 25-30 years 93%, 31-39 years 77%), in other (86%) and white collar (72%) employment, from single people (92%), young couple (85%), young family (81%) and mature family (74%) households, earning less than $20,000pa (85%), $60,000-$79,999pa (75%) and over $150,000pa (70%) and from metropolitan Adelaide (70%). Respondents indicating that they do not use social networking sites (33%) were more likely male (38%), aged over 40 years (40-54 years 41%, 55-64 years 75%, 65+ 76%), retired (76%), home duties (43%), living in mature couple/single (64%) households, earning between $20,000 and $60,000pa ($20,000-$39,999pa 39%, $40,000-$59,999pa 43%) and $80,000-$99,999pa (40%), and from regional SA (41%). Q13. b) Which of these social networking sites do you use? (Prompted) Respondents who indicated that they used social networking sites (67%, n=340), were asked which sites they accessed from a list provided. By far the majority of social networkers used Facebook (96%), followed by just over a quarter (27%) who uses YouTube, Twitter (18%), LinkedIn (17%), Google+ (7%), Pinterest (4%), other (4%), MySpace (3%) and just under 1% (0.9%) using Foursquare. Other social networking sites nominated included: Instagram (7 responses), MSN, person.com, Steam, Tumblr (2 responses).
FUSION.COM.AU/OURDIGITALSTATE 48
Given the penetration of Facebook use (96%), there were no discernable differences between the demographics. YouTube (27%) shows greater penetration amongst males (41%), those aged under 30 years (18-24 years 52%, 25-30 years 39%), blue collar (44%) and other (40%) employment, those in single people (41%) and young couple (34%) households, with incomes of $60,000-$79,999pa (38%) and $20,000-$39,999pa (34%), and amongst those from regional SA (42%). Twitter (18%) is more popular amongst males (23%), those aged under 30 years (18-24 years 33%, 25-30 years 31%), those in other (32%) and blue collar (26%) employment, living in single people (36%) and young couple (22%*) households, those who declined to reveal income (23%), $80,000-$99,999pa (22%*) and from metropolitan Adelaide (24%). Those networking using LinkedIn (17%) are more likely male (20%), aged 40-54 years (21%), professional/executive (42%), from young family (24%) households, with incomes over $100,000pa ($100,000-$149,999pa 25%, $150,000+pa 40%), and from metropolitan Adelaide (22%). * small sample size The sample for the remaining options is too small to analyse further.
FUSION.COM.AU/OURDIGITALSTATE 49
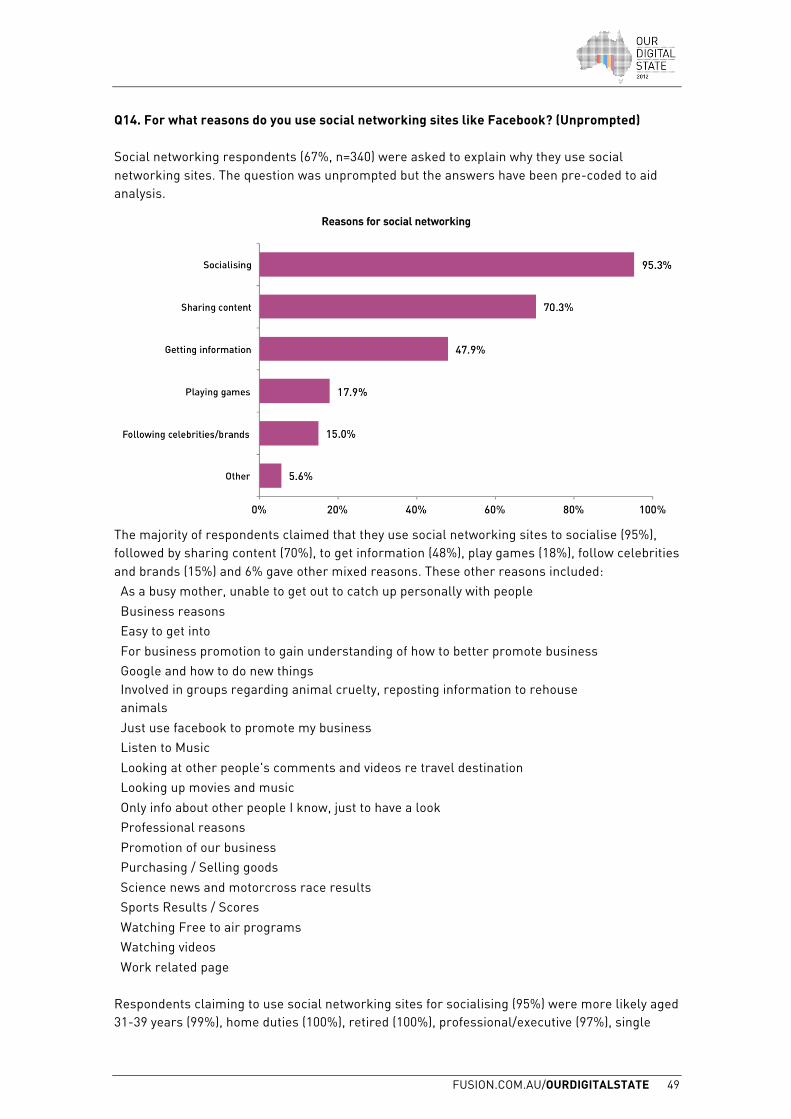
Q14. For what reasons do you use social networking sites like Facebook? (Unprompted) Social networking respondents (67%, n=340) were asked to explain why they use social networking sites. The question was unprompted but the answers have been pre-coded to aid analysis.
The majority of respondents claimed that they use social networking sites to socialise (95%), followed by sharing content (70%), to get information (48%), play games (18%), follow celebrities and brands (15%) and 6% gave other mixed reasons. These other reasons included: As a busy mother, unable to get out to catch up personally with people Business reasons Easy to get into For business promotion to gain understanding of how to better promote business Google and how to do new things Involved in groups regarding animal cruelty, reposting information to rehouse animals Just use facebook to promote my business Listen to Music Looking at other people's comments and videos re travel destination Looking up movies and music Only info about other people I know, just to have a look Professional reasons Promotion of our business Purchasing / Selling goods Science news and motorcross race results Sports Results / Scores Watching Free to air programs Watching videos Work related page
Respondents claiming to use social networking sites for socialising (95%) were more likely aged 31-39 years (99%), home duties (100%), retired (100%), professional/executive (97%), single
FUSION.COM.AU/OURDIGITALSTATE 50
people households (98%), with incomes of less than $20,000pa (100%), $40,000-$59,999pa (100%) and $100,000-$149,999pa (100%). Sharing content (70%) was more likely amongst those who are under 30 years of age (18-24 years 79%, 25-30 years 78%), in other (81%) employment, from single people (81%) and young couple (76%) households, earning $80,000-$99,999pa (83%) and less than $20,000pa (82%). Using social networking sites to get information showed greater appeal amongst those aged between 25 and 39 years (25-30 years 58%, 31-39 years 51%), those in professional/executive (55%) and other (51%) roles, with incomes over $100,000pa ($100,000-$149,999pa 55%, over $150,000pa 60%) and $20,000-$39,999pa (51%), and those from regional SA (54%). Playing games (18%) is more likely amongst those aged 18-24 years (28%), blue collar (26%) and home duties (23%*), middle family (28%), single people (22%) and young couple (22%*) households, and amongst those in regional SA (22%). Those choosing to follow celebrities and brands (15%) through social networking sites are more likely female (18%), aged under 40 years (18-24 years 22%, 25-30 years 19%, 31-39 years 19%), in other (25%) and home duties (23%*) roles, living in single people (21%), young couple (20%*) and middle family (20%) households, earning less than $40,000pa (less than $20,000 24%*, $20,000-$39,999pa 24%), and those from regional SA (21%). * small sample size
FUSION.COM.AU/OURDIGITALSTATE 51
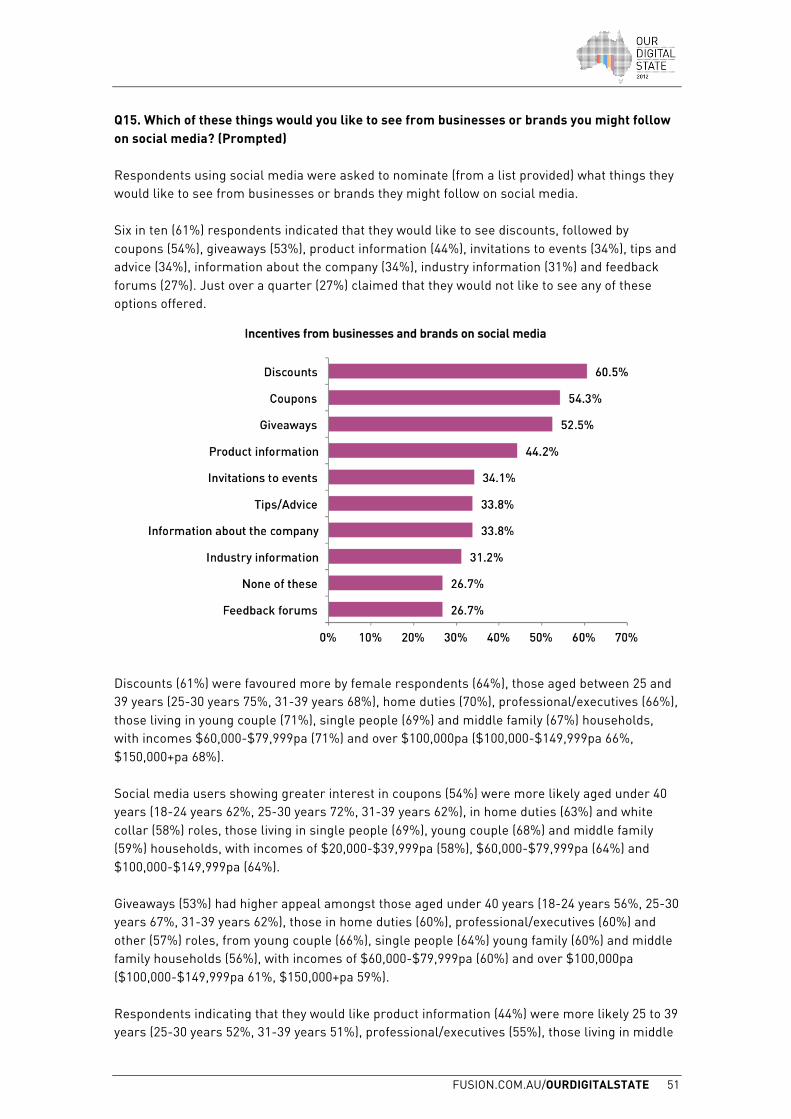
Q15. Which of these things would you like to see from businesses or brands you might follow on social media? (Prompted) Respondents using social media were asked to nominate (from a list provided) what things they would like to see from businesses or brands they might follow on social media. Six in ten (61%) respondents indicated that they would like to see discounts, followed by coupons (54%), giveaways (53%), product information (44%), invitations to events (34%), tips and advice (34%), information about the company (34%), industry information (31%) and feedback forums (27%). Just over a quarter (27%) claimed that they would not like to see any of these options offered.
Discounts (61%) were favoured more by female respondents (64%), those aged between 25 and 39 years (25-30 years 75%, 31-39 years 68%), home duties (70%), professional/executives (66%), those living in young couple (71%), single people (69%) and middle family (67%) households, with incomes $60,000-$79,999pa (71%) and over $100,000pa ($100,000-$149,999pa 66%, $150,000+pa 68%). Social media users showing greater interest in coupons (54%) were more likely aged under 40 years (18-24 years 62%, 25-30 years 72%, 31-39 years 62%), in home duties (63%) and white collar (58%) roles, those living in single people (69%), young couple (68%) and middle family (59%) households, with incomes of $20,000-$39,999pa (58%), $60,000-$79,999pa (64%) and $100,000-$149,999pa (64%). Giveaways (53%) had higher appeal amongst those aged under 40 years (18-24 years 56%, 25-30 years 67%, 31-39 years 62%), those in home duties (60%), professional/executives (60%) and other (57%) roles, from young couple (66%), single people (64%) young family (60%) and middle family households (56%), with incomes of $60,000-$79,999pa (60%) and over $100,000pa ($100,000-$149,999pa 61%, $150,000+pa 59%). Respondents indicating that they would like product information (44%) were more likely 25 to 39 years (25-30 years 52%, 31-39 years 51%), professional/executives (55%), those living in middle
FUSION.COM.AU/OURDIGITALSTATE 52
family (62%) and young family (51%) households, with incomes $60,000-$79,999pa (49%) and over $100,000pa ($100,000-$149,999pa 57%, $150,000+pa 59%), and from regional SA (60%). Invitations to events (34%) showed greater appeal amongst those aged under 40 years (18-24 years 42%, 25-30 years 45%, 31-39 years 42%), those in home duties (47%) and other (41%) employment, from young couple (42%), young family (42%) and single people (41%) households, with incomes $20,000-$39,999pa (45%) and over $150,000pa (39%). Those favouring information about the company (34%) were more likely aged 25 to 39 years (25-30 years 39%, 31-39 years 40%), professional/executive (42%), from middle family (41%) households, earning over $150,000pa (46%) or declined income (38%), and from regional SA (44%). Tips and advice (34%) held more appeal amongst those aged 31-39 years (42%), white collar (38%), professional/executives (38%), those living in middle family (49%) and young family (45%) households, with incomes over $100,000pa ($100,000-$149,999pa 41%, $150,000+pa 43%), and amongst those from regional SA (47%). Respondents who were more likely to seek out industry information (31%) were aged 25 to 39 years (25-30 38%, 31-39 years 42%), professional/executives (46%) and white collar (37%) employees, living in middle family (41%) and young family (39%), earning over $100,000pa (39%), and slightly more from regional SA (34%). Feedback forums (27%) held more appeal amongst those aged 25 to 40 years (25-30 years 38%, 31-39 years 31%), those in other (27%) employment, living in young family (34%) and middle family (33%) households, with incomes over $150,000pa (34%), from regional SA (37%). Respondents claiming to not be interested in any of these added value options (27%) were more likely male (32%), aged over 40 years (40-54 years 41%, 55-64 years 40%* 65+ years 60%*), retired (75%*) and blue collar (35%), living in mature couple/single (57%) households, with incomes less than $40,000pa (less than $20,000pa 65%*, $20,000-$39,999pa 33%) and $80,000-$99,999pa (32%). * small sample size.
FUSION.COM.AU/OURDIGITALSTATE 53
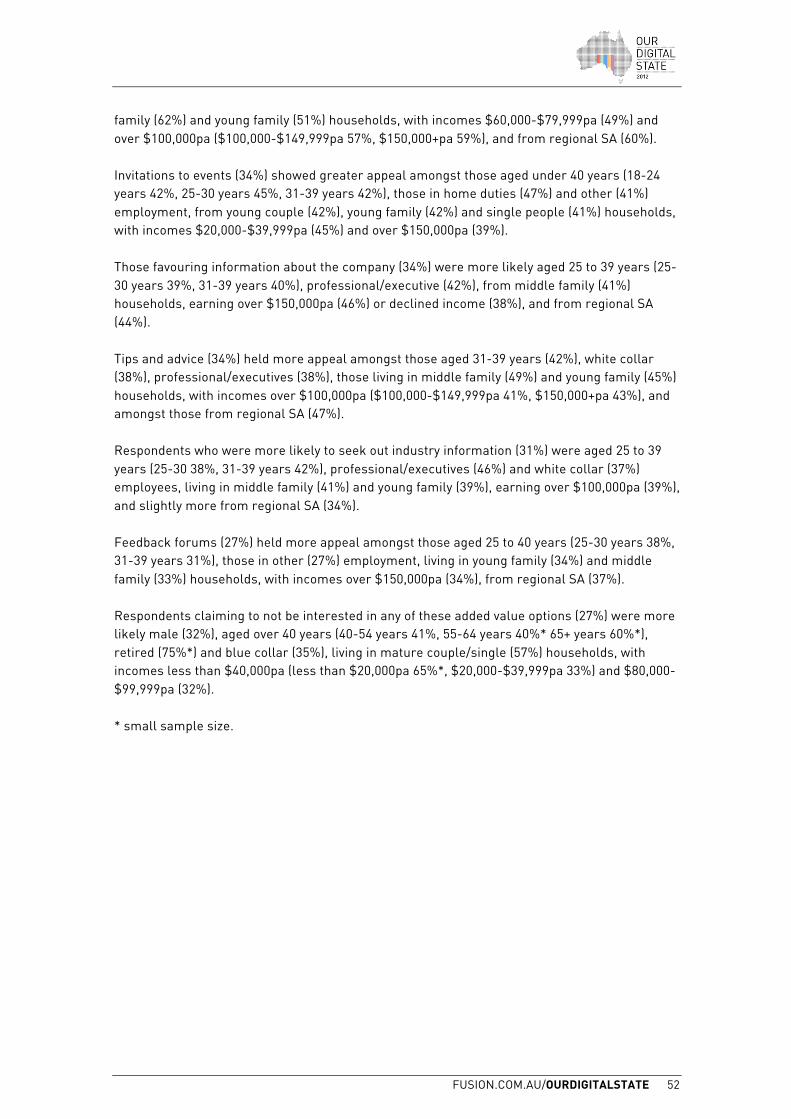
Q16. Have you unliked any business or brands on Facebook? If so, why have you unliked them? (Unprompted) Of the sample who are on Facebook (96% of the social networking sample, n=325), 30% have never liked a business or brand on Facebook, 29% have unliked a business or brand and 41% still like a business or brand on Facebook.
The reasons for unliking a business or brand on Facebook comprised posting too frequently (48%), uniteresting content (37%), I decided I didn’t want to like them anymore (32%), no new content (9%), nothing in it for me (5%), business not popular (2%) and never heard from them again (1%). There were no responses for ‘I moved so not local anymore’.
FUSION.COM.AU/OURDIGITALSTATE 54
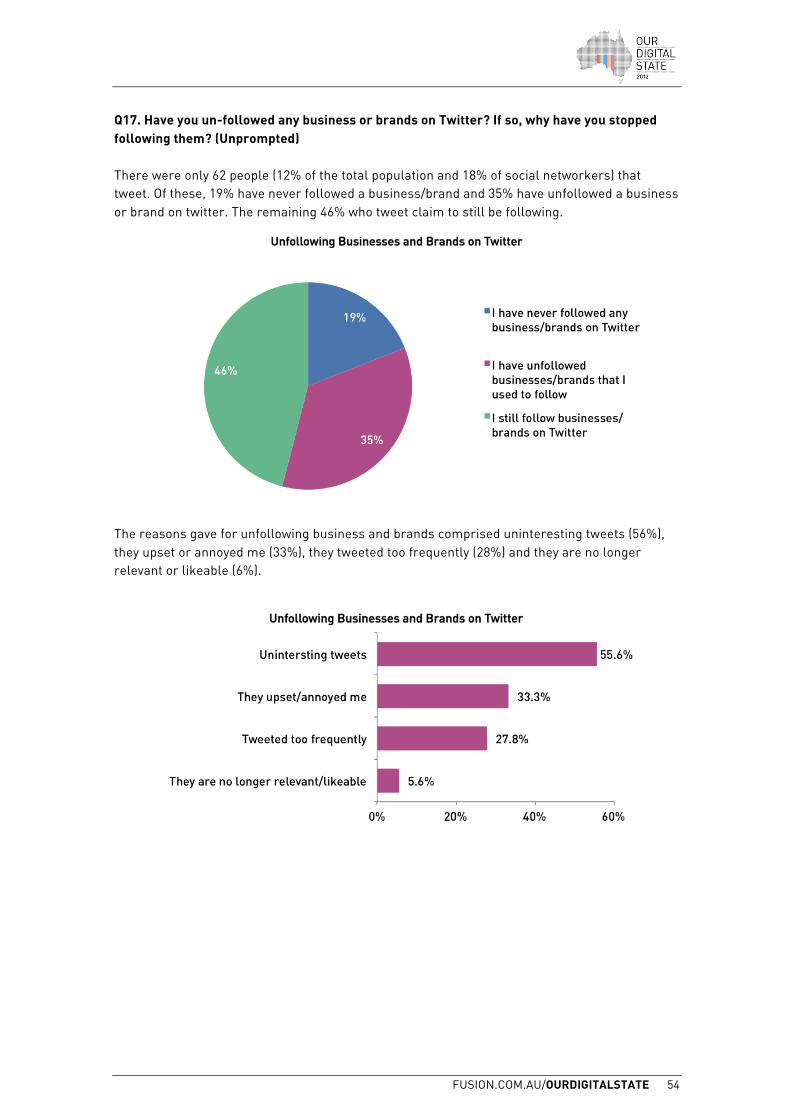
Q17. Have you un-followed any business or brands on Twitter? If so, why have you stopped following them? (Unprompted) There were only 62 people (12% of the total population and 18% of social networkers) that tweet. Of these, 19% have never followed a business/brand and 35% have unfollowed a business or brand on twitter. The remaining 46% who tweet claim to still be following.
The reasons gave for unfollowing business and brands comprised uninteresting tweets (56%), they upset or annoyed me (33%), they tweeted too frequently (28%) and they are no longer relevant or likeable (6%).
FUSION.COM.AU/OURDIGITALSTATE 55
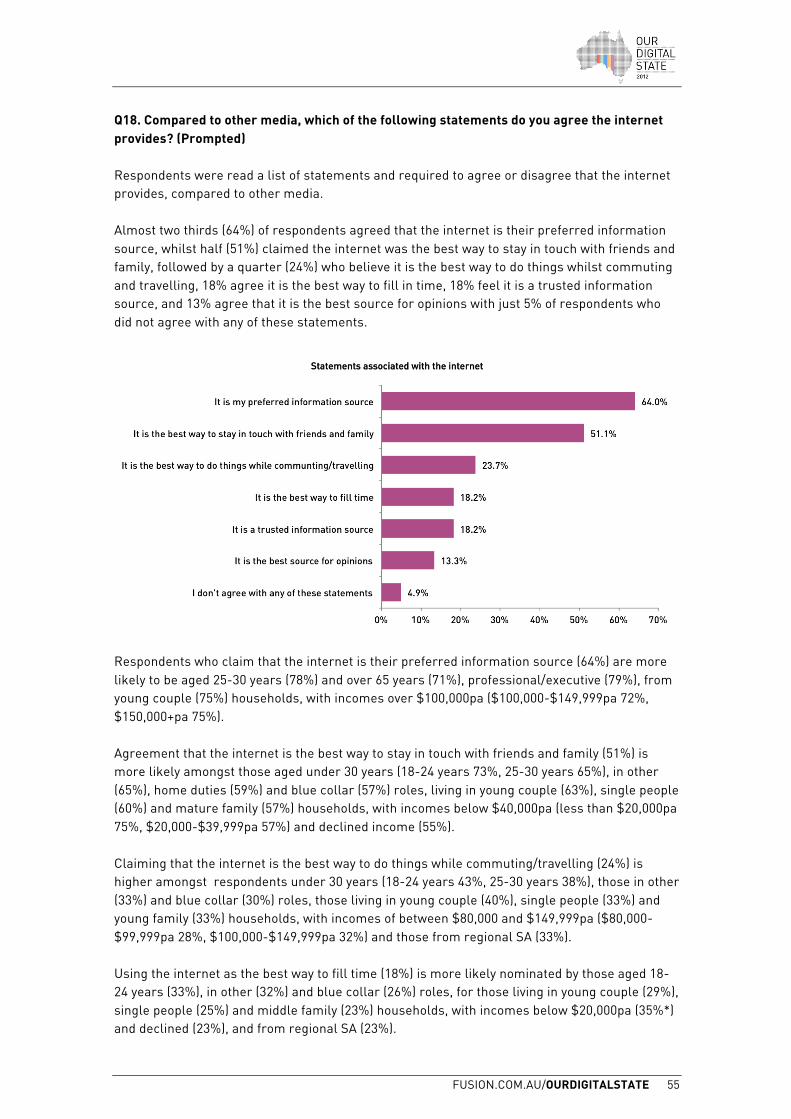
Q18. Compared to other media, which of the following statements do you agree the internet provides? (Prompted) Respondents were read a list of statements and required to agree or disagree that the internet provides, compared to other media. Almost two thirds (64%) of respondents agreed that the internet is their preferred information source, whilst half (51%) claimed the internet was the best way to stay in touch with friends and family, followed by a quarter (24%) who believe it is the best way to do things whilst commuting and travelling, 18% agree it is the best way to fill in time, 18% feel it is a trusted information source, and 13% agree that it is the best source for opinions with just 5% of respondents who did not agree with any of these statements.
Respondents who claim that the internet is their preferred information source (64%) are more likely to be aged 25-30 years (78%) and over 65 years (71%), professional/executive (79%), from young couple (75%) households, with incomes over $100,000pa ($100,000-$149,999pa 72%, $150,000+pa 75%). Agreement that the internet is the best way to stay in touch with friends and family (51%) is more likely amongst those aged under 30 years (18-24 years 73%, 25-30 years 65%), in other (65%), home duties (59%) and blue collar (57%) roles, living in young couple (63%), single people (60%) and mature family (57%) households, with incomes below $40,000pa (less than $20,000pa 75%, $20,000-$39,999pa 57%) and declined income (55%). Claiming that the internet is the best way to do things while commuting/travelling (24%) is higher amongst respondents under 30 years (18-24 years 43%, 25-30 years 38%), those in other (33%) and blue collar (30%) roles, those living in young couple (40%), single people (33%) and young family (33%) households, with incomes of between $80,000 and $149,999pa ($80,000-$99,999pa 28%, $100,000-$149,999pa 32%) and those from regional SA (33%). Using the internet as the best way to fill time (18%) is more likely nominated by those aged 18-24 years (33%), in other (32%) and blue collar (26%) roles, for those living in young couple (29%), single people (25%) and middle family (23%) households, with incomes below $20,000pa (35%*) and declined (23%), and from regional SA (23%).
FUSION.COM.AU/OURDIGITALSTATE 56
The internet as a trusted information source (18%) is nominated more often by those aged 55-64 years (25%), retirees (22%), from middle family (24%) households, with incomes $80,000-$99,999pa (25%), and from regional SA (28%). The best source for opinions (13%) was higher amongst those aged 18-24 years (19%), those in other (21%) and blue collar (18%) roles, young family (18%) households, and amongst those from regional SA (28%).
REFERENCES & AUTHORS

FUSION.COM.AU/OURDIGITALSTATE 59
REFERENCES
• Google’s Mobile Planet: Australia study that examined the mobile consumer (May, 2012) • The Yellow Social Media Report: Australia (2012) • Sensis Social Media Report (May, 2011) • comScore’s State of the Internet: Australia (February, 2011)
Full report references can be downloaded from fusion.com.au/ourdigitalstate
AUTHORS
Fusion is a South Australia based innovation agency that connects people with brands and is passionate about creating experiences people love. fusion.com.au
Intuito is a specialist marketing research firm located in Adelaide providing custom marketing research solutions for finance, education, packaged goods, business to business, local government, government, retails and not for profits.

Top Related