


Languages
Pages
Legal


Orientation and capturing of antibody affinity
ligands: Applications to surface plasmon
resonance biochips
Gunnar Bergström and Carl-Fredrik Mandenius
Linköping University Post Print
N.B.: When citing this work, cite the original article.
Original Publication:
Gunnar Bergström and Carl-Fredrik Mandenius, Orientation and capturing of antibody
affinity ligands: Applications to surface plasmon resonance biochips, 2011, Sensors and
actuators. B, Chemical, (158), 1, 265-270.
http://dx.doi.org/10.1016/j.snb.2011.06.017
Copyright: Elsevier
http://www.elsevier.com/
Postprint available at: Linköping University Electronic Press
http://urn.kb.se/resolve?urn=urn:nbn:se:liu:diva-71770

Orientation and capturing of antibody affinity ligands: applications
to surface plasmon resonance biochips
Gunnar Bergström, Carl-Fredrik Mandenius
Division of Biotechnology/IFM, Linköping University, 581 83 Linköping, Sweden
Abstract
A surface plasmon resonance (SPR) sensor chip with immobilized protein G was used for
simultaneously capturing, purifying and orienting antibody ligands. The ligands were further
stabilized by chemical cross-linking. This procedure of designing the sensor chip improved
efficient use of the ligands and could prolong the analytical use.
The procedure was evaluated on standard dextran-coated sensor chips onto which commercial
semi-purified antibodies toward human serum albumin and human troponin where captured
and used for analysing their antigens.
The procedure demonstrates a general design approach for presenting the biorecognition
element on a biosensor surface which enhances sensitivity, stability and selectivity at the same
time as an impure ligand is purified.
Keywords
Biosensor; Affinity interaction; SPR; Biacore; Protein G; Sensor chip

2
1. Introduction
Surface sensitive biosensors, such as surface plasmon resonance (SPR) and surface acoustic
wave sensors, require elaborate design of the sensing surfaces in order to accomplish
favourable orientation, high purity, long-term stability, and high activity of their capturing
ligands [1-4]. By applying a primary layer of ligand on the surface with more than one
capturing site, e.g., protein G or protein A, the orientation and purity can be enhanced and
allow regeneration of a secondary capturing ligand [2, 5-9]. By carrying out the orientation
and purification of the candidate ligand antibodies simultaneously the need for purification
prior to immobilisation is circumvented. Also, evaluation of different ligands, such as
antibodies or antibody fragments, can be done with a lesser number of sensor surfaces. By
subsequently cross-linking the ligands, their stability can be further improved [2].
Both protein G and protein A are well established as ligands in analytical and preparatory
affinity chromatography [10-15]. Protein G, in particular, has been shown to be useful in a
variety of bioanalytical applications for efficient capturing and orientation of IgG antibodies
for bacterial detection [16-19] in kinetic studies [20] and for IgG quantification in industrial
applications [5]. Protein G is derived from group C and G Streptococcus, while protein A is
from Staphylococcus aureus [21]. Although they have overlapping binding sites on the
antibody Fc region, there are no structural similarities between protein G and protein A.
Protein G binds a wider range of antibody subtypes, often with higher affinity. The main
interaction between protein G and the antibody is at the Fc part of the antibody in the
interface between heavy chain constant domain 2 and 3. Native protein G also exhibits an
affinity for the antibody Fab region, although with an affinity of only 10% of that shown for
3
the Fc region. Modern genetically engineered protein G products often lack this affinity for
the Fab region [22].
In this article SPR chips with protein G are used to orient and capture of ligands to antibodies
towards human serum albumin (HSA) and troponin T (TnT). Human serum albumin is a
common model protein and also a critical biomarker for hepatocyte differentiation and
function often used in vitro [23, 24]. Troponin T is an important clinical biomarker for
myocardial states, and is one of the endpoints for in vitro cardiotoxicity testing [25, 26].
However, the same surface design and assaying principle can be applied to numerous other
immunoanalytical systems.

4
2. Materials and methods
2.1. Materials
A genetically engineered protein G from Streptococcus sp. expressed in E. coli was used
(Sigma Chemical Company, St. Louis, MO, USA). The protein had retained its IgG affinity
but lacked the albumin, Fab, and membrane binding regions. Dimethyl pimelimidate (DMP)
was purchased from Sigma. Buffer exchange was performed on a gel filtration column (PD-
10, Sephadex G25 M, GE Healthcare AB, Uppsala, Sweden) and subsequent concentration on
an Amicon Ultra 4 filter (cut-off 10 kDa; Millipore Inc, Billerica, MA, USA).
The HSA antibody was a polyclonal rabbit anti-human HSA antibody (Dako Denmark A/S,
Glostrup, Denmark), and the TnT antibody was a monoclonal mouse anti-human TnT
antibody (clone 7G7; Abcam Cambridge, MA, USA).
HSA and bovine serum albumin (BSA) (>96%) were obtained from Sigma and TnT from
HyTest Ltd (Turku, Finland).
HBS-EP buffer (10 mM Hepes, pH 7.3; 3.4 mM EDTA; 150 mM NaCl and 0.05%
polysorbate 20), 1-ethyl-3-(3-dimethylaminopropyl)carbodiimide (EDC) and N-
hydroxysuccinimide (NHS), and CM5 chips for SPR experiments were purchased from GE
Healthcare. PBS buffer 0.140 M NaCl, 0.0027 M KCl, 0.010 M phosphate buffer pH 7.4 was
prepared from PBS tablets (Medicago AB, Uppsala, Sweden).
2.2. Instrumentation
A Biacore 2000 (GE Healthcare) was used in all SPR measurements. A Varian Cary 100 Bio

5
UV-Vis spectrophotometer (Varian Inc., Palo Alto, CA, USA) was used for colorimetric HSA
determination.
2.3. Procedures
SPR experiments were carried out on CM5 chips at a flow rate of 5 µL/min using HBS-EP as
running buffer.
2.3.1. Protein G preparation
Protein G was delivered in Tris buffer. The Tris buffer, which contains amine groups that
would have interfered with the amine coupling procedure, was exchanged with PBS buffer
using a gel filtration column. The resulting elute was concentrated to a concentration of ~500
µg/ml using a spin filter with a cut-off of 10 kD.
2.3.2. Surface preparation
Protein G was immobilized in two channels of the sensor chip, one used for the active ligand
system and the other as reference. The protein G was coupled to the CM5 chip by EDC/NHS.
The carboxy dextran surface of the chip was activated by treatment of 200 mM EDC and 50
mM NHS for 7 min. The concentrated protein G was diluted 1:10 in 10 mM acetate buffer, pH
3.6, and injected over the activated chip for 60 min. Subsequently, the surface was deactivated
with 1 M ethanolamine for 7 min. Between measurements, chips were stored in a nitrogen
atmosphere in refrigerator at 4 C [27].
Cross-linking of sensor chips with protein G-antibody complexes was performed as follows
[2]. Antibody was injected onto the protein G chip (prepared as described above) for 20 min
at a concentration of 5 µg/ml. The affinity bound antibody was cross-linked with protein G by
injection of freshly prepared 30 mM DMP in 200 mM sodium borate buffer pH 9 for 25 min.

6
Subsequently the surface was blocked by 1M ethanolamine for 25 min.
2.3.3. Surface plasmon resonance measurements
The analytes, TnT and HSA, were assayed on the sensor chips prepared as described above by
a 20 min injection of antibody at a concentration of 5 µg/ml and a 4 min injection of the
analyte. After each injection of analyte the surface was regenerated by two 1 min pulses of
glycine at pH 1.5.
2.3.4. Albumin reference assay
The HSA concentration was determined using the Bradford protein assay (Bio-Rad
Laboratories, Hercules, CA) using a microassay procedure devised by the manufacturer [28].
Four parts of sample were pipetted into a test tube and one part of reagent was added.
Samples were vortexed and left for 5 min before measurement in the spectrophotometer.

7
3. Results and discussion
3.1 Biosensor surface design
The design of a biosensor surface for immuno-affinity assays should favour high yield at the
capture of the affinity ligands, orient the interacting sites of ligands towards the test solution
with the analyte molecules, stabilize the ligands on the surface, and allow reuse or
regeneration of the specific antibodies of the assay. The methodology that we described here,
by which these qualities are ensured, are based on several preconditions.
The sensing surface is covered by a carboxymethylated dextran matrix extending
approximately 100 nm from the surface for reducing non-specific adsorption to the surface
[29] and providing sites for immobilization. The immobilization of analytical antibodies to
such dextran matrices predominately uses covalent coupling methods [30, 31], and results in
randomly oriented antibody ligands. In a few methods, the analyte recognizing molecules are
captured by an affinity ligand, for example, using anti-IgG antibodies for capturing IgGs,
avidin or streptavidin [26] for biotin conjugated biomolecules, Ni-nitriloacetic acid (NTA) for
His-tagged molecules, glutathione for glutathione-S-transferase (GST), and protein A or
protein G for antibodies [8, 9, 31].
The ligand capturing methods may have advantages, but there are also drawbacks. An anti-
IgG antibody may have a higher affinity to the target IgG but could be species-selective as
well as sensitive to harsh pH during regeneration and storage of chips. Avidin and streptavidin
require chemical modifications, GST and His-tags require a tailored expression system for
with the antibody of interest.
Protein G on the other hand, has the advantage of having affinity for several antibody
subclasses and orients the antibody spatially (Fig. 1). In addition, regeneration of the ligand is

8
possible. This has also the advantage of saving the number of chips required and reducing the
number of manual interventions, e.g. chip or buffer exchange.
The procedure applied here consisted of three steps: (1) protein G was immobilized using
EDC/NHS, (2) the IgG molecules with the specificity of choice were bound to the protein G
layer, and (3) the antigen (i.e., the assayed analyte) was injected over the surface and the
degree of binding monitored. The steps are schematically shown in Fig. 1. The figure does
not depict the 3D structure and reaction mechanism on the chip in detail. However, based of
previous studies of dextran polymers on modified gold surfaces it is known that immobilized
protein ligands are evenly distributed along the linear dextran chains [32, 33] and that the
average distance between the end-point bound chains is 2.5 nm [34].
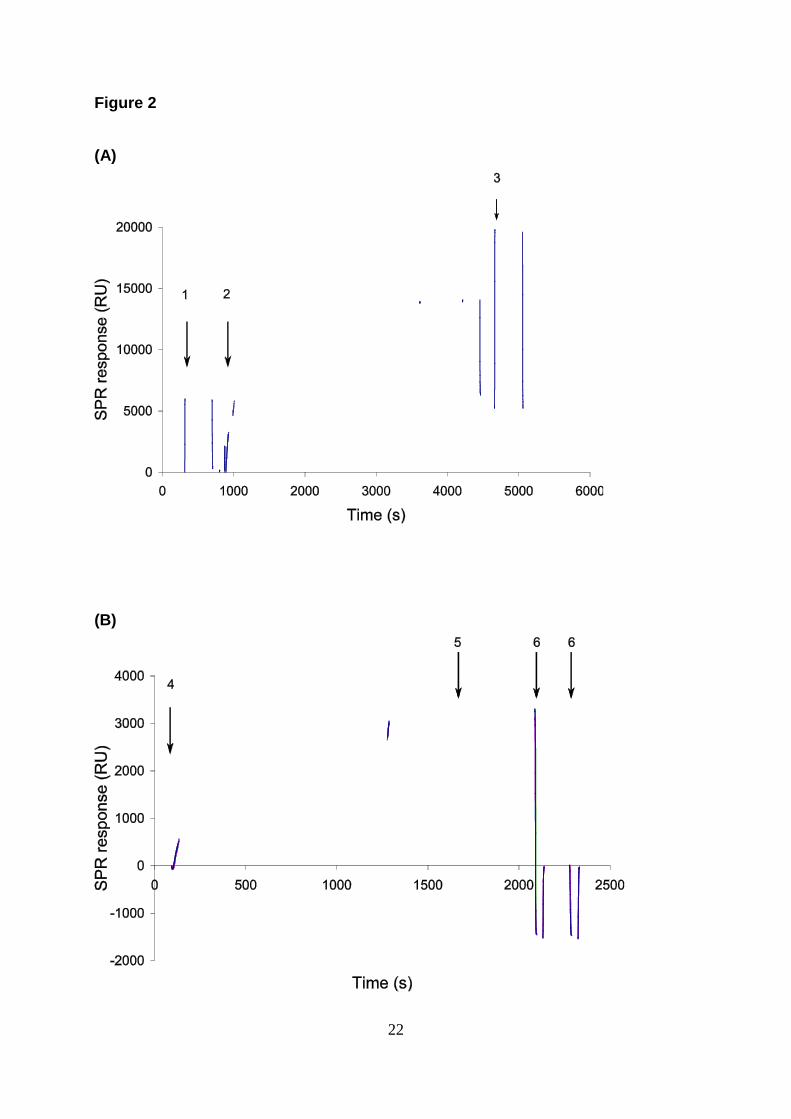
Figure 2 shows sensorgrams for these steps with signals for binding of protein G to dextran
(A), affinity binding of antibodies to the protein G derived surface (B), and binding of
analytes to the antibody-protein G complex (C).
A high titre of antibody binding to protein G improves the performance of the subsequent
assay, since the resulting binding capacity of the antibody is directly dependent on the surface
density of protein G [30]. Thus, by maximizing the protein G binding in the first step, the
sensitivity of the assay step is increased.
The species and even subgroup from which the antibody originates, may determine the
affinity between the antibody and protein G [11, 21]. Moreover, the affinity towards the
analyte of the chosen ligand can be used to tune the dynamic range of the assay [35]. Thus, a
careful selection of an antibody ligand that addresses both affinity towards protein G and the
analyte is important for the performance of the assay. Figure 2 results demonstrate this,
exhibiting a mean affinity constant (KD) of 5 10-12
and dissociation rate constants (kdiss)
ranging from 1 to 3 10-5
s-1
for the investigated concentrations. The estimations were

9
obtained with a Langmuir isotherm fit and had residuals similar to those previously described
for protein G [20].
In order to enhance electrostatic attraction between the protein and dextran matrix the binding
of protein G to the dextran surface was optimized by choosing a coupling pH between the
isoelectrical point of protein G and the protonation pH of the carboxylic groups on the dextran
matrix. For protein G this was noted as being critical for the amount of immobilized protein,
as also previously reported [20]. Optimization was achieved by a pre-concentration in the
dextran matrix, where a pH between 3.6 and 3.8 was found suitable for immobilization.
Immobilization levels of protein G between 2500 and 5000 RU were reached with an
immobilization buffer at pH 3.6.
The binding of anti-HSA to protein G resulted in 3000 RU (5 µL/mL for 20 min) on a chip
with 4700 RU of immobilized protein G (Fig. 2 A and B). When binding anti-TnT to the
protein G chip, approximately 1000 RU of protein was captured on a surface with 3800 RU of
immobilized protein G. The lower binding observed for anti-TnT compared to the anti-HSA
antibody was assumed to be caused by a higher off-rate. In comparison to earlier work [36],
approximately tenfold higher binding of anti-TnT antibody can be attained by direct binding
to the dextran matrix. However, in the present study an oriented antibody with only one tenth
of the antibody bound to the sensor surface still achieved half the activity. Thus, the oriented
antibodies showed a higher activity per ligand.
The higher off-rate of the mouse-anti-TnT antibody from protein G made it necessary to
subtract parallel injections of buffer to compensate for the continuous loss of antibodies from
the surface. The better performance of the rabbit anti-HSA is surprising, as this antibody
subgroup is predicted to have a less good affinity to protein G than the mouse IgG1 anti-TnT
antibodies [11]. However, there has also been a report of the opposite relationship [37].

10
Some desorption of immobilized protein G from newly prepared surfaces occurred. In order
to wash the sensor surface, repeated steps of antibody binding and regeneration were
performed before starting assaying. Although the immobilized chip could be stored for over
three months, sensor chips that had been stored in the refrigerator and used again by being re-
docked with the SPR instrument, showed a lower binding of IgGs. This could be explained by
misalignment of the sensor surface at re-docking and by denaturing of protein when dried.
Previous characterisation of a similar composite structured chip surface (Fig. 1) has been
carried out using spectroscopic ellipsometry [7]. This has shown the formation of IgG-Protein
G complexes on gold chip in the order of 4 nm. Also orientation of protein A using a His-
tagged protein A on a Ni-NTA surface have been described [9]. That approach, however,
introduces unspecific binding of metal binding proteins and a non-covalent binding of protein
G.
3.2 Application of the oriented protein G sensor chip
To verify the application on the SPR sensor chip, oriented antibodies were applied for
assaying two analyte proteins – troponin T and human serum albumin. A polyclonal antibody
was used for HSA, and a monoclonal antibody directed towards the amino acid 60-70, as
previously applied with SPR [36] was used for troponin T.
Figure 3 shows the SPR response versus analyte concentrations of HSA and TnT where the
antibodies were repeatedly captured to the protein G chip before each injection of analyte.
Thus, the assay cycle began with regeneration of used antibody by flowing a buffer solution
of pH 1.5 over the chip, washing with running buffer, charging the bound protein G with fresh
specific antibody, washing with running buffer, injecting the analyte at pH 7.4, and finally

11
washing with running buffer.
As is evident from Figure 3, the dynamic ranges for the two tested analytes differed. The
analytes showed a dynamic range of detection from 0.01 to 7.5 µg/ml for albumin and from
0.03 to 2 µg/ml for TnT. The TnT antibody was saturated much faster than the HSA surface.
This might partly be explained by the higher level of anti-HSA bound to the surface and partly
by different affinity of each epitope of the antibodies to the analytes. The deviating molecular
weights of the analytes, 67 kD for HSA and 36 kD for TnT, could also explain some of the
difference of level.
The role of using a surfactant for negating formation of aggregates has previously been
demonstrated by Choi and colleagues both for Protein A and Protein G complexes with IgGs
[3, 16]. In particular, they have investigated the effects of polysorbate (Tween 20) using
atomic force microscopy and shown how the roughness of the surface was reduced by
applying the surfactant. All experiments shown in this article have used polysorbate 20 in the
running buffer.
Previous applications of using orientation of ligands have been dedicated to the capture of
bacteria and yeasts through their surface specific antigens. In particular, this has concerned
the pathogentic species of Yersinia enterocolitica [17], Vibrio cholerae [18] and Salmonella
typhimurium [16], Escherichia coli [19] and allowed quantification of the species in the range
of 102 to 10
9 colony forming units/ml. Using orienting ligands for affinity binding of large
analytes as whole cells is noteworthy. However, seems that this methodology is more apt for
use with smaller analytes, such as proteins, where the sensitivity range of SPR is fully
exploited [2, 5, 20, 38]. Other methods of choice where the ligand orientation would favor the
sensing mechanism could be the resonant mirror technique [39], optical waveguide lightmode
spectroscopy [40, 41] and dual polarization interferometry [42].

12
3.3 Stabilization of the sensor chip by cross-linking
The complex of protein G with its affinity bound antibody was stabilized by cross-linking by
DMP [2]. This allowed an extended use of the chip. The cross-linking reaction with DMP is
already well characterized and often used in affinity chromatography applications [15, 43,
44]. The HSA and TnT antibodies used in this study were readily cross-linked with DMP,
although a loss in activity was noted. As a consequence, subsequent binding of HSA and TnT
analytes to the cross-linked complexes was lower compared to protein G sensor surfaces with
affinity-bound but not cross-linked antibodies. The obtained dynamic ranges for the cross-
linked antibodies were 0.5-7.5 µg/ml for HSA and 0.03-1 µg/ml for TnT (Fig. 4). Thus, the
stabilized sensor surfaces showed retained analytical performance that allowed quantification
of both analytes, as seen in the figure.
Repeated injections of the analytes and regeneration of cross-linked antibodies slowly lowers
the surface activity. Figure 6 shows repeated injections of TnT over a cross-linked anti-TnT
surface at three concentrations. The activity is reduced at the higher concentrations, while the
lower concentrations retain their activity to a greater extent.
To verify the specificity after cross-linking, injections of 5 µg/ml of HSA and BSA were made
over a cross-linked anti-HSA surface and the signals were compared with the signals from an
unmodified protein G surface and dextran surfaces. As can be seen in Figure 5A, a significant
amount of HSA binds to the cross-linked anti-HSA chip while only a small amount of bovine
serum albumin binds the antibody. The noted unspecific binding to the un-coupled protein G
surface is comparable to that of unmodified dextran (Fig. 5B). The KD value for the binding
was determined to 8.45 10-10
M. The deviation from the KD value from the non-cross-linked
surface (cf. Fig. 2; 3.1 10-12
M) was assumed to be due to a faster dissociation from the cross-
linked surface (i.e., a. larger kdiss).
13
We also compared the SPR response for HSA binding to the protein G oriented antibody with
an established spectrophotometric protein assay method (the Bradford assay) (Fig. 7). Thirty
randomly distributed HSA samples were analyzed with both methods. As Figure 7 shows, the
SPR response declines at high concentrations due to saturation of the chip surface. This
observation is comparable with the SPR graph in Figure 5.
The cross-linking method has the advantage of both purifying commercial antibody
preparations and reusing exclusive antibodies; this may favour routine assay applications. A
drawback is a rather substantial loss of activity. However, this is compensated for by (1) the
increased capturing efficiency of the oriented ligands, and (2) increased stability of the ligand,
which favors its long-term use. The latter is of substantial benefit for applications in toxicity
testing [45, 46] and in bioprocess monitoring and control [47].
4 Conclusion
In this study, the possibility of simultaneously purifying, immobilizing, and orienting
antibody ligands from crude ligand extracts by protein G was exploited. This has clear
advantages. Compared with, for example, a streptavidin-biotin procedure, the antibody does
not have to be labelled, thereby avoiding the risk of compromising the affinity properties.
The analytical capacity of the methodology was demonstrated for SPR dextran-coated
biochips with antibodies towards HSA and human TnT. However, the method is applicable to
most IgG antibodies.
The capturing protein G ligand permits reuse of the surface, e.g., for screening of large
amounts of antibodies.
Cross-linking of the surface was applied for providing robustness of the method. The
14
possibility to fixate a surface after ligand capturing may be of particular value when the
amount of ligand available is limited.
Thus, the use of oriented protein G-antibody complexes, cross-linked or not, in order to
increase efficiency in performance of SPR and other biosensors, is an easy procedure to
extend their applicability. The method can be adapted to other antibody-binding proteins such
as protein A, protein A/G or protein L, to further increase the span of possible antibodies and
applications.
Acknowledgements
This project was financed by the European Commission, Framework 6, grant LSHB-CT-
2007-037636 (Invitroheart). The authors also wish to acknowledge the valuable advice
provided by Dr Henrik Andersson.

15
References
[1] N.H. Beyer, M.Z. Hansen, C. Schou, P. Højrup, N.H.H. Heegaard, Optimization of
antibody immobilization for on-line or off-line immunoaffinity chromatography, J. Sep.
Sci., 32 (2009) 1592-1604.
[2] B. Catimel, M. Nerrie, F.T. Lee, A.M. Scott, G. Ritter, S. Welt, L.J. Old, A.W. Burgess,
E.C. Nice, Kinetic analysis of the interaction between the monoclonal antibody A33 and
its colonic epithelial antigen by the use of an optical biosensor: A comparison of
immobilisation strategies, J. Chromatogr. A, 776 (1997) 15-30.
[3] H. Chen, J. Huang, J. Lee, S. Hwang, K. Koh, Surface plasmon resonance spectroscopic
characterisation of antibody orientation and activity on the calixarene monolayer, Sens.
Actuators, B 147 (2010) 548-553.
[4] L. A. Clarizia, D. Sok, M. Wei, J. Mead, C. Barry, M.J. McDonald, Antibody orientation
enhanced by selective polymer-protein noncovalent interactions, Anal. Bioanal. Chem.
393 (2009) 1531-1538.
[5] A.R. Newcombe, C. Cresswell, S. Davies, F. Pearce, K. O’Donovan, R. Francis,
Evaluation of a biosensor assay to quantify polyclonal IgG in ovine serum used for the
production of biotherapeutic antibody fragment, Process Biochem. 41 (2006) 842-847.
[6] W. Lee, B.K. Oh, Y.M. Bae, S.H. Paek, W.H. Lee, J.W. Choi, Fabrication of self-
assembled protein A monolayer and its application as an immunosensor, Biosens.
Bioelectr. 19 (2003) 185-192.
[7] Y.M. Bae, B.K. Oh, W. Lee, W.H. Lee, J.W. Choi, Study of orientation of
immunoglobulin G on protein G layer, Biosens. Bioelectr. 21 (2005) 103-110.
[8] J. Homola, Surface plasmon resonance sensors for detection of chemical and biological
species, Chem. Rev. 108 (2008) 462-493
[9] C.P Johnson, I.E. Jensen, A. Prakasam, R. Vijayendran, D Leckband, Engineering
Protein A for the orientational control of immobilized proteins, Bioconjugate Chem. 14
(2003) 974-978.
[10] L. Rydén, J. Janson (Eds.), Protein purification: principles, high resolution methods and
applications, Wiley, New York, 1998.
[11] Antibody purification handbook, Amersham Pharmacia Biotech, Uppsala, 2000.
[12] P.L. Ey, S.J. Prowse, C.R. Jenkins, Isolation of pure IgG1, IgG2a and IgG2b
immunoglobulins from mouse serum using protein A-Sepharose, Immunochemistry 15
(1978) 429-436.
[13] K.A. Proudfoot, C. Torence, A.D.G. Lawson, D.J. King, Purification of recombinant
chimeric B72.3 Fab' and F(ab')2 using streptococcal protein G, Prot. Express. Purific. 3
(1992) 368-373.
[14] M. Urh, D. Simpson, K. Zhao, Affinity chromatography: general methods, Methods
Enzymol. 463 (2009) 417-438.
[15] E. Harlow, D. Lane, Using antibodies: a laboratory manual, Cold Spring Harbor
Laboratory Press, New York, 1998.

16
[16] B.K. Oh, Y.K. Kim, K.W. Park, W.H. Lee, J.W. Choi, Surface plasmon resonance
immunosensor for the detection of Salmonella typhimurium, Biosens. Bioelectron. 19
(2004) 1497-1504.
[17] B.K. Oh, W. Lee, B.S. Chun, Y.M. Bae, W.H. Lee, J.W. Choi, Surface plasmon
resonance immunosensor for the detection of Yersinia enterocolitica, Colloid and Surf.,
A 257-258 (2005) 368-373.
[18] J.Y. Jyoung, S.H. Hong, W. Lee, J.W. Choi, Immunosensor for the detection of Vibrio
cholerae O1 using surface plasmon resonance, Biosens. Bioelectron. 21 (2006) 2315-
2319.
[19] P.M. Fratamico, T.R. Strobaugh, M.B. Medina, A.G. Gehring, Detection of Escherichia
coli O157:H7 using a surface plasmon resonance biosensor, Biotechnol. Techn. 12
(1998) 571-576.
[20] J. Quinn, P. Patel, B. Fitzpatrick, B. Manning, P. Dillon, S. Daly, R. O'Kennedy, M.
Alcocer, H. Lee, M. Morgan, K. Lang, The use of regenerable, affinity-based surfaces
for immunosensor applications, Biosens. Bioelectron. 14 (1999) 587-595.
[21] L. Bjorck, G. Kronvall, Purification and some properties of streptococcal protein G, a
novel IgG-binding reagent, J. Immunol. 133 (1984) 969-974.
[22] A.E. Sauer-Eriksson, G.J. Kleywegt, M. Uhlén, T.A. Jones, Crystal structure of the C2
fragment of streptococcal protein G in complex with the Fc domain of human IgG,
Structure 3 (1995) 265-278.
[23] L. De Bartolo, S. Salerno, S. Morelli, L. Giorno, M. Rende, B. Memoli, A. Procino, V.E.
Andreucci, A. Bader, E. Drioli, Long-term maintenance of human hepatocytes in
oxygen-permeable membrane bioreactor. Biomaterials 27 (2006) 4794-4803.
[24] S. Schmitmeier, A. Langsch, I. Jasmund, A. Bader, Development and characterization of
a small-scale bioreactor based on a bioartificial hepatic culture model for predictive
pharmacological in vitro screenings, Biotechnol. Bioeng. 95 (2006) 1198-1206.
[25] H. Andersson, B. Kågedal, C.F. Mandenius, Monitorin of troponin release from
cardiomyocytes during exposure to toxic substances using surface plasmon resonance
biosensing, Anal. Bioanal. Chem. 398 (2010) 1395-1402.
[26] R.F. Dutra, L.T Kubota, An SPR immunosensor for human cardic troponin T using
specific binding avidin to biotin at carboxymethyldextran-modified gold chip, Clin.
Chim. Acta 376 (2007) 114-120.
[27] Biacore AB, Biacore sensor surface handbook, Uppsala, 2003.
[28] M. Bradford, A rapid and sensitive method for the quantification of microgram
quantities of protein utilizing the principle of protein dye binding, Anal. Biochem. 72
(1976) 248-254.
[29] S. Löfås, B. Johnsson, A novel hydrogel matrix on gold surfaces in surface plasmon
resonance sensors for fast and efficient covalent immobilization of ligands, J. Chem.
Soc., Chem. Commun., (1990) 1526-1528.
[30] S. Löfås, Biacore - creating the business of lable-free protein-interaction analysis in:
R.S. Marks (Eds.) Handbook of biosensors and biochips, vol. 1, John Wiley & Sons,
Chichester; Hoboken, N.J., 2007, pp. 1261-1272.
[31] F Rusmini, Z. Zhong, J. Feijen, Protein Immobilization strategies for protein biochips,

17
Biomacromolecules, 8 (2007) 1775-1789.
[32] E. Stenberg, B. Persson, H. Roos, C. Urbaniczsky, Quantitative determination of
surface concentration of protein with surface plasmon resonance using radiolabeled
proteins J. Coll. Interf. Sci. 143 (1991) 513-526.
[33] R. Wigren, P. Billsten, R. Erlandsson, S. Löfås, I. Lundström, Force Measurements on
a hydrogel with an SFM . J. Coll. Interf. Sci. 174 (1995) 521-523.
[34] B. Liedberg, Linköping University, Personal communication (2011)
[35] O. Andersson, H. Nikkinen, D. Kanmert, K. Enander, A multiple-ligand approach to
extending the dynamic range of analyte quantification in protein microarrays, Biosens.
Bioelectron. 24 (2009) 2458-2464.
[36] H. Andersson, D. Steel, J. Asp, K. Dahlenborg, M. Jonsson, A. Jeppsson, A. Lindahl, B.
Kågedal, P. Sartipy, C.F. Mandenius, Assaying cardiac biomarkers for toxicity testing
using biosensing and cardiomyocytes derived from human embryonic stem cells, J.
Biotechnol. 150 (2010) 175-181.
[37] B. Guss, M. Eliasson, A. Olsson, M. Uhlén, A.K. Frej, H. Jörnvall, J.I. Flock, M.
Lindberg, Structure of the IgG-binding regions of streptococcal protein G, EMBO J. 5
(1986) 1567-1575.
[38] D. Tang, R. Yuan, Y. Chai, Novel immunoassay for carcinoembryonic antigen based on
protein A-conjugated immunosensor chip by surface plasmon resonance and cyclic
voltammetry, Bioprocess Biosyst. Eng. 28 (2006) 315-321.
[39] P.E. Buckle, R.J. Davies, T. Kinning, D. Yeung, P.R. Edwards, D. Pollard-Knight, The
resonant mirror: a novel optical sensor for direct sensing of biomolecular interactions:
Part II Applications, Biosens. Bioelectron. 8 (1993) 355-368.
[40] J.J. Ramsden, R. Horvath, Optical biosensors for cell adhesion, J. Recept. Signal
Trannsduc. 29 (2009) 211-223.
[41] R. Horváth, H.C. Pedersen, N. Skivesen, D. Selmeczi, N.B. Larsen, Optical waveguide
sensor for on-line monitoring of bacteria, Optics Letters 28 (2003) 1233-1235.
[42] G. Cross, A.A. Reeves, S. Brand, J.F. Popplewell, L.L. Peel, M.J. Swann, N.J. Freeman,
A new quantitative optical biosensor for protein characterization, Biosens. Bioelectron.
19 (2003) 383-390.
[43] C. Schneider, R.A. Newman, D.R. Sutherland, A One-step purification of membrane
proteins using a high efficiency immunomatrix, J. Biol. Chem. 257 (1982) 10766-
10769.
[44] G.T. Hermanson, A.K. Mallia, P.K. Smith, Immobilized affinity ligand techniques,
Academic Press, San Diego, 1992.
[45] Mandenius CF, Steel D, Noor F, Meyer T, Heinzle E, Asp J, Arain S, Kraushaar U,
Bremer S, Class R, Sartipy S., Cardiotoxicity testing using pluripotent stem cell derived
human cardiomyocytes and state-of-the-art bioanalytics: a review, J. Appl. Toxicol. 31,
(2011) 191-205.
[46] Mandenius C.F., Andersson TB, Alves PM, Batzl-Hartmann C, Björquist P, Carrondo
MJT, Chesne C, Coecke S, Edsbagge J, Fredriksson JM, Gerlach JC, Heinzle E,
Ingelman-Sundberg M, Johansson I, Küppers-Munther B, Müller-Vieira U, Noor F,
Zeilinger K. 2011. Towards preclinical predictive drug testing for metabolism and

18
hepatotoxicity by in vitro models derived from human embryonic stem cells: a report on
the Vitrocellomics EU-project, Altern. Lab. Anim. (ATLA) 39 (2011) 1-25, in press
[47] C.F. Mandenius, Recent developments in monitoring, modelling and control of
biological production systems, Bioproc Biosys Eng 26 (2004) 347-351.

19
Figure Legends
Figure 1:
Schematic of the assay principle: 1. Protein G (green) is randomly immobilized to the dextran
matrix. 2. Antibodies (blue) are captured by protein G with their antigen binding domains
pointing away from protein G. 3. The antibodies are the discriminating component binding the
analyte (red).
Figure 2:
Sensorgrams showing the steps in the procedure for an HSA assay: (a) time course for
immobilization of protein G to the dextran chip; (b) binding of IgG to protein G (from three
repetitions) followed by binding of HSA (from bottom to top 1, 5 and 10 µg/ml); c) close-up
of the HSA binding. Arrows indicate activation of surface (1), injection of protein G (2),
deactivation of surface (3), injection of antibody (4), injection of analyte (HSA) (5) and
regeneration (6).
Figure 3:
SPR response versus concentration for HSA (lower graph) and TnT (upper graph) The graphs
show SPR responses where the antibodies were regenerated after each injection of the
analytes. The SPR values shown are reduced with the non-specific binding from a protein G
reference surface.

20
Figure 4:
SPR response versus concentration for HSA (lower graph) and TnT (upper graph) The graphs
show SPR responses where the antibodies were cross-linked to protein G. The SPR values
shown are reduced with the non-specific binding from a protein G reference surface.
Figure 5:
The upper (pink) graph is from a channel with anti-HSA cross-linked to protein G, the blue
graph is from a channel with protein G, and the yellow and cyan graphs are from channels
with unmodified dextran. a) HSA 5µg/ml and b) BSA 5µg/ml injected over the surface.
Figure 6:
Stability of cross-linked surface with repeated injections of troponin T over cross-linked
antibody. The first group of bars represents injections of samples 5-11, the middle group of
bars samples 9-19, and the last group of bars samples 23-28. Samples were the first, middle,
and last at concentrations of 0.03, 0.5, and 3 µg TnT/ml respectively.
Figure 7:
Comparison of analytical responses for HSA samples in the range 01-10 µg/ml analyzed by
SPR and spectrophotometric assay (Bradford). The SPR responses are represented as
resonance units and spectrophotometric assay as absorbance units at a wavelength of 595 nm.

21
Figure 1
22
Figure 2
(A)
(B)

23
(C)

24
Figure 3

25
Figure 4

26
Figure 5
(A)
-10
0
10
20
30
40
50
60
70
80
0 100 200 300 400
Time (s)
SP
R r
espon
se
(R
U)
(B)
-10
0
10
20
30
40
50
60
70
80
0 100 200 300 400
Time (s)
SP
R r
espon
se
(R
U)

27
Figure 6

28
Figure 7
Top Related