


Languages
Pages
Legal


OFFICE OF ECONOMIC ANALYSIS
Economic and Revenue Outlook:May 2015
May 14th, 2015 Oregon Office of Economic Analysis
Mark McMullen
Josh Lehner
OFFICE OF ECONOMIC ANALYSIS
Recent Performance
2

OFFICE OF ECONOMIC ANALYSIS
Oregon Today: News Is Still Good
3

OFFICE OF ECONOMIC ANALYSIS
Traditional Advantage Regained
4
-8%
-6%
-4%
-2%
0%
2%
4%
6%
1985 1995 2005 2015
Total Nonfarm EmploymentYear-over-Year Percent Change, 3 Month Average
Oregon
U.S.
Source: BLS, Oregon Employment Department, Oregon Office of Economic Analysis

OFFICE OF ECONOMIC ANALYSIS
Sentiment Improving
5

OFFICE OF ECONOMIC ANALYSIS
Engine Trouble?
6
60
70
80
90
100
110
120
Jan-00 Jan-05 Jan-10 Jan-15
Manufacturing SlowdownValues Indexed to Dec '07 = 100
Source: Census, Federal Reserve, Oregon Office of Economic Analysis
Industrial Production
Manufacturers' New Orders forNondefense CapitalGoods ex Aircraft

OFFICE OF ECONOMIC ANALYSIS
Localized Engine Trouble?
7
50
100
150
200
250
Jan-00 Jan-05 Jan-10 Jan-15
Initial U.I. ClaimsSeasonally Adjusted, Index 2000 = 100
N. Dakota+ Texas
All Other States
Weekly claims data converted to monthly, then seasonally adjusted. Data through April 2015.Source: U.S. Dept of Labor, Oregon Office of Economic Analysis
OFFICE OF ECONOMIC ANALYSIS
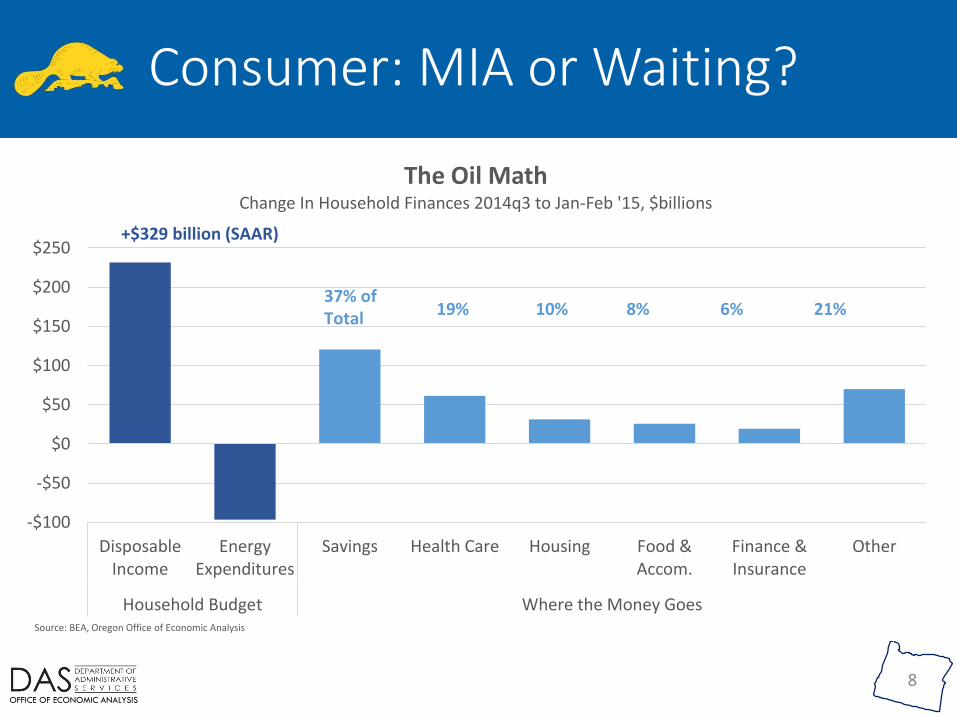
Consumer: MIA or Waiting?
8
-$100
-$50
$0
$50
$100
$150
$200
$250
DisposableIncome
EnergyExpenditures
Savings Health Care Housing Food &Accom.
Finance &Insurance
Other
Household Budget Where the Money Goes
The Oil MathChange In Household Finances 2014q3 to Jan-Feb '15, $billions
Source: BEA, Oregon Office of Economic Analysis
+$329 billion (SAAR)
37% of Total
19% 10% 8% 6% 21%

OFFICE OF ECONOMIC ANALYSIS
Dissecting Job Gains
9

OFFICE OF ECONOMIC ANALYSIS
Not Back to Full Employment, Yet
10
-2%
0%
2%
4%
6%
8%
10%
2005 2010 2015 2020
Oregon's Total Employment GapFTE Relative to Full Employment
Unemployment Gap Participation Gap Undemployment Gap
Source: BLS, CBO, Census, Dartmouth, IMF, OED, Oregon Office of Economic Analysis
Forecast -->
2007q11.1%
2009q38.7%
2015q14.4%

OFFICE OF ECONOMIC ANALYSIS
Wage Gains Are Back!
11

OFFICE OF ECONOMIC ANALYSIS
Update on the Quality of Jobs
12

OFFICE OF ECONOMIC ANALYSIS
Regional Growth Improving
13
Multnomah
Washington
Salem MSA
Lane
Clackamas
Jackson
Deschutes
Linn
Benton
Douglas
Yamhill
Umatilla
Josephine
Coos
Klamath
Lincoln
Clatsop
Malheur
Hood River
Columbia Union
Wasco
Tillamook
Jefferson
Curry
Crook
Baker
Morrow
Wallowa
Grant
Lake
Harney
Sherman
Gilliam
Wheeler
0%
20%
40%
60%
80%
100%
-20% -15% -10% -5% 0%
Shar
e o
f Lo
st J
ob
s R
egai
ned
by
Feb
20
15
Great Recession Job Losses
Oregon Employment by County
All Regained2 in 3 or MoreAbout Half 1 in 3 Regained1 in 5 or Less

OFFICE OF ECONOMIC ANALYSIS
Risks
14

OFFICE OF ECONOMIC ANALYSIS
Bubble Watch: One of These Things Is Not Like the Others
15

OFFICE OF ECONOMIC ANALYSIS
Drought Concerns
• Loss of crops and income
• Increased costs for irrigation & feed
• Suppliers impacted
• Wildfire, hydro
• 2014 California ImpactUC-Davis Study
• 2.2% revenue loss• 3.8% ag employment loss• Losses concentrated more
in grains, feed and other crops (not fruits/nuts) and cattle/calves not dairies
16
Source: droughtmonitor.unl.edu
OFFICE OF ECONOMIC ANALYSIS
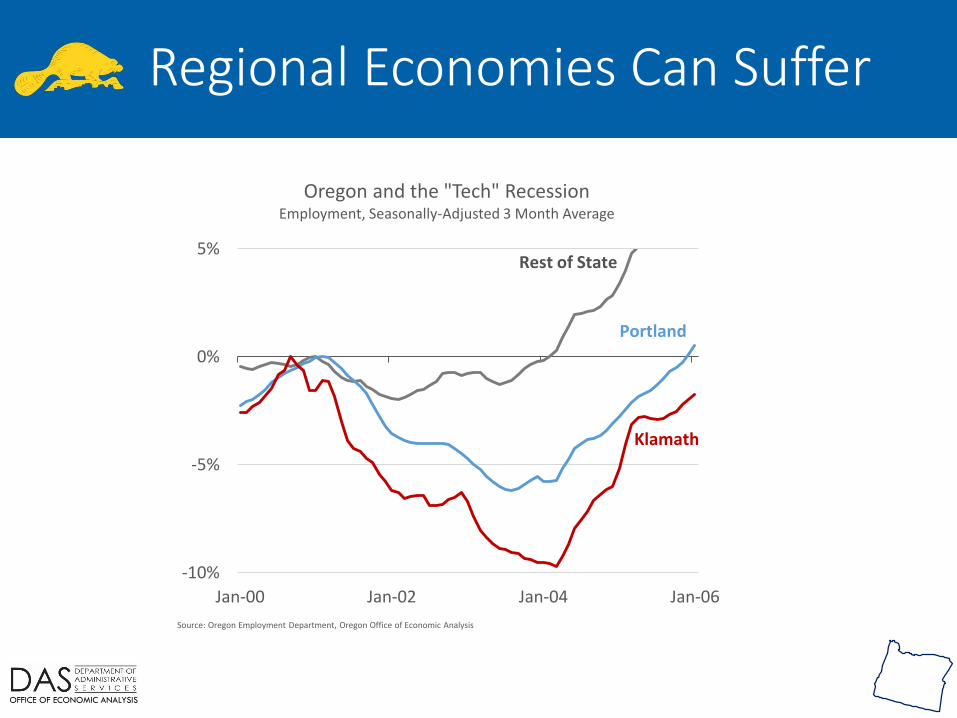
Regional Economies Can Suffer
-10%
-5%
0%
5%
Jan-00 Jan-02 Jan-04 Jan-06
Oregon and the "Tech" RecessionEmployment, Seasonally-Adjusted 3 Month Average
Source: Oregon Employment Department, Oregon Office of Economic Analysis
Portland
Rest of State
Klamath

OFFICE OF ECONOMIC ANALYSIS
“Dollar Isn’t Strong. Everyone Else is Weak.”
18

OFFICE OF ECONOMIC ANALYSIS
Economic Outlook
19

OFFICE OF ECONOMIC ANALYSIS
Near-term Strong, Long-term Subdued
20
-8%
-6%
-4%
-2%
0%
2%
4%
6%
8%
10%
Jan-60 Jan-70 Jan-80 Jan-90 Jan-00 Jan-10 Jan-20
Oregon Nonfarm Employment GrowthYear-over-Year Percent Change
Expansion Average
Forecast -->
OFFICE OF ECONOMIC ANALYSIS
Revenue Outlook
21

OFFICE OF ECONOMIC ANALYSIS
Big April but No Surprise
22
$0.0
$0.1
$0.2
$0.3
$0.4
$0.5
$0.6
$0.7
$0.8
$0.9
$1.0
$1.1
January February March April May June
Bill
ion
sBig Year-End Tax Payments, As Expected
Oregon Cumulative Personal Income Tax Payments
Forecast
2010
20112012
20132014
2015
March 1+3.5%
April 15+14.5%
April 1+11.8%
May 1+20.9%
May 13+21.3%

OFFICE OF ECONOMIC ANALYSIS
2013-15 Forecast Evolution
23
$14.2
$14.3
$14.4
$14.5
$14.6
$14.7
$14.8
$14.9
$15.0
$15.1
Dec '10 May '15
Bill
ion
s
Forecast Release
2013-15 BN Personal Kicker
<--2% Kicker Threshold
Special Session$87 million
<--COS Forecast
$182.2 million

OFFICE OF ECONOMIC ANALYSIS
2015-17 Decomposing Changes
24
2015-17 ResourcesChange Relative to Mar ’15 Forecast
Beginning BalanceKickerKicker OffsetsGF Forecast ChangesLottery Changes
Net Change
+$156 million-$121 million
+21 million+$364 million
+$43 million
+$463 million
Kicker Totals (Est.)2013-15 -$450m2015-17 -$23m2017-19 -$3m
Total -$473m

OFFICE OF ECONOMIC ANALYSIS
What Is Your Cut?
25
* Based on 2013 actual tax returns** Based on 2013 actual tax returns, PIT kicker amount ($473 million) and theOregon Office of Economic Analysis’ forecast for tax liability
Income Group
Adjusted Gross Income*
Rough Estimate of Kicker Size**
Bottom 20% < $10,200 $11
Second 20% $10,200 - $23,800 $63
Middle 20% $23,800 - $43,800 $146
Fourth 20% $43,800 - $79,900 $274
Next 15% $79,900 - $157,100 $546
Next 4% $157,100 - $336,400 $1,249
Top 1% > $336,400 $5,373
Average $53,900 $284
Median $30-35,000 $144
OFFICE OF ECONOMIC ANALYSIS
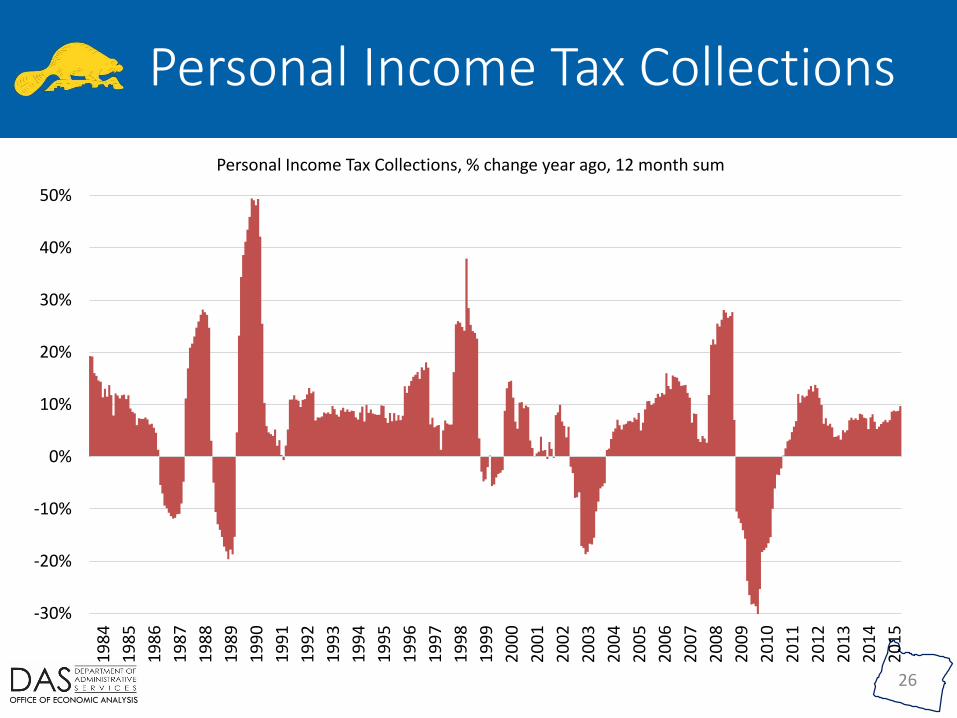
Personal Income Tax Collections
26
-30%
-20%
-10%
0%
10%
20%
30%
40%
50%
19
84
19
85
19
86
19
87
19
88
19
89
19
90
19
91
19
92
19
93
19
94
19
95
19
96
19
97
19
98
19
99
20
00
20
01
20
02
20
03
20
04
20
05
20
06
20
07
20
08
20
09
20
10
20
11
20
12
20
13
20
14
20
15
Personal Income Tax Collections, % change year ago, 12 month sum
OFFICE OF ECONOMIC ANALYSIS
27
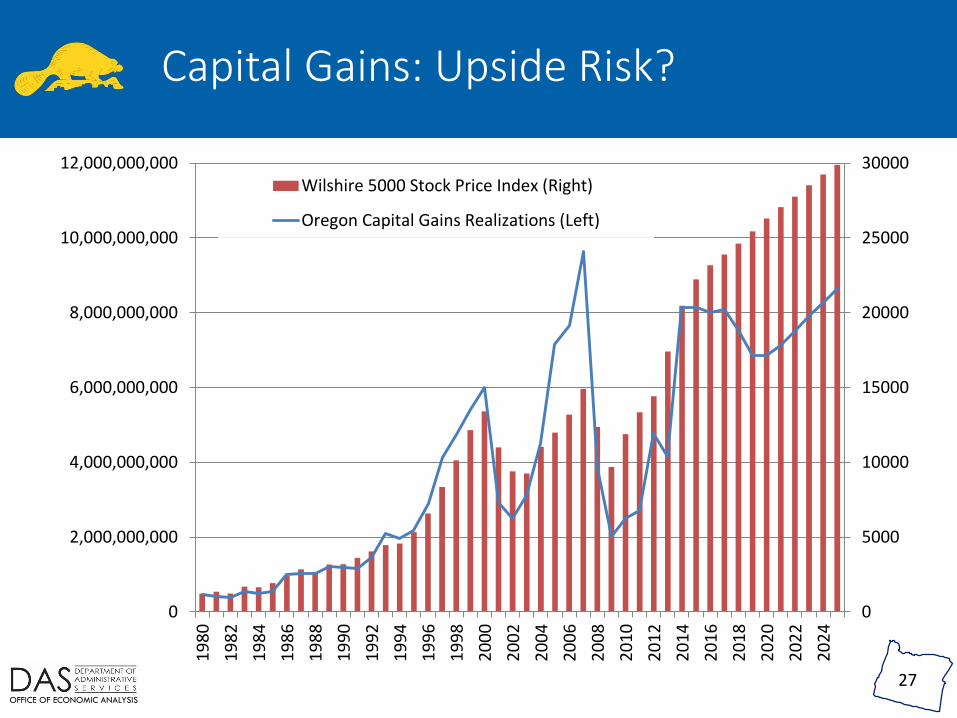
Capital Gains: Upside Risk?
0
5000
10000
15000
20000
25000
30000
0
2,000,000,000
4,000,000,000
6,000,000,000
8,000,000,000
10,000,000,000
12,000,000,000
19
80
19
82
19
84
19
86
19
88
19
90
19
92
19
94
19
96
19
98
20
00
20
02
20
04
20
06
20
08
20
10
20
12
20
14
20
16
20
18
20
20
20
22
20
24
Wilshire 5000 Stock Price Index (Right)
Oregon Capital Gains Realizations (Left)
OFFICE OF ECONOMIC ANALYSIS
2.5
3.5
4.5
5.5
6.5
7.5
8.5
9.5
10.5
1996 1998 2000 2002 2004 2006 2008 2010 2012 2014 2016 2018 2020 2022
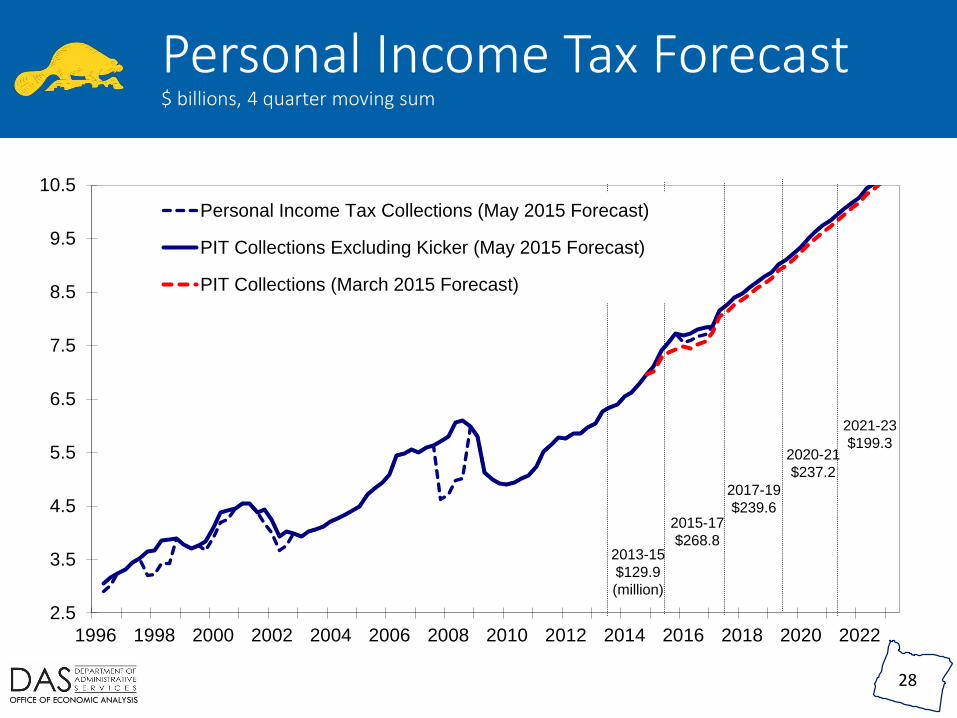
Personal Income Tax Collections (May 2015 Forecast)
PIT Collections Excluding Kicker (May 2015 Forecast)
PIT Collections (March 2015 Forecast)
28
Personal Income Tax Forecast$ billions, 4 quarter moving sum
2013-15
$129.9
(million)
2015-17
$268.8
2017-19
$239.6
2020-21
$237.2
2021-23
$199.3

OFFICE OF ECONOMIC ANALYSIS
Corp Collections: Wait and See
29
100
200
300
400
500
600
700
1996 1998 2000 2002 2004 2006 2008 2010 2012 2014 2016 2018 2020 2022
May 2015 Forecast
March 2015 Forecast
Single Sales Apportionment Factor Enacted
M67 Minimum Tax & Credit Sunsets Enacted
Tax Haven Legislation
M67 Minimum Tax Reforms & Small Business Tax Cut
Approximate Peak in BETC Credits Taken
Corporate Excise Taxes, $ millions, 4 QTR Sum

OFFICE OF ECONOMIC ANALYSIS
Lottery and the New Machines
30
0%
5%
10%
15%
20%
25%
30%
35%
40%
-4%
-2%
0%
2%
4%
6%
8%
10%
12%
14%
Jan-12 Jan-13 Jan-14 Jan-15
Oregon Video Lottery Sales
<-- Year-over-YearPercent Change
New Terminals,Share of Total -->
OFFICE OF ECONOMIC ANALYSIS
3131
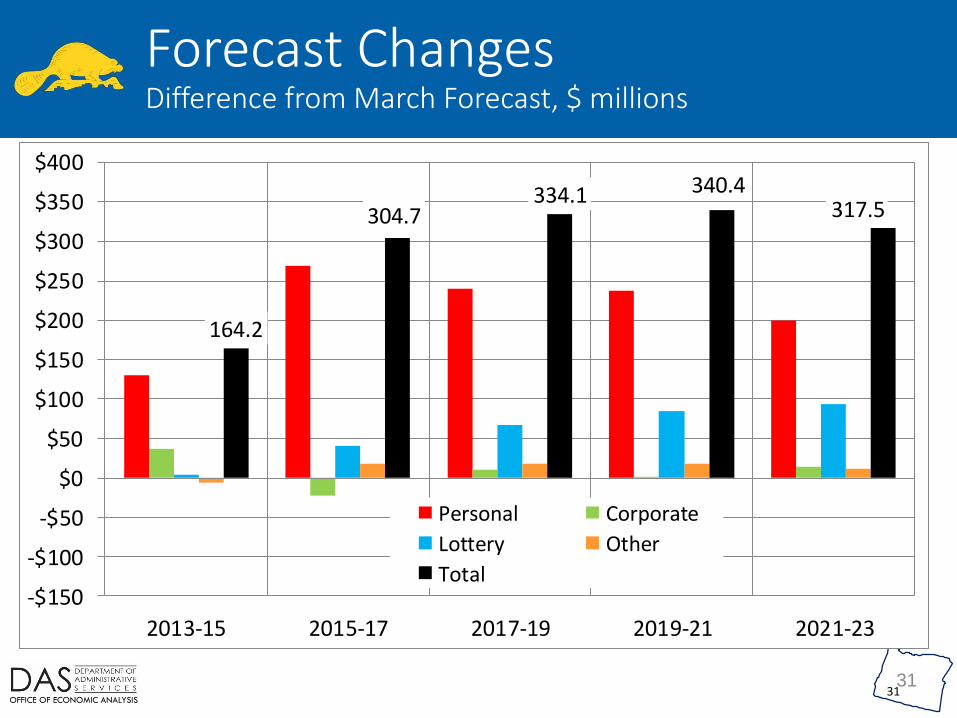
Forecast ChangesDifference from March Forecast, $ millions
164.2
304.7334.1 340.4
317.5
-$150
-$100
-$50
$0
$50
$100
$150
$200
$250
$300
$350
$400
2013-15 2015-17 2017-19 2019-21 2021-23
Personal Corporate
Lottery Other
Total

OFFICE OF ECONOMIC ANALYSIS32
10-Year ForecastTable R.2
General Fund Revenue Forecast Summary (Millions of Dollars, Current Law)
Forecast Forecast Forecast Forecast Forecast Forecast
2013-15 % 2015-17 % 2017-19 % 2019-21 % 2021-23 % 2023-25 %
Revenue Source Biennium Chg Biennium Chg Biennium Chg Biennium Chg Biennium Chg Biennium Chg
Personal Income Taxes 14,044.2 15.9% 15,749.7 12.1% 17,593.0 11.7% 19,466.0 10.6% 21,380.8 9.8% 23,473.2 9.8%
Corporate Income Taxes 1,097.6 24.2% 1,080.7 -1.5% 1,057.1 -2.2% 1,106.4 4.7% 1,198.8 8.4% 1,265.2 5.5%
All Others 1,019.4 -12.4% 1,021.6 0.2% 1,054.1 3.2% 1,129.8 7.2% 1,189.3 5.3% 1,242.2 4.4%
Gross General Fund 16,161.1 14.1% 17,852.1 10.5% 19,704.3 10.4% 21,702.2 10.1% 23,768.9 9.5% 25,980.5 9.3%
Offsets and Transfers (74.3) (96.3) (98.0) (41.9) (45.9) (47.2)
Net Revenue 16,086.8 13.7% 17,755.8 10.4% 19,606.3 10.4% 21,660.3 10.5% 23,723.0 9.5% 25,933.3 9.3%
OFFICE OF ECONOMIC ANALYSIS
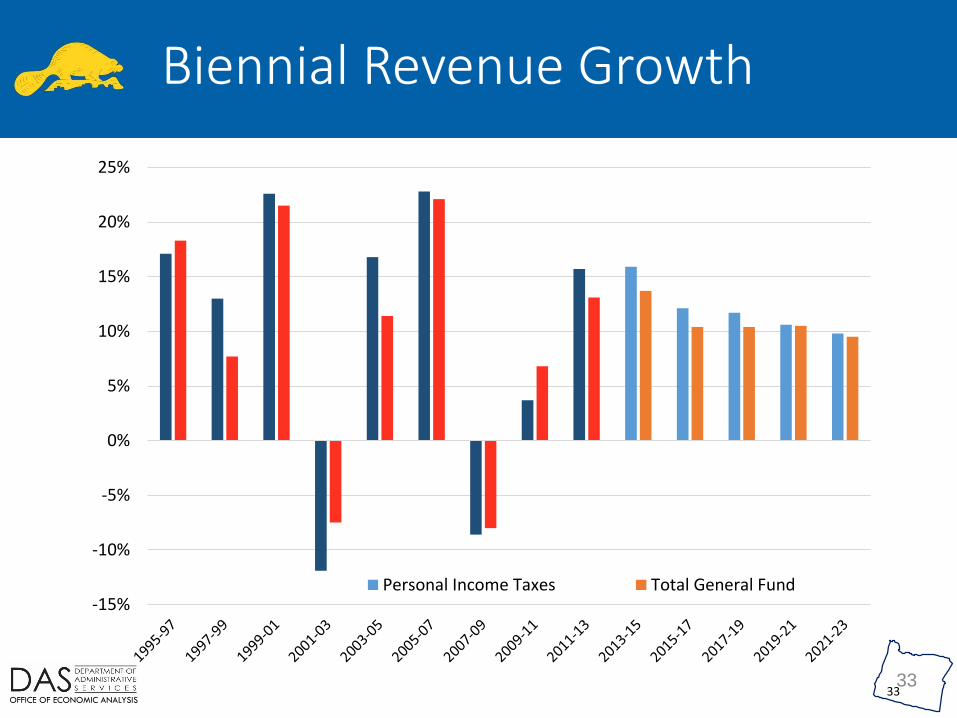
3333
Biennial Revenue Growth
-15%
-10%
-5%
0%
5%
10%
15%
20%
25%
Personal Income Taxes Total General Fund

OFFICE OF ECONOMIC ANALYSIS
34
For More Information
Standard Contact:
155 Cottage Street NE
Salem, OR 97301
(503) 378-3405
www.oregon.gov/das/oea
Social Media:
www.OregonEconomicAnalysis.com
@OR_EconAnalysis
Top Related