


Languages
Pages
Legal


Brigham Young University Brigham Young University
BYU ScholarsArchive BYU ScholarsArchive
Theses and Dissertations
2008-06-10
Oral Retelling as a Measure of Reading Comprehension: The Oral Retelling as a Measure of Reading Comprehension: The
Generalizability of Ratings of Elementary School Students Generalizability of Ratings of Elementary School Students
Reading Expository Texts Reading Expository Texts
Rachel Clinger Burton Brigham Young University - Provo
Follow this and additional works at: https://scholarsarchive.byu.edu/etd
Part of the Communication Sciences and Disorders Commons
BYU ScholarsArchive Citation BYU ScholarsArchive Citation Burton, Rachel Clinger, "Oral Retelling as a Measure of Reading Comprehension: The Generalizability of Ratings of Elementary School Students Reading Expository Texts" (2008). Theses and Dissertations. 1678. https://scholarsarchive.byu.edu/etd/1678
This Thesis is brought to you for free and open access by BYU ScholarsArchive. It has been accepted for inclusion in Theses and Dissertations by an authorized administrator of BYU ScholarsArchive. For more information, please contact [email protected], [email protected].

ORAL RETELLING AS A MEASURE OF READING COMPREHENSION: THE
GENERALIZABILITY OF RATINGS OF ELEMENTARY SCHOOL STUDENTS
READING EXPOSITORY TEXTS
By
Rachel Clinger Burton
A thesis submitted to the faculty of
Brigham Young University
in partial fulfillment of the requirements for the degree of
Master of Science
Department of Communication Disorders
Brigham Young University
August 2008

BRIGHAM YOUNG UNIVERSITY
GRADUATE COMMITTEE APPROVAL
of a thesis submitted by
Rachel Clinger Burton
This thesis has been read by each member of the following graduate committee and by majority vote has been found to be satisfactory. Date Barbara Culatta, Chair Date Richard R Sudweeks, Member Date Martin Fujiki, Member Date Kendra Hall, Member

BRIGHAM YOUNG UNIVERSITY
As chair of the candidate’s graduate committee, I have read the thesis of Rachel Clinger Burton in its final form and have found that (1) its format, citations, and bibliographical style are consistent and acceptable and fulfill university and department style requirements; (2) its illustrative materials including figures, tables, and charts are in place; and (3) the final manuscript is satisfactory to the graduate committee and is ready for submission to the university library. Date Barbara Culatta Chair, Graduate Committee Accepted for the Department Date Ron W. Channell Graduate Coordinator Accepted for the College Date K. Richard Young Dean, David O. McKay School of Education

ABSTRACT
ORAL RETELLING AS A MEASURE OF READING COMPREHENSION: THE
GENERALIZABILITY OF RATINGS OF ELEMENTARY SCHOOL STUDENTS
READING EXPOSITORY TEXTS
Rachel Clinger Burton
Department of Communication Disorders
Master of Science
The purpose of this study was to refine a rating procedure used to assess
intermediate elementary school students’ ability to orally retell what they had read from
two expository passages. Oral retellings from 28 fourth grade students were tape-
recorded and rated on two different occasions by each of 4 raters. A four-facet (passage,
day of test administration, rater, and rating occasion) generalizability study was
conducted using a partially nested design. The six largest sources of variability identified
in the G-study included (a) students, (b) the student-by-day interaction, (c) the interaction
of passage with rater (nested within student and day), (d) the student-by-day-by-occasion
interaction, (e) the passage-by-raters (nested within students and day)-by-occasion
interaction, and (f) the residual. A D-study was conducted to predict the values of the
error variances and generalizability indices for both relative and absolute decisions. The
results show how the error variance and the generalizability coefficients vary as a
function of the number of passages, days of test administration, raters, and rating
occasions.
The results of the D study indicate that adding an extra reading day would
produce a greater increase in reliability than asking the students to read more passages, or
using more raters or more rating occasions. To achieve the greatest gain in
generalizability, teachers should have students read at least two passages on at least two
separate days and have their retelling rated by at least two raters and then compute a
mean rating for each student averaged across the various passages, testing days, and
raters.

ACKNOWLEDGMENTS
Due to the magnitude of this project, there are many people I wish to thank. I
would like to acknowledge my graduate committee for their guidance in writing this
thesis. Thank you to Beverly Miner and Leslie Leatham Bennett for their help with data
collection and rating. I appreciate Dr. Tim Morrison for his valuable editing and advice.
Special thanks to Karel Simms for her well-needed humor, lunch meetings, and continual
support. I would like to express gratitude to Dr. Richard Sudweeks for introducing me to
the world of advanced statistics and generalizability theory. This thesis would not have
been possible without his assistance.
I also wish to thank the Clinger and Burton families for their love and
encouragement throughout this program. And finally, thanks to my husband Mark, who
never stopped believing that I could do this. I am forever grateful for his understanding
and patience. This one’s for you, honey.

vii
TABLE OF CONTENTS
Page
List of Figures ................................................................................................................. x
List of Appendices .......................................................................................................... xi
Introduction ..................................................................................................................... 1
Review of Literature ........................................................................................................ 3
Nature of Texts ..........................................................................................................3
Narrative Texts ....................................................................................................3
Expository Texts ..................................................................................................3
Factors Influencing Reading Comprehension .............................................................4
Learner Factors ....................................................................................................4
Text Factors .........................................................................................................6
Factors Interfering with Understanding of Expository Texts.......................................8
Access to Well-Written Texts...............................................................................9
Familiarity with Expository Comprehension Strategies ...................................... 10
Mechanisms to Monitor Student Progress........................................................... 11
Existing Expository Assessment Tools ..................................................................... 12
Formal Tests ...................................................................................................... 12
Diagnostic Batteries ........................................................................................... 14
Informal Reading Inventories ............................................................................. 14
viii
Scoring Rubrics ................................................................................................. 16
Need for an Expository Comprehension Measure .................................................... 17
Value of Oral Retelling as a Measurement Task................................................. 17
Challenges of Oral Retelling as a Measurement Task ......................................... 19
Statement of Purpose ............................................................................................... 20
Method ......................................................................................................................... 22
Participants.............................................................................................................. 22
The Text Comprehension Rubric ............................................................................. 22
Task and Passages ............................................................................................. 22
Administration ................................................................................................... 24
Scoring .............................................................................................................. 25
Development of the TCR ......................................................................................... 27
Process .............................................................................................................. 27
Changes Made ................................................................................................... 28
Pilot Testing ............................................................................................................ 30
Test Administration Procedures ............................................................................... 31
Rating ..................................................................................................................... 32
Training Procedures ........................................................................................... 32
Establishing Initial Reliability............................................................................ 32
Protocol Scoring ................................................................................................ 32
Design and Data Analysis ........................................................................................ 33
ix
Results ........................................................................................................................... 34
G Study Results ....................................................................................................... 35
The Variance Components ................................................................................. 38
Negative Estimates of Variance Components ..................................................... 49
D Study Results ....................................................................................................... 50
Two Different Kinds of Error Variance .............................................................. 51
Two Different Kinds of Reliability ..................................................................... 52
Summary ................................................................................................................. 59
Discussion ..................................................................................................................... 61
Viability of TCR in Classroom Contexts .................................................................. 61
Potential Use as an Assessment Tool .................................................................. 61
Predictions for Use in Assessment Conditions .................................................... 64
Recommendations for Future Research .................................................................... 65
References ..................................................................................................................... 67

x
LIST OF FIGURES
Figure Page
1. Text Comprehension Rubric ................................................................................ 23
2. Rating Design ...................................................................................................... 34
3. Variability of Student Mean Ratings about the Grand Mean ................................ 39
4. Student Means by Day of Test Administration ..................................................... 42
5. Mean Ratings by Student by Day by Rating Occasion ......................................... 44
6. Raters by Pasages within Students and Occasions ................................................ 47
7. Standard Error of Relative Decisions by Number of Passages Read, Number of
Days Tested, and Number of Raters ......................................................................... 53
8. Standard Error of Absolute Decisions by Number of Passages Read, Number of
Days Tested, and Number of Raters ......................................................................... 54
9. Reliability of Relative Decisions and Students' Reading Comprehension by
Number of Passages Read, Number of Days Tested, and Number of Raters ............. 57
10. Reliability of Absolute Decisions and Students' Reading Comprehension by
Number of Passages Read, Number of Days Tested, and Number of Raters ............. 58

xi
LIST OF APPENDICES
Appendix Page
Informed Consent .......................................................................................................... 74
Passage 1 ....................................................................................................................... 76
Passage 2 ....................................................................................................................... 77


1
Introduction
Much of the research on the process of reading comprehension has shown that
good readers do a number of things while they read. Good readers are actively involved
in the reading process and have clear goals in mind for their reading. Importantly, good
readers read different kinds of text differently. When reading narrative text, these readers
attend closely to the setting and plot development. When reading informational or
expository text, good readers frequently construct and revise summaries of what they
have read (Block & Pressley, 2001; Duke & Pearson, 2002; Pressley & Afflerbach,
1995). Unfortunately, research has found that students are often not as acquainted with
expository text as they are with narrative text (Duke, 2000). Without an exposure to
expository passages, students may not gain the necessary comprehension strategies
particular to the text genre.
The ability to comprehend expository text passages is essential for achievement in
school and learning throughout life (Seidenberg, 1989). Research has found that students
do not develop a variety of strategies for understanding written text without explicit
teaching of comprehension techniques (Dymock, 2005). It is imperative that teachers
assist students in developing proficiency of text comprehension to help in the
understanding and retention of complex concepts (Cash & Schumm, 2006). As
researchers and teachers explore ways to facilitate better comprehension in the classroom,
appropriate measures are needed to assess children’s comprehension of expository texts.
Typical approaches to assessing reading comprehension include formal tests, diagnostic
batteries, and informal reading inventories. Another way to measure reading
comprehension is oral retelling. However, as is true with all measures of comprehension,
this tool also has limitations. A reliable and practical tool is desirable to assist teachers in

2
determining how well students understand expository text. This study addressed this need
by determining the reliability of an informal expository text comprehension rubric
developed for intermediate elementary grades, the Text Comprehension Rubric (TCR).

3
Review of Literature
Comprehension of expository passages is crucial to students’ academic success.
Educators and speech-language pathologists can assist in developing this comprehension
by providing particular instruction in how to approach expository texts.
Nature of Texts
Texts are “demanding forms of nonreciprocal discourse or groups of utterances
combined in a cohesive way to convey units of meaning, whether oral or written”
(Carlisle, 1991, p. 115). There are two main types of texts: narrative and expository.
These two types of texts share many overlapping characteristics, but each serves a
distinct purpose.
Narrative Texts
Narrative texts mainly entertain readers. These texts can be found in a variety of
story genres such as folktales, novels, fables, short stories, mysteries, and myths.
Narrative texts usually involve live characters and draw heavily on real events and
experiences from everyday life (Grasser, Golding, & Long, 1991). These texts are often
composed of a single general structure called story grammar.
Expository Texts
Unlike narrative texts, expository texts primarily communicate information. These
texts contain facts, details, procedures, and descriptions. Expository texts include a range
of genres that include biographies, essays, textbooks, reference books and newspaper
articles (Weaver & Kintsch, 1991). Indexes, glossaries, and captions are often features of
expository texts. Because expository texts convey information, the content included is
generally less familiar to students than that in narrative texts. Expository texts often

4
contain more unknown vocabulary and concepts and fewer ideas related to personal
experiences than narrative text (Williams, 2005).
Expository texts also vary in text structure. Text structure refers to the way in
which ideas are presented and connected to each other in order to communicate the
overall meaning of the text (Stein & Glenn, 1979). Compared to narrative texts,
expository texts have a much broader range of organizational patterns (Williams, 2005).
Weaver and Kintsch (1991) describe common expository text structures as
compare/contrast, classification, illustration, and procedural description, while Meyer and
Rice (1984), describe them as sequence, enumeration or collection, problem-solution, and
description. Sometimes a mixture of structures is used within a text. Each kind of
structure is represented by a pattern that includes varying types of relations among the
various pieces of important information in the text (Dickson, Simmons, & Kameenui,
1998)
Factors Influencing Reading Comprehension
Comprehension of texts requires more than just understanding the vocabulary and
relationships among ideas. Students should be able to recognize key content words, the
main idea of the text, and the structure of the passage. Readers must be able to make
connections among ideas within the text and also between the text and their own
experiences. In creating an assessment tool, educators must look at what skills students
have and how text factors influence comprehension (RAND Reading Study Group,
2001).
Learner Factors
Text comprehension depends heavily on the ability of the learner. According to
Kintsch and Kintsch (2005), adequate decoding skills, background knowledge, and

5
motivation underlie successful comprehension. Effective readers recognize the structure
of the text, note any sections that might be relevant to their reading goals, monitor
understanding of the text, make adjustments in their reading, and construct and revise
summaries of what had been read (Duke & Pearson, 2002; Pressley & Afflerback, 1995).
Good learners make the comprehension process an active one by using appropriate skills
that allow them to monitor their understanding and change their technique to fit the type
of text encountered.
Comprehension of texts is also shaped by metacognitive and metalinguistic
knowledge. Metacognitive knowledge, or the understanding and effective selection of
strategy use during reading, can help children acquire expository text knowledge. “For
example, learners can know about different strategies for reading a textbook as well as
strategies to monitor and check their comprehension as they read” (Pintrich, 2002).
Metacognitive strategies can be implemented in stages such as planning, using a strategy,
monitoring, and evaluating (Cropley, 1996). For example, competent readers select
different reading styles based on whether they are required to retell orally, which requires
an understanding and interpretation of the text’s major points, or take a multiple choice
test, where the questions are provided and the reader can skim to find the answers.
Throughout interactions with the text, readers self-monitor to determine level of attention
needed and the necessity to reread because of missed information. Overall content
knowledge would additionally be evaluated by the learner (Culatta, Horn, & Merritt,
1998).
Children not only need to reflect on the reading process, and use this reflection to
change reading styles, but must also be able to understand and reflect on the language

6
itself in expository texts. According to Westby (1994), metalinguistic knowledge, the
ability to understand and talk about language, can impact success during an expository
reading or listening task. At the text level, metalinguistic skills can include the ability to
identify the text structure and use that knowledge to guide comprehension (Culatta, et al.,
1998).
Text Factors
The text itself plays an important role in comprehension. Texts have three main
characteristics that influence students’ performance. The first of these dimensions is a
level of organization which researchers have labeled global organization. Local cohesion,
the second factor, connects texts at the local level (Carlisle, 1991; Meyer & Rice, 1984).
The third characteristic is signals or devices used to orient the reader to the text structure
help to create connection among the ideas of various levels. These three dimensions of
expository texts will be discussed below.
Global organization. The highest structure of a text, or macrostructure, refers to
the global organizing principles present in a passage that dictate how main ideas are
related. The global organization is the broadest level of connection among main ideas of
the text (Meyer & Rice, 1984). As mentioned, multiple organizations exist for expository
texts, such as compare/contrast, classification, and procedural description. Expository
comprehension relies on understanding how main ideas are related or structured.
Local cohesion. Cohesion refers to the interrelationships among the sentences in
the text. On this level, the way that each new idea relates to the previous one is
considered (Meyer & Rice, 1984). Major topics and main ideas that are logically
connected to each other help the text maintain coherence. Cohesive ties—local

7
organization formed through grammatical and semantic means—are used to achieve a
sense of connection on the local level (Kintsch & Yarbrough, 1982). Cohesive ties
include the use of synonyms to replace words with similar meanings, conjunctions that
create connections, and pronouns to stand for referents (Halliday, 1975). For example, in
the sentences, “Frogs like to eat flies. They use their tongues to catch the flies,” they is a
pronoun that creates coherence by standing for the referent frog.
In addition to creating coherence, some cohesive ties, particularly certain
conjunctions, can contribute to signaling the text’s organization. When texts contain
cohesive ties within sentences, they can signal logical relationships among ideas that
serve to reinforce the global organization. Cohesive ties found within a compare/contrast
structure might include but, also, instead, however. For example a passage comparing
dogs with fish can include contrastive conjunctions in sentences such as “Fish live in
bodies of water but dogs live on land. However, dogs also need water to survive.” The
words but, however, and also in these sentences signal the comparisons that are being
made.
Signal devices. The reader of expository texts has the task of identifying and
understanding how the main ideas in the text are related to each other. Expository texts
sometimes employ features called signals that highlight the relationships of ideas to each
other. Signal devices can be used to signal the global organization of an expository text.
According to Culatta, et al. (1998), these devices, such as overviews, summaries, and
headings can provide assistance to readers in comprehending overall text organization.
For example, an author comparing and contrasting frogs to toads could use sentences like
“Frogs and toads are different kinds of animals. They live in different places and have
8
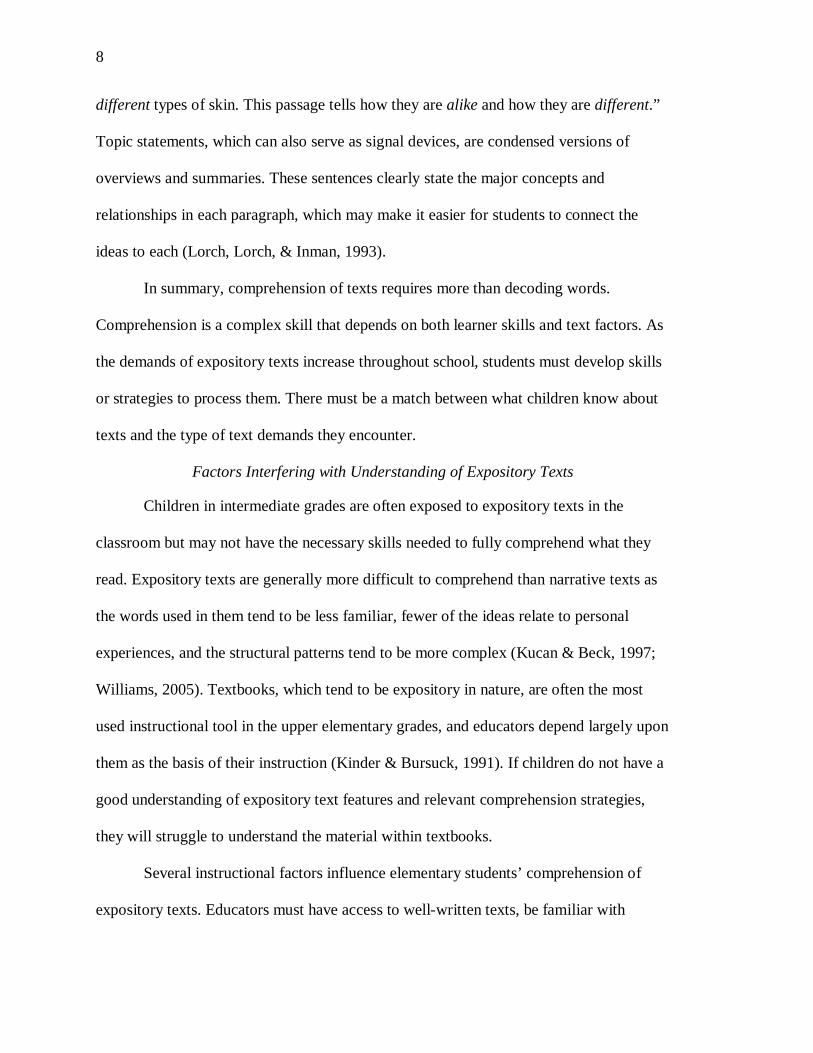
different types of skin. This passage tells how they are alike and how they are different.”
Topic statements, which can also serve as signal devices, are condensed versions of
overviews and summaries. These sentences clearly state the major concepts and
relationships in each paragraph, which may make it easier for students to connect the
ideas to each (Lorch, Lorch, & Inman, 1993).
In summary, comprehension of texts requires more than decoding words.
Comprehension is a complex skill that depends on both learner skills and text factors. As
the demands of expository texts increase throughout school, students must develop skills
or strategies to process them. There must be a match between what children know about
texts and the type of text demands they encounter.
Factors Interfering with Understanding of Expository Texts
Children in intermediate grades are often exposed to expository texts in the
classroom but may not have the necessary skills needed to fully comprehend what they
read. Expository texts are generally more difficult to comprehend than narrative texts as
the words used in them tend to be less familiar, fewer of the ideas relate to personal
experiences, and the structural patterns tend to be more complex (Kucan & Beck, 1997;
Williams, 2005). Textbooks, which tend to be expository in nature, are often the most
used instructional tool in the upper elementary grades, and educators depend largely upon
them as the basis of their instruction (Kinder & Bursuck, 1991). If children do not have a
good understanding of expository text features and relevant comprehension strategies,
they will struggle to understand the material within textbooks.
Several instructional factors influence elementary students’ comprehension of
expository texts. Educators must have access to well-written texts, be familiar with

9
expository comprehension strategies, and implement mechanisms to monitor student
progress.
Access to Well-Written Texts
Many of the expository texts teachers use within the classroom are judged to be
poorly written, lack a clear structure, or switch frequently between structures (Kantor,
Andersen, & Armbruster, 1983). Kinder and Bursuck (1991) reported on critiques of
social studies textbooks by six different groups of evaluators. One evaluating group
found that the authors of many poorly written, incoherent textbooks often did not include
make clear the relations between ideas and sentences. A majority of American history
textbooks did not clearly identify major concepts. In addition, these books provided little
analysis of events and failed to present information in a way that would help students
organize facts into a coherent whole (Kinder & Bursuck, 1991). Despite these problems,
students are expected to use textbooks as a primary source of information.
Expository texts used in the classroom also tend to lack adequate devices that
signal information about the text structure such as overviews, topic or main idea
statements, and summaries. Or, if texts do contain such signaling or orienting devices,
they may be used in confusing or inappropriate ways (Dickson, et al., 1998). Without
exposure to well-written expository texts, children’s comprehension of informational
passages will suffer. To reduce comprehension difficulties, teachers need to collect good
texts for use in the classroom.
As a sufficient number of well-written texts may be hard to find, teachers should
also know how to write or modify expository passages to create more appropriate texts.
Though it is not feasible to expect teachers to create all texts for their students to read,

10
there are other ways to increase students’ attention to text structure. For example, a
teacher could have students read two descriptive texts with comparison/contrast
structures and then guide them through identifying how the ideas are alike and how they
are different. The class could then list similarities and differences between the two texts.
The teacher could also increase student understanding of text structure by highlighting
words in a passage that signal the text structure and relationships among ideas. The
highlighting of the text structure comes from the interactions the teacher has orally with
the students. The teacher could additionally create a graphic representation with headings
that signal the structure. While the text itself may not be well organized, the visual
representation of the text could be clearly organized.
Familiarity with Expository Comprehension Strategies
Another issue related to expository text instruction is the teachers’ knowledge of
expository comprehension strategies. Teachers often lack familiarity with the structure of
expository texts and, therefore, do not teach students to identify their organization
(Davinroy & Hiebert, 1984). This lack of knowledge about text structure, and the
accompanying strategies for effectively comprehending expository texts, often can result
in children not receiving enough relevant instruction. Limited instruction regarding
expository texts can negatively impact students’ ability to comprehend and learn from
these texts.
Some teachers may be familiar with expository text structure but do not clearly
teach comprehension strategies in the classroom (Dymock, 2005). Duke (2000) found
that it is necessary for teachers to explicitly teach comprehension strategies in order for
students to fully comprehend expository texts. According to the National Reading Panel

11
(2000), “the rationale for the explicit teaching of comprehension skills is that
comprehension can be improved by teaching students to use specific cognitive strategies
or to reason strategically when they encounter barriers in enhancing understanding” (p.
14). Research has shown that students’ awareness of text structure is positively related to
comprehension. Educating teachers about expository text structures and appropriate
instructional strategies at professional development or other training meetings could help
diminish some of the comprehension difficulties that children face.
Mechanisms to Monitor Student Progress
Comprehension instruction should be accompanied by ongoing assessment.
Teachers should monitor students’ use of comprehension strategies and their success at
comprehending what they have read. If a teacher fails to monitor performance, students
who have difficulty employing necessary comprehension strategies may fall through the
cracks. Results of monitoring student performance should additionally inform teachers’
instruction. If students use a certain strategy ineffectively, teachers should respond with
additional instruction or a modified instructional approach (Duke & Pearson, 2002).
When teachers assess their students’ ability to comprehend expository passages, they not
only identify which students are in need, but determine whether more comprehension
instruction is needed.
The causes of difficulty with expository text comprehension can be based on
problems related to limited access to texts, exposure to expository comprehension
strategies, and mechanisms used to monitor student performance (Duke & Pearson,
2002). As discussed previously, these comprehension difficulties can be remedied

12
through a variety of methods. When these issues are alleviated, students’ comprehension
difficulties have the potential to improve.
Existing Expository Assessment Tools
To provide optimal text comprehension instruction, educators need to periodically
assess children’s understanding of expository texts. Assessment plays an important role
in intervention as teachers can use findings to adjust classroom instruction to meet
children’s needs. Not only can assessment tools be used for evaluating students’
performance, but evaluations can and should reveal students’ abilities and needs (Duke &
Pearson, 2002). Monitoring a child’s ability to comprehend expository texts can help an
educator know which intervention strategies to implement or which dimensions of text
performance to emphasize.
Comprehension strategies are usually measured in conjunction with other reading
skills. Some tests evaluate concepts and key words related to specific key structures,
while others measure overall comprehension of the passage (Hall, Markham, & Culatta,
2005). Some comprehension measures incorporate expository passages but do not
employ a separate mechanism for evaluating comprehension based on organizational
demands. Four common types of reading comprehension assessments will be discussed
below: formal tests, diagnostic batteries, informal reading inventories, and scoring
rubrics. A description of how comprehension of expository texts is treated in each
assessment will be discussed.
Formal Tests
Formal tests refer to norm-referenced measures that are empirically documented
for standardization. These tests provide quantitative means of comparing a child’s
performance to the performance of a large group of children with similar characteristics

13
(e.g., age, grade level, type of instruction). Formal tests identify students who are below
an expected level of performance. In standardized tests, the most common approach to
measure reading comprehension is to ask students to read passages and then answer
multiple-choice questions about the content.
Expository text passages often are incorporated within formal tests. For example,
the Gates-MacGinitie Reading Tests (MacGinitie, W., MacGuinitie, R., Maria, Dreyer &
Hughes, 2002) contains both narrative and expository passages for each grade level
followed by multiple-choice questions for students in the third through twelfth grades to
answer. Other examples of formal tests with expository text passages are the Iowa Tests
of Basic Skills (Hoover, Dunbar, & Frisbie, 2005), and the Stanford Achievement Tests
(Kelley, Ruch, & Terman, 2007).
Formal tests are frequently criticized because they provide only general
indications of how well a student can comprehend compared to their normed group
(Irwin, 1991). These measures give no situation-specific information about whether
students comprehend things like expository text structures or understand the purpose of
signal devices. Other criticisms of standardized reading tests include the following: (a)
failure to consider measurement error possibilities, (b) the use of a single score as the
only criterion for important decisions, (c) acceptance of a single score as a pure measure
of a characteristic, and (d) failure to recognize that students’ performance is a
combination of a complex set of conditions (Farr & Carey, 1986; Glissmeyer, 1998;
Nitko, 1996). Though formal tests provide general information about students’ reading
ability in a quantitative format, they often lack more specific information that may be

14
needed regarding students’ comprehension skills that teachers need in order to make
specific instructional adjustments.
Diagnostic Batteries
Like standardized measures, diagnostic batteries don’t systematically target
expository text comprehension. These assessments measure comprehension skills and
provide important information about students’ needs, with the intent to guide future
instruction. Diagnostic batteries, like the Woodcock-Johnson III Diagnostic Reading
Battery (Woodcock, McGrew, & Mather, 2001), scaffold teachers’ thinking and help
them to determine the level of students’ responses, identify their strengths, and decide
what they need to learn next.
The Developmental Reading Assessment (DRA2; Beaver & Carter, 2006),
another example of a diagnostic battery, helps educators not only identify each student’s
reading achievement, but modify their teaching to drive reading instruction. The DRA2
offers narrative and expository passages for each grade level; assessment administrators
choose whether students read a narrative or expository passage. After reading, students
complete several fill-in-the-blank questions. The DRA2 includes a rubric for the retelling
component that is not specific for use with expository texts. The rubric assesses whether
students can sequence story events, provide character details, understand vocabulary,
make connections, and give an opinion.
Informal Reading Inventories
Reading skills and comprehension can also be measured using informal reading
inventories that are not norm-referenced or standardized. Unlike formal tests, these
assessments are designed to provide teachers with information about how to teach

15
reading to a particular student. Teachers who use measures like the Basic Reading
Inventory (Johns, 2005), Classroom Reading Inventory (Silvaroli & Wheelock, 2000),
Informal Reading Inventory (Roe & Burns, 2007), and Analytical Reading Inventory
(Woods & Moe, 2006) listen to students read narrative or expository passages and then
ask them questions about what they have read. In this manner they can observe the types
of questions students answer, the words they decode, and the rate of their reading. This
method allows teachers to assess both oral reading and reading comprehension.
One frequently used reading inventory, the Qualitative Reading Inventory-IV
(QRI-IV; Leslie & Caldwell, 2006), contains expository passages for pre-primer through
junior-high levels. Those who use the QRI-IV evaluate comprehension with one of two
methods. The student’s retelling is examined using a list of important idea units or
propositions contained in the passage. The examiner notes the sequence of the student’s
listing. There are no guidelines that help teachers evaluate the organization of the
student’s retell. Alternatively, the examiner may ask the student comprehension questions
about the text. The questions are scored as either right or wrong with no partial credit
awarded.
Reading inventories like the Qualitative Reading Inventory-IV are useful in
providing descriptive information about a students’ overall comprehension through oral
retellings and questions. While they often have a retelling format, they do not specifically
consider the student’s comprehension of expository text structures and recognition of
structural devices.

16
Scoring Rubrics
Students’ comprehension skills can be assessed using a rubric or scoring guide
based on specific criteria for quality work. Rubrics can be designed to address expository
text comprehension. Rubric scoring is considered to be a holistic approach to assessment
because it relies on a carefully constructed set of criteria, a scoring guide that describes
varying levels of achievement, and a teacher’s informed impressions (Fiderer, 1998).
Rubrics are often frameworks for guiding decision making that have not been subjected
to validity or reliability assessment. They inform instruction as the criteria used to
determine a high-quality performance provide direction for setting goals for students.
Rubrics can also be adapted or created to fit almost any learning context, including
expository comprehension (Fiderer, 1998).
The Rubric for Expository Text Expression and Comprehension (Merritt, 2000)
specifically evaluates students’ expository comprehension skills. A student reads an
expository passage and orally retells its content. The examiner rates the quality of the
retell from 0 to 3 according to the specific requirements of each of the thirteen skills
outlined on the rubric. The test examiner then asks the student to state the main idea,
purpose, and important points of the passage. Student responses are rated according to the
quality of the response from 0 to 3 according to the specific requirements of each listed
skill. Lastly, the student completes a graphic organizer and is rated by the examiner on
the quality and quantity of information provided.
While the Rubric for Expository Text Expression and Comprehension assesses
students’ expository comprehension skills, its reliability has not been established.
Reliability of scores obtained from an instrument may depend on various factors such as

17
the individuals who are rating the children’s performance, the passages the children
encounter, the rating occasions, and the students who are being assessed.
Need for an Expository Comprehension Measure
With a growing emphasis on the importance of students being able to read and
comprehend expository texts, the need for assessments to determine students’ skills also
grows. These assessments are needed to help teachers identify children at-risk for failure,
evaluate the efficacy of instruction, and monitor individual growth. While formal literacy
assessments, diagnostic batteries, and informal reading inventories give some indication
of expository text comprehension, there is still a need for reliable measures that explicitly
target the skills and strategies students need to understand expository text.
Value of Oral Retelling as a Measurement Task
While some existing tools use oral retelling to assess expository comprehension,
most incorporate the retelling into a general measure of comprehension, thus not giving
any specific information about students’ understanding of expository texts. According to
Sudweeks, Glissmeyer, Morrison, Wilcox, & Tanner (2004), to increase the likelihood
that individuals’ understanding of text organization is measured, more performance-based
assessments that include oral retelling should be utilized. With the use of an oral retelling
assessment, information regarding students’ expository comprehension can be gathered
because the retold version reflects understanding of organization and the use of devices.
Retelling reflects students’ understandings expository texts and can give information
about students’ abilities.
Retellings are one of the best and most efficient strategies for discovering whether
a child understands what he or she has read (Gambrell, Pfeiffer, & Wilson, 1985;
Johnston, 1997; Reutzel & Cooter, 2007). Retelling helps show students’ overall

18
understanding of the text rather than their recall of fragmented information that is
commonly provided by answering questions (Moss, 2004). According to Morrow (1988),
“Because retelling can indicate a reader’s or listener’s assimilation and reconstruction of
text information, it can reflect comprehension . . . and allows a reader or listener to
structure a response according to personal and individual interpretations of the text” (p.
128). Retelling provides insight into the students’ ability to recall details, make
inferences, and recognize structural relationships—strategies not assessed by formal
measures, diagnostic batteries or informal reading inventories.
Retellings are also advantageous because they can be conducted in two different
ways: oral or written. In oral retelling, students are not limited by their writing abilities.
They can use vocabulary that is likely most accessible to them. Written retelling allows
the student to reflect more deeply than with oral retelling. Students can revise and expand
their responses in written retelling (Reutzel & Cooter, 2007). Teachers can also contrast
students’ performances on written retellings to their performances on oral retellings.
Written retelling may appear easier to score because the teacher has a physical copy to
inspect and reflect back to, but they may be less reflective of understanding as the writing
demands complicate the process.
In addition to obtaining information about how the response mode influences
performance, retellings can reveal how the student performs with varying levels of
prompts. The amount of prompting in oral retellings can be adapted to meet students’
needs. When a retelling is aided, students are questioned and given prompts by the
teacher during their retell. An unaided retelling means students recall what they can
independently without questions or prompts (Reutzel & Cooter, 2007). Unaided recall

19
assesses what students generate without any information being provided by the
comprehension questions. As many children do not say all that they remember in an
unaided retelling, prompts may help them retrieve information to include in their
retelling. However, by prompting or aiding students in their retelling, the teacher may
indirectly indicate to the students which parts of their retelling to expand or elaborate on
(Reutzel & Cooter, 2007).
Oral retelling can be a valuable assessment tool for monitoring expository
comprehension because it provides information about a student’s expository
comprehension capability than standard question asking tasks, often presenting
information about how students employ comprehension strategies. Through retelling a
teacher can discern the students’ knowledge of expository text organization and structural
devices because the retold version would reflect the students’ understanding of how the
target passage was organized. Teachers who use retellings for comprehension assessment
find that they can monitor student progress effectively and thoroughly, and can do so in
less time than traditional methods (Gambrell, Pfeiffer, & Wilson, 1985; Reutzel &
Cooter, 2007). Retellings can help teachers gain insight into how students engage with
text, how much information students retain after reading, and how students organize
information (Moss, 2004). By using retelling as an assessment tool, educators can not
only assess students’ comprehension, but also their sense of test structure (Morrow,
1988).
Challenges of Oral Retelling as a Measurement Task
Despite the numerous advantages to using retelling as a means to assess
comprehension, there is still much to be explored. More information is needed regarding

20
what kind and how many passages should be used with a retelling assessment. Retellings
must be rated by someone. Researchers need to determine who should rate the retellings
and how many raters are needed to produce accurate scores. If only one rater is used, that
rater would need to be consistent on different occasions. If two or more raters are
necessary, investigators must study whether two raters can rate consistently with one
another or whether raters’ scores can be consistent with each rating occasion.
Statement of Purpose
Given the challenges associated with retelling, there are still reasons to research
its potential as a comprehension assessment. The Text Comprehension Rubric (TCR) is
an unpublished informal measure of expository text comprehension that was first
designed for use in the Achievement in Reading and Content Learning (ARC) grant
housed at Brigham Young University for use in the intermediate elementary grades. It
relies on oral retelling and enables examiners to judge student performance on a number
of comprehension dimensions.
The purpose of this study was twofold: (a) To assess the reliability of ratings of
fourth graders’ reading comprehension based on oral retellings of cause and effect
passages, and (b) to make informed decisions about what changes need to be made in the
assessment rubric and procedures to optimize the generalizability of the ratings.
More specifically, the study focuses on answering the following research
questions:
1. To what degree do inconsistencies between passages of the same level of
difficulty, inconsistencies between raters and rating occasions, and the interactions of
these facets contribute to discrepancies in scores obtained from the Text Comprehension
Rubric?

21
2. How should the number of passages, testing occasions, raters, and rating
occasions be modified to increase the reliability of the ratings?

22
Method
Participants
Twenty-eight elementary school children between 9;5 and 10;3 participated in this
study (mean chronological age of 9;10). The children were drawn from a single fourth
grade classroom at Scera Park Elementary School in Orem, Utah. All of the participants
spoke English as their primary language. Prior to test administration, a parent of each
participant signed an Informed Consent Document approved by the Brigham Young
University Human Subjects Research Committee (see Appendix A). According to the
classroom teacher, four children were identified as having either mild learning disabilities
or speech and language disabilities. These children were included in the study.
The Text Comprehension Rubric
The Text Comprehension Rubric (TCR) was created to evaluate comprehension
and recall of expository texts in intermediate elementary school children. The tool itself is
described here and the process of developing the tool is presented in the following
section.
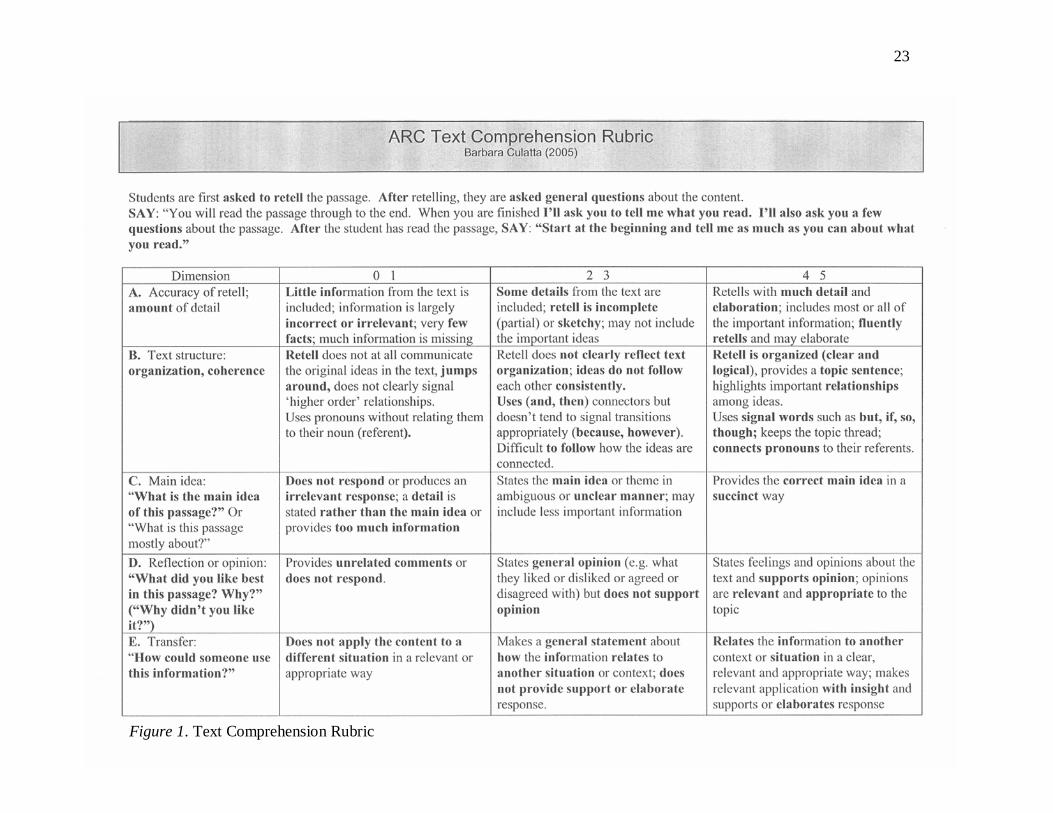
Task and Passages
The TCR uses oral retelling to assess expository comprehension. The rubric itself
appears in Figure 1. Five comprehension abilities are considered during the retelling: (a)
accuracy of retell, (b) identification of text structure, (c) identification of main idea, (d)
statement of opinion, and (e) transfer of text information. Accuracy of retell involves the
amount of correct and relevant information included in the retelling. Identification of text
structure evaluates the organization and coherence of the retell. The student is not
expected to state a specific text structure; instead the retell is evaluated for its
organization, topic sentence and relationship among ideas. Identification of main idea
23
Figure 1. Text Comprehension Rubric

24
assesses the student’s inclusion of the main idea in a succinct way. Statement of opinion
evaluates whether the student can state feelings or thoughts about the text and support
their opinions. Transfer of text information involves relating the information from the text
to another context or situation in a clear and relevant manner with sufficient elaboration.
The TCR was developed for use with two researcher-written expository passages,
Eli Whitney and Leaving for America (see Appendixes B and C for the text of the
passages). Topics for the passages were selected with fourth-grade students’ curriculum
in mind. Both passages had a cause/effect text structure. Passages were specifically
written to contain key grammatical connections such as though, as a result, and because
to signal the cause/effect structural organization of the passages.
Measurements of readability level were used to ensure comparability of the
content and sentence structure of the two passages. Eli Whitney was slightly longer than
Leaving America, with 147 versus 126 words, respectively. The Dale-Chall Readability
Formula (Chall & Dale, 1995) was used to examine variables in the passages such as
sentence length and vocabulary and to determine a reading level. According to the Dale-
Chall Readability Formula, the passages were at a reading level of 4.8 (fourth grade, 8th
month)
Administration
The administration consisted of procedures to evoke retelling and responses to
questions about the passages. The TCR consisted of procedures to introduce the task,
initiate recall, and request information.
Introduce the task. The classroom teacher explained to the students that they
would be participating in a reading task for a research study for Brigham Young

25
University. The teacher then sent students one-by-one to an unoccupied classroom to
meet with the test examiner. The test examiner began by asking the child to read aloud an
unfamiliar expository passage. “You will read this passage through to the end. When you
are finished, I’ll ask you to tell me what you read. I’ll also ask you a few questions about
the passage.”
Initiate the retell. After the student has read the passage, the examiner instructed
the student to “start at the beginning and tell me as much as you can about what you
read.” The child was then permitted as much time as needed to generate a response. No
other prompts were given.
Request information. After retelling the passage, the test administrator asked the
student three questions about the text, allowing sufficient time for the student to respond.
These questions were (a) “What is the main idea of this passage?,” (b) “What did you like
best about this passage and why?”, and (c) “How could someone use this information?”
Once the child gave a response to each question, the examiner provided a general prompt
of “Anything else?” before moving on. If the child provided no response, the test
administrator waited approximately one minute before continuing to the next question.
After the student retold the first passage and answered the questions, the examiner
gave the student the second passage to read. The same retelling and question answering
procedure used for the first passage were followed again.
Scoring
The students’ readings and retellings were digitally recorded for purposes of
scoring so that the examiner was not burdened with scoring while the test was being
administered. The examiner also ensured accuracy in scoring by verifying the recordings

26
if needed. The test examiner later listened to the recording and rated the student’s
responses according to the five previously discussed dimensions: (a) accuracy of retell,
(b) identification of text structure, (c) identification of main idea, (d) statement of
opinion, and (e) transfer of text information. Each dimension is worth five points, with a
total possible score of 25 points.
Guidelines were provided for scoring responses to each of the questions. In rating
the child’s reply to “How could someone use this information?” for example, the test
administrator referred to the three scoring columns for the transfer dimension (see Table
1). The first column on the left of the TCR form contains guidelines for a zero or one-
point response. If the child does not respond to the question or replies “I don’t know,”
then a zero is earned. One point is awarded if the student’s response “does not apply the
content to a different situation in a relevant or appropriate manner.” The second or
middle column contains guidelines for a two or three-point response. Two points are
awarded if the child makes a general statement but does not support the response. The
scoring criterion in this section indicates that the child “makes a general statement about
how the information relates to another situation or context, but does not provide support
or elaborate the response.” Three points are awarded if the child makes a general
statement and provides support or elaborates the response. The third or right column
contains scoring criteria for a four or five point response. The guidelines state that the
student “relates information to another context or situation in a clear, relevant and
appropriate way; makes a relevant application with insight and supports or elaborates
response.” If the child’s reply relates information in the passage to another context in a

27
relevant way, but fails to support or elaborate the ideas, then a score of four is awarded. If
the response meets all the stated criteria, then a score of five is earned.
Development of the TCR
Process
The TCR was first designed for use in the Achievement in Reading and Content
Learning (ARC) Grant operated out of Brigham Young University (Culatta, 2004). A
research committee consisting of the project principal investigator (Barbara Culatta),
project director (Karel Simms), and BYU faculty members (Kendra Hall, Nancy
Livingston, and Barbara Lawrence) developed the TCR tool. The process of creating the
TCR included reviewing existing retelling text comprehension tools, meeting as a
committee to determine rubric criteria, and testing a preliminary version in designated
school districts.
Review existing tools. A history of rubric assessments and other retelling text
comprehension tools was reviewed (Beaver, 2006; Johns, 2005; Merritt, 2000) to assist in
creating the TCR. The goal during development was to create a rubric that would reflect
and fit expository comprehension demands, which none of the existing instruments does.
The premise was that a measure focused on expository text comprehension would yield
more reliable assessment information than a general comprehension tool that could fit
narrative as well as expository texts.
Identify dimensions. The research committee met multiple times to determine
which expository text demands should be included in an expository text assessment. The
committee’s decisions were compiled into a rubric by the principal investigator and
reviewed again by the BYU faculty committee. Five district-level literacy specialists also
reviewed the measure and administered the newly created rubric to students in a small

28
field test. As part of the administration they recorded their observations, and provided
helpful feedback to the research committee.
Changes Made
The changes made in the TCR based on the feedback from the literacy specialists
were in the rubric’s content, passages, administration, and scoring.
Content. Initially the TCR was two pages long and comprised of eight sections in
the following order: (a) accuracy of retell, (b) text structure and organization, (c)
coordination and cohesion, (d) questions about the topic, (e) transfer, (f) reflection, (g)
main idea in response to a question, and (h) main idea stated in a topic sentence. After
using the measure, literacy specialists suggested that the rubric be condensed for quicker
and easier use. In response, two domains, questions about the topic and main idea in a
topic sentence, were eliminated. The sections text structure and organization and
coordination and cohesion were combined to form one domain. The remaining five
dimensions comprise the present TCR.
Use of a preliminary version of the measure also provided valuable feedback
about the wording of the three prompt questions. Originally the student was asked two
questions to assess the main idea “What is the passage about? What is the main or most
important idea?” To eliminate the more general request to tell what the story was about,
the questions were revised to the current, clearer form of “What is the main idea of this
passage?”
To initially assess a student’s reflection or opinion of a passage, the following
prompts were created “What do you think or feel about what you just read? What do you
think about the information?” This was simplified to “How did you like reading this
29
passage? Why?” and later to “What did you learn from reading this passage?” Eventually
the research committee felt that asking “What did you like best in this passage? Why?”
facilitated the best assessment of the student’s opinion or reflection of the text.
To evaluate a student’s ability to transfer information from the text to another
context, the prompts “How does what you just read relate to what you already know or
have experienced? How could this information be useful?” were asked. This was changed
to “If you needed to, how might you use the information in this passage?” After field-
testing, literary specialists recommended the question be simplified as it was too narrow
and the information from the text may not apply directly to the child. This resulted in
“How could you use this information?” Subsequent testing found that some students were
still having difficulty with the question. The problematic wording was then changed to its
final form of “How could someone use this information?”
Literary specialists also recommended changing the initial order of the
dimensions assessed on the scale. The original order (accuracy of retell, text structure,
transfer, reflection/opinion, and main idea) was revised so that the broad rather than
specific areas of comprehension assessment were at the end of the rubric (accuracy of
retell, text structure, main idea, reflection/opinion, and transfer).
Passages. It was determined that two passages should be used as part of the TCR
to increase the likelihood of getting a representative sample of the students’ ability to
comprehend expository text (Glissmeyer, 1998). The use of two passages increases the
probability that individuals will encounter information they have some background for
and/or interest in, and are thus able to comprehend the information.

30
Administration. Literary specialists provided useful feedback in developing the
TCR administration procedures as well as the tool itself. A specific script was created and
included at the top of the TCR (see Figure 1). This enabled test administrators to provide
clear and consistent instructions to students. With the first version of the instrument,
instructors told the student to “tell me as much as you can about what you read.” Literary
specialists found that if the child was directed to “Start at the beginning and tell me as
much as you can about what you read” then the retelling was more likely to be coherent
and chronologically ordered.
Scoring. The field testing of a preliminary version of the TCR was used to refine
scoring procedures. Scoring guidelines for each of the five dimensions were created and
placed in a three-column table format on the measure (see Figure 1). Scoring procedures
were first based on a scale of 1-9 with a total of 45 points. Following preliminary testing,
literary specialists suggested a scale of 1-5 with a total of 25 points for easier
computation. Later a score of 0 was added if the student did not respond or replied ‘I
don’t know.’ To facilitate quicker and easier scoring, key scoring terms were bolded.
Pilot Testing
Pilot testing was done using the revised version of the instrument to finalize
content, refine administration procedures, and establish reliable scoring procedures
associated with the instrument prior to its operational use. A pilot test administration was
conducted in a fourth-grade classroom at Scera Park Elementary, prior to beginning the
full test for this study. The classroom used for pilot testing was not the classroom used to
collect data for this study. In the pilot tests, the researcher (Rachel Burton) administered
all protocols individually to participating students in an unoccupied classroom to

31
minimize distractions. Student responses from the pilot study will be discussed in the
rater training section.
Test Administration Procedures
Following the pilot test administration, one examiner (Beverly Miner) was
selected to administer all protocols to participants. The examiner was chosen because of
her participation in the ARC grant as a district-level literacy specialist. All TCR
examinations were digitally recorded for purposes of scoring so that multiple scorers
could be used to ensure accuracy in scoring and reliability among raters.
Participants were individually directed from their own classroom into a
neighboring empty classroom. The examiner administered the TCR to twenty-eight
children in a fourth-grade class at Scera Park Elementary according to the developed
administration procedures.
Every participant read the same two passages (Eli Whitney and Leaving America)
both administered on two different days, one week apart. At the first retelling session, the
passages were given to students in random order. At the second session each student read
the passages in the reverse order from the one encountered in the first session. For
example, if the student started the first retelling reading Leaving America, he would start
the second session by reading Eli Whitney. Each student’s reading and retelling was
recorded using an Olympus (VN-960PC) digital voice recorder. The recorder was placed
approximately 18 inches from the participant’s mouth. Each session lasted approximately
eight minutes. There were no absences and all recordings went well. Scoring of the
protocols occurred after all tests were administered.

32
Rating
Training Procedures
The researcher trained the project director, the district-level literacy specialist
who participated in the pilot study and a graduate student in Speech-Language Pathology
on the scoring procedures for the TCR. The researcher had previously been trained by a
district-level literacy specialist before administering the pilot study and was therefore
qualified to train the other raters. The training took place during two, three-hour training
sessions in which the researcher and three others familiarized themselves with the TCR
and passages. Twelve specific examples of retelling responses from the pilot study were
then jointly rated and discussed.
Establishing Initial Reliability
Following the two training sessions, the researcher and three other raters
independently scored 10 assessments from the pilot testing. The scores were compared
for consistency and any differences identified and resolved. When the score received on
10 assessments was in agreement of 90% or better, the examiners independently scored
all of the protocols (exactly 112) by listening to the digital audio files. Inter-rater
agreement of the TCR was calculated based on the ratings of the participants’ protocols
and was found to be 90.2%.
Protocol Scoring
The researcher and the three other raters rated all protocols. Each rater rated each
recording on two different occasions with at least one week between sessions. The raters
rated all tapes independently, but on the same day, in the same room, and at the same
time. Raters were not allowed to listen to a recording more than once. Raters were able to

33
rate on-line, or during the recording rather than waiting until the students completed their
retelling. After all five dimensions were rated, raters added the number of points earned
out of 25 total possible points.
Design and Data Analysis
The study’s design was a 4-facet, nested design: R : (S x D) x P x O with R =
rater, S = student, D = day of test administration, P = passage, and O = rating occasion.
This rating design is displayed in Figure 2. The data were analyzed using generalizability
theory (Brennan, 2001; Cronbach, Gleser, Nanda, & Rajaratnam, 1972; Shavelson &
Webb, 1991). Generalizability theory uses a three-, four-, or five-factor random effects
analysis of variance. The variance components can be estimated using GENOVA, SPSS,
or SAS software. Generalizability analysis was used to estimate potential sources of error
in the rating, to obtain reliability estimates, and to make recommendations for improving
the rating process.
Two phases were completed as part of the Generalizability theory. The purpose of
phase one, referred to as the G study, was to obtain estimates of variance components for
each source of variability. The second phase, or D study, purpose was threefold: (a) to
estimate the reliability coefficients and the error variances, (b) to show how the size of
those statistics increases or decreases as a function of changing the number of passages
and raters

34
Figure 2. Rating Design
= Rating obtained
= No rating

35
Results
The purpose of this study was twofold: (a) to assess the reliability of ratings of
fourth graders’ reading comprehension based on oral retellings of cause and effect
passages, and (b) to make informed decisions about what changes need to be made in the
assessment rubric and procedures to optimize the generalizability of the ratings.
G Study Results
A G study was performed to answer research question 1. The results are displayed
in Table 1. The rows in Table 1 represent each of the possible sources of variability in the
ratings that can be estimated from a four-facet, nested design described as P x O x R: (S x
D) where P = passages, O = rating occasions, R = raters, S = students, and D = day.
Students were the object of measurement. The left column of numbers in Table 1 displays
the degrees of freedom for each source of variation. The second column displays the
estimated variance components for each possible sources of variability in the ratings. The
third column describes the relative magnitude of the corresponding variance estimate as a
percentage of the total variability in the ratings. These percentages were computed by
applying the heuristic suggested by Shavelson and Webb (1991). The sum of the variance
component estimates was computed first. Then each variance component estimate was
divided by this total and the quotient was multiplied by 100. The resulting percentages
describe the proportion of the total variance accounted for by each different source of
variability in the ratings.
The percentages in Table 1 provide a direct answer to research question 1. The
five largest sources of variability include (a) students, (b) the student-by-day interaction,

36
Table 1. Estimated Variance Components and Standard Errors
Source of Variability Degrees of Freedom
Estimated Variance
Component
Percent of Total
Variability Standard
Error Students 27 0.14221 33.9 0.05219 Passages 1 0.00001 0.0 0.00150 Day of Test Administration 1 0.00339 0.8 0.00893 Rating Occasion 1 0.00000* 0.0 0.00344 Raters (simultaneously nested within Students and Days) 56 0.00000* 0.0 0.01273 Student-by-rating occasion interaction 27 0.00000* 0.0 0.01097 Student-by-day interaction 27 0.04288 10.2 0.02965 Student-by-passage interaction 27 0.00000* 0.0 0.01621 Rating occasion-by-day interaction 1 0.00644 1.5 0.00686 Rating occasion-by-passage interaction 1 0.00000* 0.0 0.00049 Rating Occasion-by-rater (nested within student crossed with day)
56 0.00000* 0.0 0.00661
(Table continues)

37
* = Negative estimates of variance components were set to zero following the guidelines suggested by Brennan (1992, 2001)
Source of Variability Degrees of Freedom
Estimated Variance
Component
Percent of Total
Variability Standard
Error Passage-by-day interaction 1 0.00000* 0.0 0.00126
Passage-by-Rater (simultaneously nested with Student and Day) interaction
56 0.09794 23.3 0.02492
Student-by-Day-by-Rating Occasion interaction 27 0.01439 3.4 0.01790 Passage-by-Student-by-Rating Occasion interaction 27 0.00000* 0.0 0.01216 Student-by-Passage-by-Day interaction 27 0.00124 0.3 0.02864 Passage-by-Day-by-Rating Occasion interaction 1 0.00000* 0.0 0.00074 Passage-by-Rater (nested within Student crossed with Day)-by Occasion Interaction
56 0.06466 15.4 0.01200
Residual 27 0.04691 11.2 0.02165 447 0.42007 100.0
Table 1 (continued)

38
(c) the interaction of passage-by-rater (nested within student and day), (d) the student-by-
day-by-occasion interaction, (e) the passage-by-rater (nested within students crossed with
day)-by-rating occasion interaction, and (f) the residual. These six variance components
account for 97% of the variability in the ratings. The other 13 sources collectively
account for the remaining 3% of the variability.
The Variance Components
The variance component for students. The vertical axis of Figure 3 depicts the 0
to 5 scale on which the oral retellings were each rated. The solid line running across the
graph represents the grand mean (3.01) of all 28 students. The circles in the graph in
Figure 3 each represent the mean ratings for the various students. In other words, each
circle shows the mean rating for one student averaged over two passages, two testing
days, four raters, and both rating occasions. The resulting average for each student
provides an estimate of that student’s universe score, the rating which the student would
have received if they had read a large number of expository passages on multiple testing
days and if their oral retellings of each passage were rated by a large number of raters on
a variety of rating occasions. The purpose of any assessment procedure is to generalize
from a few observed scores or ratings collected for each student to this unobserved, ideal
datum.
Figure 3 shows the degree to which the average ratings for the 28 students used in
this study vary about the grand mean. The student means range from 1.875 to 3.80. Since
students are the individuals about whom the researcher intended to make inferences, they
are the object of measurement. The purpose for assessing the students’ reading ability

39
Figure 3. Variability of Student Mean Ratings about the Grand Mean
0.00
1.00
2.00
3.00
4.00
5.00
1 2 3 4 5 6 7 8 9 10 11 12 13 14 15 16 17 18 19 20 21 22 23 24 25 26 27 28
Student
Mea
n R
atin
g
Individual Student Means
Grand Mean

40
assumes that their reading comprehension differs from one student to another. Hence, in
the context of this study the variance due to students is considered desirable variance
rather than error variance. It specifies the proportion of the total variability in the ratings
is due to dependable or consistent differences in the student means averaged across the
passages read, the days the test was administered, the various raters, and the different
rating occasions. Ideally, the universe score variance should be large relative to the size
of the other estimated variance component estimates. As shown in Table 1 the variance
component for students accounted for nearly 34% of the total variation and was larger
than any of the other sources of variability.
Like all other variance components listed in Table 1, the variance component for
students is a sample estimate of an unknown parameter. This parameter describes the
extent to which the universe scores for other unobserved students in the population of
interest would likely vary from student to student.
The variance component for passages. The mean rating for passage 1 averaged
across all 28 students, the two testing days, all raters, and the two rating occasions was
2.987. The mean for passage 2 averaged across the same 28 students, the same testing
days, and all raters and rating occasions was 3.0625. Comparing these two means
indicates that passage 2 was slightly easier for these 28 students than passage 1. The
variability of these two passage means about the grand mean in the population was
estimated to be .0000029 with a standard error of .0015. The size of this variance
component is relatively small in comparison to some other sources of variability in the
ratings.

41
The variance component for student-by-day interaction. The mean ratings
(averaged across both passages) obtained by each student on each day the reading test
was administered are displayed in Figure 4. The mean rating for all 28 students was 2.92
on the first reading day and 3.06 on the second day. Overall then, the student means were
slightly higher on the second day than on the first. Since the students read the same two
passages on the second day that they had previously read on the first testing occasion, one
may be tempted to conclude that the increase of .14 points on the six-point scale was due
to the fact that the students were more familiar with each passage on the second reading
day. This proposed familiarity effect may account for at least part of the observed
difference in the mean ratings for the two days, but as shown in Figure 4 at least part of
the observed difference is due to the influence of one outlier, Student 5, whose low mean
on the first reading day has the effect of decreasing the grand mean of the students’
ratings on the first day thereby increasing the difference between the means of the first
and second days.
Figure 4 summarizes the differences in the students’ means on the two testing
days. Three basic patterns of change in the students’ means from the first reading day to
the second day are shown in Figure 4.
1. Lines that are approximately horizontal represent a student whose mean
performance was essentially the same on the two different testing days.
2. Lines that increase from the first testing day to the second are indicative of
students whose mean retelling rating was better on the second reading day.
3. Lines that decline from right to left represent students whose mean performance
on the second day was less than their performance on the first day.

42
Figure 4. Student Means by Day of Test Administration
0.0
1.0
2.0
3.0
4.0
5.0
First Day Second Day
Test Administration Day
Mea
n Ra
ting
S1S2S3S4S5S6S7S8S9S10S11S12S13S14S15S16S17S18S19S20S21S22S23S24S25S26S27S28

43
Many of the lines in Figure 4 display an increase in the means from the first day
to the second, but at least seven of them show a decrease, and five of them are relatively
flat. If there were no Student-by-Day interaction, the 28 lines in Figure 4 would all have
essentially the same slope and would be approximately parallel. As a consequence, the
relative ordering of the student means on the first day would be the same as their relative
ordering on the second day. However, the variance component for the Student-by-Day
interaction reported in Table 1 accounts for 10.2% percent of the total variance. The
presence of this interaction indicates that the mean ratings of the students in the
population to which the test user wishes to generalize are ordered differently on the two
testing days. Consequently, teachers, school administrators, parents, and researchers
should be cautious about making any generalizations about how well any individual
student can retell what he or she has read based on their response to this testing procedure
on any one day.
The variance component for student-by-day-by-occasion interaction. According
to Table 1, the three-way Student-by-Day-by-Occasion interaction accounts for 3.4% of
the variance in the mean ratings. A three-way interaction occurs when the interaction
between two variables differs at each level of a third variable. Figure 5 displays the
Student-by-Day-by-Occasion interaction. The graph on the left of Figure 5 plots the
mean ratings obtained by each of the 28 students on each of the two testing days on the
first rating occasion. Note that the relative order of the 28 students changes from the first
testing day to the second day. The differences in the relative order of the student means
on the two testing days reflect the two-way interaction for the first rating occasion.
However, the pattern of the two-way interaction changes from the graph on the left of

44
First Rating Occasion
0.0
0.5
1.0
1.5
2.0
2.5
3.0
3.5
4.0
4.5
5.0
Day 1 Day 2
Testing Day
Mea
n R
atin
g
S1
S2
S3
S4
S5
S6
S7
S8
S9
S10
S11
S12
S13
S14
S15
S16
S17
S18
S19
S20
S21
S22
S23
S24
S25
S26
S27
S28
Second Rating Occasion
0.0
0.5
1.0
1.5
2.0
2.5
3.0
3.5
4.0
4.5
5.0
Day 1 Day 2
Testing Day
Mea
n R
atin
g
S1
S2
S3
S4
S5
S6
S7
S8
S9
S10
S11
S12
S13
S14
S15
S16
S17
S18
S19
S20
S21
S22
S23
S24
S25
S26
S27
S28
Figure 5. Mean Ratings by Student by Rating Occasion.

45
Figure 5 (the first rating occasion) to the graph on the right side of Figure 5
(the second rating occasion). This pattern shift in the two-way Student-by-Day
interaction across the two levels of the Occasion variable produces the three-way
Student-by-Day-by-Occasion interaction. If this three-way interaction did not exist, the
pattern of the two-way interaction would be the same in both graphs displayed in Figure
5.
The variance component for the three-way interaction of passage-by-rater-by-
occasion. This three-way interaction is nested within students and days. Since each pair
of raters rated only half of the students on the first rating occasion, and since each pair of
raters rated a different group of students on the second rating occasion, the Raters facet is
simultaneously nested within the Students factor and the Rating Occasions facet.
Consequently, one of the variance components resulting from this design describes the
three-way interaction between Passages crossed with Raters (nested within Students and
Days) crossed with the Rating Occasion facet.
Whenever a two-way interaction occurs, it is helpful to plot the means of each
level of one factor at each level of the factor with which it interacts. Three-way
interactions are more complex, but they are best understood by realizing that when a
three-way interaction exists it simply indicates that the two-way interaction between two
of the crossed factors is not the same at each level of the third crossed factor. The three-
way interaction referred to in this section is somewhat more complex because the Rater
facet is nested within two different groups of students and two testing days in addition to
being crossed with the Passage facet and the Rating Occasion facet.

46
Since half of the students were rated by each pair of raters on each rating
occasion, for the purposes of understanding this three-way interaction the reader should
consider that there are two levels of the Student factor (Group 1 consisting of Students 1-
14 and Group 2 consisting of Students 15-28). Since there are also two levels of the Day
facet and two levels of the Rating Occasion facet, there are 2 times 2 times 2 = 8
conditions under which the two-way interaction between Raters and Passages occurs.
Figure 6 displays the two-way Rater by Passage interaction under each of these
eight possible combinations of student group, testing day, and rating occasion. In
attempting to interpret the graphs shown in Figure 6, readers should first note how the
eight graphs are organized. The four graphs in the column on the left side of the page all
show the results from the first day of testing, and the four graphs in the column on the
right side of the page all present results from the second day of testing. In addition, the
four graphs in the top two rows all depict results for the first rating occasion, while the
four graphs in the two rows at the bottom of the page all portray results for the second
rating occasion. Similarly, the graphs in the first and third rows of Figure 6 all report the
results obtained from the first block of students (Students 1-14) while the graphs in the
second and fourth rows report the results for the other half of the students (Students 15-
28). Readers should note that the scale of the vertical axis in the eight graphs displayed in
Figure 6 differs from the scale used to construct the vertical axis in the other graphs used
in this report. A larger scale was used in the graphs in Figure 6 in order to make the
graphs readable.

47
Figure 6. Raters by Passages within Students and Occasions
Students 1-14, First Testing Day,First Rating Occasion
2.52.62.72.82.93.03.13.23.33.43.5
Passage 1 Passage 2
Rater 1
Rater 3
Students 1-14, Second Testing Day,First Rating Occasion
2.52.62.72.82.93.03.13.23.33.43.5
Passage 1 Passage 2
Mea
n R
atin
g
Rater 1
Rater 3
Students 15-28, First Testing Day,First Rating Occasion
2.52.62.72.82.93.03.13.23.33.43.5
Passage 1 Passage 2
Rater 2
Rater 4
Students 15-28, Second Testing Day,First Rating Occasion
2.52.62.72.82.93.03.13.23.33.43.5
Passage 1 Passage 2
Rater 2
Rater 4
Students 1-14, First Testing Day,Second Rating Occasion
2.52.62.72.82.93.03.13.23.33.43.5
Passage 1 Passage 2
Rater 2Rater 4
Students 15-28, First Testing Day,Second Rating Occasion
2.52.62.72.82.93.03.13.23.33.43.5
Passage 1 Passage 2
Rater 1Rater 3
Students 1-14, Second Testing Day,Second Rating Occasion
2.52.62.72.82.93.03.13.23.33.43.5
Passage 1 Passage 2
Rater 2
Rater 4
Students 15-28, Second Testing Day,Second Rating Occasion
2.52.62.72.82.93.03.13.23.33.43.5
Passage 1 Passage 2
Rater 2
Rater 4

48
If no three-way interaction existed in the obtained ratings, then the two-way
interaction between Raters and Passages would be the same under each of the eight
conditions. In other words, the observed pattern of the two-way interaction between
Raters and Passages would be the same in each of the eight graphs.
However, inspection of the eight graphs in Figure 6 clearly shows that the two-
way interaction varies from graph to graph depending upon which half of the students are
being rated, which testing day is being considered, and which rating occasion is depicted
in a particular graph. The existence of this three-way interaction indicates that the rating
obtained for a particular student depends upon which passage the student read, which day
the test was administered, which rater did the rating, and on what occasion the rating was
performed. Hence, users of this assessment procedure should be careful to avoid
generalizing from a student’s performance on any single passage, day, rater, or rating
occasion. Instead, the test user would be better advised to compute a mean rating for
each student obtained by averaging across multiple passages administered on multiple
days, and rated by multiple raters on more than one rating occasion. However, this
advice leaves unanswered the question of how many passages, testing days, raters, and
rater occasions should be included in order to obtain a stable mean for each student. That
question will be addressed later in this report.
The variance component for the residual. Eighteen sources of variability can be
identified in the P x O x R: (S x D) design used in this study. The nineteenth line in
Table 1 is labeled "Residual." The variance component reported in this last line of Table
1 refers to the remainder or unidentified variance that is not explained by the 18
identified sources. Ideally, this residual variability should be small in comparison to the

49
identified or explained sources of variance. The fact that the residual accounts for only
11.2 percent of the variability in the mean ratings indicates that 88.8 percent of the total
variability is explained by the 18 identified sources. Hence, only about one-ninth of the
variability is left unexplained.
Negative Estimates of Variance Components
Each of the reported variance components in Table 1 is an estimate. If this study
were replicated on a different sample of students, testing days, raters, and rating
occasions, the estimated variance components would most likely differ somewhat from
the estimates obtained in this study. The standard error reported in Table 1 for each
variance component is a measure of how much each of the reported estimates would
likely vary from sample to sample. The smaller the standard error, the more precise the
estimate.
Since a variance is an average of squared deviations from the grand mean, the true
value in the population for each of the unknown variance parameters that are being
estimated must be positive. However, it is not uncommon to obtain negative estimates of
some of these unknown parameters especially when so many various components are
estimated from a small sample.
Nine of the variance components in this study had negative estimates including
(a) rating occasion, (b) raters (simultaneously nested within student and days), (c) the
student-by-rating occasion interaction, (d) the student-by-passage interaction, (e) the
passage-by-rating occasion interaction, (f) raters (nested within students crossed with
day)-by-rating occasion interaction, (g) the passage-by-day interaction, (h) the passage-
by-student-by-rating occasion interaction, and (i) the passage-by-day-by-rating occasion

50
interaction. These negative estimates most likely are the result of sample-to-sample
variability rather than misspecification of the measurement model.
The Brennan (1983) approach to dealing with negative estimates was used in this
study. It involves replacing each negative estimate with zero, but using the original
negative estimate in computing other variance components.
D Study Results
The predicted values of the error variances and generalizability indices for both
relative and absolute decisions may be obtained by conducting a decision study (D study)
using the variance components produced from the G study as input values (Breannan,
1992; Cronbach, et al., 1972; Shavelson & Webb, 1991). One of the main advantages of
generalizability theory is that it allows the researcher to determine how changing the
number of levels of each facet would most likely affect the size of the resulting error
variances and the two generalizability coefficients.
Although only two passages, two days of test administration, four raters, and two
rating occasions were used in testing the students in this study, the researcher conducted a
D study to obtain estimates of the various generalizability coefficients and error variances
projected to result if additional (or fewer) raters, passages, days of test administration,
and rating occasions were used. Since the results of the G study showed that the largest
variance components were for students and the interactions that involved day of test
administration, the researcher expected that increasing the number of days of test
administration would have a greater effect than increasing the number of passages tested,
or the number of raters, or rating occasions.

51
Two Different Kinds of Error Variance
Generalizability theory makes a distinction between relative and absolute
decisions. Relative decisions result when test scores, ratings, or other measurements are
used to make comparisons between students as a basis for making decisions about their
relative standing in a group. A student’s relative position in the group is influenced not
only by his or her individual performance, but by the performance of other students in the
group.
In contrast, absolute decisions result when ratings are used as a basis for making
conclusions about how individual students compare with some absolute standard or
cutscore. In this situation, the focus is to decide to what extent a student has achieved
criterion performance without regard for the performance of other students.
The purpose for emphasizing the difference between relative decisions and
absolute decisions is that the definition of what constitutes error in the ratings depends
upon whether the ratings are to be interpreted in a norm-referenced context or in a
criterion-referenced context. Ratings of oral retellings as indicators of students’ degree of
comprehension of passages they have read could be used as a basis for making either of
these two major types of interpretations.
Definition of relative error variance. “For relative decisions all variance
components representing interactions with the object of measurement contribute to error”
(Shavelson & Webb, 1991, p. 88). In other words, the relative error variance includes all
variance components that interact with the student effect. The square root of the relative
error variance is called the relative standard error and is analogous to the standard error
of measurement in classical, norm-referenced test theory (Brennan & Johnson, 1995).

52
Definition of absolute error variance. Shavelson and Webb (1991) explain
absolute error variances: “For absolute decisions all variance components except the
universe-score variance component contribute to error” (Shavelson & Webb, 1991, p.
88). So, the absolute error variance includes all variance components except the variance
component for students.
Projected relative error variance. The four panels in Figure 7 show how the size
of the relative standard error is projected to vary as a function of the number of passages
students may be asked to read, the number of testing days on which they read those
passages, and the number of raters used to rate their oral retellings. Inspection of the
graphs in Figure 6 reveals that the relative standard error decreases as the number of
passages, testing days, and raters is increased. But adding an extra reading day produces a
greater decrease in the relative standard error than adding an additional passage.
Furthermore, increasing the number of raters produces the least decrease in relative
standard error.
Projected absolute error variance. The overall pattern in Figure 7 is repeated in
Figure 8 except that the corresponding absolute error variances are higher because by
definition, as explained previously, the absolute error variances include more sources of
variability.
Two Different Kinds of Reliability
Just as they distinguish between two different kinds of error variance,
generalizability theorists also distinguish between two different coefficients for
estimating the generalizability of test scores, ratings, or other behavioral measures
(Brennan, 1992; Cronbach, et al., 1972; Shavelson & Webb, 1991). The first of these is

53
Figure 7. Standard Error of Relative Decisions by Number of Passages Read, Number of Days Tested, and Number of Raters
One Rater
.00
.10
.20
.30
.40
.50
.60
.70
.80
.90
1.00
1 2 3 4Number of Reading Days
g-co
effic
ient
4 Passages
3 Passages
2 Passages
1 Passage
Two Raters
.00
.10
.20
.30
.40
.50
.60
.70
.80
.90
1.00
1 2 3 4Number of Reading Days
g co
effic
ient
4 Passages
3 Passages
2 Passages
1 Passage
Three Raters
.00
.10
.20
.30
.40
.50
.60
.70
.80
.90
1.00
1 2 3 4Number of Reading Days
g co
effic
ient
4 Passages
3 Passages
2 Passages
1 Passage
Four Raters
.00
.10
.20
.30
.40
.50
.60
.70
.80
.90
1.00
1 2 3 4Number of Reading Days
g co
effic
ient
4 Passages
3 Passages2 Passages
1 Passage

54
Figure 8. Standard Error of Absolute Decisions by Number of Passages Read, Number of Days Tested, and Number of Raters
One Rater
.00
.10
.20
.30
.40
.50
.60
.70
.80
.90
1.00
1 2 3 4Number of Reading Days
g-co
effic
ient
4 Passages
3 Passages
2 Passages
1 Passage
Two Raters
.00
.10
.20
.30
.40
.50
.60
.70
.80
.90
1.00
1 2 3 4Number of Reading Days
g co
effic
ient
4 Passages
3 Passages
2 Passages
1 Passage
Three Raters
.00
.10
.20
.30
.40
.50
.60
.70
.80
.90
1.00
1 2 3 4Number of Reading Days
g co
effic
ient
4 Passages
3 Passages
2 Passages
1 Passage
Four Raters
.00
.10
.20
.30
.40
.50
.60
.70
.80
.90
1.00
1 2 3 4Number of Reading Days
g co
effic
ient
4 Passages
3 Passages2 Passages
1 Passage

55
called the g-coefficient and provides a way of summarizing the degree of generalizability
or dependability of ratings when used to make relative decisions. The second is called the
phi coefficient and provides a way of summarizing the degree of generalizability of
ratings used to make absolute decisions. Both of these coefficients are defined as the ratio
of universe score variance to the expected observed score variance. The only difference
between the two coefficients is the definition of what constitutes error variance.
The reliability coefficient for relative decisions. This generalizability coefficient is
the ratio of the universe score variance (σ 2
s) divided by the sum of the universe score
variance (σ 2
s) and the relative error variance (σ 2
Re l). The formula for this ratio is shown
below in equation 1.
σσσ
2
Re
2
2
ls
sg+
=
The denominator of the g-coefficient contains an extra term that is not included in
the numerator. Consequently, the denominator will always be larger than the numerator
unless the relative error variance is zero. In that case the numerator and the denominator
will be the same size and the reliability will be 1.0. That is the largest possible value of
the g-coefficient and it can only occur when the relative error variance is zero. Hence, the
g-coefficient is a proportion. It describes the proportion of total variance in the ratings
that is explained by the variability in the mean ratings for the various students.
Definition of reliability for absolute decisions. The coefficient used to summarize
the generalizability of absolute decisions is shown in equation 2. It is the same formula as
equation 1 except that the absolute error variance is substituted in place of the relative
error variance.
Equation 1

56
σσσ
φ 22
2
Absls
s
+=
One of the strengths of generalizability theory is its ability to provide estimates of
generalizability for both absolute decisions and relative decisions and to provide
estimates of the amount of measurement error involved in both contexts. Classical
approaches to reliability based on the use of correlation coefficients make no provision
for estimating reliability in the context of absolute decisions.
Projected reliability for relative decisions. The four panels in Figure 9 show how
the size of the generalizability coefficient varies as a function of the number of passages
students may be asked to read, the number of testing days on which they would read
those passages, and the number of raters that might be used to rate their oral retellings.
Inspection of the graphs in Figure 9 reveals that the generalizability coefficient increases
as the number of passages, testing days, and raters is increased. But adding an extra
reading day produces a greater increase in the generalizability coefficient than adding an
additional passage. In addition, increasing the number of raters produces the least
increase in the generalizability coefficient.
Projected reliability for absolute decisions. The overall pattern of the phi
coefficients presented in Figure 10 is the same as the pattern of g-coefficients in
displayed in Figure 9. The main difference is that the phi coefficients are slightly smaller
than the corresponding g coefficients because the phi coefficients are computed from the
Equation 2

57
Figure 9. Reliability of Relative Decisions about Students’ Reading Comprehension by Number of Passages Read, Number of Days
Tested, and Number of Raters
One Rater
.00
.10
.20
.30
.40
.50
.60
.70
.80
.90
1.00
1 2 3 4Number of Reading Days
g-co
effic
ient
4 Passages
3 Passages
2 Passages
1 Passage
Two Raters
.00
.10
.20
.30
.40
.50
.60
.70
.80
.90
1.00
1 2 3 4Number of Reading Days
g co
effic
ient
4 Passages
3 Passages
2 Passages
1 Passage
Four Raters
.00
.10
.20
.30
.40
.50
.60
.70
.80
.90
1.00
1 2 3 4Number of Reading Days
g co
effic
ient
4 Passages
3 Passages2 Passages
1 Passage
Three Raters
.00
.10
.20
.30
.40
.50
.60
.70
.80
.90
1.00
1 2 3 4Number of Reading Days
g co
effic
ient
4 Passages
3 Passages
2 Passages
1 Passage
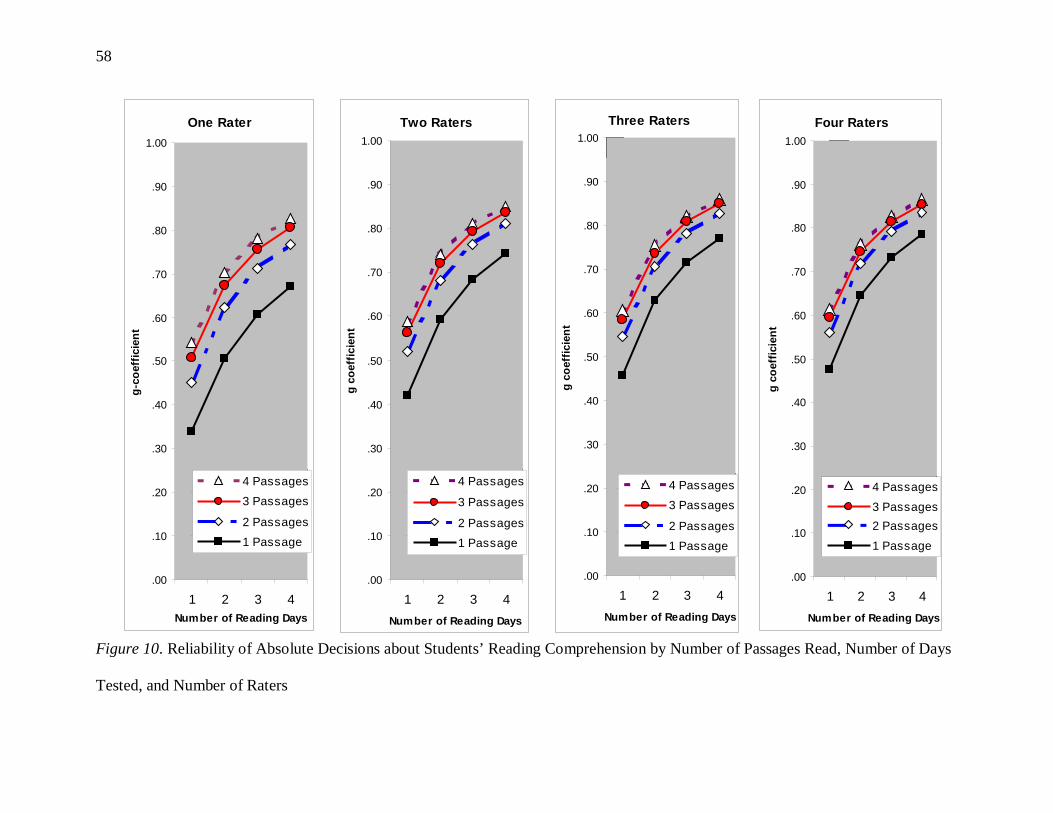
58
Figure 10. Reliability of Absolute Decisions about Students’ Reading Comprehension by Number of Passages Read, Number of Days
Tested, and Number of Raters
One Rater
.00
.10
.20
.30
.40
.50
.60
.70
.80
.90
1.00
1 2 3 4Number of Reading Days
g-co
effic
ient
4 Passages
3 Passages
2 Passages
1 Passage
Two Raters
.00
.10
.20
.30
.40
.50
.60
.70
.80
.90
1.00
1 2 3 4Number of Reading Days
g co
effic
ient
4 Passages
3 Passages
2 Passages
1 Passage
Three Raters
.00
.10
.20
.30
.40
.50
.60
.70
.80
.90
1.00
1 2 3 4Number of Reading Days
g co
effic
ient
4 Passages
3 Passages
2 Passages
1 Passage
Four Raters
.00
.10
.20
.30
.40
.50
.60
.70
.80
.90
1.00
1 2 3 4Number of Reading Days
g co
effic
ient
4 Passages
3 Passages2 Passages
1 Passage

59
absolute error variances which contain more sources or error than the relative error
variances on which the g-coefficients are based.
Summary
The purpose of this study was to expand the understanding of reading
comprehension assessment and its application to elementary school students. The
research was guided by the following two questions:
1. To what degree do inconsistencies between passages of the same level of
difficulty, inconsistencies between raters and rating occasions, and the interactions of
these facets contribute to discrepancies in scores obtained from the Text Comprehension
Rubric?
This question was answered by the G study and is summarized in Table 1 as well
as elaborated upon as a major part of this section. All the major variance components
were addressed as to their influence. The largest variance component was for the
students, the object of measurement. This finding indicates that the raters were able to
make dependable distinctions between the various students in terms of their ability to
comprehend what they had read and compose an oral retelling summarizing the meaning
they derived from the passages. The four facets analyzed in this study included the (a)
passages read, (b) the different days on which the children were tested, (c) the raters, and
(d) the rating occasions. None of these facets by themselves contributed significant error
in the ratings. Instead, the four largest sources of error in the ratings were two- and three-
way interactions and the residual. These included (a) the student-by-day interaction, (b)
the interaction between passages and raters (nested within students and days), (c) the
three-way passages-by-raters (nested within students and days) by-occasion interaction.

60
2. How should the number of passages, raters, and rating occasions be modified to
increase the reliability of the ratings?
This question was answered by the D study. The D study allowed the researcher
to determine how changing the number of levels of each facet would most likely affect
the size of the resulting error variances and the two generalizability coefficients. The
results of the D study indicate that adding an extra reading day would produce a greater
increase in reliability than asking the students to read more passages, and using more
raters or more rating occasions. The next most important way to increase the level of
reliability would be to have the students read an additional passage.
Generalizability theory is versatile for its ability to meet the needs of the
researcher. The D study allows the researcher several viable options depending on the
various constraints that must be considered. Time, expense, personnel, logistics, and
efficiency must all be taken into account. Using at least two raters, two passages, and
three test administration days is probably worth the expense. However, depending on the
constraints of the research resources available all can be manipulated accordingly. If the
researcher must compromise some aspect of the facets, he or she needs to be aware that
the relative error variance and generalizability coefficient will be compromised also. The
universe of generalization will be much smaller. The relative and absolute error variances
would increase and the generalizability and phi coefficients would be reduced.

61
Discussion
A student’s ability to comprehend expository text passages is essential for
academic success and subsequent learning throughout life (Seidenberg, 1989). While
classroom teachers assist students in developing proficiency in processing expository
passages, appropriate measures are needed to assess students’ comprehension of these
texts. Educators who utilize oral retelling as a means to assess comprehension can
evaluate students’ understanding of text structure and signal devices rather than their
recall of fragmented information that is commonly provided by answering text-dependent
questions (Moss, 2004). This study evaluated the feasibility of an oral retelling measure,
the Text Comprehension Rubric (TCR), and variables that influence the reliability of
ratings obtained from using this rubric.
Viability of TCR in Classroom Contexts
The results of this study indicate that the TCR can be used to obtain dependable
ratings of fourth graders’ reading comprehension based on oral retellings of cause and
effect passages. Findings specify under what circumstances students’ ratings can be
generalized.
Potential Use as an Assessment Tool
On the basis of the results, the TCR is judged to be an appropriate clinical tool.
The measure has the potential for use in the classroom as it provides reliable information,
permits on-line scoring, and enables teachers to make decisions regarding students’
processing of expository passages.
Provides reliable information. According to the G-study, the largest sources of
error variance in the TCR ratings were identified as (a) students, (b) the student-by-day
interaction, (c) passage-by-rater (nested within student and day) interaction, (d) the
62
student-by-day-by-occasion interaction, (e) the passage-by-rater (nested within student
crossed with day)-by-occasion interaction, and (f) the residual. These five variance
components account for 97% of the variability in the ratings, with the day of test
administration the most influential element in this study. All other sources collectively
account for the remaining 3% of the variability. The lack of variation for raters and rating
occasions supports the conclusion that there is a high degree of inter-rater reliability for
the TCR.
Because the tool is considered reliable, given training of raters that would be
comparable to that provided in the study, the TCR has the potential to provide educators
with detailed information regarding student understanding of expository passages.
Teachers who utilize the TCR can see whether ideas in the retell were logically connected
and signal devices were used. Unlike most measures with multiple choice response
options, the TCR also enables teachers to assess whether a student can identify main
ideas, state his or her opinion, and transfer key information in the passage to other
relevant situations.
Permits practical on-line scoring. Results from this study indicate that on-line
scoring of retellings can produce accurate judgments regarding students’ expository text
comprehension. Though the retellings were digitally recorded to allow multiple raters to
score, raters in this study were only able to listen to each recording once. These
conditions mimicked the intended format of TCR use in classrooms and results found
little variability in raters while scoring on-line.
This study’s findings are advantageous for educators as it is often not feasible to
take the time to transcribe students’ responses or record and later score student retellings.

63
Teachers who use the TCR to monitor performance often have one opportunity to rate,
which is while the student is retelling. By using the TCR, teachers can save time by rating
on-line, and ratings would indicate that they could have fairly accurate information
regarding their students’ expository comprehension abilities. It is important to note,
however, that raters who use the TCR need to be appropriately trained to ensure accurate
scoring. In addition, confidence in the information would depend on the type or purpose
of the assessment, whether it is to make instructional or placement decisions.
Enables informed decisions. Teachers can use students’ ratings to make relative or
absolute decisions. Relative decisions are judgments that draw comparisons among
students as a basis for making decisions about their relative standing in a group.
Classroom-based judgments typically stem from relative decisions. Relative decisions are
advantageous as they allow teachers to make judgments regarding which students need
what type of instruction. In regards to classroom use, student performance on the TCR
can be crucial in deciding how to group students for instruction and if some differentiated
instructional processes, supports, or strategies are needed.
In contrast, absolute decisions result when ratings are used as a basis for making
conclusions about how individual students compare with some absolute standard or
cutscore. According to the G-study, if absolute decisions were to be made from the TCR
performance, then higher criteria for generalizability would need to be relied on. Unless
teachers follow all recommendations for TCR use, they will need to be more cautious
when making absolute decisions.

64
Predictions for Use in Assessment Conditions
Findings from the D-study help specify what conditions need to be present during
the TCR assessment to optimize the generalizability of the ratings. Since teachers can
observe only a small fraction of potential student performance, they must generalize
beyond a sample of behavior to determine how the student would do if events or
variables were different (Oosterhof, 2003). Recommendations for generalizing TCR
ratings to various conditions (such as different test administration days, passages,
occasions, and raters) are included below.
Day of test administration and passage. Results of this study identify that the day
of test administration and the passage were more likely than the rater or rating occasion
to affect the dependability of a teacher’s generalization. As mentioned previously, adding
an extra day of test administration would produce a greater increase in reliability than
asking the students to read more passages or using more raters or more rating occasions.
According to the D-study, after adding a second day, the next way to increase the
level of reliability would be to have the students read an additional passage. Teachers
may be able to get a rough estimate of students’ ability to retell what they have read
based on their performance on a single passage, but if teachers wanted to obtain a
reliability of at least .70, students should read at least two passages on at least two
separate days and ideally have their retelling rated by at least two raters. The teacher
should then compute an average rating for each student averaged across the various
passages, testing days, and raters. However, having teachers rate retellings a second time
produces little increase in reliability and discourages rating on-line. Therefore, a second

65
rating occasion would probably not be worth the additional time, effort, and expense
required.
In general, the findings from this study show that the rating obtained for a
particular student depends primarily on whether the test was administered on the first or
second day and secondarily upon which passage the student read. The results emphasize
that researchers should avoid making inferences about students' abilities to read and retell
what they had read based on any single passage or testing day. Any further attempts to
use retelling to assess intermediate elementary students’ ability to comprehend expository
passage should include at least two days of test administration and two passages because
students were found to perform differently depending on the day and passage.
Passage effect. Results found that Passage 2 was slightly easier for the 28 students
in this study than Passage 1. As previously discussed, the size of this variability is
relatively small in comparison to the five largest sources of variability indicated in the G-
study. These results suggest that as long as teachers are sampling comprehension of
expository texts, the TCR can be employed with different passages comparable to the
ones used in this study. Future research should determine if this study’s results are true
for different types and complexities of passages.
Recommendations for Future Research
The TCR was found to be a practical clinical tool, but it should be used with
certain precautions. This study only investigated the use of the TCR with two cause/effect
passages. Future research is necessary to prove whether the TCR is viable with an
additional number of passages and passages comprised of different text structures.
Additionally, this study looked at student performance at only one grade level, thus more

66
information is needed to see whether the TCR could produce reliable results with
retellings from other grades.
Though the results indicated that the number of raters was not a major factor in
increasing reliability, any rater of the TCR needs to be knowledgeable and have training
similar to that given to the raters used in this study. Teachers must be appropriately
trained to administer and score the TCR for results to be considered reliable. Ample time
should be spent in training of raters. They should work together until they are confident
that they will be able to appropriately rate students’ retelling consistently.

67
References
Beaver, J., & Carter, M., 2006. Developmental Reading Assessment (2nd ed.). New York:
Celebration Press.
Block, C. C., & Pressley, M. (2001). Comprehension instruction: Research-based best
practices. New York: Guilford.
Brennan, R. L. (1983). Elements of generalizability theory. Iowa City: IA: American
College Testing Program
Brennan, R. L. (1992). Generalizability theory. Educational Measurement: Issues and
Practice, 11(4), 27-34
Brennan, R. L., (2001). Generalizability theory. New York: Springer.
Brennan, R. L., & Johnson E. G. (1995). Generalizability of performance assessments.
Educational Measurement: Issues and Practice, 14(4), 9-12, 27.
Carlisle, J. F. (1991). Language comprehension and text structure. In J. F. Kavanagh Ed.,
The language continuum from infancy to literacy (pp. 115-145). Parkton, MD:
York Press.
Cash, M. M., & Schumm, J. S. (2006). Making sense of knowledge: Comprehending
expository text. In Schumm, J. L. (Ed.). Reading assessment and instruction for
all learners, (pp. 262-296). New York: Guilford Press.
Chall, J. S., & Dale, E. (1995). Readability revisited: The new Dale-Chall readability
formula. Cambridge, MA: Brookline Books.
Cronbach, L. J., Gleser, G. C., Nanda, H., & Rajaratnam, N. (1972). The dependability of
behavioral measurement: Theory of generalizability of scores and profiles. New
York: Holt, Rinehart & Winston.
Cropley, A. J. (1996). Fostering the growth of high ability. Norwood, NJ: Ablex.

68
Culatta, B. (2004). Achievement in Reading and Content Learning Literacy. Unpublished
manuscript, Brigham Young University at Provo.
Culatta, B., Horn, D. G., & Merritt, D. D. (1998). Expository text: Facilitating
comprehension. In D. D. Merritt & B. Culatta (Eds.), Language intervention in
the classroom, (pp. 215-275). San Diego: Singular.
Davinroy, K. H., & Hiebert, E. H. (1984). An examination of teacher’s thinking about
assessment of expository text. In C. K. Kinzer & D. J. Leu (Eds.),
Multidimensional aspects of literacy research, theory, and practice (pp. 60-71).
Chicago: National Reading Conference.
Dickson, S. V., Simmon, D. C., & Kameenui, E. J. (1998). Text organization and its
relation to reading comprehension: A synthesis of the research. Technical Report
# 17. Special Educations Program, Washington D.C. Retrieved April 6, 2007,
from ERIC database.
Duke, N. K. (2000). 3.6 minutes per day: The scarcity of informational texts in the first
grade. Reading Research Quarterly, 35, 202-224.
Duke, N. K., & Pearson, P. D. (2002) In A. Farstrup & S. Samuels (Eds.), What Research
Has to Say About Reading Instruction (pp. 205-242). Newark, DE: International
Reading Association.
Dymock, S. (2005). Teaching expository text awareness. The Reading Teacher, 59(2),
177-182.
Farr, R., & Carey, R. F. (1986). Reading: What can be measured? Newark, DE:
International Reading Association.

69
Fiderer, A. (1998). 35 rubrics and checklists to assess reading and writing: Time saving
reproducible forms for meaningful literacy assessment. New York: Scholastic
Professional Books.
Gambrell, L. B., Pfeiffer, W., & Wilson, R. (1985). The effects of retelling upon reading
comprehension and recall of text information. Journal of Educational Research,
78, 216-220.
Glissmeyer, C. B. (1998). Oral retelling as a measure of reading comprehension: The
generalizability of ratings of college-aged second language learners reading
expository text (Doctoral dissertation, Brigham Young University, 1998).
Dissertation Abstracts International.
Graesser A., Golding, J. M., & Long, D. L. (1991). Narrative representation and
comprehension. In R. Barr, M. L. Kamil, P. Mosenthal, & P. D. Pearson (Eds.),
Handbook of reading research (Vol. 2, pp. 171-205). White Plains, NY:
Longman.
Hall, K. M., Markham, J. C., & Culatta, B. (2005). The development of the early
expository comprehension assessment (EECA): A look at reliability.
Communication Disorders Quarterly, 26(4), 195-206.
Halliday, M. A. K. (1975). Learning how to mean: Exploration in the development of
language. London, England: Edward Arnold.
Hoover, H. D., Dunbar, S. B., & Frisbie, D. A. (2005) Iowa Tests of Basic Skills. Rolling
Meadows, IL: Riverside Publishing.
Irwin, J. W. (1991). Teaching reading comprehension processes, (2nd ed.). Englewood
Cliffs, NJ: Prentice-Hall, Inc.

70
Johns, J. L. (2001) Basic reading inventory: Pre-primer through grade twelve and early
literacy assessments, (8th ed.). Dubuque, IA: Kendall/Hunt Publishing Company.
Johnston, P. H. (1997). Knowing literacy: Constructive literacy assessment. Portland,
ME: Stenhouse.
Kantor, R. N., Andersen, T. H., & Armbruster, B. B. (1983). How inconsiderate are
children’s textbook? Journal of Curriculum Studies, 15, 61-72.
Kelley, T. L., Ruch, G. M., & Terman, L. M. (2007) Stanford Achievement Test Series
(10th ed.). San Antonio, TX: Pearson Education, Inc.
Kinder, D., & Bursuck, W. (1991). The search for a unified social studies curriculum:
Does history really repeat itself? Journal of Learning Disabilities, 24(5), 270-275.
Kintsch, W., & Kintsch, E. (2005). Comprehension. In S. Paris & S. Stahl (Eds.),
Children’s Reading Comprehension and Assessment (pp. 71-92). Mahwah, NJ:
Lawrence Erlbaum Associates, Inc.
Kintsch, W., & Yarbrough, J. C. (1982). Role of rhetorical structure in text
comprehension. Journal of Educational Psychology, 74, 828-834.
Kucan, L., & Beck, I. L. (1997). Thinking aloud and reading comprehension research:
Inquiry, instruction, and social interaction. Review of Educational Research,
67(3), 271-299.
Leslie, L., & Caldwell, J. (2005). Qualitative Reading Inventory-IV New York:
HarperCollins College Publishers.
Lorch, R. F., Lorch, E. P., & Inman, W. E. (1993). Effects of signaling topic structure on
text recall. Journal of Educational Psychology, 85(2), 281-290.
71
MacGinitie, W. H., MacGuinitie, R. K., Maria, K., Dreyer, L. G., & Hughes, K. E.
(2002). Gates MacGinitie Reading Tests (4th ed.). Rolling Meadows, IL:
Riverside Publishing Company.
Merritt, D. (2000, August). Rubric for expository comprehension and expression. Paper
presented at the meeting of the Summer Language Institute.
Meyer, B. J. F., & Rice, G. E. (1984). The structure of text. In R. Barr, M. L. Kamil, P.
Mosenthal, & P. D. Pearson (Eds.), Handbook of Reading Research. New York:
Longman.
Morrow, L. M. (1988). Retelling stories as a diagnostic tool. In S. Glazer, L. Searfoss, &
L. Gentile (Eds.), Re-examining reading diagnosis (pp. 128-149). Newark, DE:
International Reading Association.
Moss, B. (2004). Teaching expository text structures through information trade book
retellings. The Reading Teacher, 57, p. 710-718.
National Institute of Child Health and Human Development. (2000). Report of the
National Reading Panel. Teaching children to read: An evidence-based
assessment of the scientific research literature on reading and its implications for
reading instruction (NIH Publication No. 00-4769). Washington, DC: U.S.
Government Printing Office.
Nitko, A. J. (1996). Educational assessment of students. Englewood Cliffs, NJ: Prentice-
Hall.
Osterhoff, A. (2003). Developing and using classroom assessments (3rd ed.). Englewood
Cliffs, NJ: Merrill.

72
Pintrich, P. (2002). The role of metacognitive knowledge in learning, teaching, and
assessing. Theory Into Practice, 41(4), p. 219-225.
Pressley, M., & Afflerbach, P. (1995). Verbal protocols of reading: The nature of
constructively responsive reading. Hillsdale, NJ: Erlbaum.
RAND Reading Study Group (Catherine Snow Chair). (2001). Reading for
understanding: Towards an R & D program in reading comprehension.
Washington DC: RAND.
Reutzel, D. R., & Cooter, R. B., Jr. (2007). Strategies for reading assessment and
instruction: Helping every child succeed (3rd ed.). Upper Saddle River, NJ:
Pearson Education, Inc.
Roe, B. D., & Burns, P. C. (2007). Informal Reading Inventory (7th ed.). Boston, MA:
Houghton Mifflin Company
Seidenberg, P. S. (1989). Relating text-processing research to reading and writing
instruction for learning disabled students. Learning Disabilities Focus, 5(1), 4-12.
Shavelson, R. J., & Webb, N. M. (1991). Generalizability theory: A primer. Newbury
Park, CA: Sage.
Silvaroli, N. J., & Wheelock, W. (2000). Classroom Reading Inventory (9th ed.).
Columbus, OH: McGraw-Hill.
Stein, N. I., & Glenn, C. (1979). An analysis of story comprehension in elementary
school children. In R. O. Freedle (Ed.), New Directions in discourse processing
(Vol. 2, pp. 53-120). Norwood, NJ: Ablex.
Sudweeks, R. R., Glissmeyer, C. B., Morrison, T. G., Wilcox, B. R., & Tanner, M. W.
(2004). Establishing reliable procedures for rating ELL students’ reading

73
comprehension using oral retellings. Reading Research and Instruction, 43(2), 65-
86.
Weaver, C. A., III, & Kintsch, W. (1991). Expository text. In R. Barr, M. L. Kamil, P.
Mosenthal, & P. D. Pearson (Eds.), Handbook of reading research (Vol. 2, pp.
230-244). White Plains, NY: Longman.
Westby, C. (1994). The effects of culture on genre, structure, and style of oral and written
texts. In G. P. Wallach & K. G. Butler (Eds.), Language learning disabilities in
school-age children and adolescents (pp. 180-218). New York: Merrill.
Williams, J. P. (2005). Instruction in reading comprehension for primary-grade students:
A focus on text structure. The Journal of Special Education, 39(1), 6-18.
Woodcock, R. W., McGrew, K. S., & Mather, N. (2001). Woodcock-Johnson III
Diagnostic Reading Battery. Rolling Meadow, IL: Riverside Publishing
Company.
Woods, M. L. J., & Moe, A. (2006). Analytical Reading Inventory (8th ed.). Upper Saddle
River, NJ: Prentice Hall.

74
Appendix A
Informed Consent

75

76
Appendix B
Passage 1
“Long live the king!” This was the favorite toast of Englishmen in the 17th and 18th centuries. Even though they loved their king, many people left England and sailed to America. Why did they leave home? Some left for religious freedom. The king and most of his subjects belonged to the Church of England. People who tried to worship differently were thrown in prison or even hanged. Others left because they hoped to find jobs and land in America. In England, a poor farmer could never become a respected landowner. If your parents were poor, you would probably be poor all your life. In America, if you worked hard, you might become rich! It wasn’t easy. But it was possible. America was the land of opportunity.
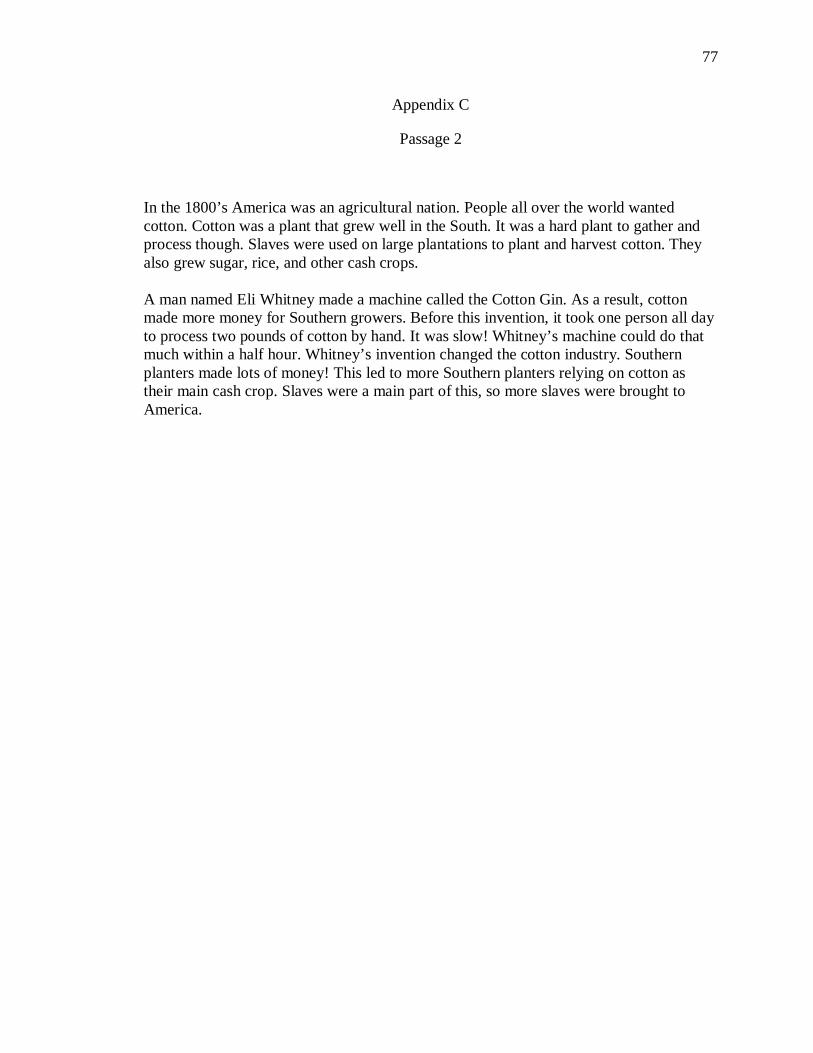
77
Appendix C
Passage 2
In the 1800’s America was an agricultural nation. People all over the world wanted cotton. Cotton was a plant that grew well in the South. It was a hard plant to gather and process though. Slaves were used on large plantations to plant and harvest cotton. They also grew sugar, rice, and other cash crops. A man named Eli Whitney made a machine called the Cotton Gin. As a result, cotton made more money for Southern growers. Before this invention, it took one person all day to process two pounds of cotton by hand. It was slow! Whitney’s machine could do that much within a half hour. Whitney’s invention changed the cotton industry. Southern planters made lots of money! This led to more Southern planters relying on cotton as their main cash crop. Slaves were a main part of this, so more slaves were brought to America.
Top Related