


![Formulation Design, Optimization and Pharmacodynamic ... · July - August 2014 Indian Journal of Pharmaceutical Sciences 355 pharmacodynamic potential[12]. Optimization of pharmaceutical](https://static.fdocuments.us/doc/165x107/5e0eee7778f0721e6f5387a9/formulation-design-optimization-and-pharmacodynamic-july-august-2014-indian.jpg)


Languages
Pages
Legal

i
CRANFIELD UNIVERSITY
Roberto Parra
Optimization of Bioprocess Design for Pharmaceutical Metabolites and Enzymes
Institute of BioScience and Technology
Applied Mycology Group
PhD THESIS

ii
CRANFIELD UNIVERSITY
Institute of BioScience and Technology
Applied Mycology Group
PhD THESIS
Academic Year 2003-2004
Roberto Parra e-mail: [email protected]
Optimization of Bioprocess Design for Pharmaceutical Metabolites and Enzymes
Supervisor: Professor Naresh Magan
August 2004
This thesis is submitted in partial fulfilment of the requirements for the degree of PhD
© Cranfield University 2004. All rights reserved. No part of this publication may be reproduced without the written permission of the copyright owner.

iii
ABSTRACT
This study examines the effect of ecophysiology on growth of cells and production of
enzymes and secondary metabolites produced by the fungi Aspergillus niger
(lysozyme) and a Phoma sp. (squalestatin S1). The effect of interactions of water
activity (aw) (0.99-0.90), temperature (20, 30 and 35°C) and modifying aw solute
(glycerol, NaCl) on growth and sporulation of a wild type strain of Aspergillus niger
(W) and two genetically engineered lysozyme producing strains (L11, B1) was
examined for the first time. Maximum growth rates were achieved for both strains
(L11 and B1) under moderate aw levels. Optimum conditions for growth of strain L11
were estimated by means of contour plot surfaces and found to be 0.965 aw with
glycerol as a solute at 35ºC (10.5 mm day-1). A model combining the effect of aw and
temperature on growth of strains of Aspergillus niger, and comparison with data on
food spoilage moulds in the literature was developed. The growth of two strains of A.
niger, as a function of temperature (25-30oC) and aw (0.90-0.99) was developed. The
estimation of the minimum aw (awmin) and optimal aw (awopt) levels were in accordance
with data in the literature for a range of other Aspergillus and related species,
regardless of the solutes used for aw modification. A central composition design was
used to describe the effects of water activity (aw, 0.98, 0.97 and 0.96), inoculum size
(2.7x10⁵, 2.7x10⁴ and 2.7x10³ spores ml-1), and three autoclaving procedure (A = all
components autoclaved together, B = medium autoclaved + maltose filtered and, C =
medium autoclaved + maltose & soya milk filtered) on the production of lysozyme by
two genetically-engineered strains of Aspergillus niger (B1 and L11) in a liquid
culture fermentation. Although both strains produced similar lysozyme concentrations
(15 mg l-1), different production patterns were found under the experimental
conditions. However, strain B1 produced relatively higher amounts of lysozyme under
water stress (0.96 aw) with all the substrates autoclaved together. Subsequently, a
central composition design was used to investigate: different immobilized polymer
types (alginate and pectate), polymer concentration (2 and 4% (w/v)), inoculum
support ratios (1:2 and 1:4) and gel-inducing agent concentration (CaCl2, 2 and 3.5%
(w/v)) on lysozyme production. Overall immobilization in Ca-pectate resulted in
higher lysozyme production compared to immobilization in Ca-alginate. Similar
effects were observed when the polymer concentration was reduced. A 13 fold higher

iv
lysozyme production was achieved with Ca-pectate in comparison to Ca-alginate (20-
23 and 0.5-1.7 mg l-1 respectively). Polymer modifications also significantly affected
the final pH and aw of the immobilized cell fermentation. The aw factor is a very
significant parameter in the immobilization design. A combined statistical
methodology of orthogonal design L27(313) and surface response methodology was
applied to optimize the composition and concentration of a liquid fermentation
medium for the production of squalestatin S1 by a Phoma species. Confirmatory
experiments of the optimal medium composition produced average concentrations of
434 mg l-1 in five days fermentation at 25oC. This represented an improvement over
60% of the maximum concentration achieved in the initial experiment and a two-fold
higher productivity in comparison with reported productivities of S1 in liquid
fermentations with different fungal species. Different liquid height and column
diameter (HL/Hr) ratios 3.7, 7.4 and 11.4 were studied in a bubble column (Dr=0.07
m) with a porous plate gas distributor, to find the effect on the gas hold up, power
consumption (PG/VL) and volumetric mass transfer coefficient, kLa performance,
under different superficial gas velocities calculated from the liquid properties and
flow rates (2, 4, 6 and 8 l min-1) and temperatures (15, 25 and 30oC). Two kLa models
were proposed based on the geometrical ratio (HL/Dr) and superficial gas velocity (m
s-1) (R2=0.951), and power consumption (PG/VL) (R2=0.950). A free cell fermentation
was performed in the bubble column, ratio (HL/Dr)= 3.7 and superficial gas velocity
U= 0.120 m s-1, at 25oC. The S1 production reached a level of 420 mg l-1. The
bioreactor scale up succeeded in maintaining the high S1 concentration obtained in
our previous work 434 mg l-1 in Erlenmeyer flasks but in a shorter time. A Plackett-
Burman design was used to improve the S1 produced by different immobilized
designs. The immobilized cell fermentation design considered: polymerization with
alginate and polygalacturonate and copolymerization, polymer concentration (alginate
3, 3.5 and 5 % w/v and pectate 4, 6 and 8 % w/v), 0.98, 0.96 and 0.94 aw levels,
inoculum levels of 10, 20 and 30 % wt. v/v, gel-inducer (CaCl2) 3, 4 and 5 % w/v,
gel-reinforce agent 0, 0.75 and 1.5 g l-1, air flow 4, 6 and 8 l min-1. Production of S1
reached levels of 883 mg l-1 which represent a 34 % improvement over the 660
mg l-1 produced in a stirred tank bioreactor (STR) with a free cell fermentation.

v
ACKNOWLEDGEMENTS This project was gratefully funded by the Mexican Council of Science and
Technology (CONACyT) and without the economical support could not have been
done. I am very grateful to everyone who helped in a direct or indirect way to make
this project possible. I have put a lot of blood, sweat, and tears into this project, but I
could not have done it alone. First my lovely wife Graciela who supported me all
along and never lost faith whatever the situations, sharing my dreams with me. My
mentor and good friend Professor Naresh Magan for his continual and solid support in
which I found stability and certainty with absolute confidence. He always showed me,
not only the technical or scientific aspect in the work, but team work and friendship.
To Professor Tajalli Keshavarz for the encouragement and the time to read this thesis
and all the interest shown in this work. Esther Baxter my good friend who helped me
in difficult times and very much in the writing of the thesis. To Dr. Conrad Bessant
for all his help and enthusiasm shown to my project. To my Mother Lucy and Mother
in law Maru for helping us with Lizeth and making a big effort to be with us because
of the love to our family. To my Father with all his support and encouragement. To
my Sister Maria and Mauricio for all the support and help from the start of the PhD.
To my Uncle Alberto for all his support and for being so important to me. To all my
family in Mexico who always encouraged me to do what I enjoy and very especially
to my daughter Lizeth to whom I wish to dedicate my work, just because she is my
little girl and makes my life so happy.
vi
List of contents
CHAPTER I LITERATURE REVIEW .................................................................1
1.1 INTRODUCTION ...............................................................................................2
1.2 WATER ACTIVITY AND FUNGAL GROWTH..............................................6
1.3 MODELLING OF FUNGAL GROWTH AND METABOLITE / PROTEIN
PRODUCTION..........................................................................................................8
1.4 IMPACT OF FERMENTATION MEDIUM ON THE PRODUCTION OF
SECONDARY METABOLITES AND ENZYMES.................................................9
1.4.1 Medium composition ....................................................................................9
1.4.2 Effect of medium sterilization on metabolite production ...........................11
1.4.3 Effect of inoculum size ...............................................................................12
1.5 STATISTICAL APPROACH TO INCLUDE MULTIPLE FACTORS FOR
OPTIMAL CONCENTRATION OF USEFUL PRODUCTS.................................13
1.6 IMMOBILIZATION OF FUNGAL BIOMASS FOR IMPROVED
PRODUCTIVITY....................................................................................................14
1. 7 BIOREACTORS...............................................................................................16
1.8 MODEL SYSTEMS USED IN THIS WORK...................................................17
1.8.1 The secondary metabolite squalestatin S1 ..................................................17
1.8.2 Heterologous protein hen egg white lysozyme (HEWL)............................17
1.9 OBJECTIVES....................................................................................................18
CHAPTER II WATER ACTIVITY, SOLUTE AND TEMPERATURE -
MODIFIED GROWTH AND SPORE PRODUCTION OF WILD TYPE AND
GENETICALLY ENGINEERED Aspergillus niger STRAINS ............................22
2.1 INTRODUCTION .............................................................................................23
2.2 MATERIALS AND METHODS.......................................................................23
2.2.1 Fungal strains ..............................................................................................23
2.2.2 Media preparation, incubation and growth rate assessment .......................24
2.2.3 Experimental design and data treatment .....................................................25
2.3 RESULTS ..........................................................................................................25
vii
2.3.1 Effect of environmental factors on growth .................................................25
2.3.2 Effects of environmental conditions on sporulation of A.niger strains ......29
2.4 DISCUSION ......................................................................................................35
2.5 CONCLUSIONS................................................................................................36
CHAPTER III MODELLING THE EFFECT OF TEMPERATURE AND
WATER ACTIVITY ON GROWTH OF Aspergillus niger STRAINS AND
APPLICATIONS FOR FOOD SPOILAGE MOULDS .........................................37
3.1 INTRODUCTION .............................................................................................38
3.2 MATERIALS AND METHODS.......................................................................39
3.2.1 Fungal strains ..............................................................................................39
3.2.2 Media preparation, incubation and growth rate assessment .......................39
3.2.3 Assessment of hyphal growth rate ..............................................................39
3.2.4 Experimental design and data treatment .....................................................39
3.2.5 Model development ....................................................................................40
3.3 RESULTS ..........................................................................................................41
3.4 DISCUSSION....................................................................................................45
3.4.1 Comparisons with published data ...............................................................45
CHAPTER IV EFFECT OF WATER ACTIVITY, INOCULUM SIZE AND
AUTOCLAVING PROCEDURE ON LYSOZYME PRODUCITION BY TWO
GENETICALLY ENGINEERED Aspergillus niger STRAINS ............................58
4.1 INTRODUCTION .............................................................................................59
4.2 MATERIALS AND METHODS.......................................................................60
4.2.1 Fungal Strains .............................................................................................60
4.2.2 Activation and Strain Inoculation ...............................................................60
4.2.3 Media Preparation and Incubation ..............................................................61
4.2.4 Lysozyme Analysis.....................................................................................61
4.2.5 Experimental Design and Data Treatment..................................................62
4.3 RESULTS ..........................................................................................................62
4.3.1 Effect of Environmental Conditions on the Production of Lysozyme........63

viii
4.3.2 Interactions Between Water Activity, Inoculum Size and Autoclaving
Procedure .............................................................................................................67
4.4 DISCUSSION....................................................................................................67
CHAPTER V A NOVEL IMMOBILIZED DESIGN FOR THE PRODUCTION
OF HETEROLOGOUS PROTEIN LYSOZYME BY GENETICALLY
ENGINEERED Aspergillus niger STRAINS...........................................................73
5.1 INTRODUCTIUON ..........................................................................................74
5.2 MATERIALS AND METHODS.......................................................................76
5.3 Fungal strains .................................................................................................76
5.4 Activation and inoculation............................................................................76
5.5 Immobilization...............................................................................................76
5.6 Media preparation and incubation .................................................................77
5.7 Lysozyme analysis .........................................................................................77
5.8 Experimental design and data treatment ........................................................77
5.3 RESULTS ..........................................................................................................78
5.3.1 Interactions between polymer type and concentration, inoculum-polymer
ratio and gel-inducer ............................................................................................79
5.3.2 pH and water availability conditions in the final lysozyme concentration.86
5.3.3 Lysozyme optimization...............................................................................87
5.4 DISCUSSION....................................................................................................87
5.4.1 Immobilization, polymer type and inoculum level .....................................87
5.4.2 Comparison between immobilized and free cells .......................................92
CHAPTER VI MEDIUM OPTIMIZATION FOR THE PRODUCTION OF
THE SECONDARY METABOLITE SQUALESTATIN S1 BY A Phoma sp.
COMBINING ORTHOGONAL DESIGN AND REPONSE SURFACE
METHODOLOGY ....................................................................................................94
6.1 INTRODUCTION .............................................................................................95
6.2 MATERIALS AND METHODS.......................................................................97
6.2.1 Fungal strains ..............................................................................................97
6.2.2 Activation and strain inoculation ................................................................98
6.2.3 Media composition......................................................................................98
ix
6.2.4 Sample preparation and analyses for squalistatin S1..................................98
Sample preparation ..............................................................................................98
HPLC system .......................................................................................................99
6.2.5 Experimental design and data treatment .....................................................99
6.3 RESULTS ........................................................................................................102
6.3.1 Effect of medium constituents on the S1 production................................102
6.3.2 Model development ..................................................................................105
6.4 DISCUSSION..................................................................................................118
CHAPTER VII DESIGN OF A BUBBLE COLUMN BIOREACTOR BASED
ON THE VOLUMETRIC MASS TRANFER COEFFICIENT AND SCALE UP
OF SQUALESTATIN S1 PRODUCED BY Phoma sp.........................................121
7.1 INTODUCTION..............................................................................................122
7.2 MATERIALS AND METHODS.....................................................................123
7.2.1 Volumetric mass transfer kLa experiment.................................................123
7.2.2 FERMENTATION ...................................................................................127
Fungal strains .....................................................................................................127
Activation and strain inoculation ......................................................................127
Media composition.............................................................................................127
7.2.3 BIOREACTOR.........................................................................................127
7.2.4 ANALYSIS OF SQUALESTATIN S1 PRODUCITION ........................128
7.3 RESULTS AND DISCUSSION......................................................................128
7.4 CONCLUSIONS..............................................................................................145
CHAPTER VIII EXPLORATION OF NOVEL IMMOBILIZATION
SYSTEMS IN BUBBLE COLUMN BIOREACTOR FOR THE PRODUCTION
OF SQUALESTATIN S1 BY A Phoma SPECIES AND COMPARISON WITH
A FREE CELL CULTURE STIRRED TANK REACTOR ................................146
8.1 INTRODUCTION ...........................................................................................147
8.2 MATERIALS AND METHODS.....................................................................148
8.2.1 Fungal strains ............................................................................................148
8.2.2 Activation and inoculation.......................................................................148
8.2.3 Immobilization..........................................................................................148

x
8.2.4 Media preparation and incubation ............................................................149
8.2.5 Bioreactors ................................................................................................149
8.2.6 Determination of total nitrogen and carbon ..............................................150
8.2.7 Squalestatin analysis ................................................................................150
8.2.8 Experimental design and data treatment ...................................................150
8.3 RESULTS ........................................................................................................151
8.3.1 Evaluation of optimization immobilization conditions.............................157
8.4 DISCUSSION..................................................................................................166
CHAPTER IX
CONCLUSIONS AND FURTHER WORK..........................................................170
9.1 CONCLUSIONS..............................................................................................171
Conclusions summary........................................................................................171
Chapter II ...........................................................................................................171
Chapter III..........................................................................................................172
Chapter IV..........................................................................................................173
Chapter V...........................................................................................................174
Chapter VI..........................................................................................................175
Chapter VII ........................................................................................................176
Chapter VIII .......................................................................................................176
Overall findings .................................................................................................177
9.2 FUTURE WORK.............................................................................................178
Lysozyme produced by Aspergillus niger B1....................................................178
Squalestatin 1 produced by Phoma sp. ..............................................................178
APPENDIX I REFEREED PAPERS IN THIS THESIS .....................................179
REFERENCES.........................................................................................................180

xi
List of figures
Figure 1.1. Diagram form of the components studied ................................................20
Figure 1.1. Diagram of the components studied (cont..).............................................21
Figure 2.1. Effect of water activity modified with glycerol and NaCl at 25 ºC (a,b), 30
ºC (c, d) and 35 ºC (e, f) on colony diameter of Aspergillus niger L11 ..............26
Figure 2.2. Comparison of growth rate (mm/day) of three strains of Aspergillus niger
(L11, B1 and native strain W). Water activity modified with a) glycerol b) NaCl
at 35 ºC.................................................................................................................27
Figure 2.3. Contour surface of aw against temperature effects on growth rate
(mm day-1). The number in the figure (□)=mm day-1 ..........................................30
Figure 2.4. Effect of water activity modified with a) glycerol and b) NaCl on spore
production (spores cm-2) at 35oC in three strains of A. niger...............................32
Figure 2.5. A. niger L11 spore production (spores cm-2) contour surface of water
activity and temperature.......................................................................................34
Figure 3.1. Experimental plots (■) and our model (Eq. (3.4))(▬), for A. niger L11 at
25oC (a), 30oC (b) and 35oC (c) growing in MEA modified with glycerol as
humectant (R2=0.990). .........................................................................................43
Figure 3.2. Experimental plots (■) and our model (Eq. (3.4))(▬), growth rate vs aw
for A. niger B1 at 25oC (a), 30oC (b) and 35oC (c) growing in MEA modified
with glycerol as humectant (R2=0.990). ..............................................................44
Figure 3.3. Simulated A. niger L11 growth rate (ln(µ, mm day-1)) under a generated
set of the normal distributed design parameter within the aw range at (a) 25oC, (b)
30oC and (c) 35oC. ..............................................................................................46
xii
Figure 3.4. Generated surface of the modelled and experimental data (o) of aw and
temperature on growth rate expressed as logarithm (Ln(µ, [mm day-1])) for A.
niger L11 (a) and B1 (b) [R2=0.99]. ....................................................................47
Figure 3.5. Optimal water activities (awopt) confidence intervals vs. reported
humectants and forecasted awopt (▬)(Eq. 3.4) for A. niger L11 and B1..............49
Figure 3.6. Optimal water activities (awopt) confidence intervals vs. reported
temperature and forecasted awopt (▬)(Eq. 4) for A. niger L11 and B1. ...............50
Figure 3.7. Optimal water activities (awopt) confidence intervals vs. reported
Aspergillus species and forecasted awopt (▬)(Eq. 4) for A. niger L11 and B1. ...51
Figure 3.8. Minimal water activity (awmin) confidence intervals vs. reported humectant
and forecasted awopt at 25(▬), 30(▪▪▪) and 35oC (▬ ▪ ▬) (Eq. 4) for A. niger L11
and B1. .................................................................................................................53
Figure 3.9. Minimal water activity (awmin) confidence intervals vs. reported
temperature and forecasted awopt at 25(▬), 30(▪▪▪) and 35oC (▬ ▪ ▬) (Eq. 4) for
A. niger L11 and B1.............................................................................................54
Figure 3.10. Minimal water activity (awmin) confidence intervals vs. reported data on
Aspergillus and related species and forecasted awopt at 25(▬), 30(▪▪▪) and 35oC
(▬ ▪ ▬) (Eq. 4) for A. niger L11 and B1. ...........................................................55
Figure 4.1. Kinetic of best treatments for lysozyme production by A. niger B1 on
autoclaving procedure A treatment no. 1 (♦), and 3 (●) and procedure B
treatment no. 9 (○) ...............................................................................................65
Figure 4.2. Perturbation plot showing the predicted effect of water activity, inoculum
size and the autoclaving procedure on the production of lysozyme ....................68

xiii
Figure. 4.3 Response surface showing predicted effect of water activity and the
inoculum size on lysozyme production by A. niger B1 under different
autoclaving procedure: A (a), B (b) and, C (c) ....................................................69
Figure 5.1. Kinetic of lysozyme production with free cell fermentations inoculated.81
Figure 5.2. Standard Pareto distribution of polymer type and concentration, inoculum
polymer ratio and gel-inducer agent ranked by importance on the production of
lysozyme ..............................................................................................................84
Figure 5.3. (a) Effect of inoculum:polymer ratio and polymer concentration on the
production of heterologous lysozyme. (b) Effect of polymer type and polymer
concentration on the production of lysozyme......................................................85
Figure 5.4. (a) Relation between pH of active culture and lysozyme production at
different experimental conditions and at time: 2 (♦) 6 (■), and 10 days (▲), dots
represent the tendency. (b) Effect of beads water activity on the production of
lysozyme ..............................................................................................................88
Figure 5.5. Predicted mean lysozyme production. The vertex represented by the
codified conditions in the coordinated axes: (x) polymer type, (y) polymer
concentration, (z) inoculum ratio.........................................................................89
Figure 6.1.Graphical analysis of the relationship between media formulation and
squalestatin S1 production. Each factor had three coded levels and the (○)
represent mean squalestatin S1 produced ..........................................................109
Figure 6.2. Residual diagnostics of contour surface of the quadratic model of the
predicted vs. observed by replicated of squalestatin S1 production ..................110
Figure 6.3. Response surfaces fitted to the experimental data points corresponding to
the production of squalestatin S1 under different precursors (P) ......................112

xiv
Figure 6.4. Contour diagram of squalestatin S1 generated by the model as a function
of: (a) oily precursors, (b) nitrogen, (c) trace elements, and (d) peptone versus
carbon sources....................................................................................................113
Figure 6.5. Contour diagram of squalestatin S1 generated by the model as a function
of: (a) trace elements, (b) nitrogen, (c) peptone and (d) precursors against
precursors (OP) ..................................................................................................114
Figure 6.6. Contour diagram of squalestatin S1 generated by the model as a function
of; (a) nitrogen and trace elements, (b) peptone and trace elements, (c) peptone
and nitrogen, (d) iron and trace elements...........................................................115
Figure 6.7. S1 concentrations reported in the literature for various species of fungi.
(References in brackets).....................................................................................116
Figure 6.8. S1 productivity reported in the literature for various species of fungi ...117
Figure 7.1. (a). Schematic diagram of the bioreactor dimensions (a) (measurements in
m): 1 litre (A), 2 litres (B) and 3 litres (C).........................................................124
Figure 7.2. Diagram of the bioreactor configuration and connections set. ...............125
Figure 7.3. Gas hold up ε as a function of superficial gas velocity U, obtained in
three columns with height/diameter ratio (HL/Dr): 11.4 (◊), 7.4 (□) and 3.7 (∆) at
three different temperatures ...............................................................................130
Figure 7.4. Variation of the volumetric mass transfer coefficient kLa with superficial
gas velocity U at different column ratios (HL/Dr): 11.4 (∆), 7.4 (□) and 3.7 (◊) at
three different temperatures 15 oC (a), 25 oC (b) and 30oC (c)..........................131
Figure 7.5. Variation of the volumetric mass transfer coefficient kLa/ε with
superficial gas velocity U at different column ratios (HL/Dr): 11.4 (∆), 7.4 (□)
and 3.7 (◊) at three different temperatures 15oC (a), 25oC (b) and 30oC (c) .....132
xv
Figure 7.6. Effect of HL/Dr on the kLa under different average superficial gas
velocities U x 102 (m s-1): 12 (○), 8.4 (∆), 5.3 (□) and 2.3 (◊) ..........................134
Figure 7.7. Hold up vs. power consumption in the column (air-water) at different
column ratios (HL/Dr): 11.4 (◊), 7.4 (□) and 3.7 (∆) at three different
temperatures 15oC (a), 25oC (b) and 30oC (c)....................................................135
Figure 7.8. Mass transfer coefficient vs. power consumption in the column (air-water)
at different column ratios (HL/Dr): 11.4 (◊), 7.4 (□) and 3.7 (∆) at three different
temperatures 15oC (a), 25oC (b) and 30oC (c)....................................................136
Figure 7.9. Residual diagnostics of the kLaL surface generated by the model Eq. 6
(Van’t Riet, 1979) of the predicted vs. observed ...............................................138
Figure 7.10. Volumetric mass transfer coefficient kLaL surface (Eq. 7.8) in function
of the superficial gas velocity (U) and the ratio (HL/Dr)....................................140
Figure 7.11. Volumetric mass transfer coefficient kLaL surface (Eq. 7.9) in function
of the power consumption (PG/VL) and the ratio (HL/Dr) ..................................141
Figure 7.12. Residual diagnostics of the kLaL surface generated by the model Eq. 7.8
(a) and Eq. 7.9 (b) of the predicted vs. observed ..............................................142
Figure 8.1. Residual diagnostics of the linear Plackett-Burman model of the (a)
experimental observed (○) against the predicted (―) production of S1 (mg l-1)
and (b) experimental raw residuals (○) against the studentized (t) residuals (―)
............................................................................................................................156
Figure 8.2. Illustration of squalestatin S1 concentration produced under different
factor and levels combinations on the experimental design ..............................158
Figure 8.3. Illustration of squalestatin S1 concentration produced under three
different factors and two levels combinations on the experimental design .......160
xvi
Figure 8.4. Coded experimental (●) and predicted (···) production of squalestatin S1
and the uncoded levels for calcium alginate gel CAG (○) and calcium pectate
gel CPG (□) gel levels of squalestatin S1 production at 72 hours of fermentation
............................................................................................................................161
Figure 8.5. Squalestatin S1 produced under different inoculum sizes (a) and gel-
inducer (CaCl2) concentration (b). The experimental (○) and forecasted (●)
squalestatin concentrations at 72 hours of fermentation....................................162
Figure 8.6. Squalestatin S1 produced under different gel- reinforce agent (chitosan)
concentration (a) and air flow ratos (b). The experimental (○) and forecasted (●)
squalestatin concentrations at 72 hours of fermentation....................................163
Figure 8.7. Kinetics of squalestatin S1 production in bubble column bioreactor
inoculated with under optimal immobilized cell conditions..............................168
Figure 8.8. Kinetic of squalestatin S1 production in stirred tank bioreactor inoculated
with free cells.....................................................................................................169
xvii
List of tables
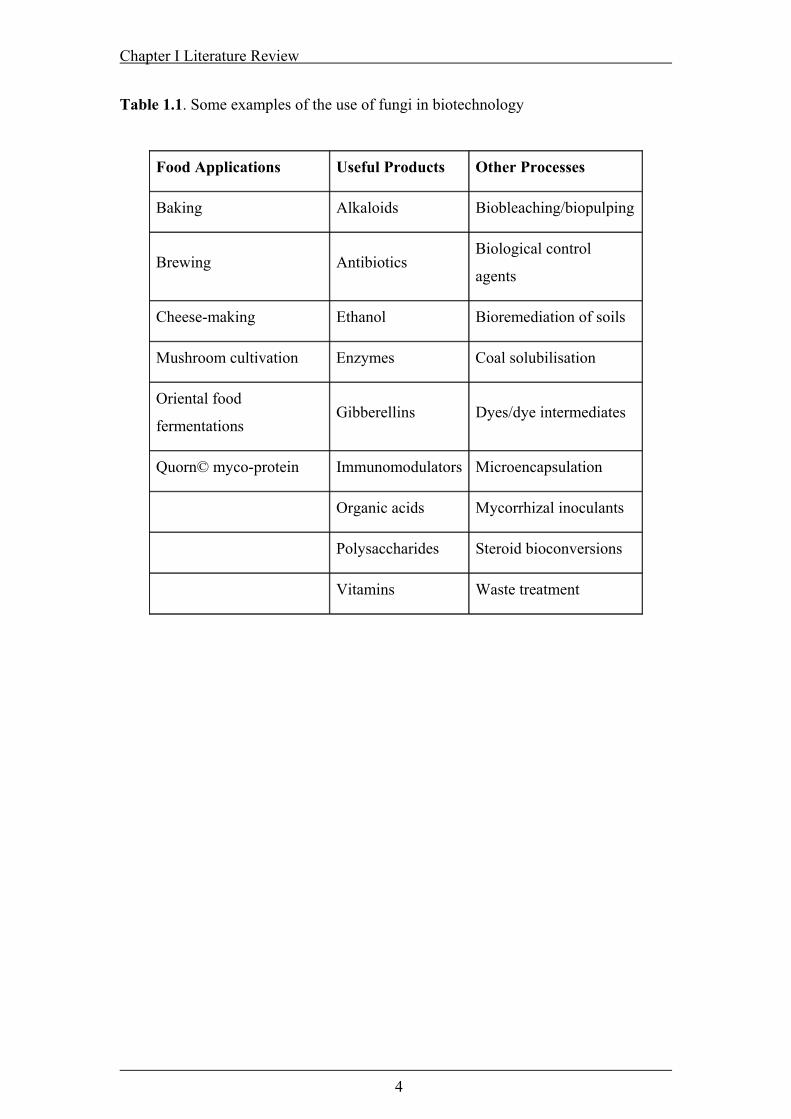
Table 1.1. Some examples of the use of fungi in biotechnology ..................................4
Table 2.1. Analysis of variance of water activity (aw), solutes type, and temperatures
in the growth rate of three strains of Aspergillus niger (L11, B1 and native
strain W)...............................................................................................................28
Table 2.2. Optimal combination of factor and levels found with orthogonal design
optimization. ........................................................................................................31
Table 2.3. Analysis of variance of water activity (aw), solutes type, and temperatures
in the spore production of three strains of Aspergillus niger (L11, B1 and native
strain W)...............................................................................................................33
Table 3.1. Standard deviation of the model of the data for Aspergillus niger strains
L11 and B1...........................................................................................................42
Table 3.2. Parameter estimation for Eq. (3.4), their asymptotic standard errors and
performance statistics for (a) A. niger strain L11 and (b) strain B1. ...................42
Table 3.3. Comparison of published growth rates (µm h-1) of Aspergillus niger B1
and L11 studied with published growth rates at various aw’s ..............................56
Table 4.1. Experimental design, observed and predicted values of lysozyme
production by Aspergillus niger L11 and B1 under different environmental
conditions.............................................................................................................64
Table 5.1. Experimental design, observed and predicted values of lysozyme
production by Aspergillus niger B1 under different immobilization and inoculum
conditions: 250 ml-shake flask with 100 ml operation volume at 25oC and 150
rpm. ......................................................................................................................80

xviii
Table 5.2. Final pH of the fermentation medium, beads water activity, observed and
predicted values of lysozyme production ............................................................82
Table 5.3. Analysis of variance of the effect of polymer type (Ca-pectate or Ca-
alginate) and concentration, gel-inducer concentration and inoculum levels......83
Table 5.4. Factors, levels, predicted and confidence interval under the best
immobilization conditions for maximal heterologous protein production ..........90
Table 6.1. Experimental design combinations for the factors and levels used for the
optimization of squalestatin production.............................................................100
Table 6.2. The trace elements solution......................................................................101
Table 6.3. Experimental conditions and average concentrations of S1 produced with
the orthogonal design L27 (313) ..........................................................................103
Table 6.4. The analysis of variance L27(313) orthogonal test on optimization of culture
medium in shake flask culture ...........................................................................104
Table 8.1. Factor and levels evaluated in the Plackett-Burman screening design ....153
Table 8.2. Plackett-Burman experimental and predicted sqaulestatine S1 production
under the different immobilized cell fermentations...........................................154
Table 8.3. Parameter estimates of first order model, including curvature, from
Plackett-Burman experiment .............................................................................155
Table 8.4. Optimal conditions for Phoma sp. immobilization for the production of
squalestatin S1 evaluated in the Plackett-Burman screening design .................164
xix
List of abbreviations
ε Overall gas hold up (-) a Correlation coefficient Eq. 5 and Eq. 6 (m-β s- β)
aw Water activity (-)
awmax Maximal water activity
awmin Minimal water activity
awopt Optimal water activity
b Exponent coefficient Eq. 5 and Eq. 6 (-)
b0, b1, b2, b3 and b4 design parameters (Eq 3.4)
bw 1-aw
C* Steady state (or saturation) dissolved oxygen concentration (kg m-3)
CL Oxygen concentration in the liquid at different times (kg m-3)
CL0 Initial oxygen concentration in the liquid (kg m-3)
db Effective bubble diameter (m)
df Degrees of freedom
Dr Column diameter (m)
F Fisher’s number
g Acceleration due to gravity (m s-2)
HE Aerated liquid height (m)
HL Height of the liquid without aeration (m)
HL/Dr Liquid height and column diameter ratio (-)
kLa Volumetric mass transfer coefficient (s-1)
kLa L Volumetric mass transfer coefficient per unit volume of liquid (s-1)
m Fungal growth rate (mm day-1)
MS Mean square sum
P Significance descriptive level
P vapour pressure of water in a substrate Pa
P0 vapour pressure of pure water Pa
PG/PV Power consumption (W m-3)
Ph Reactor head-space pressure (Pa)
Qm Air molar flow (kmol s-1)
R Gas constant (8.134 J K-1 mol-1)
SD Standard deviation

xx
SE Standard error
t Time (s)
T Temperature (K)
T Temperature (oC)
Tmax maximum temperature for growth (oC)
Tmin minimal temperature for growth (oC)
U Superficial gas velocity (m s-1)
Xi molar fraction of solutes (-)
Xw molar fraction of water with other solutes (-)
ρL Water density (kg m-3)

Chapter I Literature Review
1
CHAPTER I
LITERATURE REVIEW
Chapter I Literature Review
2
1.1 INTRODUCTION
Biotechnology has been one of the scientific fields with the highest growth rates
during the past 50 years which has come from the integration of biological, physical
and engineering sciences in order to achieve technological application of biological
systems. Most biotechnological processes make use of microorganisms such as
bacteria, yeasts and filamentous fungi, but vascular plants, algae and even animal
tissue can also be utilised. Biotechnology is not an industry in itself, but an important
technology that is having a large impact on many different industrial sectors. This
technology is not new: People have for a long time known how to crossbreed plants
and animals for better concentrations for traditional products such as bread, beer,
cheese, and wine. In textile processing the enzymatic removal of starch from woven
fabrics has been in use for the last century and the fermentation vat is probably one of
the oldest tools known for dyeing materials. These processes are characterised by the
direct application of live organisms and the in situ production of enzymes and other
products. New biotechnology has a stronger focus on the application of biological
products or enzymes and these are often produced ex situ. One of the advantages of
the new biotechnology over classical biotechnology is that the process can be
improved and optimized as the mass balance is easier to control.
In recent years, the term biotechnology has also been used to refer to novel techniques
such as recombinant DNA and cell fusion. Recombinant DNA allows the direct
manipulation of genetic material of individual cells, which may be used to develop
useful microorganisms as well as microorganisms that produce new products. The
laboratory technology for genetic manipulation within living cells is also known as
genetic engineering. A major objective of this technology is to splice a foreign gene
for a desired product into circular forms of DNA (plasmids), and then to insert them
into an organism, so that the foreign gene can be expressed to produce the product
from the organism.
The applications of this new biotechnology are numerous in the production of
pharmaceuticals e.g. antibiotics, antigens, antibodies and vaccines. Previously,
Chapter I Literature Review
3
expensive and rare pharmaceuticals such as insulin for diabetics, human growth
hormone to treat children with dwarfism, interferon to fight infections, vaccines to
prevent diseases, and monoclonal antibodies for diagnostics could be produced from
genetically engineered cells inexpensively and in large quantities (Lee, 1992). In the
last few years there have been very rapid developments in genetic manipulation
techniques (genetic engineering) which has introduced the possibility of 'tailoring'
organisms in order to optimise the production of established or novel metabolites of
commercial importance and of transferring of genetic material (genes) from one
organism to another. Biotechnology also offers the potential for new industrial
processes that require less energy and are based on renewable raw materials. It is
important to note that biotechnology is not just concerned with biology, but it is a
truly interdisciplinary subject involving the integration of natural and engineering
sciences.
Biotechnological processes have been developed for most of the food and
pharmaceutical industries and a number of them have been successfully
commercialised (Leach, 1992). Some of the most important organisms used in
biotechnology are fungi. Examples of the products and processes involving fungi are
shown in Table 1.1.
Successful commercialization of biotechnological processes requires the development
of large-scale processes that are technologically viable and economically efficient. To
scale up a laboratory-scale operation into a large industrial process, it is not possible
to just make the vessel bigger. For example, a small Erlenmeyer flask (100 ml) in a
shaken culture can be an excellent way to cultivate fungal cells, but for a large-scale
production of 2000 l, a significant number of factors need to be considered. We need
to design an effective bioreactor to cultivate the cells under optimum conditions.
Because of this, biochemical engineering is one of the major areas in biotechnology
important for commercialization.
Chapter I Literature Review
4
Table 1.1. Some examples of the use of fungi in biotechnology
Food Applications Useful Products Other Processes
Baking Alkaloids Biobleaching/biopulping
Brewing Antibiotics Biological control
agents
Cheese-making Ethanol Bioremediation of soils
Mushroom cultivation Enzymes Coal solubilisation
Oriental food
fermentations Gibberellins Dyes/dye intermediates
Quorn© myco-protein Immunomodulators Microencapsulation
Organic acids Mycorrhizal inoculants
Polysaccharides Steroid bioconversions
Vitamins Waste treatment
Chapter I Literature Review
5
A typical fermentation process (bioprocess) involving microbial cells requires
investigation of raw materials, biomass, and how they are treated and mixed with
other ingredients required for cells to grow well. The medium, is sterilized to
eliminate all other living microorganisms and introduced to a large cylindrical vessel,
bioreactor or fermenter, typically equipped with agitators, baffles, air spargers, and
various sensing devices for the control of the fermentation conditions. A pure strain of
a microorganism is normally introduced into the vessel. The bioreactor supports the
natural process by providing suitable conditions such as optimum temperatures, pH,
sufficient substrate, nutritional salts, vitamins and oxygen (for aerobic organisms),
enabling cells to grow and form metabolites and enzymes. The cells will start to
multiply exponentially after a certain period of lag time and reach a maximum cell
concentration as the medium is depleted. The fermentation in a batch culture will be
stopped and the contents pumped out for the product recovery and purification.
Biotechnology is an interdisciplinary field with contributions from basic life science
disciplines such as microbiology, molecular and cell biology, biochemistry, genetics
and engineering including chemical, control and instrumentation. The entire process
can be divided into three stages;
Stage I: Upstream processing which involves preparation of liquid medium,
separation of particulate and inhibitory chemicals from the medium,
sterilization and air purification
Stage II: Fermentation, when the conversion of substrates to the desired product
with the help of biological agents such as microorganisms
Stage III: Downstream processing which involves separation of cells from the
fermentation broth, purification and concentration of the desired product
and waste disposal or recycling of waste
Depending on the type of product, the concentration levels it produces and the purity
desired, the fermentation stage might constitute anywhere between 5-50% of the total
fixed and operating costs of the process. Therefore, optimal design and operation of a
bioreactor frequently dominates the overall technological and economic performance
of the process. This process can be operated either in a batch mode or continuously.
Chapter I Literature Review
6
To carry out a bioprocess on a large scale, it is necessary to investigate and develop
three principle areas:
1. to obtain the best biocatalyst (microorganisms, animal cell, plant cell, or enzyme)
and medium optimization for a desired process
2. to create the best possible environment for the catalyst to perform by designing the
bioreactor and operating it in the most efficient way
3. to separate the desired products from the reaction mixture in the most economical
way.
To obtain optimal biocatalyst activity (microorganisms, e.g., bacteria, yeasts or
filamentous fungi) it is necessary to develop an understanding of the in behaviour
under different ecological and environmental conditions for a specific microorganism.
Filamentous fungi such as Aspergillus niger, Aspergillus oryzae and Trichoderma
reesei are able to secrete large concentrations of enzymes (e.g. amylases, proteases,
cellulases), metabolites and organic acids into the environment. This property has
been widely exploited by the food and beverage industries (Conesa et al., 2001).
Increasingly, these species are being used to produce recombinant proteins.
Filamentous fungi offer advantages for the production of recombinant proteins: they
possess an efficient secretion system, are able to glycosylate proteins and have higher
specific growth rates than plant, insect or mammalian cells (Lin et al., 1993).
1.2 WATER ACTIVITY AND FUNGAL GROWTH
The commercial use of the fungal secretory machinery and the limitations
encountered in the production of heterologous proteins has stimulated research into
genetics, design of fermentation media, and optimization of the environmental
conditions to enhance the heterologous protein production. Growth of filamentous
fungi has been shown to be dependent on thermodynamic factors such as water
availability and temperature (Scott, 1957; Gervais, 1988) and chemical factors such as
glucose, O2, and CO2, concentrations (Trinci, 1969; Trinci and Collinge, 1973). The
most important environmental stress parameter that influences fungal activity and
Chapter I Literature Review
7
secondary metabolite production is water availability (water activity, aw) (Magan et
al., 2004).
Microorganisms all require a source of water to enable cellular functioning to occur
effectively. They have a semi-permeable cell membrane, which permits water
molecules to enter the cell through osmosis and come to equilibrium with the outer
environment. Certain groups of yeasts and filamentous fungi have over time evolved
the capability to adapt to extreme environments (dry conditions) and exploit niches
occupied by few other microorganisms (Magan, 1997).
The total water of any substance is the sum of the bound water (water of constitution),
which is held in chemical union with other compounds by very strong forces, and free
water, which is weakly bound. Free water is the most readily available for microbial
growth and metabolism. Scott (1957) suggested that the water activity (aw) would
best describe the water availability for microbial activity. Thus the aw is the ratio
between the vapour pressure of water in a substrate (P) and the vapour pressure of
pure water (P0) at the same temperature and pressure:
0w P
Pa = Eq. 1.1
The aw of pure water is given the value 1.00. As the solute concentration increases,
the aw decreases according to the second law of thermodynamics.
P=Xw P0 or P=(1-Xi) P0 Eq. 1.2
Then the reduction of vapour pressure is related to the molar fraction of water with
other solutes Xw and ionic or no-ionic solutes Xi.
From an ecological point of view little information is available on whether, in liquid
fermentation systems, genetically modified strains will behave in a similar manner to
wild type strains or not. No studies have attempted to evaluate this, although it has
been shown that in wild type strains of pharmaceutically useful fungi, subtle changes
in water stress can result in a significant stimulation of secondary metabolite
production. It has been demonstrated that significant improvements in pharmaceutical

Chapter I Literature Review
8
metabolite production can occur when aw stress is imposed during fungal growth
(Baxter et al., 1998; Aldred et al., 1999).
1.3 MODELLING OF FUNGAL GROWTH AND
METABOLITE / PROTEIN PRODUCTION
There has been interest in understanding and modelling the effect of and interactions
between environmental conditions and effects on growth and production of useful
products. In the last two decades, predictive food microbiology has included the
development of models capable of describing the growth of pathogenic bacteria
(Buchanan and Phillips, 1990). However, predictive modelling of filamentous fungal
growth has not received the same attention (Gibson et al., 1994; Gibson and Hocking,
1997). Two of the most important environmental parameters that determine the ability
of moulds to grow on foods are water activity (aw) and temperature (T) (Scott, 1957).
An empirical approach to modelling the effects of aw on mould growth was used by
Gibson et al. (1994) who found that the logarithm of the fungal growth rate (µ,
measured as the increase in colony radial growth per unit of time) showed a parabolic
relationship with the square root of bw. The bw was defined as the difference between
the aw of pure water (1) and that of a set aw for a specific growth kinetic. They
investigated the appropriateness of models that were previously used to predict
bacterial growth for the interpretation of mould growth data.
Much work has been directed towards the development of models for bacterial growth
as a function of temperature and aw (McMeekin et al., 1987; Zwietering et al., 1994;
Rosso et al., 1995). The temperature dependence of the specific growth rate of
bacteria may be modelled by means of the square root model (Ratkowsky et al., 1983)
with the cardinal parameters (e.g. the minimal temperature for growth, Tmin and the
maximum temperature for growth, Tmax). For example, Marin et al. (1995) developed
a predictive method modelling the effect of aw, temperature and time on fumonisin
production by Fusarium strains. More recently, some modelling of ochratoxin
production by Aspergillus carbonarius has also been reported (Mitchell et al., 2004,
Belli et al., 2004). This showed that optimal conditions for growth (30-35oC) were

Chapter I Literature Review
9
different from that for ochratoxin production (OTA). Furthermore, aw and temperature
limits for growth were different from than for secondary metabolite production.
Cuppers et al. (1997) successfully combined the models of Rosso et al. (1995) and
Ratkowsky et al. (1983) to describe the combined effects of temperature and NaCl on
the growth rate of some food spoilage moulds. The four moulds used, Penicillium
chrysogenum, Cladosporium cladosporoides, Aspergillus flavus and Alternaria
alternata, were inoculated at the optimum temperature for growth and at pH close to
optimum for growth. However, little knowledge is available on the impact of such
interacting factors on pharmaceutically useful production. Much more is known of the
effects on toxic secondary metabolites production (mycotoxins) (Sanchis and
Magan, 2004).
1.4 IMPACT OF FERMENTATION MEDIUM ON THE
PRODUCTION OF SECONDARY METABOLITES AND
ENZYMES
1.4.1 Medium composition
Fungi have been widely used for the production of heterologous as well as
homologous proteins. However the levels of production of heterologous proteins do
not exceed a few tens of milligrams per litre (Gouka et al., 1997). Filamentous fungi
are able to utilize a great variety of carbon and nitrogen sources by secreting a range
of different enzymes into their environment.
Some key intermediates of primary metabolism serve as branching points of
biosynthetic pathways leading to end products of primary and secondary metabolism.
Secondary metabolism is regulated by precursors, carbon sources, nitrogen sources,
phosphate, trace elements, induction of enzymes of secondary metabolism, catabolic
repression and inhibition, feedback repression and inhibition, and control by auto-
regulators (Betina, 1994).
The available cell precursor levels may regulate antibiotic/secondary metabolite
production, especially when the specific synthase is already active in the cells
(Betina, 1994). There are differences between the carbon sources for growth and

Chapter I Literature Review
10
secondary metabolism. For example, glucose is usually an excellent source for growth
but may interfere with secondary metabolism. Glucose has also been shown to
interfere with the biosynthesis of actinomycin, benzodiazepine alkaloids,
cephalosporin, chlorotetracycline, enniantin, ergot alkaloids, erythromycin,
kanamycin, oleandomycin, penicillin, puromycin, tetracycline and tylosin (Demain,
1992). The synthesis of pectinolytic enzymes is considerably influenced by the
glucose content of the cultivation medium containing mixed carbon sources in a
predetermined optimal ratio (Panda et al., 2004).
The effect of nitrogen sources on secondary metabolism is conditioned by several
factors including the type of metabolic pathway, the producing organism, the type and
concentration of the nitrogen sources and whether cultures are stationary or
submerged. Very often, secondary metabolic pathways are negatively affected by
nitrogen sources favourable for growth (Betina, 1994). Negative effects of ammonium
salts have been reported in the production of cephalosporine, penicillin, erythromycin,
tylosin, leucomycin, chloramphenicol, macbecin, rifamycin, streptomycin,
streptothricin and tetracycline (Demain, 1992).
It is known that several trace elements are essential for microbial growth because of
their involvement in metalloenzymes or as enzyme activators. In secondary
metabolism, zinc, iron and manganese are the most important trace elements. Several
reports have been published on the importance of these three elements in secondary
metabolite production (Betina, 1994).
In developing a biotechnological industrial process, designing the fermentation
medium is of critical importance. The fermentation medium affects the product
concentration and volumetric productivity. It is also important to reduce the cost of
the medium as much as possible, as this may affect the overall process economics.
Medium screening studies are very time consuming and expensive. This is because
the number of possible media combinations that can be tested and the number of
fermentation substrates that are available are also very large. Thus, for economy of
effort and scale different approaches have been used to rapidly identify the variables
which need to be controlled for optimising production of useful metabolites and
heterologous proteins.

Chapter I Literature Review
11
It has also been shown that the expression of heterologous proteins and production of
secondary metabolites are influenced by pH (Murphy and Power, 2001). This
parameter affects the morphology and the enzyme production pattern of the genus
Aspergillus (Schügerl et al., 1996). Environmental pH conditions can change protease
activity pattern (Schügerl et al., 1996; Wiebe et al., 2001; Bruno-Bárcena et al.,
2002), and can enhance protein production stability (Pitson et al., 1996; O’Donnel et
al.,2001; Wiebe, 2003).
1.4.2 Effect of medium sterilization on metabolite production
In industrial microbiology, most investigations into submerged aerobic cultures,
especially the development of media and screening of microorganisms, are conducted
using shake flask cultures. This is because the scale is convenient and replication can
be easily achieved. Production variables such as autoclaving procedures, inoculum
size, temperature, water activity, medium composition, pH and degree of mixing can
be identified and their effect on fermentation productivity commonly determined by
the conduct of sequential cultures where only one variable at a time is altered. Such
investigations provide a basis for the manipulation of production variables in order to
optimize product concentrations.
At this scale it is important to investigate the impact of autoclaving of the
fermentation medium on production. Sterilization of fermentation media can result in
vital nutrients (e.g. vitamins, amino acids, and sugars) being destroyed, while the
hydrolysis of complex substances (e.g. proteins and polysaccharides) may be
enhanced. The formation of insoluble compounds may eliminate the availability of a
nutrient, while inhibitory compounds resulting from the interaction of medium
components may result in a medium which is not conducive to growth or to product
formation (Anderson et al., 1986). A compromise between the substrate quality and
the risk of contamination of the raw materials needs to be analyzed. Sterilization
conditions have been shown previously to affect fermentation performance. For
example, efrotomycin production by Nocardia lactamdurans was greatly improved
by sterilizing glucose together with the rest of the medium components (Jain and
Chapter I Literature Review
12
Buckland, 1988). Zaragozic acid production by Leptodontidium elatius was also
improved under different autoclaving conditions (Connors et al., 1995).
1.4.3 Effect of inoculum size
The inoculum size has an important effect on the morphology of the colony. A close
relationship between a particular morphology and increased process productivity is
characteristic of a number of industrially important fermentations (Calam, 1987;
Papagianni, 1999). The role of fungal morphology in relation to formation and
secretion of proteases has been evaluated in Aspergillus niger (Papagianni and Moo-
Young, 2002). Morphology was manipulated by means of inoculum levels. A
reduction of extracellular proteases enhanced production of heterologous proteins.
Thus, morphological development in filamentous fungal fermentations can be
manipulated by inoculum level (Angelova et al., 1998; Chen et al., 1999; Dominguez
et al., 2000; Papagianni and Moo-Young, 2002).
Proteolysis has been recognised as a major problem associated with recombinant
protein production, not only in filamentous fungal populations, but also in bacterial
and yeast populations (Enfors, 1992; Punt and van den Hondel, 1995). Several
strategies have been employed for reducing proteolysis of recombinant proteins. The
primary strategy has been to use a protease deficient host strain to generate the
transformant (van den Hombergh et al., 1995; Zheng et al., 1998).
In addition to the use of a protease deficient host, or when no such host is available
environmental and morphological parameters can be manipulated to reduce
proteolysis. The pattern of expression of proteases in Aspergillus niger can be
modified by changes in the inoculum size (Papagianni and Moo-Young., 2002).
Inoculum quality, in terms of size, type or age, is of prime importance in determining
the outcome of filamentous fungal fermentations (van Suijdam et al., 1980; Gencheva
and Dimova, 1984; Vecht-Lifshitz et al., 1990; Brückner and Blechschmidt, 1991).
Chapter I Literature Review
13
1.5 STATISTICAL APPROACH TO INCLUDE MULTIPLE
FACTORS FOR OPTIMAL CONCENTRATION OF USEFUL
PRODUCTS
Companies from all over the world, including Ford, AlliedSignal, General Electric,
Sony and Lockheed Martin are reporting tremendous savings and benefits from the
application of statistical methods and statistically-designed experiments to their
manufacturing processes. Contour surfaces, central composition, Plackett-Burman and
orthogonal experimentation, which have received much attention in the scientific
community, are examples of technologies that are enhancing the quality and quantity
of information in biotechnological process, increasing efficiency, improving products,
and decreasing costs. Traditional methods of optimization involve changing one
independent variable while keeping the others fixed at a certain level. This single-
dimensional approach was laborious, time consuming, expensive and incapable of
reaching the optimum due to the interactions among variables (Furuhashi and Takagi,
1984). Response surface methodology is an important strategy for seeking the optimal
conditions for multivariable systems. It has been successfully employed for
optimizing medium ingredients and operating conditions in some bioprocesses
(Kemp et al., 1989; Roseiro et al., 1992; Prapulla et al., 1992; Lee et al., 1997). In
order to carry out the optimization process to screen for the optimal immobilized
design, it is necessary to identify the region of optimum performance. This can be
done using various mathematical tools.
Some investigators have used mapping approaches to identify the optimization space.
This enables a better picture of the possible effects of each component in the medium.
Orthogonal and Plackett Burman designs are important methodologies that can reduce
the number of runs to an absolute minimum (Castro et al., 1992; Escamilla et
al., 2000, Xu et al., 2003). The main disadvantage of these designs is that they
consider only first order effects and ignore interactions. However, while a full
factorial design (testing every combination possible) provides the most complete
information, they often require such a large number of runs that they are impractical
to carry out. Optimum performance has been determined using mathematical tools
such as multiple regression of a partial or full factorial design to obtain a model of the
Chapter I Literature Review
14
production system, usually involving fitting of data to a polynomial equation, often
using stepwise multiple regression. Response surface methodology has also been used
to investigate the optimal regions of production of useful product (Prapulla et
al., 1992). Detailed analyses of the optimized region using cetroidal or simple designs
have also been applied for optimization processes (White et al., 1990). However,
several interactions of the experimental design and optimization of models are
required for effective application to product formation in fermentation systems.
Combined statistical systems have not previously been applied to the production of
pharmaceutical and heterologous proteins.
1.6 IMMOBILIZATION OF FUNGAL BIOMASS FOR IMPROVED
PRODUCTIVITY
Fermentative production of metabolites can be obtained in both solid state and
submerged cultivation. However, it has been shown that immobilization can lead to
differences in physiological behaviour and to higher metabolite production which is
released into the medium (Lin, 1973; Evans and Wang, 1984; Lin and Demain, 1991;
Lee et al., 1995). Iimmobilization of microbial cells gives the advantage of using solid
substrate support in a submerged culture fermentation framework. This approach has
received increasing attention in recent years (Becerra et al., 2001).
In 1969, the first industrial application of immobilization was applied and since then
numerous advances have been made in the techniques of immobilization. A large
number of supports for the immobilization have been used (Ohmori and Kurokawa,
1994; Sato et al., 1994; Emregul et al., 1995; Escamilla et al., 2000) and the total
number of their applications has also risen, particularly in the fields of environmental
engineering, food processing and medicine (Gmeiner, 1992).
Gels are one of the most widely used supports; these can be either natural, derived
from polysaccharides such as agar (Hayashi et al., 1993), alginate (Wu et al., 1994),
k-carrageenan (Sakiyama et al., 1993), pectate (Escamilla et al., 2000) or synthetic,
such as the gels derived from acrylamide (Axelsson et al., 1994)

Chapter I Literature Review
15
The immobilization of microbial cells in different carriers leads to changes in their
microenvironment (Shreve and Vogel, 1993). Because of these changes, immobilized
cells show various modifications in physiology and biochemical composition when
compared to suspended cells (Hilg-Rotmann and Rehm, 1990). In the past two
decades advanced use of polysaccharides for gel-entrapment or encapsulation of cells
and optimization of technique had become a challenging area for the biotechnologist.
The immobilization procedure can be carried out in a single step process under very
mild conditions and is therefore compatible with most viable cells.
The first step in the fungal production is inoculation of vegetative cultures and
subsequent inoculum development. Inoculum quality and quantity strikingly affect the
overall production (Gancheva and Dimova, 1984; Brückner and Blechschmidt, 1991).
The optimization of the immobilization support involves several variables, and the
classical strategy of changing one variable each time is very time-consuming. An
optimization of the immobilization parameters would permit the development of an
immobilized cell fermentation which could improve the production of metabolites
such as squalestatin S1 and heterologous proteins in a bubble column bioreactor.
The immobilization of microbial cells in different carriers leads to changes in their
microenvironment (Shreve and Vogel, 1993). Because of these changes, immobilized
cells show various modifications in physiological and biochemical composition when
compared to suspended cells (Hilg-Rotmann and Rehm, 1990; Adam et al., 2001).
The use of polysaccharides for fungal immobilization has become one of the most
important methods used in biotechnology. This technique can be carried out in a
single step process under very mild conditions and is therefore compatible with most
viable cells. Polysaccharide matrices generated in gel beads are strongly dependent
on several variables such as polymer type, concentration and ionic strength (Skjårk-
Bræk et al., 1989; Nava-Saucedo et al., 1994; Gmeiner et al., 1996). Such
modifications may also result in changes in the water availability in the beads and
may influence rates of colonisation and subsequent production of enzymes or
secondary metabolites. Although this could have important implications in studies of
xerotolerant or xerophilic microorganisms and impact on concentration, very few
Chapter I Literature Review
16
studies have taken these factors into account. Indeed practically none have measured
the aw of such beads.
Once the ecophysiological conditions of the biocatalyst are understood, the scale up
of the process can be initiated. The process consists of in developing a suitable
bioreactor in order to scale up the process with the gained information of
environmental conditions, and couple this knowledge with new operation conditions
in order to enhance the product concentrations. Statistical and mathematical
approaches are normally used to create the best possible environment for the catalyst
by designing the bioreactor and operating it in the most efficient way
1. 7 BIOREACTORS
Fermentation, which involves the cultivation of bacteria, yeasts and fungi, is an
ancient technology. However, the use of bioreactors to produce fermentation products
is a rather modern development. This particular process involving aseptic and
controlled conditions for the production of antibiotics started in the 1940’s. In the
scale up process it is vital to investigate the type of bioreactor suitable according to
the physical and physiological requirements of the microorganisms used before
starting further optimizations. In general, stirred tank reactors are the most widely
used type of bioreactors in the production of pharmaceutical compounds. These type
of reactors offer a few advantages, such as independent control of mixing conditions
and aeration rate. The main disadvantages of these reactors are the high energy
consumption and high shear stress affecting such fragile cells as fungal cells. Bubble
column bioreactors (BC) are a good alternative to the stirred tank bioreactors (STR).
The main advantages of bubble column reactors are, from the apparatus side, the
relatively simple construction and the absence of mechanically moving parts. Thus,
they are easy to maintain and have low operating costs. With regard to the internal
flow and efficiency behaviour, they offer a large interfacial area and transport rates
leading to excellent heat and mass transfer characteristics and more suitable shear
conditions for fungal growth and production.

Chapter I Literature Review
17
Scale up of newly developed bioprocesses from laboratory scale to production scale is
often very complex and time consuming. In particular, the scale up from shake flask
to bioreactor is a difficult step. Generally, the oxygen transfer rate (Humphrey, 1998)
and the specific power input (Büchs et al., 2000; Büchs et al., 2000a) have been
predominantly used for scale up from shake flasks to bioreactors.
1.8 MODEL SYSTEMS USED IN THIS WORK
1.8.1 The secondary metabolite squalestatin S1
The treatment of hypercholesterolemia with pharmaceutical agents reduces the risk of
developing arteriosclerosis. Several therapies such as bile acid sequestrants or
cholesterol biosynthetic inhibitors are available. In the isoprenoid biosynthetic
pathway, the first step to the biosynthesis of cholesterol involves the dimerization of
farnesyl pyrophosphate to squalene. This step is catalyzed by squalene synthase and is
a potential drug target. Substrates analogous of the farnesyl pyrophosphate have been
synthesized and found to be inhibitors of this enzyme. Squalestatins are a potent
inhibitor of the squalene synthase (Blows et al., 1994). Among the various fungal
species that produce the family of squalestatins as secondary metabolites, a Phoma
sp. is particularly important for high concentration capacity (Baxter et al., 1998;
Dawson et al., 1991).
1.8.2 Heterologous protein hen egg white lysozyme (HEWL)
Hen egg white lysozyme (HEWL) is a naturally occurring protein found in many
organisms such as viruses, bacteria, plants, insects, birds, reptiles and mammals
(Osman et al., 1995). HEWL, which attacks the cell wall of certain bacteria thus
killing them, has been found effective in controlling Listeria monocytogenes,
Staphylococcus aureus, and Salmonella typhimurium (Osman et al., 1995). HEWL is
effective against Clostridium tyrobutyrium, a contaminating bacteria in cheese making
(Samaranayke et al., 1993). HEWL also shows lytic activity against fungal plant
pathogens, Phytophthora nicotinae and Fusarium oxysporum (During et al., 1999).
Immobilised in solid supports, the applications of HWEL in biomedicine are:
Chapter I Literature Review
18
downstream processing, recovery of proteins (Owen and Chase 1997), cell sorting
(Nandakumar et al., 1999), purification of nucleic acids (Ujam et al., 2000), and flow-
ELISA analysis (Palsson et al., 2000).
1.9 OBJECTIVES
The overall objectives of this project were to screen and model the effect of different
process parameters such as environmental factors (aw, temperature and pH) on growth
of A. niger strains, and the effect of free and immobilized cell fermentations on S1
and lysozyme production. To achieve these the following studies were carried out.
a) To evaluate the effects of water availability (water activity, aw), solute used to
modify aw, and temperature on growth and spore production by a wild (W) and two
genetically-engineered strains (B1, L11) of Aspergillus niger.
b) To develop a model for the combined effect of water activity (aw) and temperature
on growth of strains of Aspergillus niger, and comparison with data on food spoilage
moulds in the literature.
d) To evaluate the effect of (a) water availability, (b) inoculum size and (c)
sterilization procedure on the production of the heterologous protein lysozyme by two
genetically engineered Aspergillus niger strains (L11 and B1).
e) To optimise by response surfaces the physiological and immobilization conditions
to enhance the production of the heterologous protein lysozyme, by a genetically
engineered A. niger B1 strain. The factors examined were (a) polymer type and
concentration, (b) gel-inducer (CaCl2) concentration and (c) inoculum levels. The
importance of the fermentation pH and bead water availability on heterologous
protein concentrations were also evaluated.
f) To optimize thirteen substrates, including those reported in the literature, at three
different concentration levels in submerged fermentation to produce squalestatin S1
by a Phoma species. This approach used a combination of statistical strategies
involving the use of an orthogonal design, response surfaces and polynomial
Chapter I Literature Review
19
regression to find the best medium for maximising concentrations in a free
fermentation system.
g) To evaluate the effect of the liquid height and the height-diameter (HD/Dr) ratios
11.1, 7.4 and 3.7 on the total volumetric mass transfer coefficient, kLa, at different
temperatures.
h) To evaluate the effect of different height-diameter (Hr/Dr) on the volumetric mass
transfer coefficient.
i) Development of two models for effect of superficial gas velocity (m s-1) and power
consumption (W m-3) combined with the geometrical parameter height of the liquid-
column diameter (HL/Dr) on the kLa with distilled water.
j) To evaluate the influence of the immobilization design parameters: polymer and
copolymer (alginate and pectate) immobilization under different mixture
concentrations, inoculum level, gel inducer (calcium chloride), reinforcing agent
(chitosan) and air flow on the production of squalestatin S1 by a Phoma sp. in a
bubble column bioreactor.
k) To carry out comparisons of optimal production of squalestatin between free cell
fermentations in a standard stirred tank bioreactor (STR) and in a bubble column (BC)
with immobilized cell fermentations.
Figure 1.1 shows in a diagrammatic form the components of the thesis. The work is
presented as independent chapters (Chapter II-VIII) with integrated Materials and
Methods, Result and Discussions presented in the chapters. These have either been
published, are in press or are being submitted for publication.
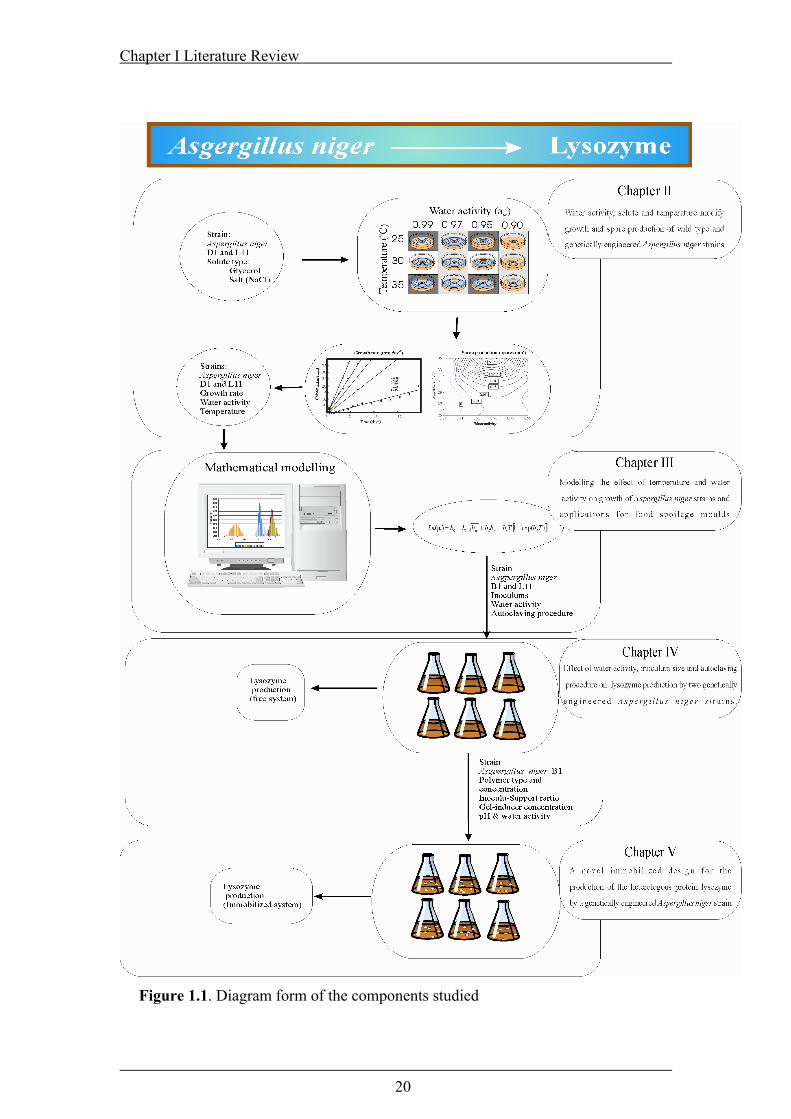
Chapter I Literature Review
20
Figure 1.1. Diagram form of the components studied

Chapter I Literature Review
21
Figure 1.1. Diagram of the components studied (cont..)
Chapter II Aw, Solute and Temperature Modify Growth and Spore Production
22
CHAPTER II
WATER ACTIVITY, SOLUTE AND TEMPERATURE -MODIFIED GROWTH AND SPORE PRODUCTION OF WILD TYPE AND GENETICALLY ENGINEERED Aspergillus niger STRAINS
Published in Enzyme and Microbial Technology (2004) 97:429-438.

Chapter II Aw, Solute and Temperature Modify Growth and Spore Production
23
2.1 INTRODUCTION
Filamentous fungi, especially Aspergillus species, are attractive hosts for the
production of foreign proteins because of their high secretory capability (Archer et al.,
1990a; Jeenes et al., 1991; Archer, 2000; Cullen et al., 1987; Gwynne et al., 1987;
Upshill et al., 1987; Turnbull et al., 1989). This has been demonstrated for a number
of products from Aspergillus nidulans and A.niger (Christensen et al., 1988; Ward et
al., 1990; Conesa et al., 2001; Punt et al., 2002). A.niger is a xerophilic species which
can normally tolerate quite dry environments (Magan, 1997; Marin et al., 1995;
Baxter et al., 1998). Water activity (aw) and temperature are critical factors affecting
the growth and metabolism of fungi (Scot, 1957; Gervais et al., 1988). From an
ecological point of view little information is available on whether genetically
modified strains will behave in a similar manner to wild type strains or not. No studies
have attempted to evaluate this, although it has been shown that in wild type strains of
pharmaceutically useful fungi, subtle changes in water stress can result in a significant
stimulation of secondary metabolite production (Baxter et al., 1998; Gervais et al.,
1988; Aldred et al., 1999). Thus, the objective of this study was to evaluate the effects
of water availability (water activity, aw), solute used to modify aw, and temperature on
growth and spore production by a wild (W) and two genetically-engineered strains
(B1, L11) of Aspergillus niger.
2.2 MATERIALS AND METHODS
2.2.1 Fungal strains
Two genetically engineered strains A. niger B1 and L11 from strain AB4.1 (van
Hartingsveldt et al., 1987) containing the full-length hen egg white lysozyme
(HEWL) cDNA under the control of the A.niger. glucoamylase promoter were used in
this study (Archer et al., 1990b). B1 differs from L11 in gene copy number and in
having the HEWL-encoding found downstream of the region of the gala gene
encoding the cathalase and in the domain of galactosidase (GAM). The gala and

Chapter II Aw, Solute and Temperature Modify Growth and Spore Production
24
HEWL-encoding genes were separated by a sequence encoding the KEXZ
endoproteolytic cleavage site (Jeenes et al., 1994). The cultures were maintained as
aliquots of spore suspensions in 5% (w/v) glycerol stored at -70oC (Connors et al.,
1995).
2.2.2 Media preparation, incubation and growth rate assessment
The water activity of 4.8 % w/v malt extract agar (MEA) (Oxoid) was modified with
calculated amounts of the non-ionic solute glycerol and the ionic solute NaCl to 0.99-
0.90 aw. A Humidat-IC II apparatus (Novasina, Talstrasse, Switzerland) was used to
check the aw levels obtained and found to be within 0.005 of the desired aw level.
Actively growing 8-day-old colonies of W, L11, B1 on MEA were used to prepare a
spore suspension (1.8 x 10⁷ spores ml-1 ± 2%). Fungal spore suspensions were
prepared in a solution of Tween 80 (100µl l-1). Petri plates with glycerol or NaCl-
modified MEA were inoculated with 5 µl of the spore suspension and incubated at 25,
30 and 35ºC.
The temporal mycelial extensions of treatments and replicates were measured in two
directions at right angles to each other. Measurements were recorded on alternate days
during the growth until the Petri plate were completely colonised (Baxter et al., 1998;
Aldred et al., 1999; Baxter, 1997). A linear regression of the data was performed in
order to calculate the growth rate. The calculated growth rate was used for statistical
analysis. It has been previously shown by Trinci (1969) and Trinci and Collinge
(1973) that the linear growth rate on a solid substrate, e.g. agar medium, is a good
approximation of biomass increase in liquid culture.
Spores were recovered from Petri plates by agitating the surface with 10 ml of sterile
water (+ a drop of Tween 80) twice and decanting into a Universal bottle. The number
of spores was determined using a haemocytometer and microscope (Olympus ABHZ,
Olympus UK) . Spore number were recorded when the treatment strain had colonised
the surface of the Petri plate fully up to a maximum of 28 days.

Chapter II Aw, Solute and Temperature Modify Growth and Spore Production
25
2.2.3 Experimental design and data treatment
For growth experiments a fully randomised factorial design run in quadruplicate was
used to describe the growth rate of A. niger in relation to the three strains, three
temperatures, five aw levels and two solute types. In all cases linear regression of
increase in radial extension against time was used to obtain the growth rates under
each set of treatment conditions.
A fully randomised factorial design (33) in triplicate was used to describe the spore
production of A. niger in relation to the same treatments used for growth. The number
of spores produced at the end of each experimental run was recorded and used in the
statistical analysis. Orthogonal experiment optimization was computed in order to
calculate the optimal conditions of growth rate and contour surface plots were used to
find the maximum values of growth and sporulation (Wu and Hobbs, 1987).
2.3 RESULTS
2.3.1 Effect of environmental factors on growth
Figure 2.1 shows an example of the temporal radial extension of colonies of A. niger
(L11) on media modified with the non-ionic solute glycerol or the ionic solute NaCl at
three different temperatures. This shows that mycelial extension was faster at 0.95 aw
than on unmodified media with freely available water. This information was used to
compare growth rates of A. niger in the different treatments.
Figure 2.2 compares growth of all three strains of A.niger at different aw levels at
35oC, the optimum temperature for growth using both solutes. This shows that the
wild-type strain grew optimally at 0.95-0.93 aw on glycerol-modified media, but
optimally at 0.99 aw when NaCl was used. For the two genetically-modified strains
growth was optimal at 0.97 aw, regardless of solute used. Overall, strain L11 grew
faster than the others examined. The overall growth pattern of the two genetically
modified strains was similar, and different from the wild-type strain. In unmodified
medium (0.99 aw) growth of the wild type was faster than the two modified strains.
Statistical analysis of the data showed that all factors and interactions were significant
(P<0.001) for growth rates (Table 2.1).
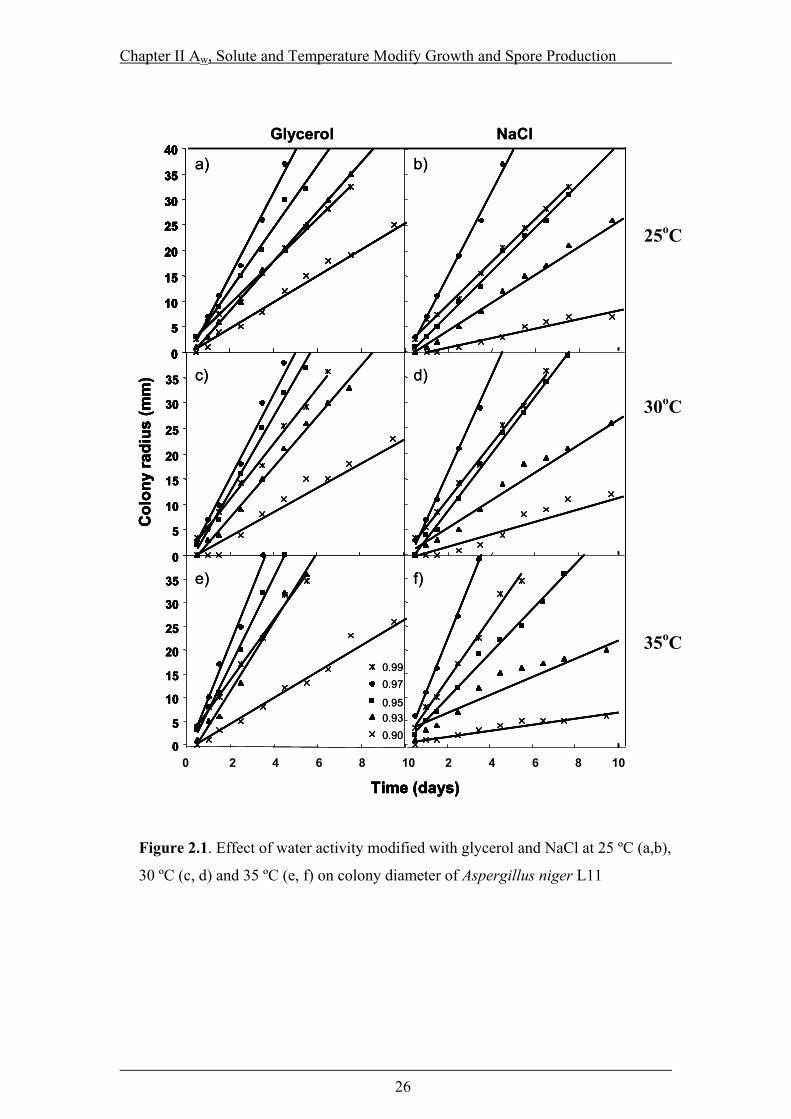
Chapter II Aw, Solute and Temperature Modify Growth and Spore Production
26
Figure 2.1. Effect of water activity modified with glycerol and NaCl at 25 ºC (a,b),
30 ºC (c, d) and 35 ºC (e, f) on colony diameter of Aspergillus niger L11
Col
ony
radi
us (m
m)
10
Time (days)0 2 4 6 8 10 2 4 6 8 10
0
5
10
15
20
25
30
35
40
0
5
10
15
20
25
30
35
0
5
10
15
20
25
30
35
Col
ony
radi
us (m
m)
10
Time (days)0 2 4 6 8 10 2 4 6 8 10
b)
0
5
10
15
20
25
30
35
40
0
5
10
15
20
25
30
35
40
0
5
10
15
20
25
30
35
0
5
10
15
20
25
30
35
Glycerol NaCl
a)
c) d)
e) f)
0.990.97
0.950.930.90
Col
ony
radi
us (m
m)
10
Time (days)0 2 4 6 8 10 2 4 6 8 10
0
5
10
15
20
25
30
35
40
0
5
10
15
20
25
30
35
40
0
5
10
15
20
25
30
35
0
5
10
15
20
25
30
35
Col
ony
radi
us (m
m)
10
Time (days)0 2 4 6 8 10 2 4 6 8 10
b)
0
5
10
15
20
25
30
35
40
0
5
10
15
20
25
30
35
40
0
5
10
15
20
25
30
35
0
5
10
15
20
25
30
35
Glycerol NaCl
a)
c) d)
e) f)
0.990.97
0.950.930.90
25oC 30oC 35oC

Chapter II Aw, Solute and Temperature Modify Growth and Spore Production
27
Figure 2.2. Comparison of growth rate (mm/day) of three strains of Aspergillus
niger (L11, B1 and native strain W). Water activity modified with a) glycerol b)
NaCl at 35 ºC
0.99 0.97 0.95 0.93 0.9W
L11B1
0
2
4
6
8
10
12
Gro
wth
rate
(mm
/day
)
Water activity
Strain
0.99 0.97 0.95 0.93 0.9W
L11B1
0
2
4
6
8
10
12
Gro
wth
rate
(mm
/day
)
Water activity
Strain
W L11 B1
a)
b)
0.99 0.97 0.95 0.93 0.9W
L11B1
0
2
4
6
8
10
12
Gro
wth
rate
(mm
/day
)
Water activity
Strain
0.99 0.97 0.95 0.93 0.9W
L11B1
0
2
4
6
8
10
12
Gro
wth
rate
(mm
/day
)
Water activity
Strain
W L11 B1
0.99 0.97 0.95 0.93 0.9W
L11B1
0
2
4
6
8
10
12
Gro
wth
rate
(mm
/day
)
Water activity
Strain
0.99 0.97 0.95 0.93 0.9W
L11B1
0
2
4
6
8
10
12
Gro
wth
rate
(mm
/day
)
Water activity
Strain
W L11 B1
a)
b)
0.99 0.97 0.95 0.93 0.9W
L11B1
0
2
4
6
8
10
12
Gro
wth
rate
(mm
/day
)
Water activity
Strain
0.99 0.97 0.95 0.93 0.9W
L11B1
0
2
4
6
8
10
12
Gro
wth
rate
(mm
/day
)
Water activity
Strain
W L11 B1
0.99 0.97 0.95 0.93 0.9W
L11B1
0
2
4
6
8
10
12
Gro
wth
rate
(mm
/day
)
Water activity
Strain
0.99 0.97 0.95 0.93 0.9W
L11B1
0
2
4
6
8
10
12
Gro
wth
rate
(mm
/day
)
Water activity
Strain
a)
b)

Chapter II Aw, Solute and Temperature Modify Growth and Spore Production
28
Table 2.1. Analysis of variance of water activity (aw), solutes type, and temperatures
in the growth rate of three strains of Aspergillus niger (L11, B1 and native
strain W)
Factor Df MS F
aw 4 375.01 1060.29**
Strain 2 41.59 235.19**
Temperature 2 20.98 118.62**
Solute 2 209.73 1185.94**
Factor interactions
aw x Strain 8 12.21 17.26**
aw x Solute 8 65.09 92.02**
Strain x Solute 4 40.94 115.76**
Temperature x
Solute
4 17.85 50.48**
Residual 277 3.04
** Significant at the level p<0.001

Chapter II Aw, Solute and Temperature Modify Growth and Spore Production
29
The most important factors overall were aw, solute and their interactions. A contour
surface plot summarises the optimal conditions in relation to aw and temperature for
all three strains (Figure 2.3). The data from the experiments were used to find the
optimal conditions using orthogonal optimization to determine the highest growth
rates (Table 2.2). To confirm the accuracy of the prediction, an experiment using
these optimal conditions was carried out in triplicate. A value of 10.85 mm day-1 was
obtained verifying a good correlation between the predicted and the measured results.
2.3.2 Effects of environmental conditions on sporulation of A.niger strains
Figure 2.4 shows the effect of temperature and aw on sporulation of A. niger strains on
glycerol-amended media. This shows that the wild type strain (W) produced most
spores at 0.97 aw, and at 35oC. There were significant differences between the three
strains, with L11 producing a 10-fold higher amount of spores, especially at 35oC
between 0.97-0.93 aw. Thus L11 has markedly different sporulation capacity
compared to the other two strains examined. Table 2.3 shows the statistically
significant factors were aw, strain, temperature, solute and aw x strain, aw x
temperature and strain x temperature.
The contour surface plot of the impact of aw x temperature on sporulation capacity of
L11 is shown in Figure 2.5. Optimum conditions for spore production are different
from that for growth. High production of spores was found with L11 at 0.95 aw
modified with glycerol at 35ºC. The range of significant spore production can be
defined between 0.97-0.93 aw and 33-35oC. This suggest that higher temperatures are
more suitable for sporulation and spore production.
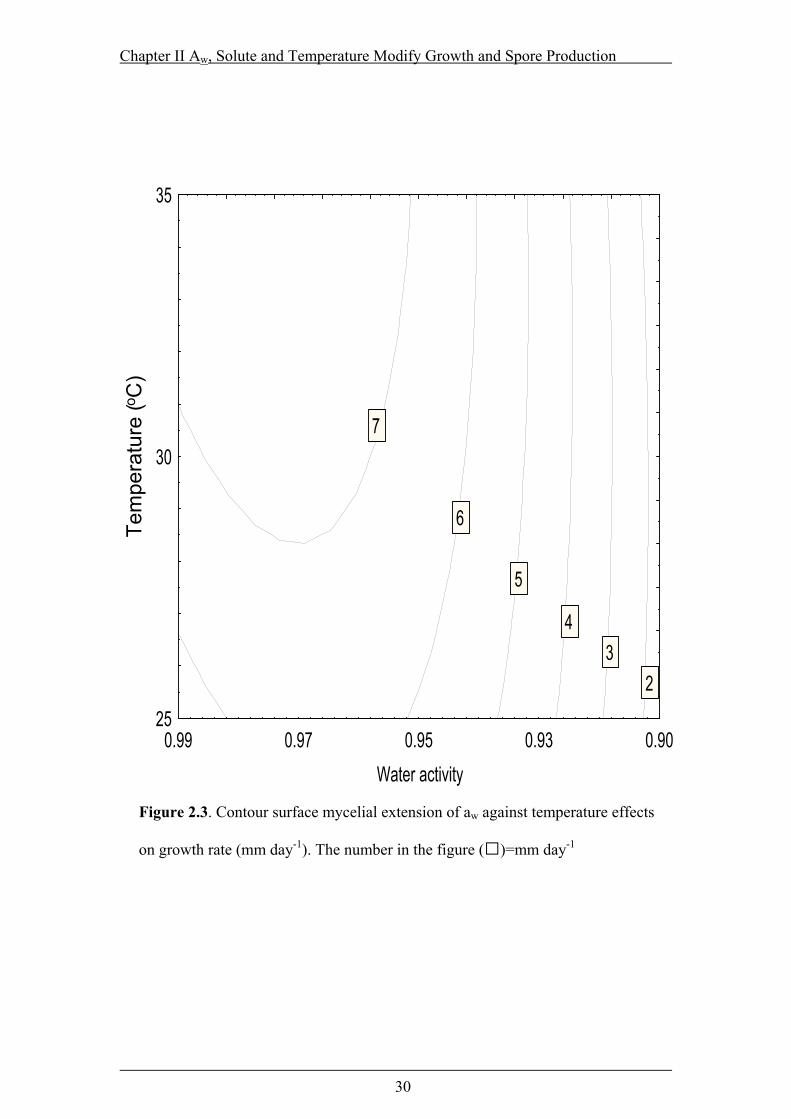
Chapter II Aw, Solute and Temperature Modify Growth and Spore Production
30
0.99 0.97 0.95 0.93 0.90Water activity
25
30
35
Tem
pera
ture
(oC
)
7
6
23
4
5
Figure 2.3. Contour surface mycelial extension of aw against temperature effects
on growth rate (mm day-1). The number in the figure (□)=mm day-1
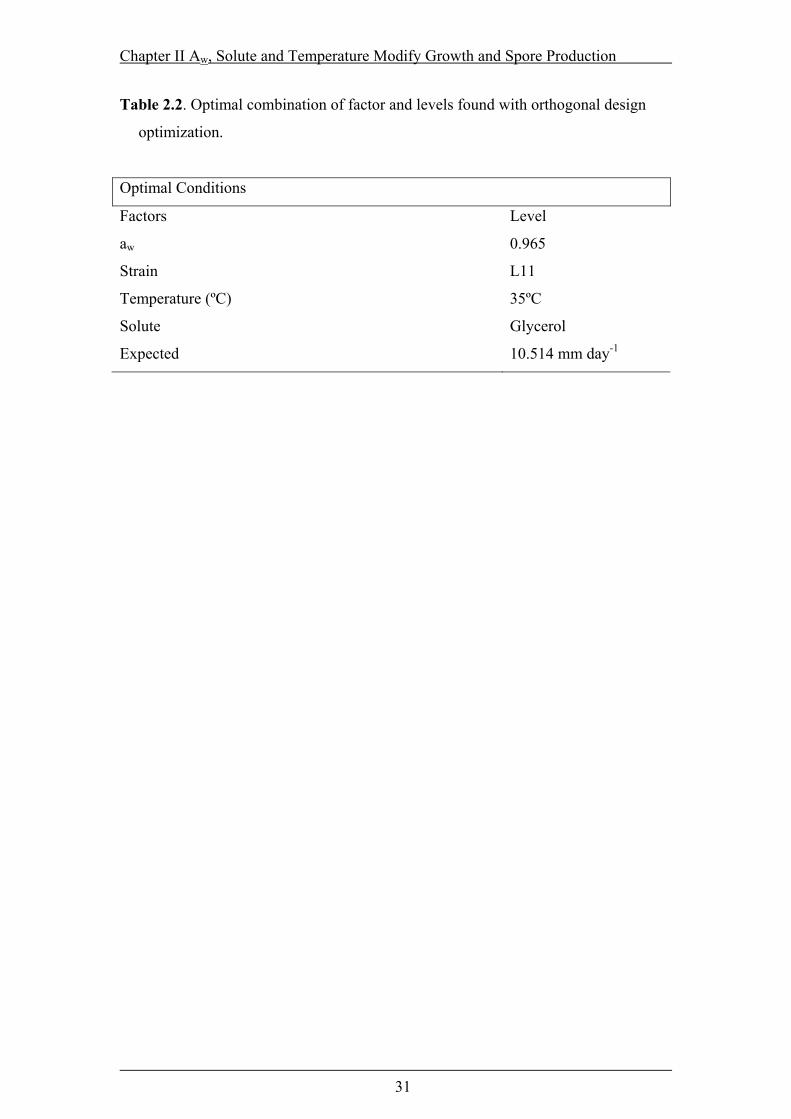
Chapter II Aw, Solute and Temperature Modify Growth and Spore Production
31
Table 2.2. Optimal combination of factor and levels found with orthogonal design
optimization.
Optimal Conditions
Factors Level
aw 0.965
Strain L11
Temperature (ºC) 35ºC
Solute Glycerol
Expected 10.514 mm day-1

Chapter II Aw, Solute and Temperature Modify Growth and Spore Production
32
Figure 2.4. Effect of water activity modified with a) glycerol and b) NaCl on spore
production (spores cm-2) at 35oC in three strains of A. niger.
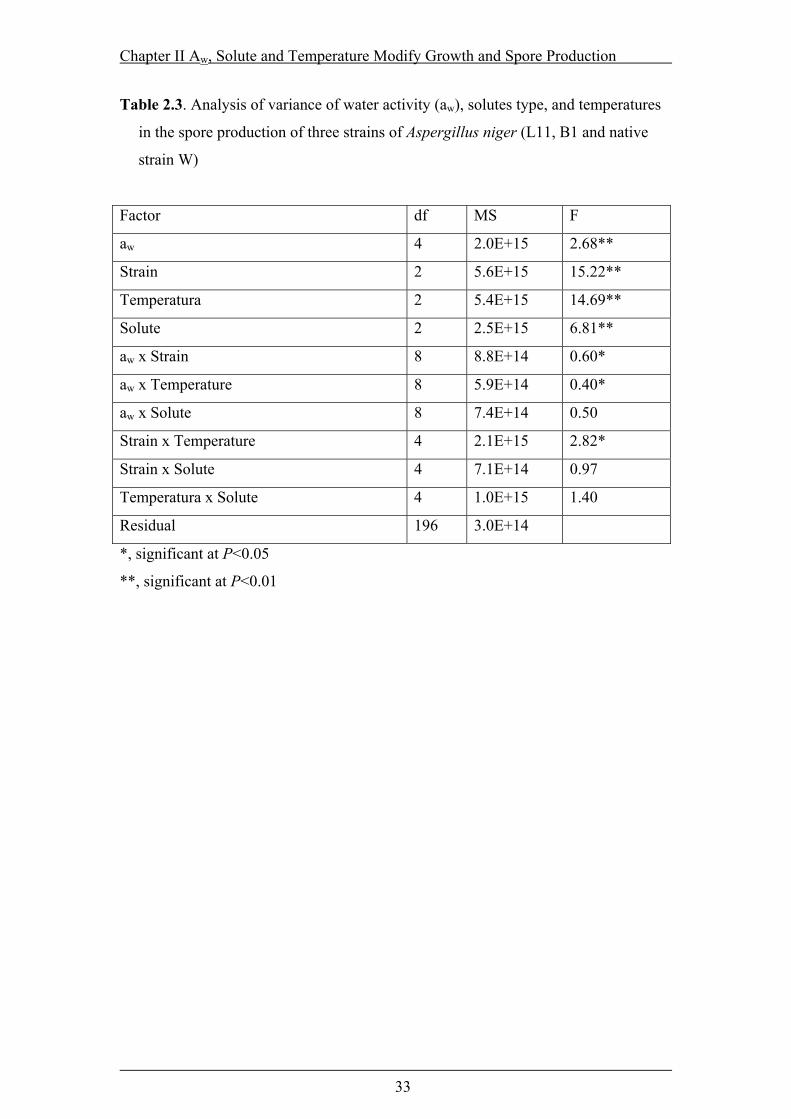
Chapter II Aw, Solute and Temperature Modify Growth and Spore Production
33
Table 2.3. Analysis of variance of water activity (aw), solutes type, and temperatures
in the spore production of three strains of Aspergillus niger (L11, B1 and native
strain W)
Factor df MS F
aw 4 2.0E+15 2.68**
Strain 2 5.6E+15 15.22**
Temperatura 2 5.4E+15 14.69**
Solute 2 2.5E+15 6.81**
aw x Strain 8 8.8E+14 0.60*
aw x Temperature 8 5.9E+14 0.40*
aw x Solute 8 7.4E+14 0.50
Strain x Temperature 4 2.1E+15 2.82*
Strain x Solute 4 7.1E+14 0.97
Temperatura x Solute 4 1.0E+15 1.40
Residual 196 3.0E+14
*, significant at P<0.05
**, significant at P<0.01

Chapter II Aw, Solute and Temperature Modify Growth and Spore Production
34
0.89 0.90 0.91 0.92 0.93 0.94 0.95 0.96 0.97 0.98 0.99
Water activity
25
26
27
28
29
30
31
32
33
34
35Te
mpe
ratu
re (o C
)2x10⁶
1x10⁶
1.5x10⁶
2x10³
1x10²
0
2x10⁴
Figure 2.5. A. niger L11 spore production (spores cm-2) contour surface of water
activity and temperature.

Chapter II Aw, Solute and Temperature Modify Growth and Spore Production
35
2.4 DISCUSION
This is the first time that ecological comparisons have been made between wild-type
and genetically modified strains of xerophilic fungi. We conclude that genetic
modification can affect both water and temperature relations for growth, and
particularly for sporulation. The optimal growth of the three strains of A. niger
examined was found to be in the range 0.97-0.95 aw. The growth rate of the
genetically engineered strains were similar to each other, and different from the wild-
type strain. Strains L11 and B1 had a higher tolerance to lower water activity than the
wild type when modified with NaCl. In all cases the aw range of 0.97-0.95 resulted in
a faster growth rate when compared to the control (0.99 aw). The use of glycerol to
modify media water availability produced a higher growth rate than with NaCl,
probably because it can be utilised as a carbon and energy source and can act directly
as a compatible solute. In contrast, high concentrations of NaCl can be toxic and this
may explain the differential growth patterns observed. The effect of the temperature
and aw were significant and both affect the growth rate. Growth patterns of both
transgenic strains were similar. Growth of filamentous fungi has been shown to be
dependent on thermodynamic factors such as water availability and temperature
(Scott, 1957; Gervais et al., 1988).
Previous studies on A.niger suggest a range of 10-40oC and 0.77-0.99, with the
optimum at 35oC and 0.99 aw (Michell et al., 2003). However, sporulation ranges
were not considered previously and this early work was carried out when no
information on related A. niger group species (e.g. A carbonarius) was known. Recent
studies on the Aspergillus section nigri group isolated from grapevine suggest optima
for growth of 0.95 aw at 30-35oC (Ayerst, 1969).
The relative effects of the environmental factors on sporulation were more dramatic
than on growth. The genetically modified strain L11 behaved in a completely
different manner compared to the other two strains examined, producing substantially
more conidia and over a wider aw range, especially at the optimum temperature, 35oC.
Very few studies have examined the impact of environmental factors such as aw or
temperature on sporulation of wild type strains of fungi and none on genetically

Chapter II Aw, Solute and Temperature Modify Growth and Spore Production
36
modified ones (Magan and Lacey, 1984; Geravis et al., 1988; Gervais and Molin,
2003). For example, Gervais et al. (1988). Gervais and Molin (2003) showed that
P.roquefortii strains from cheese grew optimally at 0.97-0.98 aw, while maximum
spore production was at 0.96 aw. The present study suggests that genetic manipulation
can alter the physiology of a fungus in an unpredictable way. The two GM-strains
have multiple gene copies integrated into the genome at more than one locus, and this
may have caused the changes observed.
2.5 CONCLUSIONS
From this study of the growth rate of genetically engineered Aspergillus niger, several
parameters important for maximizing the growth rate have been identified. A
combination of aw, temperature and solute used to modify the aw had the greatest
effect on growth rate. L11 grew significantly better than the other strains examined.
Thus, such screening criteria based on these environmental parameters (aw,
temperature, solute type) can facilitate the selection of appropriate transformed strains
for studying secondary metabolite or heterologous protein production systems.
Chapter III Modelling the Effect of Aw and Temperature on Growth rate of A.niger
37
CHAPTER III
MODELLING THE EFFECT OF TEMPERATURE AND WATER
ACTIVITY ON GROWTH OF Aspergillus niger STRAINS AND
APPLICATIONS FOR FOOD SPOILAGE MOULDS
Published in Journal of Applied Microbiology (2004) 35:232-237.
Chapter III Modelling the Effect of Aw and Temperature on Growth rate of A.niger
38
3.1 INTRODUCTION
In the last two decades, predictive food microbiology has included the development of
models capable of describing the growth of pathogenic bacteria (Buchanan and
Phillips, 1990). However, predictive modelling of filamentous fungal growth has not
received the same attention (Gibson et al., 1994; Gibson and Hocking, 1997). Two of
the most important environmental parameters that determine the ability of moulds to
grow on foods are water activity (aw) and temperature (T) (Scott, 1957). An empirical
approach to modelling the effects of aw on mould growth was used by Gibson et al.
(1994) who found that the logarithm of the fungal growth rate (µ, measured as the
increase in colony radial growth per unit of time) showed a parabolic relationship
with the square root of bw. The bw was defined as the difference between the aw of
pure water (1) and that of a set aw for a specific growth kinetic. They investigated the
appropriateness of models that were previously used to predict bacterial growth for
the interpretation of mould growth data.
Much work has been directed towards the development of models for bacterial growth
as a function of temperature and aw (McMeekin et al., 1987; Zwietering et al., 1994;
Rosso et al., 1995). The temperature dependence of the specific growth rate of
bacteria may be modelled by means of the square root model (Ratkowsky et al., 1983)
with the cardinal parameters (e.g. the minimal temperature for growth, Tmin and the
maximum temperature for growth, Tmax).
Cuppers et al. (1997) successfully combined the models of Rosso et al. (1995) and
Ratkowsky et al. (1983) to describe the combined effects of temperature and NaCl on
the growth rate of some food spoilage moulds. The four moulds used, Penicillium
chrysogenum, Cladosporium cladosporioides, Aspergillus flavus and Alternaria
alternata, were inoculated at the optimum temperature for growth and at pH close to
optimum.
The main objective of this work was to develop a combined model based on the
Gibson-type aw dependence and the Ratkowasky-type temperature dependence model
on growth rate that could be used to describe the effect of interacting conditions of aw
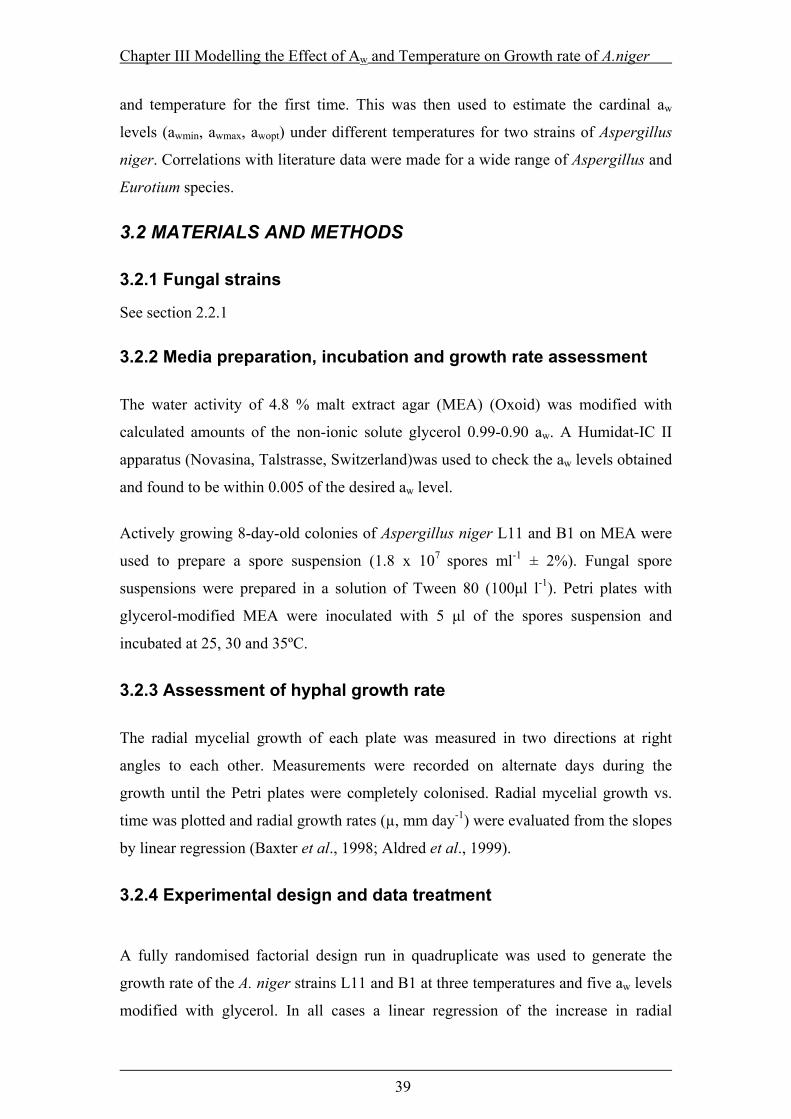
Chapter III Modelling the Effect of Aw and Temperature on Growth rate of A.niger
39
and temperature for the first time. This was then used to estimate the cardinal aw
levels (awmin, awmax, awopt) under different temperatures for two strains of Aspergillus
niger. Correlations with literature data were made for a wide range of Aspergillus and
Eurotium species.
3.2 MATERIALS AND METHODS
3.2.1 Fungal strains
See section 2.2.1
3.2.2 Media preparation, incubation and growth rate assessment
The water activity of 4.8 % malt extract agar (MEA) (Oxoid) was modified with
calculated amounts of the non-ionic solute glycerol 0.99-0.90 aw. A Humidat-IC II
apparatus (Novasina, Talstrasse, Switzerland)was used to check the aw levels obtained
and found to be within 0.005 of the desired aw level.
Actively growing 8-day-old colonies of Aspergillus niger L11 and B1 on MEA were
used to prepare a spore suspension (1.8 x 10⁷ spores ml-1 ± 2%). Fungal spore
suspensions were prepared in a solution of Tween 80 (100µl l-1). Petri plates with
glycerol-modified MEA were inoculated with 5 µl of the spores suspension and
incubated at 25, 30 and 35ºC.
3.2.3 Assessment of hyphal growth rate
The radial mycelial growth of each plate was measured in two directions at right
angles to each other. Measurements were recorded on alternate days during the
growth until the Petri plates were completely colonised. Radial mycelial growth vs.
time was plotted and radial growth rates (µ, mm day-1) were evaluated from the slopes
by linear regression (Baxter et al., 1998; Aldred et al., 1999).
3.2.4 Experimental design and data treatment
A fully randomised factorial design run in quadruplicate was used to generate the
growth rate of the A. niger strains L11 and B1 at three temperatures and five aw levels
modified with glycerol. In all cases a linear regression of the increase in radial

Chapter III Modelling the Effect of Aw and Temperature on Growth rate of A.niger
40
extension against time was used to obtain the growth rates under each set of treatment
conditions.
3.2.5 Model development
Previously, square root-type models (Ratkowsky et al., 1983) to describe the effect of
temperature used cardinal parameters (e.g., the minimal temperature for growth, Tmin
and the maximum temperature for growth, Tmax) has been used :
[ ]))(exp(1)( MaxMin TTcTTb −−−=µ (Eq. 3.1)
where µ= growth rate (mm day-1), T= Temperature, TMin= theoretical minimal
temperature, TMin= theoretical maximal temperature where b and c are design
parameters.
Gibson et al. (1994) found that the logarithm of fungal growth rate (µ, measured as
the increase in colony radial growth per unit of time) showed a parabolic relationship
with the square root of
ww ab −= 1 (Eq. 3.2)
leading to
ww bbbbbLn 210)( ++=µ (Eq. 3.3)
The proposed model is derived from Eqs. (3.1) and (3.3) and have the general form of
[ ])exp(1)( 43210 TbTbbbbbbLn ww −+++=µ (Eq. 3.4)
where µ= growth rate (mm day-1), b0, b1, b2, b3 and b4 are design parameters, aw =
water activity and T= temperature (oC). The regressed parameters were found by non-
linear estimation with Hooke-Jeeves and the quasi-Newton method of Statistica v6.0
(StatSoft, Inc. 1984-2001. Tulsa USA) and simulated data and uncertainty of the

Chapter III Modelling the Effect of Aw and Temperature on Growth rate of A.niger
41
parameters were evaluated with Crystal Ball 2000 v5.2 (Decisioneering, Inc. 1988-
2002, Denver, USA)
3.3 RESULTS
The growth data modelled in this work comprised the growth curves of two strains of
A. niger L11 and B1 at five aw and three temperatures. Mycelial extension of colonies
versus time almost invariably showed a straight line, after an initial lag period. The
growth rate (µ) in mm per day, was calculated as the slope of a regression line
through these points. The growth rate (µ) under the conditions of aw and temperatures
recorded (data presented elsewhere) were used as inputs to calculate the design
parameters of Eq.(3.4).
The mean logarithm of growth rate (ln(µ)) and standard deviation were found to be
higher and lower, respectively, for L11 than for B1 (Table 3.1). A lower variability of
the dispersed data of L11 could increase the robustness of the model for strain L11.
Estimates of Eq. (3.4) and approximate standard errors are presented in the Table 3.2
for the strains L11 and B1 respectively. In both models there were no significant
differences of the design parameters obtained in the four replicates.
Figure 3.1 and 3.2 shows the experimental data and the fitted data based on the model.
The two strains of A. niger L11 and B1 are characterized by a sharp decrease in the
radial growth rate from awopt to awmax, and from awopt to approx 0.92 aw and from this
aw slow decrease in the growth rate until awmin. The aw for optimal growth rate (awopt)
was calculated to be 0.97 for both L11 and B1 and the minimum aw (awmin) 0.84 and
0.82 at 25oC, respectively. No differences were found in the optimal aw (awopt) at 30
and 35oC. However minimum aw (awmin) at 35oC for B1 was 0.80.
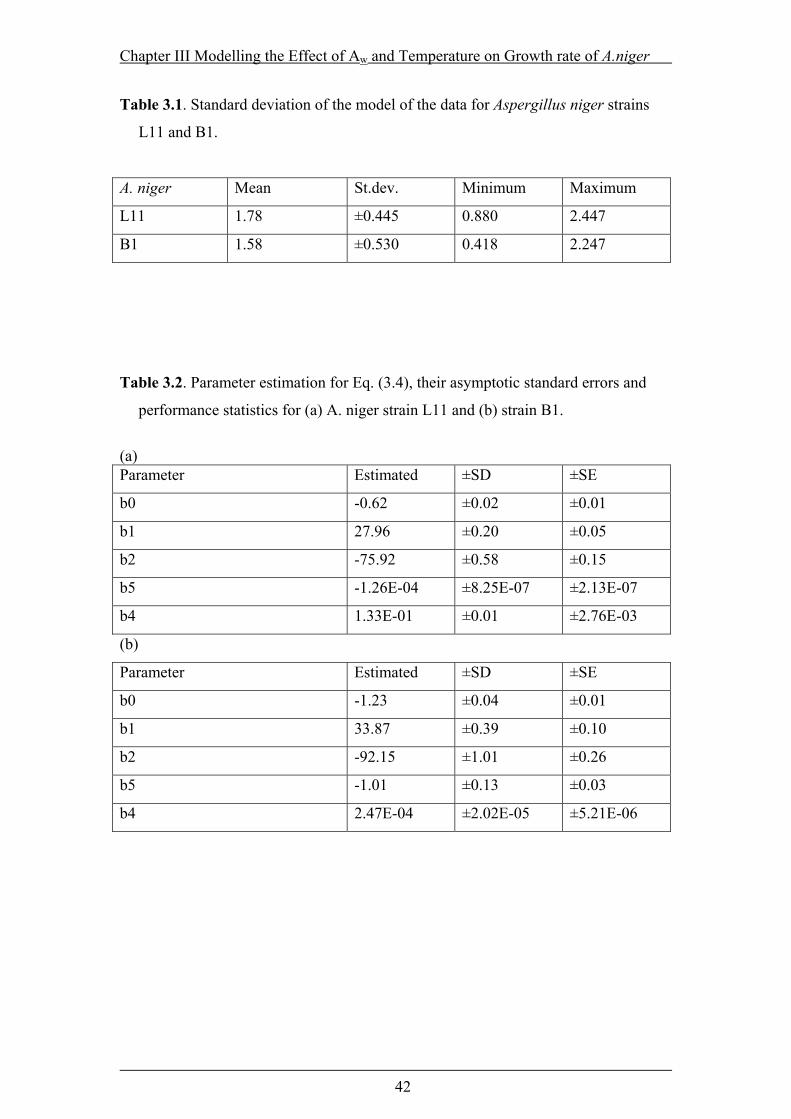
Chapter III Modelling the Effect of Aw and Temperature on Growth rate of A.niger
42
Table 3.1. Standard deviation of the model of the data for Aspergillus niger strains
L11 and B1.
A. niger Mean St.dev. Minimum Maximum
L11 1.78 ±0.445 0.880 2.447
B1 1.58 ±0.530 0.418 2.247
Table 3.2. Parameter estimation for Eq. (3.4), their asymptotic standard errors and
performance statistics for (a) A. niger strain L11 and (b) strain B1.
(a) Parameter Estimated ±SD ±SE
b0 -0.62 ±0.02 ±0.01
b1 27.96 ±0.20 ±0.05
b2 -75.92 ±0.58 ±0.15
b5 -1.26E-04 ±8.25E-07 ±2.13E-07
b4 1.33E-01 ±0.01 ±2.76E-03
(b)
Parameter Estimated ±SD ±SE
b0 -1.23 ±0.04 ±0.01
b1 33.87 ±0.39 ±0.10
b2 -92.15 ±1.01 ±0.26
b5 -1.01 ±0.13 ±0.03
b4 2.47E-04 ±2.02E-05 ±5.21E-06

Chapter III Modelling the Effect of Aw and Temperature on Growth rate of A.niger
43
Figure 3.1. Experimental plots (■) and our model (Eq. (3.4))(▬), for A. niger L11
at 25oC (a), 30oC (b) and 35oC (c) growing in MEA modified with glycerol as
humectant (R2=0.990).
0.002.004.006.008.00
10.0012.0014.00
0.8 0.83 0.86 0.89 0.92 0.95 0.98
0.002.004.006.00
8.0010.0012.0014.00
0.8 0.83 0.86 0.89 0.92 0.95 0.98
0.002.004.006.00
8.0010.0012.0014.00
0.8 0.83 0.86 0.89 0.92 0.95 0.98
Water activity (aw)
(a)
(c)
(b)
Fung
al g
row
th ra
te (m
m d
ay-1
)Fu
ngal
gro
wth
rate
(mm
day
-1)
Fung
al g
row
th ra
te (m
m d
ay-1
)

Chapter III Modelling the Effect of Aw and Temperature on Growth rate of A.niger
44
Figure 3.2. Experimental plots (■) and our model (Eq. (3.4))(▬), growth rate vs
aw for A. niger B1 at 25oC (a), 30oC (b) and 35oC (c) growing in MEA modified
with glycerol as humectant (R2=0.990).
0.00
2.00
4.00
6.00
8.00
10.00
0.8 0.83 0.86 0.89 0.92 0.95 0.98
0.00
2.00
4.00
6.00
8.00
10.00
0.8 0.83 0.86 0.89 0.92 0.95 0.98
0.00
2.00
4.00
6.00
8.00
10.00
0.8 0.83 0.86 0.89 0.92 0.95 0.98
Fung
al g
row
th ra
te (m
m d
ay-1
)Fu
ngal
gro
wth
rate
(m
m d
ay-1
)Fu
ngal
gro
wth
rate
(mm
day
-1)
Water activity (aw)
(a)
(c)
(b)
0.00
2.00
4.00
6.00
8.00
10.00
0.8 0.83 0.86 0.89 0.92 0.95 0.98
0.00
2.00
4.00
6.00
8.00
10.00
0.8 0.83 0.86 0.89 0.92 0.95 0.98
0.00
2.00
4.00
6.00
8.00
10.00
0.8 0.83 0.86 0.89 0.92 0.95 0.98
Fung
al g
row
th ra
te (m
m d
ay-1
)Fu
ngal
gro
wth
rate
(m
m d
ay-1
)Fu
ngal
gro
wth
rate
(mm
day
-1)
Water activity (aw)
(a)
(c)
(b)

Chapter III Modelling the Effect of Aw and Temperature on Growth rate of A.niger
45
A computer simulated growth rate logarithm [Ln (µ)] of L11 was plotted against aw at
25oC, 30oC and 35oC to confirm the certainty of the simulated design parameters b0,
b1, b2, b3, b4 and b5, assuming a normal distribution under a 95% variation of the
parameters (Figure 3.3). Robust model outputs growth rates (ln(µ)) were obtained for
strain L11 at all temperatures at 50% variation of the design parameters. The
logarithm of the growth rate at 25oC and 30oC showed very robust forecasts of the
equation under all the distribution of the design parameters. The most stable design
parameter was found at between 0.99 and 0.97 aw. Moreover a reduction of aw
increased the uncertainty of the model at 25 and 35oC for strain L11 and B1 (data not
presented). A variation of the design parameters above 50% of the distribution in the
95% lead to a instability of the model and divergence of the results at 35oC. This
result shows the high certainty of the parameters at high temperatures.
Figure 3.4 shows the generated surface of the modelled and experimental data (o) of
aw as a function of temperature on growth rate expressed as logarithm (Ln(µ, [mm
day-1])) for A. niger strain L11 and B1 (R2=0.99). The surface generated by the model
and the experimental data summarises all the interactions previously described. The
surfaces show greater sensitivity of the A. niger L11 to the higher temperatures under
optimal aw (awopt) conditions.
3.4 DISCUSSION
3.4.1 Comparisons with published data
Published reports of optimal aw values for several species of Aspergillus have been
obtained at temperatures of between 15-37oC, using a variety of humectants, over the
range 0.85-0.995 aw. The values predicted from the present model are that a aw of 0.97
is optimum for growth, which is in good agreement with the published data obtained
at 25, 30 and 35oC with several species of the genus Aspergillus, which was
frequently shown to be at 0.96-995 aw range depending on humectant used
(Figure 3.5).
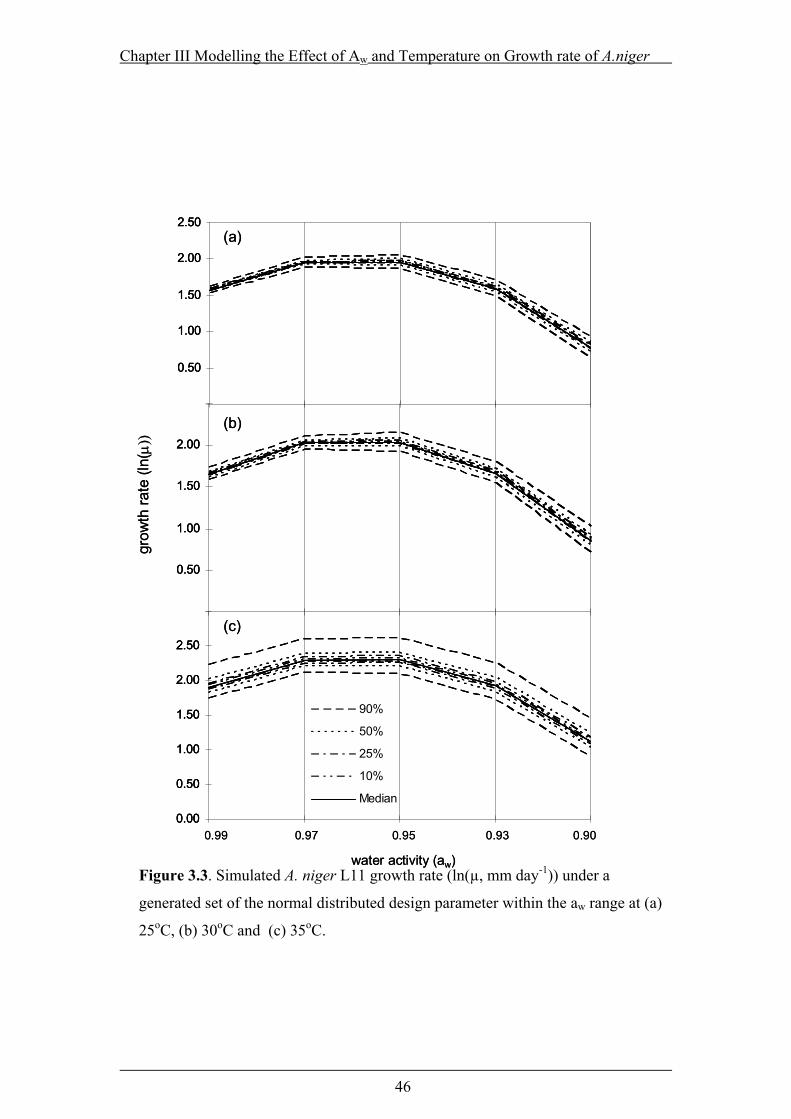
Chapter III Modelling the Effect of Aw and Temperature on Growth rate of A.niger
46
Figure 3.3. Simulated A. niger L11 growth rate (ln(µ, mm day-1)) under a
generated set of the normal distributed design parameter within the aw range at (a)
25oC, (b) 30oC and (c) 35oC.
0.00
0.50
1.00
1.50
2.00
2.50
0.00
0.50
1.00
1.50
2.00
2.50
0.00
0.50
1.00
1.50
2.00
2.50
3.00
90%
50%
25%
10%
Median
0.99 0.97 0.95 0.93 0.90
(a)
(b)
(c)
water activity (aw)
grow
th ra
te (l
n(µ))
0.00
0.50
1.00
1.50
2.00
2.50
0.00
0.50
1.00
1.50
2.00
2.50
0.00
0.50
1.00
1.50
2.00
2.50
3.00
90%
50%
25%
10%
Median
0.00
0.50
1.00
1.50
2.00
2.50
0.00
0.50
1.00
1.50
2.00
2.50
0.00
0.50
1.00
1.50
2.00
2.50
3.00
90%
50%
25%
10%
Median
0.99 0.97 0.95 0.93 0.90
(a)
(b)
(c)
water activity (aw)
grow
th ra
te (l
n(µ))

Chapter III Modelling the Effect of Aw and Temperature on Growth rate of A.niger
47
Figure 3.4. Generated surface of the modelled and experimental data (o) of aw and
temperature on growth rate expressed as logarithm (Ln(µ, [mm day-1])) for A. niger
L11 (a) and B1 (b) [R2=0.99].
0.90 0.92 0.94 0.96 0.98 0.99
0.90 0.92 0.94 0.96 0.98 0.99
36
3432
3028
2624
3634
3230
2826
24
2.8
2.6
2.4
2.2
2.0
1.8
1.6
1.4
1.2
1.0
0.8
0.6
0.4
2.4
2.2
2.0
1.8
1.6
1.4
1.2
1.0
0.8
0.6
0.4
0.2
0.0
Lngr
owth
rate
[mm
day
-1]
Lngr
owth
rate
[mm
day
-1]
Temperature ( oC)
Temperature ( oC)
Water activity
Water activity
a)
b)
0.90 0.92 0.94 0.96 0.98 0.99
0.90 0.92 0.94 0.96 0.98 0.99
36
3432
3028
2624
3634
3230
2826
24
2.8
2.6
2.4
2.2
2.0
1.8
1.6
1.4
1.2
1.0
0.8
0.6
0.4
2.4
2.2
2.0
1.8
1.6
1.4
1.2
1.0
0.8
0.6
0.4
0.2
0.0
Lngr
owth
rate
[mm
day
-1]
Lngr
owth
rate
[mm
day
-1]
Temperature ( oC)
Temperature ( oC)
Water activity
Water activity
a)
b)

Chapter III Modelling the Effect of Aw and Temperature on Growth rate of A.niger
48
The predicted optimum aw of different species of Aspergillus using our model shows
good agreement with the values published as optimal (Ayerst, 1969; Horner and
Anagnostopoulos, 1973; Holmquist et al., 1983; Magan and Lacey, 1984; Ramos et
al., 1998; Marin et al., 1998; Mitchell et al., 2003) when using glycerol as a
humectant within the confidence intervals.
The predicted optimum aw of different species of Aspergillus at different temperatures
(15-37oC) shows good agreement with the values reported at 25oC (Cuero et al., 1987;
Horner and Anagnostopoulos, 1973; Magan and Lacey, 1984; Marin et al., 1998;
Ramos et al., 1998; Sautour et al.,2001), at 30oC (Magan and Lacey, 1984; Gibson et
al., 1994; Marin et al., 1998; Ramos et al., 1998) and at 35oC (Magan and Lacey,
1984; Marin et al., 1998; Mitchell et al.,2003) as shown in Figure 3.6.
A forecasted value of 33oC as an optimum for growth was found at the 95%
confidence level. This would also be partially influenced by the range of humectants
and species used in the literature. At >35oC and <25oC, which are the limits of the
model, good agreement was again seen with published work. Discrepancies were
found of the forecasted and reported values at 20oC (Wheeler et al., 1988). However,
they used glucose/fructose as the humectant. More information on growth rates at this
temperature is needed to obtain more accurate optimal aw ranges at this temperature.
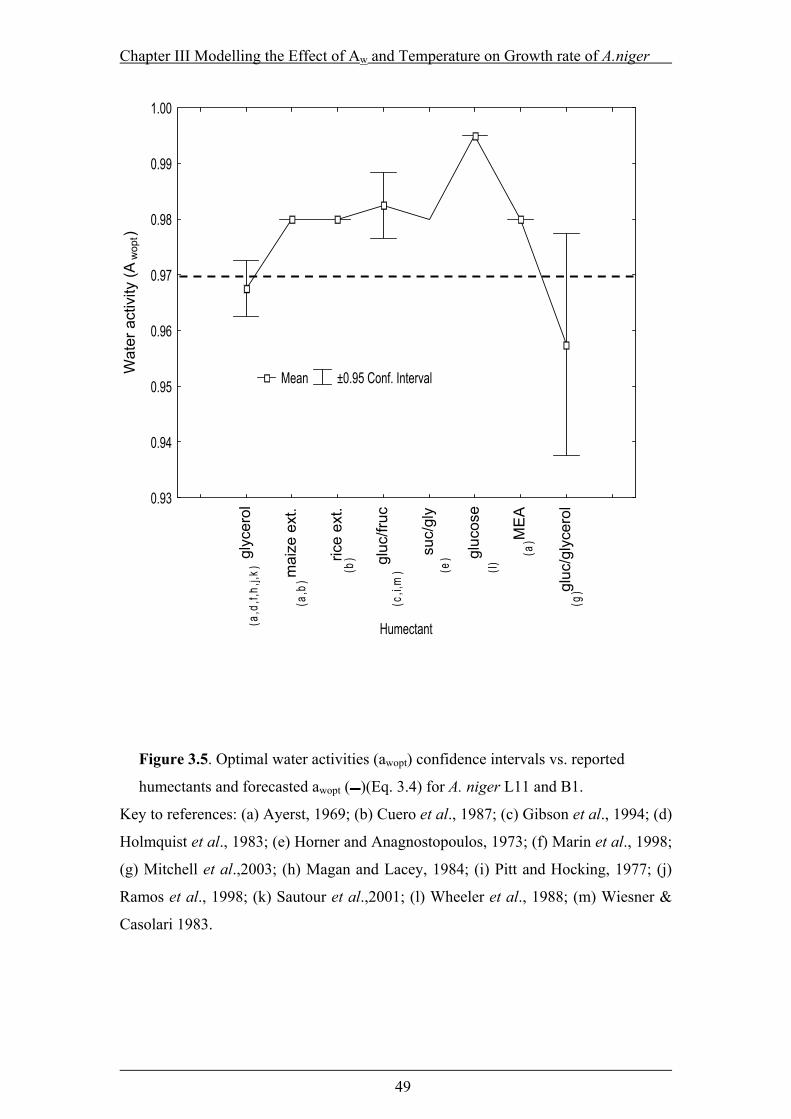
Chapter III Modelling the Effect of Aw and Temperature on Growth rate of A.niger
49
glyc
erol
mai
ze e
xt.
rice
ext.
gluc
/fruc
suc/
gly
gluc
ose
ME
A
gluc
/gly
cero
l
Humectant
0.93
0.94
0.95
0.96
0.97
0.98
0.99
1.00W
ater
act
ivity
(Aw
opt)
Mean ±0.95 Conf. Interval
(a,d
,f,h,
j,k)
(a,b
)
(b)
(c,i,
m) (e
)
(l) (a
)
(g)
Figure 3.5. Optimal water activities (awopt) confidence intervals vs. reported
humectants and forecasted awopt (▬)(Eq. 3.4) for A. niger L11 and B1.
Key to references: (a) Ayerst, 1969; (b) Cuero et al., 1987; (c) Gibson et al., 1994; (d)
Holmquist et al., 1983; (e) Horner and Anagnostopoulos, 1973; (f) Marin et al., 1998;
(g) Mitchell et al.,2003; (h) Magan and Lacey, 1984; (i) Pitt and Hocking, 1977; (j)
Ramos et al., 1998; (k) Sautour et al.,2001; (l) Wheeler et al., 1988; (m) Wiesner &
Casolari 1983.

Chapter III Modelling the Effect of Aw and Temperature on Growth rate of A.niger
50
12 16 20 24 28 32 36 40
Tempertature oC
0.945
0.950
0.955
0.960
0.965
0.970
0.975
0.980
0.985
0.990
0.995W
ater
act
ivity
(Aw
opt)
Mean ±0.95 Conf. Interval
(d,f)
(l)
(a,b
,f,h,
i,j,k
,l )
(c,l,
m)
(a)
(a,f,
g,h)
(f,j)
Figure 3.6. Optimal water activities (awopt) confidence intervals vs. reported
temperature and forecasted awopt (▬)(Eq. 4) for A. niger L11 and B1.
Key to references: (a) Ayerst, 1969; (b) Cuero et al., 1987; (c) Gibson et al., 1994; (d)
Holmquist et al., 1983; (e) Horner and Anagnostopoulos, 1973 ; (f) Marin et al.,
1998; (g) Mitchell et al.,2003; (h) Magan and Lacey, 1984; (i) Pitt and Hocking,
1977; (j) Ramos et al., 1998; (k) Sautour et al.,2001; (l) Wheeler et al., 1988; (m)
Wiesner & Casolari, 1983.

Chapter III Modelling the Effect of Aw and Temperature on Growth rate of A.niger
51
flavus
niger
ochraceus
parasiticus
candidus
fumigatus
nidulans
repens
versicolor
nomius
oryzae
carbonarius
Spices
0.86
0.88
0.90
0.92
0.94
0.96
0.98
1.00W
ater
act
ivity
(Aw
opt)
Mean ±0.95 Conf. Interval
(a,b
,c,d
,e,f,
j,k,l,
m) (a
,f)
(f,i)
(a,d
,c,m
) (h)
(h)
(h)
(h)
(h)
(c)
(g) (c
)
Figure 3.7. Optimal water activities (awopt) confidence intervals vs. reported
Aspergillus species and forecasted awopt (▬)(Eq. 4) for A. niger L11 and B1.
Key to referneces: (a) Ayerst, 1969; (b) Cuero et al., 1987; (c) Gibson et al., 1994; (d)
Holmquist et al., 1983; (e) Horner and Anagnostopoulos, 1973; (f) Marin et al., 1998;
(g) Mitchell et al.,2003; (h) Magan and Lacey, 1984; (i) Pitt and Hocking, 1977; (j)
Ramos et al., 1998; (k) Sautour et al.,2001; (l) Wheeler et al., 1988; (m) Wiesner &
Casolari, 1983.
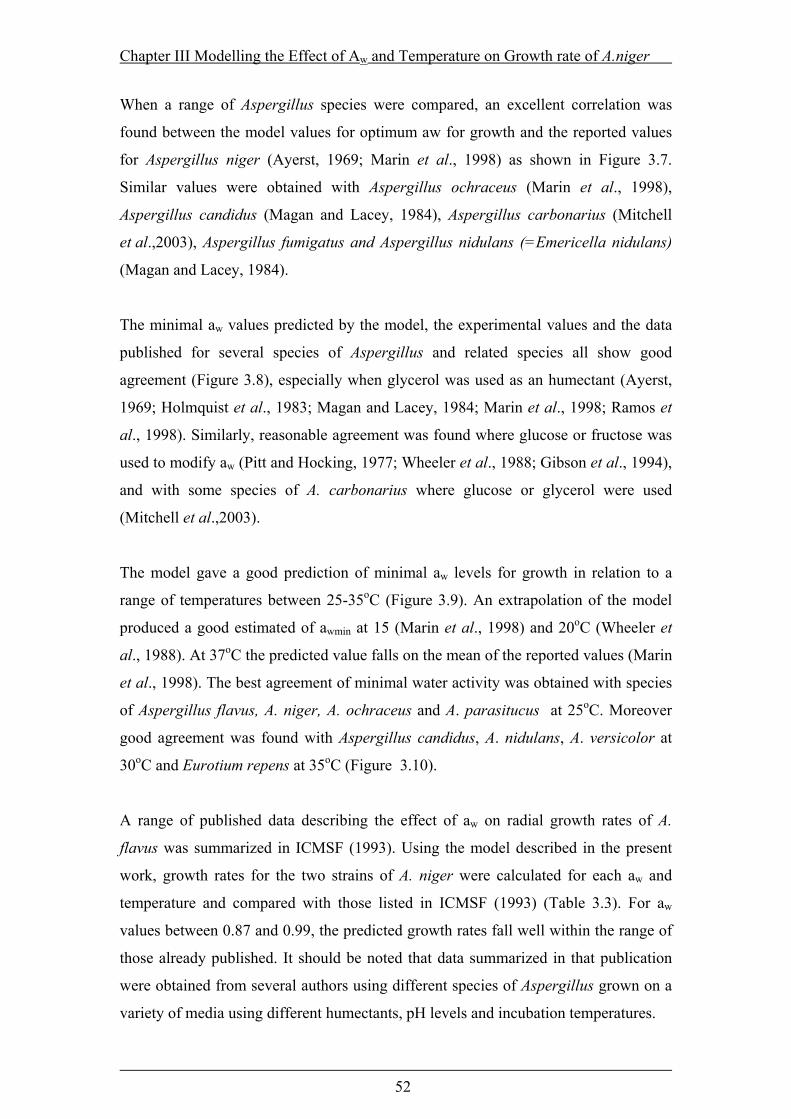
Chapter III Modelling the Effect of Aw and Temperature on Growth rate of A.niger
52
When a range of Aspergillus species were compared, an excellent correlation was
found between the model values for optimum aw for growth and the reported values
for Aspergillus niger (Ayerst, 1969; Marin et al., 1998) as shown in Figure 3.7.
Similar values were obtained with Aspergillus ochraceus (Marin et al., 1998),
Aspergillus candidus (Magan and Lacey, 1984), Aspergillus carbonarius (Mitchell
et al.,2003), Aspergillus fumigatus and Aspergillus nidulans (=Emericella nidulans)
(Magan and Lacey, 1984).
The minimal aw values predicted by the model, the experimental values and the data
published for several species of Aspergillus and related species all show good
agreement (Figure 3.8), especially when glycerol was used as an humectant (Ayerst,
1969; Holmquist et al., 1983; Magan and Lacey, 1984; Marin et al., 1998; Ramos et
al., 1998). Similarly, reasonable agreement was found where glucose or fructose was
used to modify aw (Pitt and Hocking, 1977; Wheeler et al., 1988; Gibson et al., 1994),
and with some species of A. carbonarius where glucose or glycerol were used
(Mitchell et al.,2003).
The model gave a good prediction of minimal aw levels for growth in relation to a
range of temperatures between 25-35oC (Figure 3.9). An extrapolation of the model
produced a good estimated of awmin at 15 (Marin et al., 1998) and 20oC (Wheeler et
al., 1988). At 37oC the predicted value falls on the mean of the reported values (Marin
et al., 1998). The best agreement of minimal water activity was obtained with species
of Aspergillus flavus, A. niger, A. ochraceus and A. parasitucus at 25oC. Moreover
good agreement was found with Aspergillus candidus, A. nidulans, A. versicolor at
30oC and Eurotium repens at 35oC (Figure 3.10).
A range of published data describing the effect of aw on radial growth rates of A.
flavus was summarized in ICMSF (1993). Using the model described in the present
work, growth rates for the two strains of A. niger were calculated for each aw and
temperature and compared with those listed in ICMSF (1993) (Table 3.3). For aw
values between 0.87 and 0.99, the predicted growth rates fall well within the range of
those already published. It should be noted that data summarized in that publication
were obtained from several authors using different species of Aspergillus grown on a
variety of media using different humectants, pH levels and incubation temperatures.

Chapter III Modelling the Effect of Aw and Temperature on Growth rate of A.niger
53
glyc
erol
gluc
/fruc
suc/
gly
gluc
ose
ME
A
gluc
/gly
cero
l
Humectant
0.76
0.78
0.80
0.82
0.84
0.86
0.88
0.90
0.92W
ater
act
ivity
(aw
min
)
Mean ±0.95 Conf. Interval
(a,c
,e,g
,j,k)
(b,j,
k) (d
)
(m) (a
)
(f)
Figure 3.8. Minimal water activity (awmin) confidence intervals vs. reported
humectant and forecasted awopt at 25(▬), 30(▪▪▪) and 35oC (▬ ▪ ▬) (Eq. 4) for A. niger
L11 and B1.
Key to references: (a) Ayerst, 1969; (b) Gibson et al., 1994; (c) Holmquist et al.,
1983; (d) Horner and Anagnostopoulos ,1973; (e) Marin et al., 1998; (f) Mitchell et
al.,2003; (g) Magan and Lacey, 1984; (i) Pitt and Hocking, 1977; (j) Ramos et al.,
1998; (k) Sautour et al.,2001; (l) Wheeler et al., 1988; (m) Wiesner & Casolari, 1983.
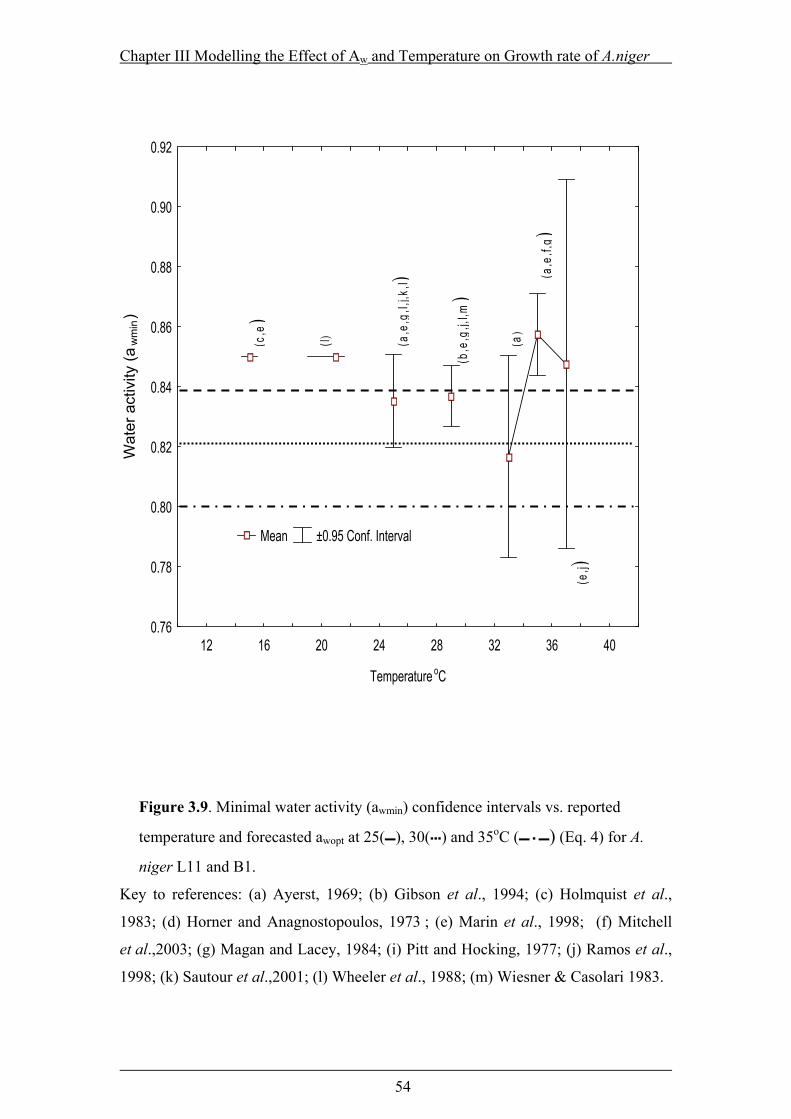
Chapter III Modelling the Effect of Aw and Temperature on Growth rate of A.niger
54
12 16 20 24 28 32 36 40
Temperature oC
0.76
0.78
0.80
0.82
0.84
0.86
0.88
0.90
0.92W
ater
act
ivity
(aw
min
)
Mean ±0.95 Conf. Interval
(c,e
)
(l)
(a,e
,g,I,
j,k,l)
(b,e
,g,j,
l,m)
(a)
(a,e
,f,g)
(e
,j)
Figure 3.9. Minimal water activity (awmin) confidence intervals vs. reported
temperature and forecasted awopt at 25(▬), 30(▪▪▪) and 35oC (▬ ▪ ▬) (Eq. 4) for A.
niger L11 and B1.
Key to references: (a) Ayerst, 1969; (b) Gibson et al., 1994; (c) Holmquist et al.,
1983; (d) Horner and Anagnostopoulos, 1973 ; (e) Marin et al., 1998; (f) Mitchell
et al.,2003; (g) Magan and Lacey, 1984; (i) Pitt and Hocking, 1977; (j) Ramos et al.,
1998; (k) Sautour et al.,2001; (l) Wheeler et al., 1988; (m) Wiesner & Casolari 1983.
Chapter III Modelling the Effect of Aw and Temperature on Growth rate of A.niger
55
flavus
niger
ochraceus
parasiticus
candidus
fumigatus
nidulans
repens
versicolor
nomius
oryzae
carbonarius
Species
0.64
0.66
0.68
0.70
0.72
0.74
0.76
0.78
0.80
0.82
0.84
0.86
0.88
0.90
0.92
0.94W
ater
act
ivity
(aw
min
)
Mean ±0.95 Conf. Interval
(a,b
,c,d
,e,i,
k,l,m
) (a,e
)
(e,j)
(a,c
)
(g)
(g)
(g)
(g)
(g)
(g)
(b,h
)
(f)
Figure 3.10. Minimal water activity (awmin) confidence intervals vs. reported data
on Aspergillus and related species and forecasted awopt at 25(▬), 30(▪▪▪) and 35oC (▬
▪ ▬) (Eq. 4) for A. niger L11 and B1.
Key to references: (a) Ayerst, 1969; (b) Gibson et al., 1994; (c) Holmquist et al.,
1983; (d) Horner and Anagnostopoulos, 1973; (e) Marin et al., 1998; (f) Mitchell et
al.,2003; (g) Magan and Lacey, 1984; (h) Northolt and Bullerman, 1982; (i) Pitt and
Hocking, 1977; (j) Ramos et al., 1998; (k) Sautour et al.,2001; (l) Wheeler et al.,
1988; (m) Wiesner & Casolari, 1983.
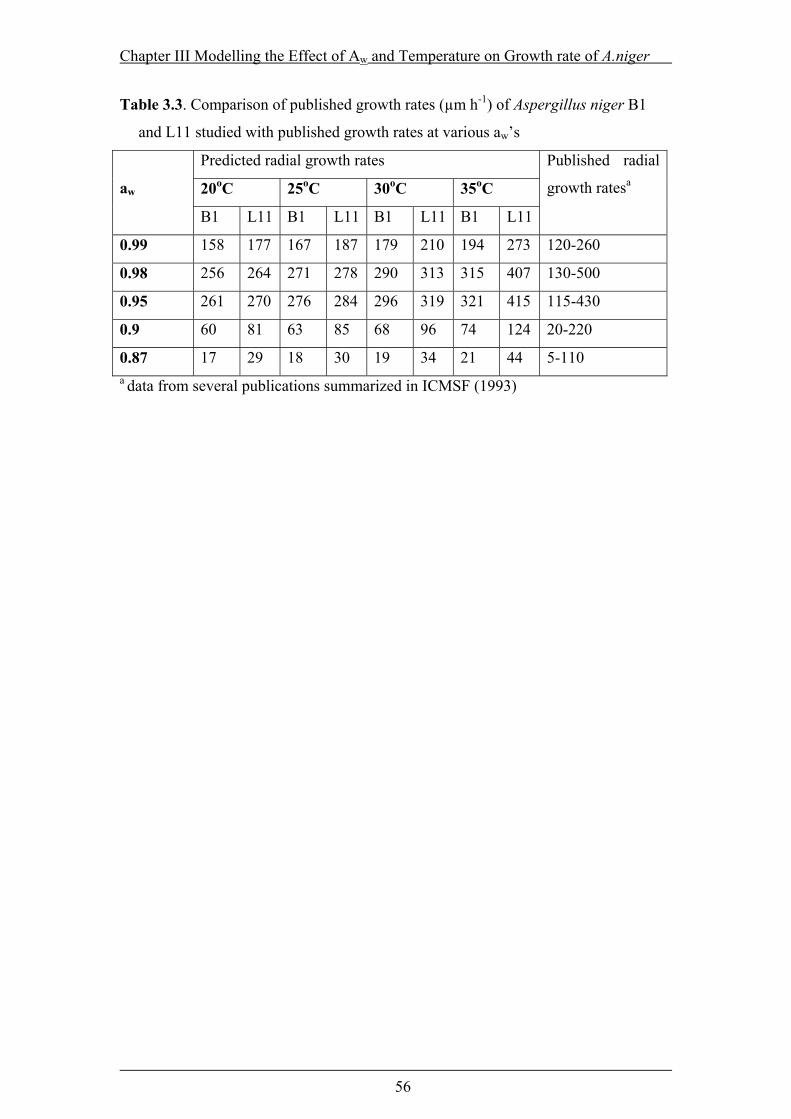
Chapter III Modelling the Effect of Aw and Temperature on Growth rate of A.niger
56
Table 3.3. Comparison of published growth rates (µm h-1) of Aspergillus niger B1
and L11 studied with published growth rates at various aw’s
Predicted radial growth rates
20oC 25oC 30oC 35oC aw
B1 L11 B1 L11 B1 L11 B1 L11
Published radial
growth ratesa
0.99 158 177 167 187 179 210 194 273 120-260
0.98 256 264 271 278 290 313 315 407 130-500
0.95 261 270 276 284 296 319 321 415 115-430
0.9 60 81 63 85 68 96 74 124 20-220
0.87 17 29 18 30 19 34 21 44 5-110 a data from several publications summarized in ICMSF (1993)

Chapter III Modelling the Effect of Aw and Temperature on Growth rate of A.niger
57
In the present work the model has been investigated as a tool for the interpretation of
fungal growth rate data. Within the experimental boundary limits of temperature and
aw the model produced is able to predict accurately the colony radial growth rates
(mm day-1) and at the margins of the model it produces good forecast values. This
type of model will assist in predicting conditions over which growth in food matrices
may be a problem and also may assist in developing prevention strategies in food
production processes. However, it also has applications as a bioprocess tool to assess
the aw and temperature conditions to achieve a specific growth rate according to the
operational parameters in biotechnological applications. Potential exists to extend the
model application to wider range of different humectants with different properties
such as ionic solutes. Although data regarding the effect of aw on mould growth is
available, comparisons of results between investigators is often difficult because of
differences in methodology or isolates used. Standardization of methodology across
combinations of factors affecting growth can help to produce models to describe
growth under any combination of conditions within the range tested.

Chapter IV Effect of Aw & Inoculum on Lysozyme Production (Free system)
58
CHAPTER IV EFFECT OF WATER ACTIVITY, INOCULUM SIZE AND
AUTOCLAVING PROCEDURE ON LYSOZYME PRODUCITION BY TWO GENETICALLY ENGINEERED Aspergillus niger
STRAINS
Submitted to Biotechnology Progress
Chapter IV Effect of Aw & Inoculum on Lysozyme Production (Free system)
59
4.1 INTRODUCTION
Filamentous fungi such as Aspergillus niger, Aspergillus oryzae and Trichoderma
reesei are able to produce and secrete large concentrations of enzymes (e.g. amylases,
proteases, cellulases), metabolites and organic acids into the environment. This
property has been widely exploited by the food and beverage industries (Conesa et al.,
2001). Increasingly, these species are being used to produce recombinant proteins.
Filamentous fungi offer advantages for the production of recombinant proteins: they
possess an efficient secretion system, are able to glycosylate proteins and have higher
specific growth rates than plant, insect or mammalian cells.
The commercial use of the fungal secretory machinery and the limitations
encountered in the production of heterologous proteins has stimulated research into
genetics of the protein secretion in filamentous fungi, design of novel fermentation
media, and optimization of the environmental conditions to enhance the heterologous
protein production. Growth of filamentous fungi has been shown to be dependent on
thermodynamic factors such as water availability and temperature (Scott, 1957;
Gervais et al., 1988) and chemical factors such as glucose, O2, and CO2,
concentrations (Trinci, 1969; Trinci and Collinge, 1973). The most important
environmental stress parameter that influences fungal activity and secondary
metabolite production is water availability (water activity, aw). It has been
demonstrated that significant improvements in pharmaceutical metabolite production
can occur when aw stress is imposed during fungal growth (Baxter et al., 1998; Aldred
et al., 1999).
Sterilization of fermentation media can result in vital nutrients (e.g. vitamins, amino
acids, and sugars) being destroyed, while the hydrolysis of complex substances (e.g.
proteins and polysaccharides) may be enhanced. The formation of insoluble
compounds may eliminate the availability of a nutrient, while inhibitory compounds
resulting from the interaction of medium components may result in a medium which
is not conductive to growth or to product formation (Anderson et al., 1986; Wang et
al., 1979). Sterilization conditions have been shown previously to affect fermentation
performance. For example, efrotomycin production by Nocardia lactamdurans was
Chapter IV Effect of Aw & Inoculum on Lysozyme Production (Free system)
60
greatly improved by sterilizing glucose together with the rest of the medium
components (Jain and Buckland, 1988). Zaragozic acid production by Leptodontidium
elatius was improved under different autoclaving conditions (Connors et al., 1995).
Proteolysis has been recognised as a major problem associated with recombinant
protein production, not only in fungal, but also in bacterial populations (Enfors, 1992;
Verdoes et al., 1995). Several strategies have been employed for reducing proteolysis
of recombinant proteins. The primary strategy has been to use a protease deficient
host strain to generate the transformant (van den Hombergh et al., 1995; Zheng et al.,
1998).
In addition to the use of a protease deficient host, or when no such host is available
environmental and morphological parameters can be manipulated to reduce
proteolysis. The pattern of expression of proteases in Aspergillus niger can be
modified by changes in the inoculum size (Papagianni and Moo-Young, 2002).
Inoculum quality, in terms of size, type or age, is of prime importance in determining
the outcome of filamentous fermentations (van Suijdam et al., 1980; Gencheva and
Dimova, 1984; Vecht-Lifshitz et al., 1990 and Brückner and Blechschmidt, 1991).
The objectives of the present work were to evaluate the effect of (a) water availability,
(b) inoculum size and (c) sterilization procedure on the production of the heterologous
protein lysozyme by two genetically engineered Aspergillus niger strains (L11 and
B1).
4.2 MATERIALS AND METHODS
4.2.1 Fungal Strains
See section 2.2.1
4.2.2 Activation and Strain Inoculation
Thawed 500 µl cryogenic stock spore suspension vials (Nalgene) (1.8x10⁷ spores/ml
± 2%) of Aspergillus niger L11 and B1 were used. A 5 µl of the spore suspension was
inoculated on glycerol-modified MEA (0.97aw) Petri plates and incubated at 35oC. a
Humidat-IC II apparatus (Novasina, Talstrasse, Switzerland) was used to check the aw
levels and found to be within 0.005 of the desired aw level. Actively growing 8-day-

Chapter IV Effect of Aw & Inoculum on Lysozyme Production (Free system)
61
old cultures were harvested to produce the spore inoculum by pouring 10 ml of sterile
Tween 80 (100 µl l-1) solution onto the glycerol-modified MEA (0.97aw) growing
cultures and dislodged using a sterile microbiological loop. The extracted spores of
each of the two strains were used to inoculate the liquid media modified with glycerol
(0.98, 0.97 and 0.96aw) with three spore concentration treatments (2.7x10⁵, 2.7x10⁴,
and 2.7x10³ spores ml-1) using 3 autoclaving procedures for the fermentation medium:
treatment A (all components autoclaved together); treatment B (medium autoclaved +
maltose filtered); treatment C (medium autoclaved + maltose & soya milk filtered).
The cultures (130 ml in 250-ml conical flasks) were incubated at 37 ºC on a shaker at
150 rev min-1 for 25 days.
4.2.3 Media Preparation and Incubation
A standard lysozyme production medium was prepared containing 150 g maltose
(Sigma), 50 g tri-Na+-citrate (Fisher Chemicals), 15 g (NH4)2SO4 (BDH), 1 g
NaH2PO4٠7H2O (BDH), 1g uridine (Sigma), 70 ml soya milk (Local supermarket,
Tesco), 1 ml tween 80 (Sigma). This medium is a modification of the soya complex
medium (SCM) by MacKenzie et al. (1994). The soya milk contained 3.6 % (w/w)
protein, 0.6 % (w/w) carbohydrates, 2.1 % (w/w) fat. The soya milk and the maltose
(aqueous solution) were filtered through sterile membranes (0.2 µm). The mixing of
the soya milk and maltose with the autoclaved medium was performed under aseptic
conditions. The aw of this medium without modification was 0.98. The aw of the
fermentation medium was modified to 0.97 and 0.96 aw with 0.44 and 0.79 molar
glycerol.
4.2.4 Lysozyme Analysis
Lysozyme activity in culture was determined by measuring the decrease in
absorbance at 600 nm with a double beam spectrophotometer (CAMPSPECT M350).
The kinetics of lysis of Micrococcus lysodeikticus ATCC No. 4698 (Sigma)
0.4 mg ml-1 cell in phosphate buffer was carried out according to the method
developed by Archer et al. (1990b).
Chapter IV Effect of Aw & Inoculum on Lysozyme Production (Free system)
62
4.2.5 Experimental Design and Data Treatment
The environmental conditions and inoculation levels were selected as being relevant
and applicable to the lysozyme production. The combinations of environmental
conditions used were selected using the experimental design module of Statistica 6.0
(SoftStat, Inc. 1984-2001, USA). The experimental design was 23 cube plus star
central composite with three factors at three values: Aw, 0.98, 0.97 and, 0.96; spore
concentration, 2.7x10⁵, 2.7x10⁴, and 2.7x10³ spores ml-1; autoclaving procedure,
treatment A, B and C as defined previously. The experiment was blocked by strains
L11 and B1.
For the analysis, factors were given coded values between -1 (lowest value of
environmental parameter) and +1 (highest value). Coded values for intermediate
conditions are calculated as (actual value-factor mean)/(range of the factorial value/2).
Thus, for the inoculum of spores, where the logarithm of the values were
7.9 (2.7x10³), 1.02 (2.7x10⁴) and 1.25 (2.7x10⁵ spores ml-1), the coded values are -
1, 0, +1. A similar operation was done for the aw values of 0.96, 0.97 and 0.98. The
autoclaving procedure was set as (+1) A, (0) B, and (-1) C.
4.3 RESULTS
Table 4.1. summarises the amounts of protein actually produced and predicted for
both A. niger strains L11 and B1 under the experimental design conditions at 37oC
after 16.5 days. This time was selected based on economical and productivity
balances. This shows the autoclaving procedure treatments A and B reached higher
levels of lysozyme production than C. Strain B1 produced comparatively more
lysozyme than L11 in all the cases in the treatments A and B under the same
experimental conditions. However, L11 produced more lysozyme than B1 using
nutritional treatment procedure B at 0.97 aw. The best treatments for B1 were 1(15.2
mg l-1), 3 (14.7 mg l-1) and 9 (14.7 mg l-1, B1), while for L11 this was 11 (14.7
mg l-1). While strain B1 produced the highest concentration of lysozyme in the
medium with all the components autoclaved, the maximum production of L11 was
Chapter IV Effect of Aw & Inoculum on Lysozyme Production (Free system)
63
obtained with autoclaving procedure B. Both strains produced the least lysozyme
when autoclaving procedure C was used.
Figure 4.1 shows the kinetics of the best treatments for strain B1. The physical
appearance of the fermentation medium was inevitably affected by the way the
components of the medium were autoclaved. Different autoclaving procedures also
resulted in different kinetics of protein production (data not presented). The
production kinetics started with a lag phase (2-4 days), then a first cycle with a linear
production and a stationary phase. The cycle was repeated, then the activity of the
enzyme decreased. In the first cycle the production of lysozyme reached
concentrations just above 10.0 mg l-1 at day 6. However, this concentration was only
60% of the concentration achieved at day 16.5. The medium prepared with
autoclaving treatment A resulted in a very rapid and high production medium with a
very dark brown colour.
These results show the importance of autoclaving all the components together.
Although similar results could be obtained at day 20.5 for all the treatments,
increasing the fermentation time is often not a practical consideration. Taking into
account the cost-return relationship (minimal time-highest concentration), day 16.5
was the most efficient time for the harvesting of the protein.
4.3.1 Effect of Environmental Conditions on the Production of Lysozyme
The production of lysozyme from the two strains was very different depending
on the autoclaving treatment of the medium and hence the two sets of data were
separated for the statistical analysis, and two different models for B1 and L11 were
produced using the experimental design. A second order (quadratic) polynomial
equation fitted the experimental data for lysozyme production by A. niger B1 with a
multiple correlation coefficient (R2) of 0.997 (final loss: 0.01, variance explained:
99.5 %):
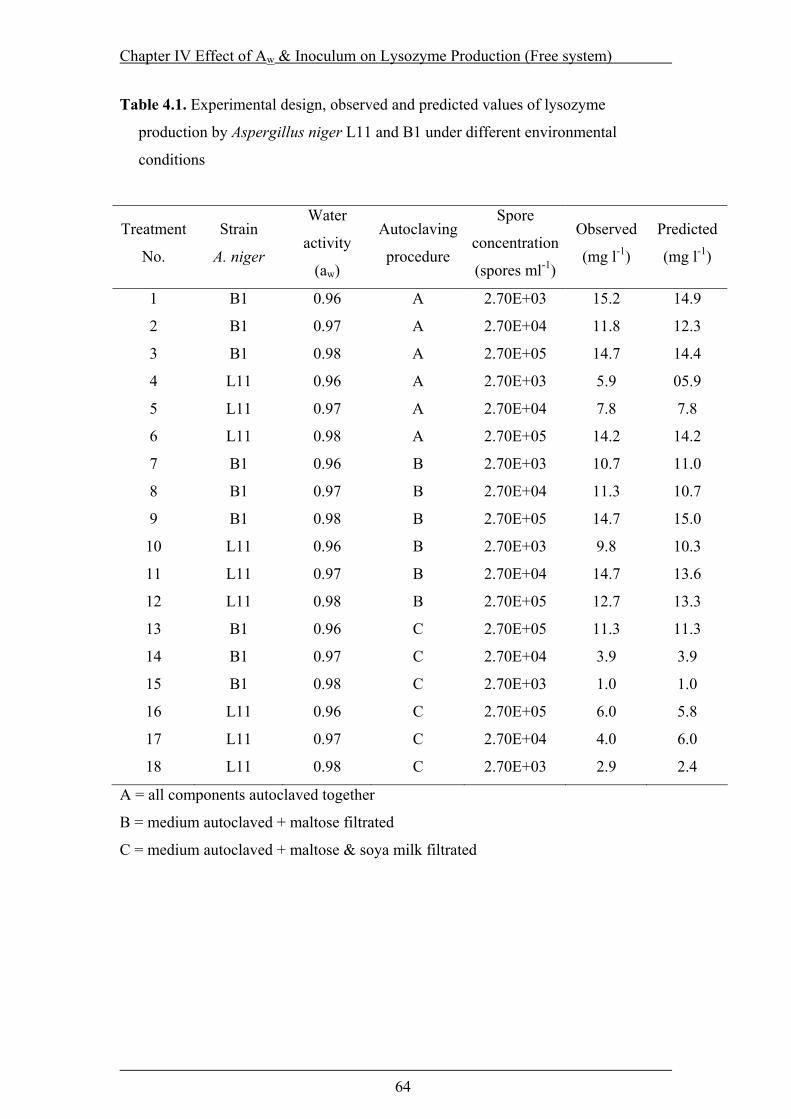
Chapter IV Effect of Aw & Inoculum on Lysozyme Production (Free system)
64
Table 4.1. Experimental design, observed and predicted values of lysozyme
production by Aspergillus niger L11 and B1 under different environmental
conditions
Treatment
No.
Strain
A. niger
Water
activity
(aw)
Autoclaving
procedure
Spore
concentration
(spores ml-1)
Observed
(mg l-1)
Predicted
(mg l-1)
1 B1 0.96 A 2.70E+03 15.2 14.9
2 B1 0.97 A 2.70E+04 11.8 12.3
3 B1 0.98 A 2.70E+05 14.7 14.4
4 L11 0.96 A 2.70E+03 5.9 05.9
5 L11 0.97 A 2.70E+04 7.8 7.8
6 L11 0.98 A 2.70E+05 14.2 14.2
7 B1 0.96 B 2.70E+03 10.7 11.0
8 B1 0.97 B 2.70E+04 11.3 10.7
9 B1 0.98 B 2.70E+05 14.7 15.0
10 L11 0.96 B 2.70E+03 9.8 10.3
11 L11 0.97 B 2.70E+04 14.7 13.6
12 L11 0.98 B 2.70E+05 12.7 13.3
13 B1 0.96 C 2.70E+05 11.3 11.3
14 B1 0.97 C 2.70E+04 3.9 3.9
15 B1 0.98 C 2.70E+03 1.0 1.0
16 L11 0.96 C 2.70E+05 6.0 5.8
17 L11 0.97 C 2.70E+04 4.0 6.0
18 L11 0.98 C 2.70E+03 2.9 2.4
A = all components autoclaved together
B = medium autoclaved + maltose filtrated
C = medium autoclaved + maltose & soya milk filtrated
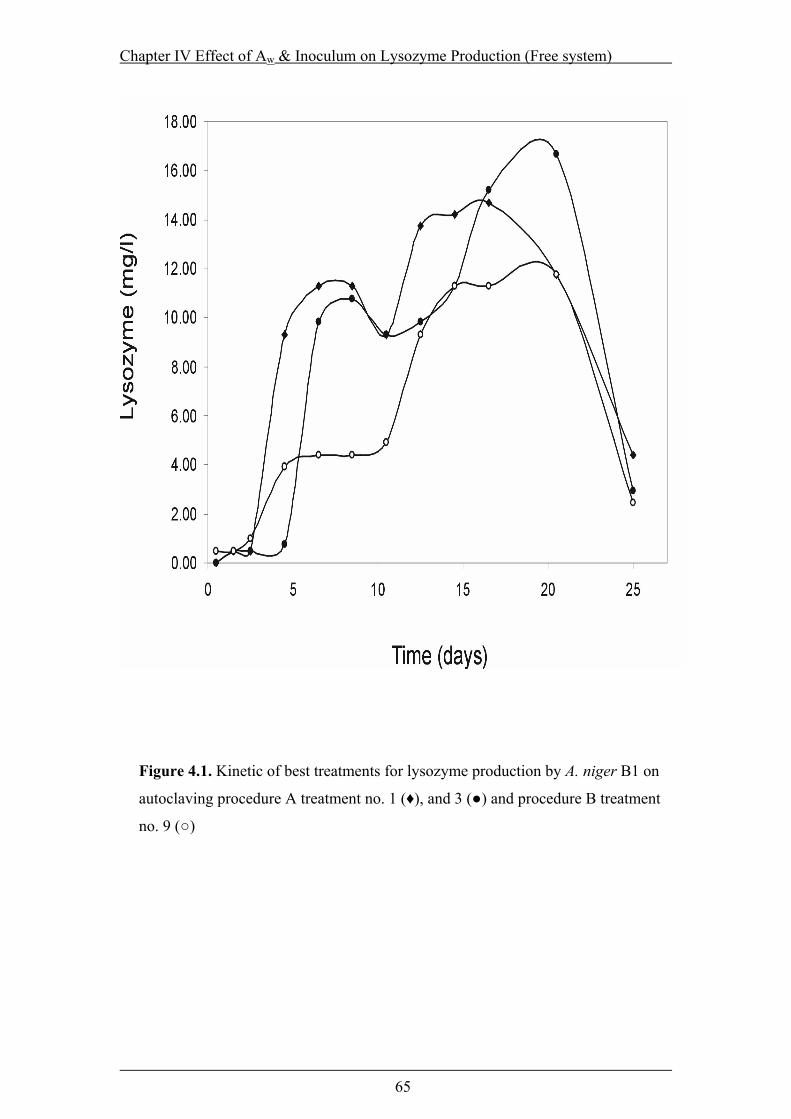
Chapter IV Effect of Aw & Inoculum on Lysozyme Production (Free system)
65
Figure 4.1. Kinetic of best treatments for lysozyme production by A. niger B1 on
autoclaving procedure A treatment no. 1 (♦), and 3 (●) and procedure B treatment
no. 9 (○)
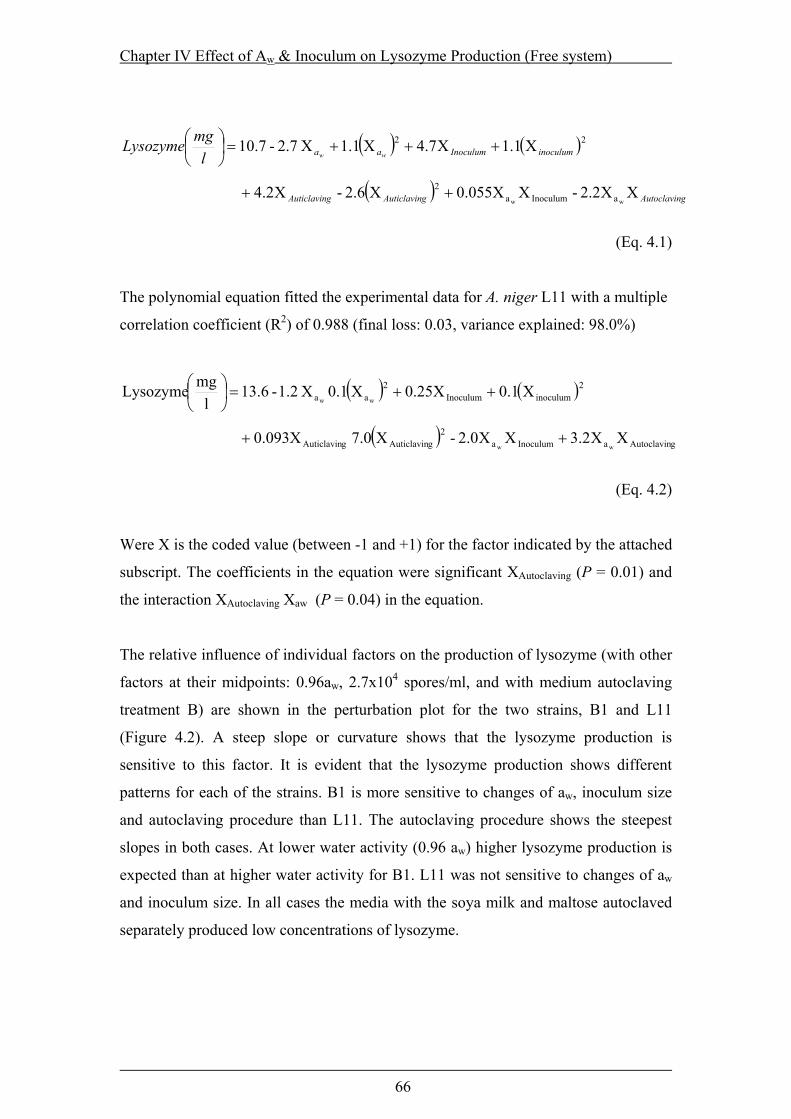
Chapter IV Effect of Aw & Inoculum on Lysozyme Production (Free system)
66
( ) ( )22 1.1 4.7 1.1 2.7- 10.7 inoculumInoculumaa wwlmgLysozyme Χ+Χ+Χ+Χ=
( ) gAutoclavingAuticlavingAuticlavin ΧΧΧΧ+ΧΧ+ww aInoculuma
2 2.2- 0.055 2.6- 4.2
(Eq. 4.1)
The polynomial equation fitted the experimental data for A. niger L11 with a multiple
correlation coefficient (R2) of 0.988 (final loss: 0.03, variance explained: 98.0%)
( ) ( )2inoculumInoculum
2aa 0.1 0.25 0.1 1.2- 13.6
lmgLysozyme
wwΧ+Χ+ΧΧ=
( ) gAutoclavinaInoculuma2
gAuticlavingAuticlavin ww3.2 2.0-7.0 0.093 ΧΧ+ΧΧΧΧ+
(Eq. 4.2)
Were Χ is the coded value (between -1 and +1) for the factor indicated by the attached
subscript. The coefficients in the equation were significant XAutoclaving (P = 0.01) and
the interaction XAutoclaving Xaw (P = 0.04) in the equation.
The relative influence of individual factors on the production of lysozyme (with other
factors at their midpoints: 0.96aw, 2.7x10⁴ spores/ml, and with medium autoclaving
treatment B) are shown in the perturbation plot for the two strains, B1 and L11
(Figure 4.2). A steep slope or curvature shows that the lysozyme production is
sensitive to this factor. It is evident that the lysozyme production shows different
patterns for each of the strains. B1 is more sensitive to changes of aw, inoculum size
and autoclaving procedure than L11. The autoclaving procedure shows the steepest
slopes in both cases. At lower water activity (0.96 aw) higher lysozyme production is
expected than at higher water activity for B1. L11 was not sensitive to changes of aw
and inoculum size. In all cases the media with the soya milk and maltose autoclaved
separately produced low concentrations of lysozyme.
Chapter IV Effect of Aw & Inoculum on Lysozyme Production (Free system)
67
4.3.2 Interactions Between Water Activity, Inoculum Size and Autoclaving Procedure
Higher concentrations of lysozyme were achieved with B1. The interactions of water
activity and inoculum size under different procedures of autoclaving are presented in
Figure 4.3. The highest production of lysozyme was obtained under high inoculum
concentrations (2.7 x 10⁵ spores ml-1) and low aw conditions (0.96) with autoclaving
procedure A (Figure 4.3 (a)). The production was halved under the same conditions
but using autoclaving procedure C (Figure 4.3 (c)).
The lysozyme produced can be ranked by autoclaving procedure from the highest to
the lowest production as follows: autoclaving procedure A > autoclaving procedure B
>autoclaving procedure C. An optimum of lysozyme production was found when
combining autoclaving procedure A, lower water activities (0.96) and higher levels of
initial inoculum (2.0x10⁵ spores ml-1) with the strain A. niger B1.
4.4 DISCUSSION
Statistical modelling for optimising parameters showed that for strain A. niger B1 the
best conditions were: high water stress (0.96 aw), high inoculum size (2.0 x 10⁵ spores
ml-1) and autoclaving all the components of the medium together (autoclaving
procedure A). Overall, the fermentation performance for the production of the
heterologous protein lysozyme was significantly affected by the changes in
autoclaving procedure used for medium sterilization, water activity and inoculum
levels. These have all been identified as important parameters to maximise the
production of lysozyme by A. niger. The results obtained in this study showed that the
reduction of the water activity in the external environment affected the protein
secretion by the fungal cells. Although similar concentrations achieved by both
strains, the selection of B1 as the most suitable strain to be used in future work due to
the process advantage of this strain to produce relatively higher level of lysozyme
production (15.2 mg l-1 in comparison with L11 14.7 mg l-1) on a medium with all the
components autoclaved together.

Chapter IV Effect of Aw & Inoculum on Lysozyme Production (Free system)
68
Figure 4.2. Perturbation plot showing the predicted effect of water activity, inoculum
size and the autoclaving procedure on the production of lysozyme by A. niger B1 (a)
and L11 (b) when other factors are at their midpoints (0.97aw, 2.7x10⁴ spores ml-1 and
maltose autoclaved apart). Water activity (-1.0=0.96, +1.0=0.98), inoculum size (-
1.0=2.7 x 10³, +1.0=2.7 x 10⁵ spores ml-1), autoclaving procedure (-1.0= autoclaving
procedure C, +1.0= autoclaving procedure A)
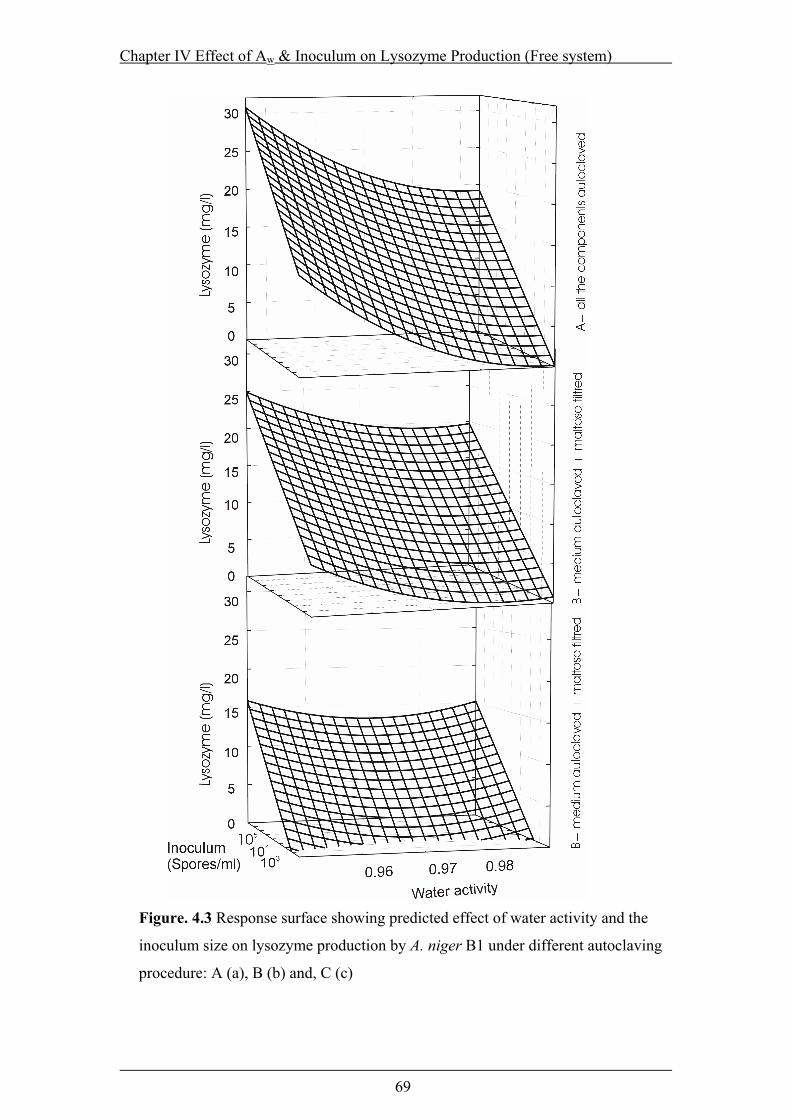
Chapter IV Effect of Aw & Inoculum on Lysozyme Production (Free system)
69
Figure. 4.3 Response surface showing predicted effect of water activity and the
inoculum size on lysozyme production by A. niger B1 under different autoclaving
procedure: A (a), B (b) and, C (c)

Chapter IV Effect of Aw & Inoculum on Lysozyme Production (Free system)
70
This represents a considerable reduction of contamination risk due to handling
operations in a bigger scale. The choosing of B1 supports previous studies with the
same strains (Archer et al., 1990b). MacKenzie et al. (1994) reported concentrations
of 3-5 mg l-1 with L11 in the range of 30-37oC. Levels up to 12 mg l-1 were reported
with optimum levels of 106 spores ml-1 (Archer et al., 1990a). Moreover 9.3 mg l-1 of
lysozyme was reported at pH 4.5 with B1 (Mainwaring et al., 1999). Occasionally,
significantly higher concentrations of up to 30-60 mg l-1 were reported in a medium
containing soya milk (Mackenzie et al., 1994). The comparatively low heterologous
protein production achieved in this work is possibly due to the heterokaryosis of the
recombinant DNA (Mainwaring et al., 1999; Swift et al., 2000), excised recombinant
DNA from the genome (Mainwaring et al., 1999), rearrangements within the genome
(Wiebe et al.,2003) or proteolysis (Enfors, 1992; Verdoes et al., 1995).
There are reports in the literature of the influence of osmolarity on the active transport
of Eucaryonta (Roy and Sauve, 1987; Sanchez et al., 1991; Wills et al., 1991).
Unfortunately, no data were found concerning the ion transport in cells of filamentous
fungi in response to osmotic stimulation. Bobowicz-Lassociska and Grajek (1995)
found that the water activity reduction considerably influenced the protein secretion
resulting in a 60% increase over the non-modified medium.
The physicochemical and chemical properties of the medium were affected by the
heat input, and the interactions between substrates (autoclaving procedure) at high
temperatures. This resulted in an increase in lysozyme production when all the
components of the medium were autoclaved together. Sterilization conditions have
been shown previously to affect fermentation performance. Efrotomycin production
by Nocardia lactamdurans was greatly improved by sterilizing glucose together with
the rest of the medium components (Jain and Buckland, 1988). Moreover zaragozic
acid production by Leptodontidum elatius increased by 26% due to the heat input
during autoclaving (Connors et al., 1995). Possibly the high-heat input of all the
components autoclaved results in a greater flux of carbon into acetate and succinate or
there is a molecular uptake directly from the medium to the citric acid cycle (Connors
et al., 1995). Similarly, an increase in the hydrolysis of protein substrates (as a result
of heat input) could result in an increased supply of amino acids from the medium
made available for lysozyme synthesis.

Chapter IV Effect of Aw & Inoculum on Lysozyme Production (Free system)
71
It should be noted that the medium formulation employed for the production of
lysozyme contains maltose and during the sterilization will result in non-enzymatic
browning Millard-type reactions between maltose and the free amino acids together
with the conversion of maltose to glucose. The glucose can pass through the cell
membrane by free diffusion but maltose requires active transport. This could become
a limiting step in the lysozyme production in two ways: reduction of carbon as a
structural molecule and as an energy source. Dominguez et al. (2000) reported that
the media composition seems to influence morphogenesis and cellulose formation by
T. reesei. The composition of the fermentation medium had a significant effect on
morphology. Moreover the composition of the medium resulted critical for growth
morphology and lovastatin production by Aspergillus terreus in submerged cultures
(Long-Shan et al., 2003).
The methodology employed in the present study of using contour surface plotting has
shown a useful method for the determination of relevant variables for process
optimization. This made it possible to simulate conditions isolating the effects of
marginal, factors avoiding increasing the number of runs and enhancing the
information uptake. This information is essential in the optimization process. The
regressed polynomials had a high regressed coefficient (R2=0.997 and R2=0.988) for
the production of heterologous protein by B1 and L11. The use of the perturbation
graph for clarifying the effects is a novel tool in the production of heterologous
protein and can be useful in further optimization.
The statistical model generated by the contour surfaces is a very useful technique for
forecasting and interpreting of the effect of different factors. The plots provide
evidence for real differences between the strains. The autoclaving procedure may
have generated a toxic or inhibitory environment for lysozyme production by L11.
However, the results suggest a simple medium preparation system for B1 suitable for
scale up. Under different aw conditions the performance of the strains was also
different. The effect on production of lysozyme by L11 was not significant. However,
for B1 there were significant differences under the different aw levels tested.

Chapter IV Effect of Aw & Inoculum on Lysozyme Production (Free system)
72
Previous studies have examined the effect of inoculum size alone, but not in relation
to water availability or interaction with nutritional conditions. Archer et al. (1990a)
used inocula of between 103-107 spores ml-1 and found optimum at 106. However, for
commercial exploitation lower concentrations are preferred. The present study
suggests that even at lower concentrations there is a significant effect of inoculum
size on lysozyme production by these strains. The model predicted that, 2.0 x 10⁵
spores ml-1 was needed to produce the maximum concentration of lysozyme. This may
be due to different morphological states achieved by the different levels of inoculum
(van Suijdam et al., 1980; Vecht-Lifshitz et al., 1990; Trucker and Tomas, 1992).
This spore concentration for production of heterologous protein is similar to the
lowest reported for extracellular protease activity by Aspergillus niger (Papagianni
and Moo-Young, 2002). A more efficient fermentation systems with on-line control
of pH and aeration coupled with novel culture techniques such as immobilization of
the mycelium could provide alternative approaches to improve the production levels
of heterologous proteins such as lysozyme.
Chapter V Immobilized Design for the Production of Heterologous Protein Lysozyme
73
CHAPTER V
A NOVEL IMMOBILIZED DESIGN FOR THE PRODUCTION OF HETEROLOGOUS PROTEIN LYSOZYME BY GENETICALLY
ENGINEERED Aspergillus niger STRAINS
Applied Microbiology and Biotechnology. In Press
Chapter V Immobilized Design for the Production of Heterologous Protein Lysozyme
74
5.1 INTRODUCTIUON
The ability to secrete glycosylated proteins makes filamentous fungi attractive hosts
for recombinant protein production (Lin et al., 1993). They have been widely used for
the production of heterologous as well as homologous proteins. However the levels of
production of heterologous proteins do not exceed a few tens of milligrams per litre
(Gouka et al., 1997). Filamentous fungi are able to utilize a great variety of carbon
and nitrogen sources by secreting a range of different enzymes into their environment.
Unfortunately, degradation of heterologous proteins by extracellular proteases
secreted by fungi into the culture media has been a major problem for the efficient
production of recombinant proteins (Archer et al., 1992; Enfors, 1992).
Attempts to improve the concentration of heterologous proteins in fungal
fermentations, include strategies such as gene fusion (Gouka et al., 1996), the use of
protease deficient mutants (van den Hombergh et al., 1995), and environmental and
morphological parameters which can be manipulated to reduce proteolysis.
Papagianni and Moo-Young, (2002) have reported that a change of protease
expression in Aspergillus niger can be achieved by changing the inoculum size.
A close relationship between a particular morphology and increased process
productivities is characteristic of a number of industrially important fermentations
(Papagianni, 1999; Calam, 1987).
Fermentative production of metabolites can be obtained in both solid state and
submerged cultivation. While solid state produces higher metabolite concentrations
released into the medium (Lin 1973; Lee et al., 1995), solid substrate fermentation
also has several disadvantages: low mass transfer and often no control of the
operation parameters such as pH, temperature and water activity. Immobilization of
microbial cells gives the advantages of using solid substrate support in a submerged
culture fermentation framework. This approach has received increasing interest in
recent years (Wang et al., 1997).
The immobilization of microbial cells in different carriers leads to changes in their
microenvironment (Shreve and Vogel 1993). Because of these changes, immobilized
Chapter V Immobilized Design for the Production of Heterologous Protein Lysozyme
75
cells show various modifications in physiological and biochemical composition when
compared to suspended cells (Hilg-Rotmann and Rehm 1990; Adam et al.,2001). The
use of polysaccharides has become one of the most important methods for fungal
immobilization. This technique can be carried out in a single step process under very
mild conditions and is therefore compatible with most viable cells. Polysaccharide
matrices generated in gel beads are strongly dependent on several variables such as
polymer type, concentration and ionic strength (Skjårk-Bræk et al., 1989; Nava-
Saucedo et al., 1994; Gmeiner et al., 1996). Such modifications may also result in
modifications of the water activity in the beads and influence rates of colonization and
subsequent production of enzymes or secondary metabolites. This could have
important implications in studies of xerotolerant or xerophilic microorganisms where
this may have an impact on concentration.
Traditional methods of optimization involve changing one independent variable at a
time while keeping the others fixed at a certain level. This single-dimensional search
is laborious, time consuming, costly and incapable of reaching the optimum due to the
interactions among variables. Response surface methodology is an important strategy
for seeking the optimal conditions for multivariable systems. It has been successfully
employed for optimizing medium ingredients and operating conditions in many
bioprocesses (Kemp et al., 1989; Roseiro et al., 1992; Prapulla et al., 1992; Lee
et al., 1997).
In order to carry out the optimization process various mathematical tools can be used.
The traditional method is the use of multiple regression of the partial or full factorial
experiments to come up with a model of the system. This involves fitting the data to a
complex polynomial. This polynomial can be made simpler by ignoring non-
significant effects using stepwise multiple regression. Response surface methodology
can then be used to evaluate the optimal region (Prapulla et al., 1992).
The objective of the present study was to optimize, by response surfaces
methodology, the physiological and immobilization conditions to enhance the
production of the heterologous protein lysozyme, by a genetically engineered A. niger
B1 strain. The factors examined in this study were (a) polymer type and
concentration, (b) gel-inducer (CaCl2) concentration and (c) inoculum levels.
Chapter V Immobilized Design for the Production of Heterologous Protein Lysozyme
76
5.2 MATERIALS AND METHODS
5.3 Fungal strains
The culture of A. niger B1 was maintained as described in section 4.2.1
5.4 Activation and inoculation
Thawed 500 µl cryogenic stock spore suspension vial (Nalgene) (1.8x10⁷ spores ml-1
± 2%), was used to reactivate the strain. A 5 µl of the spore suspension was inoculated
on MEA modified by glycerol to 0.97 aw and incubated at 35oC. The water activity
(aw) values of the media were determined by using a Humidat-IC II water-activity
measuring apparatus (Novasina, Talstrasse, Switzerland) at 25°C. The water activity
was found to be within ± 0.005 of aw treatment values. An actively growing 8-day-old
culture of Aspergillus niger B1 was used to produce the spore inoculum. The fungal
spore inocula were prepared by flooding 10 ml glycerol-modified MEA with 10ml of
sterile water + 0.1% of Tween 80. Each flask (250 ml) containing 100 ml of the
seeding medium consisted of 4.0 % malt extract modified with glycerol to 0.96 aw.
Seeding medium was inoculated with 1 ml of a spore suspension (9.0 x 10⁶ spores
ml-1). The cultures were placed in an orbital shaker incubator (L.H Engineering Co.
Ltd, England) set to 150 rpm at 25 ºC for 5 days.
5.5 Immobilization
Growing mycelia of Aspergillus niger were used for immobilization. In aseptic
conditions the seeding fungus were immobilized in Ca-pectate and Ca-alginate using
a modified version of the method used by Escamilla et al. (2000). The mycelial pellets
were homogenised in a blender (50 seconds) and filtered through a sinterglass funnel
to remove all the liquid. The biomass was recovered on Whatman filter paper (No. 2).
The inoculum was adjusted in a volumetric cylinder to either 1:2 (33 % v/v) or 1:4 (20
% v/v) inoculum:polymer ratio by using either polygalacturonic or alginic acid at two
levels; 2 and 4% (w/v). The mixture was forced through a multi-needle template (18
gauge for 5 mm beads) with a peristaltic pump (Watson Marlon) flowing at 10 ml
min-1 and the droplets were collected in sterile gel-inducer solutions of 2 %(w/v)
CaCl2 or 3.5 % (w/v) CaCl2. After soaking for 3 h the liquid was decanted and the
spherical beads were washed with sterile RO water and stored at 4ºC for 24 hours.
Chapter V Immobilized Design for the Production of Heterologous Protein Lysozyme
77
The water activity (aw) of the decanted beads were evaluated with a Humidat-IC II
apparatus (Novasina, Talstrasse, Switzerland).
5.6 Media preparation and incubation
See section 4.2.3
5.7 Lysozyme analysis
See section 4.2.4
5.8 Experimental design and data treatment
The immobilized cell fermentation design conditions and inoculation levels were
selected as being relevant and applicable in the lysozyme production. The
combinations of environmental conditions were selected using an experimental design
generated with Statistica 6.0 (SoftStat, Inc. 1984-2001, USA). The experimental
design was based on a central composition with four factors at two levels each:
polymer type (alginate, pectate); concentration of polymer (2% and 4% w/v); and
inoculum-polymer ratio 1:2 (33% v/v), 1:4 (20% v/v); and concentration of gel-
inducing agent CaCl2 (2.0 % and 3.5 % w/v) (Table 5.1). The effect of pH in the
medium and of water activity in the beads was evaluated by blocking the polymer
type and perform a polynomial regression and response surfaces were generated.
For the analysis, each factor was given a code value between -1 (lowest value) and +1
(highest value). The central point (CP), for intermediate conditions was calculated as
follows:
[ ]
−
=
2RF
MACP (Eq. 5.1)
Where A = actual value, M = factor mean, RF = range of the factor value. The initial
inoculum levels were 1:2 (33 % v/v) and 1:4 (20 % v/v), and the coded values were -1
and +1 respectively. Similarly, the concentrations for polymer were set at 2 % and 4
% w/v and for gel-inducer agent, at 2 % and 3.5 % w/v. The coded values for polymer
type were set as follows: polygalacturonate +1 and alginate -1. The experiments were
repeated three times and the results were statistically evaluated.
Chapter V Immobilized Design for the Production of Heterologous Protein Lysozyme
78
For the screening of the effect of the immobilization design and inoculation level on
the production of the heterologous protein lysozyme, a response surface methodology
was used. The above four factors and the fermentation time (10 days) were selected
on the basis of previous experiments with Aspergillus niger B1 and published works
with related systems (Kumar and Lonsane, 1988; Martinsen et al., 1989; Charlet et
al., 2000; Escamilla et al., 2000; Becerra et al., 2001).
5.3 RESULTS
Figure 5.1 shows the kinetic of the best treatments and make a comparison with our
previous work with free cell fermentations. Pectate resulted the best polymer to
immobilized Aspergillus niger B1 for the production of lysozyme. Treatment 7 and 8
produced the maximum lysozyme concentration of 22.9 and 20.3 mg l-1 at day 10.
Table 5.2 shows the amounts of heterologous protein produced by A. niger strains B1
under the experimental design conditions at 37oC after 10 days. The importance of
polymer selection and the impact on lysozyme production is demonstrated. Overall,
immobilization in Ca-pectate resulted in higher amounts of lysozyme production
compared to that in Ca-alginate. Maximum lysozyme production with Ca-pectate was
13-fold higher than that achieved with Ca-alginate. The highest productions of
lysozyme was at a low polymer concentration (2% w/v) and a high inoculum level
(33% v/v) with Ca-pectate. Regardless of the gel-inducing concentration, maximum
lysozyme production was achieved when pectate (2% w/v) and a low ratio of
inoculum:polymer (high inoculum level 33% v/v) was used in treatments
7 (22.8 mg l-1) and 8 (20.3 mg l-1).
A second order (quadratic) polynomial equation fitted the experimental data for
lysozyme production by A. niger B1 with a multiple correlation coefficient (R2) of
0.96 (residual: 0.045, variance explained: 95%):
inducerGelInoculumPolymerPolymer ConclmgLysozyme −Χ+ΧΧΧ=
0.084.8- 5.0-5.5 -6.2
..
inducerGelinducerGelPolymerinducer-GelPolymer Conc −− ΧΧΧΧΧΧ Inoculum 0.57-0.18-0.48-.
(Eq. 5.2)
Chapter V Immobilized Design for the Production of Heterologous Protein Lysozyme
79
were Χ is the coded value (between -1 and +1) for the factor indicated by the attached
subscript.
Table 5.3 presents the analysis of variance of the main factors (R2 =0.96; R2adj=0.95).
The coefficients in the linear equation for polymer type XPolymer, polymer
concentration ..ConcPolymerΧ and inoculum size XInoculum were statistically significant
(P = < 0.0000001) except for the coefficients for gel-inducer XGel-inducer (P = 0.85)
(CaCl2). The interactions were not significant (XPolymer..ConcPolymerΧ ; P = 0.29), XPolymer
XInoculum ;P = 0.68) and XPolymer XGel-inducer ;P = 0.20). However, the least significant
terms were included in the equation to maintain the hierarchy in the model.
Figure 5.2 presents the parameter estimates based on their absolute importance in the
production of lysozyme. Regardless of the concentration of gel-inducer, the most
important factors in the immobilization which affected lysozyme production by A.
niger B1 were: polymer type, polymer concentration and the inoculum-polymer
interaction.
5.3.1 Interactions between polymer type and concentration, inoculum-polymer ratio and gel-inducer
Figure 5.3 (a) shows marginal means, and interactions between inoculum-polymer
ratio and polymer concentration and the confidence intervals (0.95%). At high
concentrations of polymer (4%) similar concentrations of lysozyme were obtained
regardless of the inoculum-polymer ratio. However, at low polymer concentrations a
more than 13 fold increase in the concentration of lysozyme was achieved at 1:2
inoculum:polymer ratio compared to the 1:4 inoculum:polymer treatment.
Figure 5.3 (b) shows the effect of inoculum-polymer ratio and polymer type. Both
polymers produced comparable concentrations at low inoculation levels (20%). When
a high immobilized inoculum concentration (33% v/v) was used, immobilization with
pectate resulted in a 13 fold increase in the production of lysozyme.
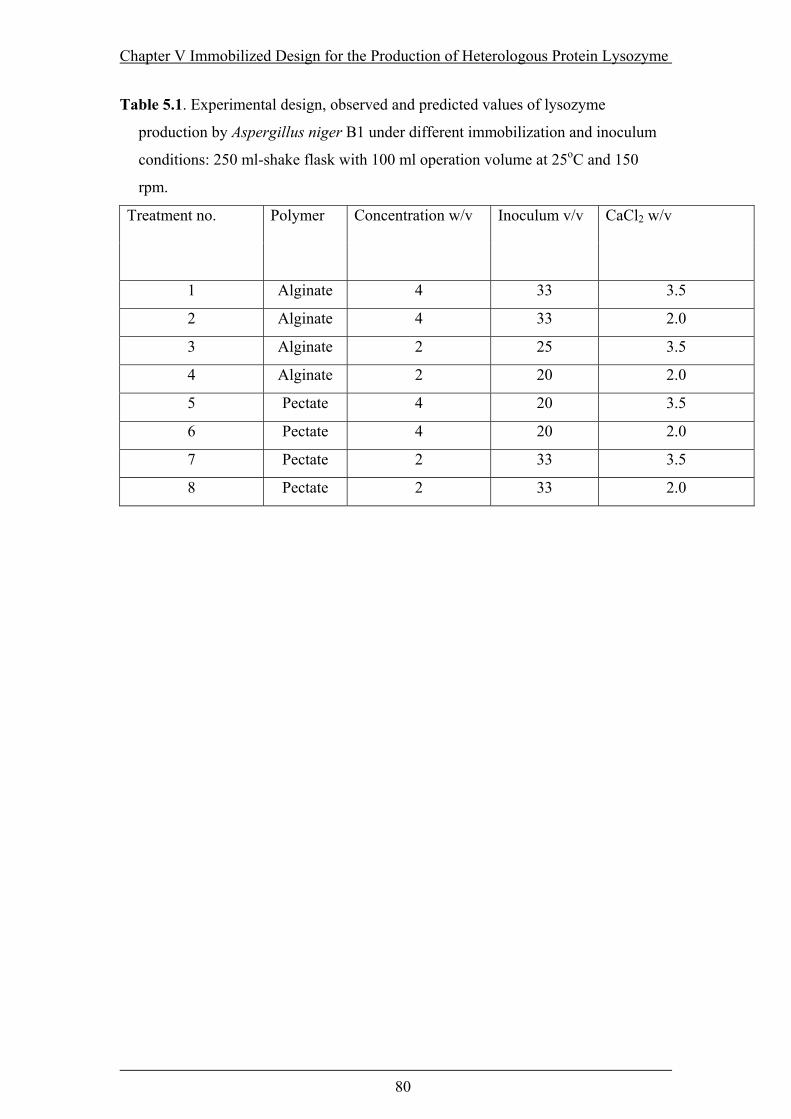
Chapter V Immobilized Design for the Production of Heterologous Protein Lysozyme
80
Table 5.1. Experimental design, observed and predicted values of lysozyme
production by Aspergillus niger B1 under different immobilization and inoculum
conditions: 250 ml-shake flask with 100 ml operation volume at 25oC and 150
rpm.
Treatment no. Polymer Concentration w/v Inoculum v/v CaCl2 w/v
1 Alginate 4 33 3.5
2 Alginate 4 33 2.0
3 Alginate 2 25 3.5
4 Alginate 2 20 2.0
5 Pectate 4 20 3.5
6 Pectate 4 20 2.0
7 Pectate 2 33 3.5
8 Pectate 2 33 2.0
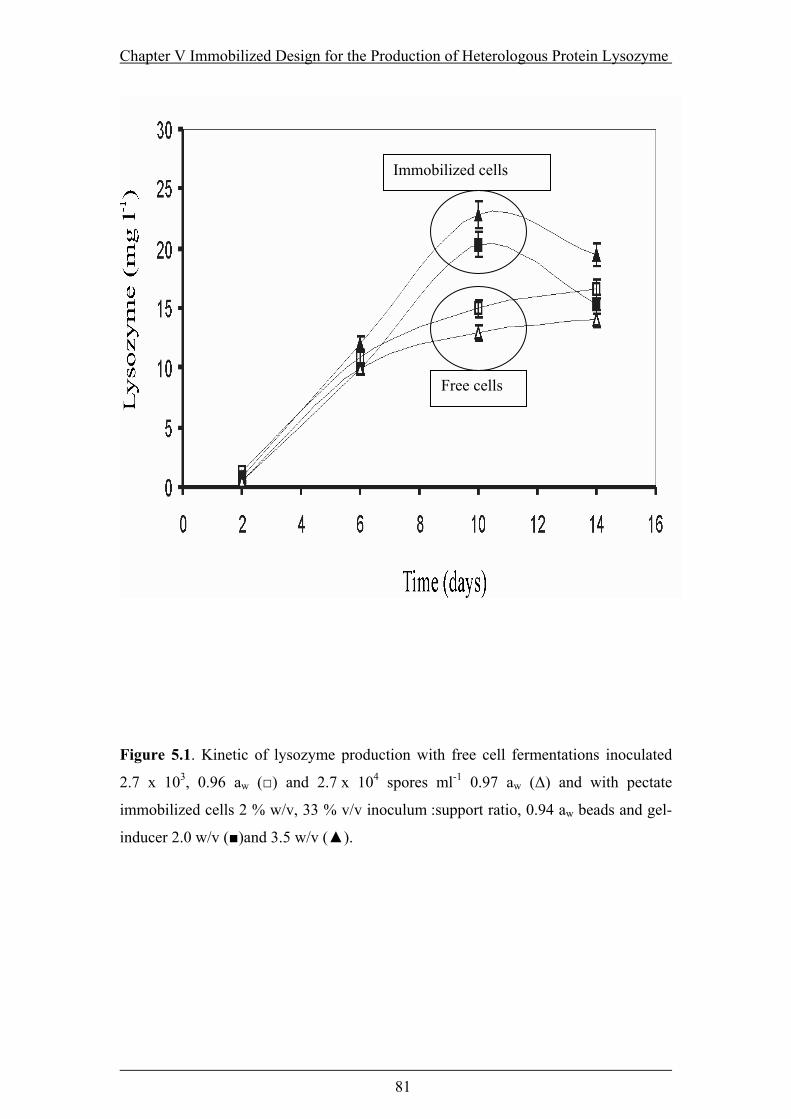
Chapter V Immobilized Design for the Production of Heterologous Protein Lysozyme
81
Figure 5.1. Kinetic of lysozyme production with free cell fermentations inoculated
2.7 x 10³, 0.96 aw (□) and 2.7 x 10⁴ spores ml-1 0.97 aw (∆) and with pectate
immobilized cells 2 % w/v, 33 % v/v inoculum :support ratio, 0.94 aw beads and gel-
inducer 2.0 w/v (■)and 3.5 w/v (▲).
Free cells
Immobilized cells

Chapter V Immobilized Design for the Production of Heterologous Protein Lysozyme
82
Table 5.2. Final pH of the fermentation medium, beads water activity, observed and
predicted values of lysozyme production by Aspergillus niger B1 under different
immobilization and inoculum conditions
Lysozyme production (mg l-1) Treatment
no. pH aw Observed Predicted
1 6.5 0.85 0.50±0.03 0.49
2 6.6 0.85 0.50±0.00 0.49
3 7.1 0.90 0.20±0.02 0.20
4 5.3 0.90 1.7±0.10 1.7
5 4.5 0.91 1.6±0.07 1.6
6 4.8 0.91 2.0±0.03 2.0
7 4.4 0.94 22.9±0.27 22.9
8 4.3 0.94 20.3±0.18 20.3
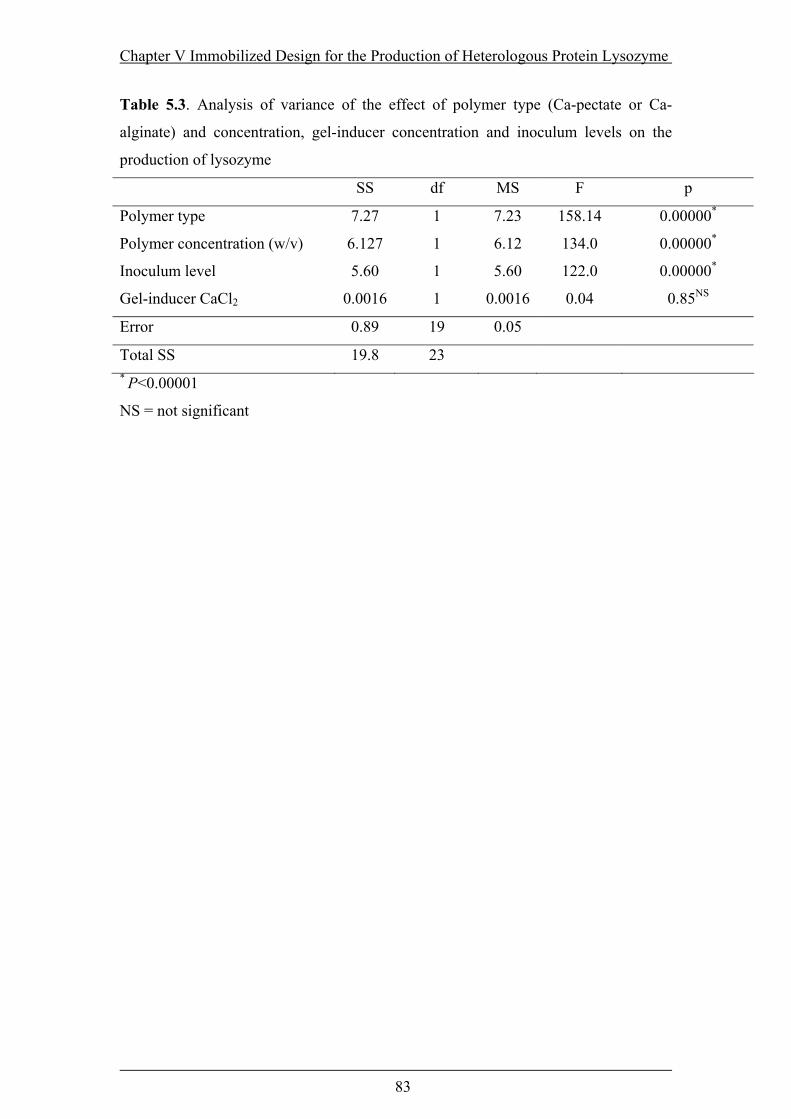
Chapter V Immobilized Design for the Production of Heterologous Protein Lysozyme
83
Table 5.3. Analysis of variance of the effect of polymer type (Ca-pectate or Ca-
alginate) and concentration, gel-inducer concentration and inoculum levels on the
production of lysozyme
SS df MS F p
Polymer type 7.27 1 7.23 158.14 0.00000*
Polymer concentration (w/v) 6.127 1 6.12 134.0 0.00000*
Inoculum level 5.60 1 5.60 122.0 0.00000*
Gel-inducer CaCl2 0.0016 1 0.0016 0.04 0.85NS
Error 0.89 19 0.05
Total SS 19.8 23 * P<0.00001
NS = not significant

Chapter V Immobilized Design for the Production of Heterologous Protein Lysozyme
84
Figure 5.2. Standard Pareto distribution of polymer type and concentration, inoculum
polymer ratio and gel-inducer agent ranked by importance on the production of
lysozyme, dotted line (--) represents minimum of statistically significant difference.
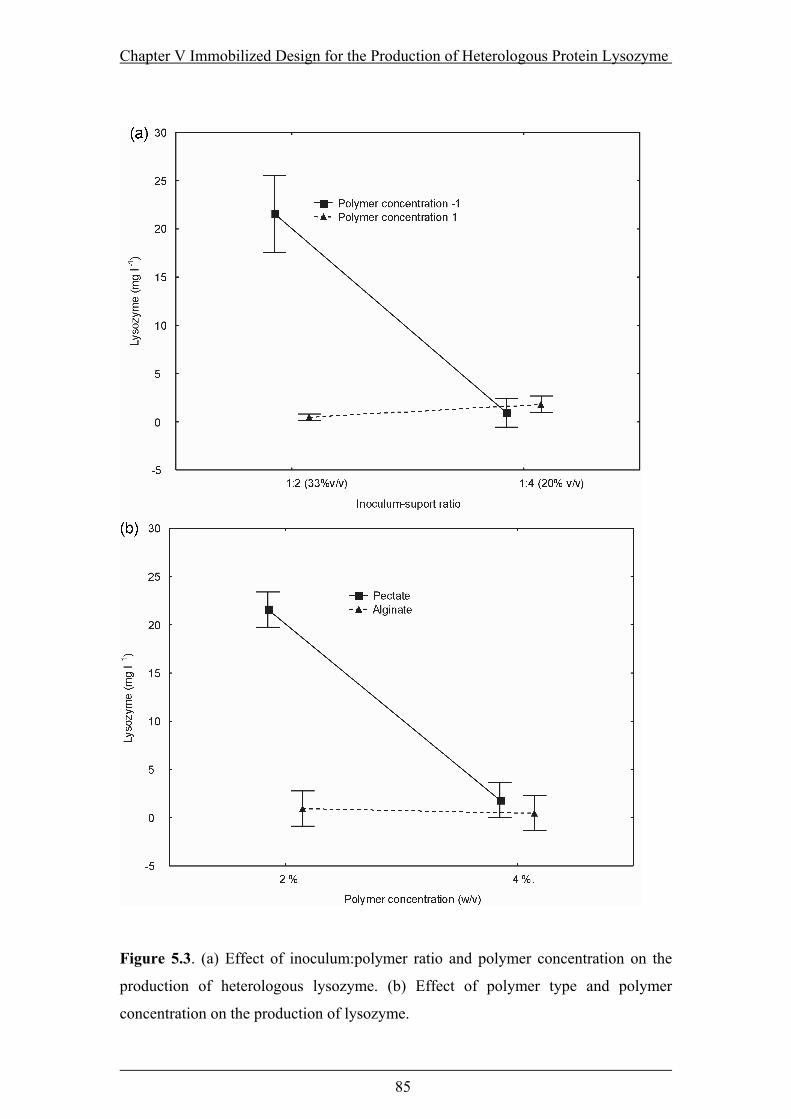
Chapter V Immobilized Design for the Production of Heterologous Protein Lysozyme
85
Figure 5.3. (a) Effect of inoculum:polymer ratio and polymer concentration on the
production of heterologous lysozyme. (b) Effect of polymer type and polymer
concentration on the production of lysozyme.

Chapter V Immobilized Design for the Production of Heterologous Protein Lysozyme
86
5.3.2 pH and water availability conditions in the final lysozyme concentration
It was noted that the pH and water activity in the beads were changed by the different
treatments examined. Thus alginate beads with a range of pH 5.3-7.1 treatments had
the lowest lysozyme production (0.2-1.7 mg l-1) while pectate bead treatments had a
pH range of 4.3-4.8 and produced higher lysozyme concentrations (1.6-22.9 mg l-1).
The pH reached by the medium at different fermentation times for all the
experimental conditions is shown in Figure 5.4 (a). Interestingly, only a narrow range
of pH at between 4.4 to about 5.0 is where the lysozyme was produced. A sharp
decrease in lysozyme production was observed at >pH 5.
Figure 5.4 (b) shows the impact of bead water availability on lysozyme production.
The immobilized cell fermentation with < 0.94 aw produced only marginal lysozyme
concentrations regardless of the polymer type. Average lysozyme produced at 0.94 aw
was 21.6 mg l-1 representing a 44 and 12-fold higher lysozyme concentrations
compared to that at 0.85 aw (alginate) and 0.91aw (pectate).
A second order (quadratic) polynomial equation fitted the experimental data for
lysozyme production by A. niger B1 with a multiple correlation of the coefficients of
water activity, pH and polymer type (R2=0.96, R2Adj=0.95):
pHpHapH2
Polymera2
a 6.13.23.00.2 6742.511801.9- l
mgLysozymewww
Χ+Χ+Χ−Χ+Χ+Χ=
×
(Eq. 5.3)
were Χ is the value of the factors not coded except for the polymer type, indicated by
the attached subscript.
The linear (waΧ ) and quadratic ( wa
2Χ ) coefficients of water availability were
statistically significant (P < 0.000001). The rest of the coefficients, polymer type
(XPolymer), linear (XpH) and quadratic (X2pH) pH and interaction of pHaw × ( pHa w×
Χ )
terms were not significant. However, the least significant terms were included in the
equation to maintain the hierarchy in the model.
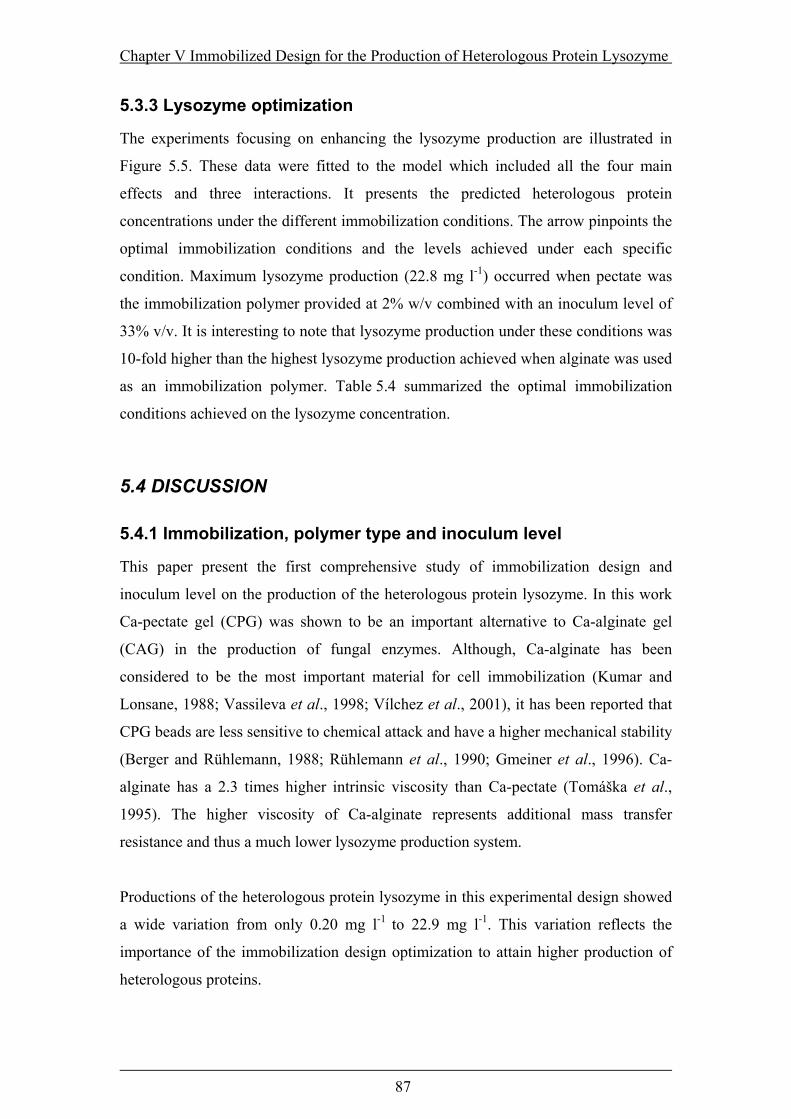
Chapter V Immobilized Design for the Production of Heterologous Protein Lysozyme
87
5.3.3 Lysozyme optimization
The experiments focusing on enhancing the lysozyme production are illustrated in
Figure 5.5. These data were fitted to the model which included all the four main
effects and three interactions. It presents the predicted heterologous protein
concentrations under the different immobilization conditions. The arrow pinpoints the
optimal immobilization conditions and the levels achieved under each specific
condition. Maximum lysozyme production (22.8 mg l-1) occurred when pectate was
the immobilization polymer provided at 2% w/v combined with an inoculum level of
33% v/v. It is interesting to note that lysozyme production under these conditions was
10-fold higher than the highest lysozyme production achieved when alginate was used
as an immobilization polymer. Table 5.4 summarized the optimal immobilization
conditions achieved on the lysozyme concentration.
5.4 DISCUSSION
5.4.1 Immobilization, polymer type and inoculum level
This paper present the first comprehensive study of immobilization design and
inoculum level on the production of the heterologous protein lysozyme. In this work
Ca-pectate gel (CPG) was shown to be an important alternative to Ca-alginate gel
(CAG) in the production of fungal enzymes. Although, Ca-alginate has been
considered to be the most important material for cell immobilization (Kumar and
Lonsane, 1988; Vassileva et al., 1998; Vílchez et al., 2001), it has been reported that
CPG beads are less sensitive to chemical attack and have a higher mechanical stability
(Berger and Rühlemann, 1988; Rühlemann et al., 1990; Gmeiner et al., 1996). Ca-
alginate has a 2.3 times higher intrinsic viscosity than Ca-pectate (Tomáška et al.,
1995). The higher viscosity of Ca-alginate represents additional mass transfer
resistance and thus a much lower lysozyme production system.
Productions of the heterologous protein lysozyme in this experimental design showed
a wide variation from only 0.20 mg l-1 to 22.9 mg l-1. This variation reflects the
importance of the immobilization design optimization to attain higher production of
heterologous proteins.

Chapter V Immobilized Design for the Production of Heterologous Protein Lysozyme
88
Figure 5.4. (a) Relation between pH of active culture and lysozyme production at
different experimental conditions and at time: 2 (♦) 6 (■), and 10 days (▲), dots
represent the tendency. (b) Effect of beads water activity on the production of
lysozyme, the (□) represent the mean of three treatments and (├ ┤) confidence interval
(95 %).
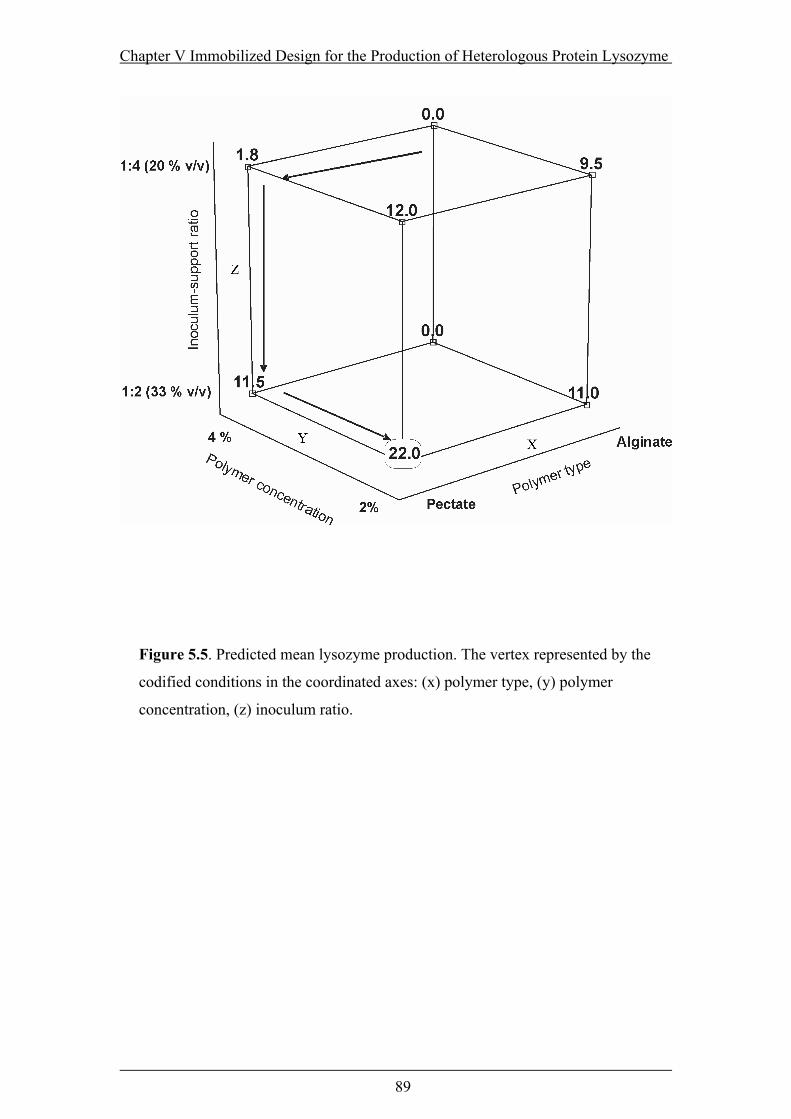
Chapter V Immobilized Design for the Production of Heterologous Protein Lysozyme
89
Figure 5.5. Predicted mean lysozyme production. The vertex represented by the
codified conditions in the coordinated axes: (x) polymer type, (y) polymer
concentration, (z) inoculum ratio.
Chapter V Immobilized Design for the Production of Heterologous Protein Lysozyme
90
Table 5.4. Factors, levels, predicted and confidence interval under the best
immobilization conditions for maximal heterologous protein production
Immobilized design Experimental
mg l-1
Predicted
mg l-1
-95%
mg l-1
+95%
mg l-1
Polymer type: Ca-pectate
Concentration: 2 % (w/v)
Inoculum level: 33% (w/v)
Gel-inducer : 3.5%
22.8 21.6 17.0 27.0

Chapter V Immobilized Design for the Production of Heterologous Protein Lysozyme
91
The main production with 2% Ca-pectate was 13-fold higher (21.6 mg l-1) than with
4% (1.8 mg l-1). The polymer concentration has the effect of enhancing the gel
strength, and at 4% this is four times higher than at 2.0% (Martinsen et al., 1989).
Previous studies have reported that the concentration of polymer altered the spectrum
and activity of degrading enzymes (Pashova et al., 1999). This could be due to the
water activity of the hydro-gel (Mizrahi et al., 1997). Changes in polymer
concentration affects the aw which has an important effect on the pattern of protein
secretion in Aspergillus niger (Bobowicz-Lassocika and Grajek, 1995). The optimal
concentration found in this work agrees with previous reports with alginate used as
the polymer (Angelova et al., 1998; Jianlong et al., 2001).
The optimal inoculum:polymer ratio 1:2 (33% mycelium immobilized v/v) represent a
10% (22.9 mg l-1) improvement in comparison with the production of lysozyme at a
higher inoculum:polymer ratio 1:4 (25% mycelium immobilized v/v) (20.3) with Ca-
pectate. The effect observed could be attributed to the increase biomass available to
bio-convert substrates and products.
It was noted that the treatments reaches different final pH levels had an impact on the
produced. The lysozyme concentration was maximum at pH 4.5, and a dramatic
reduction occurred as the pH increased up to 5. An optimal range of 4.0-5.0 was
reported for glucoamylase production in batch cultures of two different A. niger
isolates (Aguero et al., 1990). MacKenzie et al. (1994) reported an improvement that
the production of lysozyme was due to a reduction in medium acidification (sodium
acetate buffer pH 4.5). They reported an improvement in lysozyme production by A.
niger strain L11 when a pH 4.5 buffer was added to the fermentation medium.
Furthermore, maximum lysozyme production was reported at 4.5 with A. niger B1
(Mainwaring et al., 1999).
The main factors in the experiment: polymer type, concentration and
inoculum:polymer ratio had a marked effect on the water availability of the produced
beads. Ca-alginate at the same concentration of Ca-pectate had a much lower aw.
Thus, at 2% inoculum:polymer ratio level, Ca-alginate has an aw of 0.90 compared to
0.94 aw of Ca-pectate. The aw linear and quadratic terms were significant in the
statistical analysis.

Chapter V Immobilized Design for the Production of Heterologous Protein Lysozyme
92
The secondary analysis performed to separate the effect according to aw, pH blocked
by polymer type. Interestingly, the analysis showed that the most significant term was
the aw. Polymer type, pH and interactions are no significant terms. This is the first
time, to our knowledge, that the aw of immobilized cell fermentation aw is considered
as an important parameter in the production of heterologous proteins. Interestingly,
the water availability for the production of lysozyme is different to that for optimal
growth (0.96 aw) (Parra and Magan, 2004; Parra et al., 2004a). The water activity
coupled with the polymer type in the beads may change the homologous and
heterologous protein expression resulting in different levels of lysozyme production.
5.4.2 Comparison between immobilized and free cells
Immobilized cells shows various modifications in physiology and biochemical
composition when compared to suspended cells. Altered morphological forms as well
as higher or lower metabolic activity, growth rates and product concentrations have
been detected (Yadwad et al., 1996). The production of lysozyme produced in
immobilized cell fermentations resulted in much higher concentration than in free cell
fermentations by A. niger. The maximal lysozyme concentration achieved in free cell
fermentations was 15.2 mg l-1 (Parra et al., 2004b). Under the optimized immobilized
cell conditions the production of lysozyme was 22.0 mg l-1 and represent a 46 %
increase in the total lysozyme production in a free cell fermentation.
It could be that immobilization of the fungal cells leads to changes in their
microenvironment (Shreve and Vogel, 1993). Immobilized cells produce various
advantageous modifications in physiological and biochemical composition when
compared to suspended cells (Hilge-Rotmann and Rehm, 1990). For example the
activity level of the defence enzyme superoxide dismutase (SOD) against reactive
oxygen species, an important part of the cells’ defensive repertoire in immobilized
fungi, was reported to be 1.5-fold higher than free cells (Angelova et al., 2000).
For future work in improving the production of heterologous protein lysozyme, it is
recommended to scale-up the immobilized cell fermentation developed into a
Chapter V Immobilized Design for the Production of Heterologous Protein Lysozyme
93
bioreactor which permits higher mass transfer coefficients and assures pH monitoring
and control.
As far as known, there are no reports of heterologous lysozyme produced in a
optimized immobilized cell fermentation. The results strongly support the use of
immobilized cells in the lysozyme production. The optimization of the immobilized
cell fermentation not only improve the production under the experimental conditions
tested but also represents a 46 % higher concentrations than the achieved in previous
work with free cell fermentations.
The immobilization based on the properties solid bead succeed in finding optimal
conditions to improve production of heterologous protein lysozyme by the genetically
engineered A. niger B1. Statistical methods like polynomial models to evaluate
optimal conditions were useful for the optimization of lysozyme production by A.
niger. The effect of aw and pH are parameters important to take into account in the
scaling up of the biotechnological process with immobilized cell system for the
lysozyme production
Chapter VI Medium Optimization for the Production of Squalestatin S1 by Phoma sp.
94
CHAPTER VI
MEDIUM OPTIMIZATION FOR THE PRODUCTION OF THE SECONDARY METABOLITE SQUALESTATIN S1 BY A Phoma
sp. COMBINING ORTHOGONAL DESIGN AND REPONSE SURFACE METHODOLOGY
Submitted to Applied and Environmental Microbiology

Chapter VI Medium Optimization for the Production of Squalestatin S1 by Phoma sp.
95
6.1 INTRODUCTION
The treatment of hypercholesterolemia with pharmaceutical agents reduces the risk of
developing arteriosclerosis. Several therapies such as bile acid sequestrants or
cholesterol biosynthetic inhibitors are available. In the isoprenoid biosynthetic
pathway, the first step to the biosynthesis of cholesterol involves the dimerization of
farnesyl pyrophosphate to squalene. This step is catalyzed by squalene synthase and is
a potential drug target. Substrates analogous of the farnesyl pyrophosphate have been
synthesized and found to be inhibitors of this enzyme. Squalestatins are a potent
inhibitor of the squalene synthase (Blows et al., 1994). Among the various fungal
species that produce the family of squalestatins as secondary metabolites, a Phoma sp.
is particularly important for high concentration capacity (Baxter et al., 1998, Dawson
et al., 1991).
Some key intermediates of primary metabolism serve as branching points of
biosynthetic pathways leading to end products of primary and secondary metabolism.
Secondary metabolism is regulated by precursors, carbon sources, nitrogen sources,
phosphate, trace elements, induction of enzymes of secondary metabolism, catabolic
repression and inhibition, feed back repression and inhibition, and control by auto-
regulators (Betina, 1994).
The available cell precursor levels may regulate antibiotic/secondary metabolite
production, especially when the specific synthase is already active in the cells
(Sathosh et al., 1976). There are differences between the carbon sources for growth
and secondary metabolism. For example, glucose is usually an excellent source for
growth but may interfere with secondary metabolism. Glucose has also been shown to
interfere with the biosynthesis of actinomycin, benzodiazepine alkaloids,
cephalosporin, chlorotetracycline, enniantin, ergot alkaloids, erythromycin,
kanamycin, oleandomycin, penicillin, puromycin, tetracycline and tylosin (Demain et
al., 1992). The synthesis of pectinolytic enzymes is considerably influenced by the
glucose content of the cultivation medium containing mixed carbon sources in a
predetermined optimal ratio (Panda et al., 2004).

Chapter VI Medium Optimization for the Production of Squalestatin S1 by Phoma sp.
96
The effect of nitrogen sources on secondary metabolism is conditioned by several
factors including the type of metabolic pathway, the producing organism, the type and
concentration of the nitrogen sources and whether cultures are stationary or
submerged. Very often, secondary metabolic pathways are negatively affected by
nitrogen sources favourable for growth (Betina, 1994). Negative effects of ammonium
salts have been reported in the production of cephalosporine, penicillin, erythromycin,
tylosin, leucomycin, chloramphenicol, macbecin, rifamycin, streptomycin,
streptothricin and tetracycline (Demain, 1992).
It is known that several trace elements are essential for microbial growth because of
their involvement in metalloenzymes or as enzyme activators. In secondary
metabolism, zinc, iron and manganese are the most important trace elements. Several
reports have been published on the importance of these three elements in aflatoxin
production (Betina, 1994). It has been shown that zinc is an essential element for
aflatoxin biosynthesis. The omission of zinc resulted in no detectable versicolorin
production by a blocked mutant of Aspergillus parasiticus (Betina, 1994). Inorganic
phosphate is also known to exert a suppressive effect on the synthesis of many
secondary metabolites.
In developing a biotechnology-based industrial process, designing the fermentation
media is of critical importance. The fermentation medium affects the product
concentration and volumetric productivity. It is also important to reduce the cost of
the medium as much as possible, as this does affect the overall process economics.
Medium screening studies are very time consuming and expensive. This is because
the number of possible media combinations that can be tested and the number of
fermentation substrates that are available are also very large. Thus, for economy of
effort and scale different approaches have been used to rapidly identify the variables
which need to be controlled for optimising production of useful metabolites.
Traditional screening approaches are time consuming and involve testing each
medium component to examine which combination gives the best results. While this
is extensively used it is very time consuming (Furuhashi and Takagi, 1984). Others
have used mapping approaches to identify the optimization space. This enables a
better picture of the possible effects of each component in the medium. Orthogonal
and Plackett Burman designs are important methodologies that can reduce the number

Chapter VI Medium Optimization for the Production of Squalestatin S1 by Phoma sp.
97
of runs to an absolute minimum (Castro et al., 1992; Escamilla et al., 2000; Xu et al.,
2003). The main disadvantage of these designs is that they consider only first order
effects and ignore interactions. However, while a full factorial design (testing every
combination possible) provides the most complete information, they often require
such a large number of runs that they are impractical to carry out. Optimum
performance has been determined using mathematical tools such as multiple
regression of a partial or full factorial to obtain a model of the production system,
usually involving fitting of data to a polynomial equation, often using stepwise
multiple regression. Response surface methodology has also been used to investigate
the optimal regions of production of useful product (Papulla et al., 1992; White et al.,
1990). Detailed analyses of the optimized region using cetroidal or simple designs
have also been applied for optimization processes (White et al., 1990). However,
several interactions of the experimental design and optimization of models are
required for effective application to product formation in fermentation systems.
The purpose of this study was to optimize thirteen substrates, including those
reported in the literature, at three different levels in submerged fermentation to
produce squalestatin S1 by a Phoma species. This approach used a combination of
statistical strategies involving the use of an orthogonal design, response surfaces and
polynomial regression to find the best medium for maximising concentrations in a
free fermentation system.
6.2 MATERIALS AND METHODS
6.2.1 Fungal strains
Stock spore suspension of the Phoma sp. (IMI 332962) were maintained in 0.5-ml
cryogenic vials (Nalgene). The culture was maintained as aliquots of the spore
suspension. (1.6 x 10⁷ spores ml-1 ± 3%) with Tween 80 (100 µl l-1) and 5%(w/v)
glycerol stored at -70ºC (Connors et al., 1995). This was kindly supplied by
GlaxoSmithKline R & D, Medicines Research Centre, Stevenage, Herts SG1 2NY,
U.K.

Chapter VI Medium Optimization for the Production of Squalestatin S1 by Phoma sp.
98
6.2.2 Activation and strain inoculation
Thawed 500 µl cryogenic stock spore suspension vials (Nalgene) of Phoma sp. were
used. A 5 µl of the spore suspension was inoculated on glycerol-modified MEA
(0.98aw) Petri plates and incubated at 25oC (Baxter et al., 1998). a Humidat-IC II
apparatus (Novasina, Talstrasse, Switzerland) was used to check the aw level. Actively
growing 5-day-old cultures were harvested to produce the spore inoculum by pouring
10 ml of sterile Tween 80 (100 µl l-1) solution onto the glycerol-modified MEA
(0.98aw) growing cultures and the spores dislodged using a sterile microbiological
loop. Two ml of the extracted spore suspension were used to inoculate the 100 ml
liquid medium according to the experimental design. The cultures (in 250-ml conical
flasks) were incubated at 25 ºC on a shaker at 150 rev min-1 for 10 days.
6.2.3 Media composition
The medium composition was based on a combination of substrates: some reported in
the literature and some new ones. The medium design included simple substrates such
as a nitrogen source due to the importance of this element (C:N ratio) in secondary
metabolism and also trace elements (Mg2+ and Fe3+) (Table 6.1).
Table 6.2 presents the trace element concentration of a standard solution (TE) used to
add to the fermentation medium. The trace elements were prepared in a standard
solution and 10 ml used to make up 1 litre of solution.
6.2.4 Sample preparation and analyses for squalistatin S1
Sample preparation
The samples were prepared by placing 250 µl of the samples in 1 ml Eppendorf tubes
with lids (Sartorius) and adding 750 µl of extractive solvent described below. This
was mixed for 5 min. in a shaker at 250 rpm (L.H Engineering Co. Ltd, England) and
centrifuged in a Microcentaur (MSE) for 15 min. at 13,000 rps. The supernatant was
filtered through a 0.2 µm nylon syringe filter (BDH) and transferred to 2 ml HPLC
vials (Anachem) and sealed with septa (0.010” PTFE, Anachem) and lids (Anachem).
The samples were kept at -80 ºC and thawed before analysis. The reagents used in
HPLC analysis are: Extraction solvent 80% methyl-acetonitrile (MeCN) containing
Chapter VI Medium Optimization for the Production of Squalestatin S1 by Phoma sp.
99
H2SO4 (0.3 ml l-1) and mobile phase 50% MeCN containing H2SO4 (0.15 ml l-1). A
stock solution of 120 µm ml-1 squalestatin (S1) was prepared as a standard and kept
frozen at -80 ºC. Aliquots were thawed and diluted in the range of 0.012 -120 µm
ml-1 and placed in 2 ml HPLC vials. Dilutions of the samples were made if necessary.
HPLC system
A Gilson 715 HPLC system was used to quantify squalestatin (S1) from the
fermentation broth. Aliquots of 50 µl were automatically injected with a Gilson
231XL sampling injector onto a 5µl C6 Spherisob 150 x 4.6 mm column
(Phenomenex), with a guard column of the same material as the extractive column.
Separated metabolites were detected with a Gilson 117 UV detector at 210 nm.
Running conditions of the analysis were: 1 ml min-1, time 30 min per sample. The
concentration of S1 in the samples was analyzed against the standard and S1
standards were included randomly with the samples to detect changes in the retention
time of S1. The retention time of S1 was between 8-9 min.
6.2.5 Experimental design and data treatment
To investigate the relationship between substrate medium components and their
concentration to optimize the production of squalestatin S1 by the Phoma species, an
orthogonal design L27 (313) was used. The medium composition was selected
according to the experimental design. The combinations of substrate and
concentrations were selected using the experimental design module of Statistica 6.0
(SoftStat, Inc. 1984-2001, USA).
The levels of substrates were allocated under three categories: (1) low, (2) medium
and (3) high. The dummy variable of glucose in the experimental design was used as
the measure of experimental design variability. It gives a direct estimate of the
standard error of a factor effect.
For the analysis, the factors were given coded values between 1 (lowest concentration
of substrate) and 3 (highest concentration of substrate). For the response surface
methodology and the polynomial regression the coded values were changed as
follows -1=1, 0=2 and 1=3 and the analysis was performed with the experimental
design module of Statistica 6.0 (SoftStat, Inc. 1984-2001, USA).
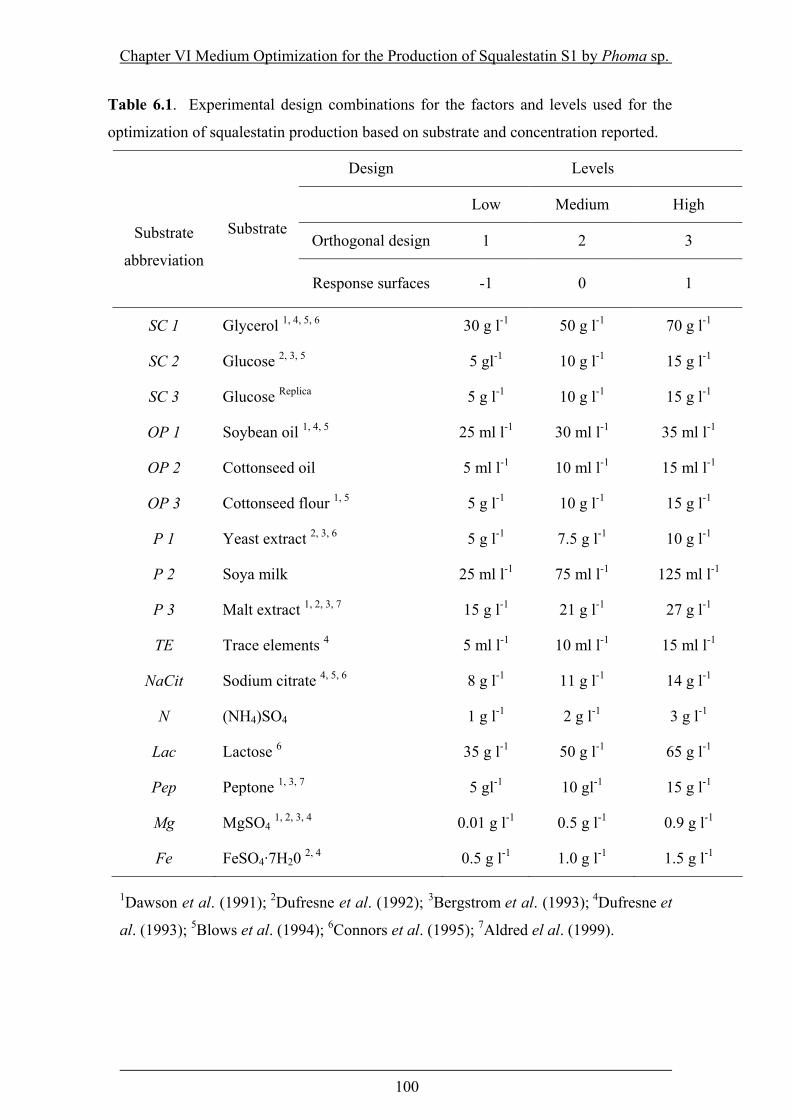
Chapter VI Medium Optimization for the Production of Squalestatin S1 by Phoma sp.
100
Table 6.1. Experimental design combinations for the factors and levels used for the
optimization of squalestatin production based on substrate and concentration reported.
Design Levels
Low Medium High
Orthogonal design 1 2 3 Substrate
abbreviation
Substrate
Response surfaces -1 0 1
SC 1 Glycerol 1, 4, 5, 6 30 g l-1 50 g l-1 70 g l-1
SC 2 Glucose 2, 3, 5 5 gl-1 10 g l-1 15 g l-1
SC 3 Glucose Replica 5 g l-1 10 g l-1 15 g l-1
OP 1 Soybean oil 1, 4, 5 25 ml l-1 30 ml l-1 35 ml l-1
OP 2 Cottonseed oil 5 ml l-1 10 ml l-1 15 ml l-1
OP 3 Cottonseed flour 1, 5 5 g l-1 10 g l-1 15 g l-1
P 1 Yeast extract 2, 3, 6 5 g l-1 7.5 g l-1 10 g l-1
P 2 Soya milk 25 ml l-1 75 ml l-1 125 ml l-1
P 3 Malt extract 1, 2, 3, 7 15 g l-1 21 g l-1 27 g l-1
TE Trace elements 4 5 ml l-1 10 ml l-1 15 ml l-1
NaCit Sodium citrate 4, 5, 6 8 g l-1 11 g l-1 14 g l-1
N (NH4)SO4 1 g l-1 2 g l-1 3 g l-1
Lac Lactose 6 35 g l-1 50 g l-1 65 g l-1
Pep Peptone 1, 3, 7 5 gl-1 10 gl-1 15 g l-1
Mg MgSO4 1, 2, 3, 4 0.01 g l-1 0.5 g l-1 0.9 g l-1
Fe FeSO4·7H20 2, 4 0.5 g l-1 1.0 g l-1 1.5 g l-1
1Dawson et al. (1991); 2Dufresne et al. (1992); 3Bergstrom et al. (1993); 4Dufresne et
al. (1993); 5Blows et al. (1994); 6Connors et al. (1995); 7Aldred el al. (1999).

Chapter VI Medium Optimization for the Production of Squalestatin S1 by Phoma sp.
101
Table 6.2. The trace elements solution was made with 10 ml l-1 as reported by
Dufresne et al. (1992).
*Trace elements mixture (TE) Litre
MnSO4·4H20 1.0g
CuCl2·2H2O 0.025g
CaCl2·2H2O 0.1g
H3BO3 0.056g
(NH4)6MoO24·24H20 0.019g
ZnSO4·7H20 0.2g
Adjust pH 7
Chapter VI Medium Optimization for the Production of Squalestatin S1 by Phoma sp.
102
6.3 RESULTS
6.3.1 Effect of medium constituents on the S1 production
Table 6.3 summarises the S1 production obtained from the experiment and forecasted
by contour surfaces under the different treatment conditions. Overall, glucose as an
additional carbon source produced a higher S1 production in comparison with
glycerol. Levels of S1 with added glucose ranged from 0 to 273 mg l-1. Interestingly,
cottonseed flour gave the highest S1 production.
Table 6.4 shows the analysis of variance (ANOVA) of the results after the fifth day of
fermentation with an orthogonal design analysis. These indicated that S1 production
could be enhanced using a combination of solutes at different concentrations in the
fermentation medium. The levels of sources of carbon (LSC), oily precursors (OP),
nitrogen (N) and peptone (Pep) were the most significant factors in the production of
S1 (P<0.001) followed by precursors (P) and trace elements (TE) (P<0.05).
Using the orthogonal design L27 (313) approach the relationships between medium
component variables and their concentrations on S1 production could be calculated.
The factors could be ranked by importance (magnitude in parentheses). They were:
levels of carbon sources (LSC=43.621) > nitrogen (N=41.782) >
precursors (P=38.663) > levels of precursors (LOP=31.455) > trace elements
(TE=29.289) > Oily precursor (OP=28.526) > peptone (Pep=25.271) > levels of
precursors (LP =23.393) > sodium citrate (NaCit=18.949) > iron (Fe=18.768) >
sources of carbon (SC=15.934) > magnesium (Mg= 2.702) > lactose (Lac=0.948).
This pointed to the sources of carbon levels, nitrogen and precursors being the most
important factors in the production of S1. Lactose was the least important nutrient.
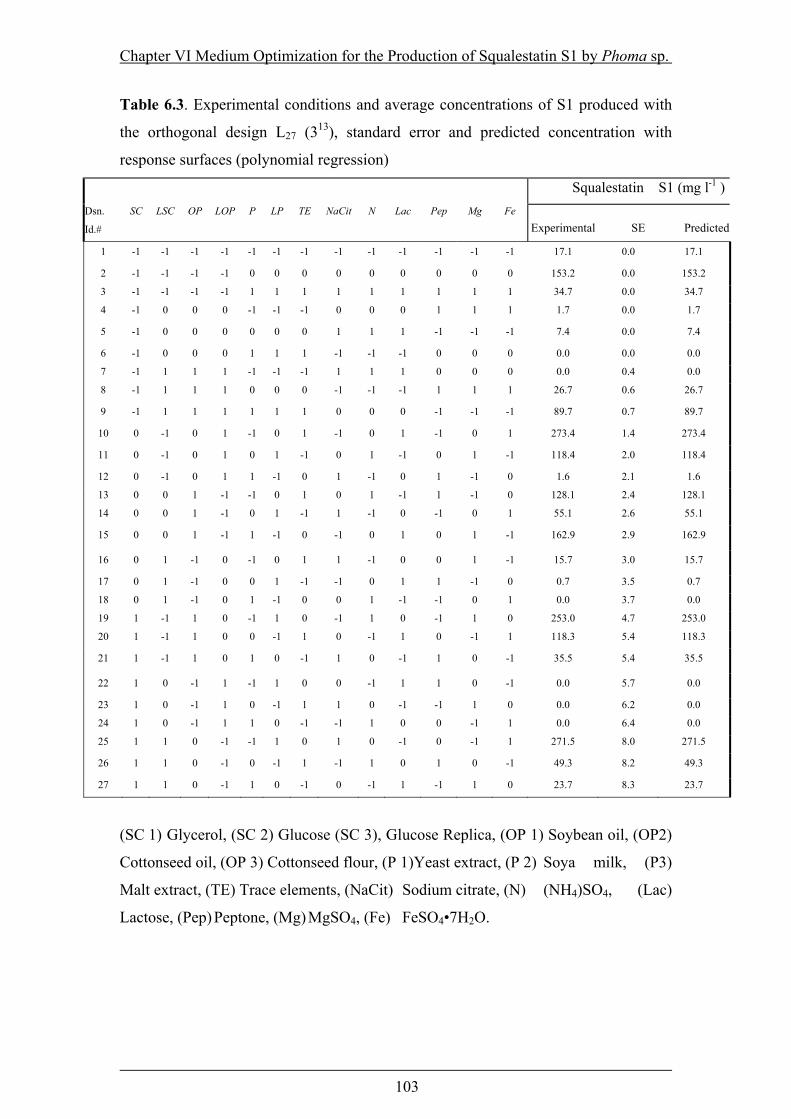
Chapter VI Medium Optimization for the Production of Squalestatin S1 by Phoma sp.
103
Table 6.3. Experimental conditions and average concentrations of S1 produced with
the orthogonal design L27 (313), standard error and predicted concentration with
response surfaces (polynomial regression)
Squalestatin S1 (mg l-1 )Dsn.
Id.#
SC LSC OP LOP P LP TE NaCit N Lac Pep Mg Fe Experimental SE Predicted
1 -1 -1 -1 -1 -1 -1 -1 -1 -1 -1 -1 -1 -1 17.1 0.0 17.1
2 -1 -1 -1 -1 0 0 0 0 0 0 0 0 0 153.2 0.0 153.2
3 -1 -1 -1 -1 1 1 1 1 1 1 1 1 1 34.7 0.0 34.7
4 -1 0 0 0 -1 -1 -1 0 0 0 1 1 1 1.7 0.0 1.7
5 -1 0 0 0 0 0 0 1 1 1 -1 -1 -1 7.4 0.0 7.4
6 -1 0 0 0 1 1 1 -1 -1 -1 0 0 0 0.0 0.0 0.0
7 -1 1 1 1 -1 -1 -1 1 1 1 0 0 0 0.0 0.4 0.0
8 -1 1 1 1 0 0 0 -1 -1 -1 1 1 1 26.7 0.6 26.7
9 -1 1 1 1 1 1 1 0 0 0 -1 -1 -1 89.7 0.7 89.7
10 0 -1 0 1 -1 0 1 -1 0 1 -1 0 1 273.4 1.4 273.4
11 0 -1 0 1 0 1 -1 0 1 -1 0 1 -1 118.4 2.0 118.4
12 0 -1 0 1 1 -1 0 1 -1 0 1 -1 0 1.6 2.1 1.6
13 0 0 1 -1 -1 0 1 0 1 -1 1 -1 0 128.1 2.4 128.1
14 0 0 1 -1 0 1 -1 1 -1 0 -1 0 1 55.1 2.6 55.1
15 0 0 1 -1 1 -1 0 -1 0 1 0 1 -1 162.9 2.9 162.9
16 0 1 -1 0 -1 0 1 1 -1 0 0 1 -1 15.7 3.0 15.7
17 0 1 -1 0 0 1 -1 -1 0 1 1 -1 0 0.7 3.5 0.7
18 0 1 -1 0 1 -1 0 0 1 -1 -1 0 1 0.0 3.7 0.0
19 1 -1 1 0 -1 1 0 -1 1 0 -1 1 0 253.0 4.7 253.0
20 1 -1 1 0 0 -1 1 0 -1 1 0 -1 1 118.3 5.4 118.3
21 1 -1 1 0 1 0 -1 1 0 -1 1 0 -1 35.5 5.4 35.5
22 1 0 -1 1 -1 1 0 0 -1 1 1 0 -1 0.0 5.7 0.0
23 1 0 -1 1 0 -1 1 1 0 -1 -1 1 0 0.0 6.2 0.0
24 1 0 -1 1 1 0 -1 -1 1 0 0 -1 1 0.0 6.4 0.0
25 1 1 0 -1 -1 1 0 1 0 -1 0 -1 1 271.5 8.0 271.5
26 1 1 0 -1 0 -1 1 -1 1 0 1 0 -1 49.3 8.2 49.3
27 1 1 0 -1 1 0 -1 0 -1 1 -1 1 0 23.7 8.3 23.7
(SC 1) Glycerol, (SC 2) Glucose (SC 3), Glucose Replica, (OP 1) Soybean oil, (OP2)
Cottonseed oil, (OP 3) Cottonseed flour, (P 1)Yeast extract, (P 2) Soya milk, (P3)
Malt extract, (TE) Trace elements, (NaCit) Sodium citrate, (N) (NH4)SO4, (Lac)
Lactose, (Pep) Peptone, (Mg) MgSO4, (Fe) FeSO4•7H2O.
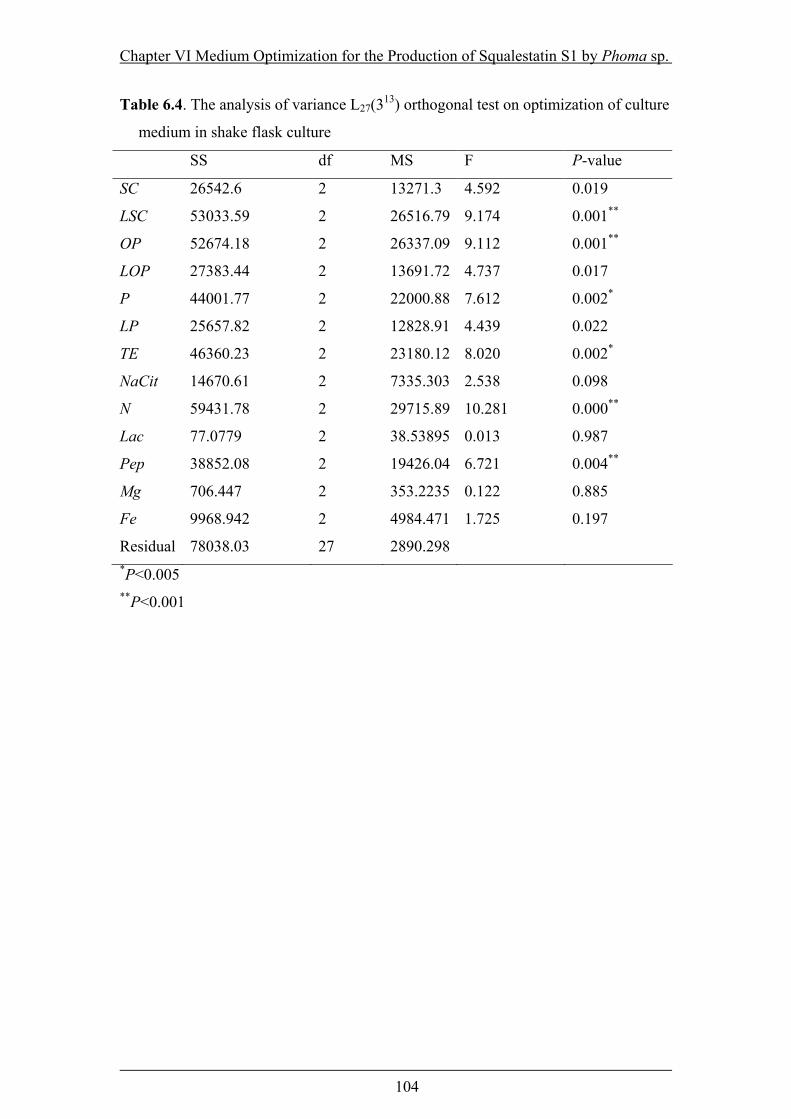
Chapter VI Medium Optimization for the Production of Squalestatin S1 by Phoma sp.
104
Table 6.4. The analysis of variance L27(313) orthogonal test on optimization of culture
medium in shake flask culture
SS df MS F P-value
SC 26542.6 2 13271.3 4.592 0.019
LSC 53033.59 2 26516.79 9.174 0.001**
OP 52674.18 2 26337.09 9.112 0.001**
LOP 27383.44 2 13691.72 4.737 0.017
P 44001.77 2 22000.88 7.612 0.002*
LP 25657.82 2 12828.91 4.439 0.022
TE 46360.23 2 23180.12 8.020 0.002*
NaCit 14670.61 2 7335.303 2.538 0.098
N 59431.78 2 29715.89 10.281 0.000**
Lac 77.0779 2 38.53895 0.013 0.987
Pep 38852.08 2 19426.04 6.721 0.004**
Mg 706.447 2 353.2235 0.122 0.885
Fe 9968.942 2 4984.471 1.725 0.197
Residual 78038.03 27 2890.298 *P<0.005 **P<0.001

Chapter VI Medium Optimization for the Production of Squalestatin S1 by Phoma sp.
105
Table 6.5 presents the optimal combination of substrates and concentrations to
achieve the highest concentration of S1. A search was carried out to identify the
optimum components for maximising concentration. The expected concentration of
S1 that this optimization could produce was 387 mg l-1. Thus an improvement of 42%
could be obtained with the optimization from the highest concentration (273 mg l-1)
achieved in the experiment.
Figure 6.1 presents a graphical analysis based on the effect of the average production
of squalestatin S1 under the sets of conditions and levels tested in the present study.
The optimal conditions can be easily selected from the factors with the highest levels
of production. This describes the important factors in determining S1 production and
shows the effect of changing treatment levels on production.
In order to find interactions and optima between factors a re-codification of the
experimental design according to response surface methodology was performed. A
first order polynomial model with interactions was selected. The robustness and
reproducibility of the experiment is confirmed by Figure 6.2 as the surface response is
uniform.
6.3.2 Model development
The analysis of the model produced an R2 of over 99% and overall model significance
of P<0.0001. The model from the analysis consisted of an intercept, 13 main factor
terms, 11 interaction terms and interception terms, thus including a total of 25 terms.
The effect of factors, standard error, P-values and 95% confidence levels of parameter
variability (parameter certainty) are presented in Table 6.6. The effects are ranked by
P-values from the most to the least significant. In the polynomial analysis S1
concentration was shown to be affected principally by the interaction between level of
carbon sources, oily precursor levels and type (P<0.000001).
Chapter VI Medium Optimization for the Production of Squalestatin S1 by Phoma sp.
106
The model expressed in Eq. (6.1) was generated with coded factors (X) between -1 to
+1, to predict the S1 production.
+ 184.3-69.4- 124.7154.1 + 238.7 LPPOPLSCLOPOPSC ××− ΧΧΧ+ΧΧ=)mgl(1S 1
+ 196.9+ 204.9+ 253.4+ 172.4+ 223.8 NSCPSCNaCitLSCLOPNaCit ××× ΧΧΧΧΧ
- 71.5+ 77.2+ 136.2+ 60.0+ 193.0- 106.5 TELacPepOPLSCLPSCLOP ΧΧΧΧΧΧ ××
10.7- 13.6- 32.8- 69.9- 18.2- 53.0- 98.7 OPMgSCFeNPepSCMgSC ΧΧΧΧΧΧΧ ××
LSCSC0.6 ×Χ+ (Eq. 6.1)
The concentration of S1 had a high correlation coefficient (R2=0.99) with the
predicted values presented previously in Table 6.3. Analyses of the observed versus
predicted concentrations are shown in Figure 6.3. Points above or below the diagonal
line represent areas of over or under prediction. This showed that no significant
violations of the model were found in the analysis, with a good correlation of the
model with the experimental data obtained.
Illustrations of the critical effects and interactions between factors are shown in the
form of contour graph plots in Figure 6.4. The contour diagrams which represent the
production of S1 (mg l-1) as a function of substrate type or concentration of two
nutrients, with the other factors being at constant levels. This shows the
reproducibility and robustness of the polynomial model based on the experimental
data.
To determine the most adequate operating conditions and analyze the process for
concentration, the contour diagrams were plotted using Eq. (6.1) for all the
combinations possible. Over all conditions glucose was the best sources of carbon
used (see Figure 6.4). However, the optimal conditions for a combined substrate with
the sources of carbon was different. The best substrate combinations for the sources of
carbon was glucose. Optimum oily precursor (OP) was cottonseed flour (1) gave
concentrations of 180-190 mg l-1 S1 production (Figure 6.4a).
Chapter VI Medium Optimization for the Production of Squalestatin S1 by Phoma sp.
107
For nitrogen addition, to obtain maximum S1 concentration, an intermediate values
(2.0 g l-1) on the contour surfaces produced 160-170 mg l-1 S1 (Figure 6.4b). A
narrow region of optimal conditions was found at the trace elements level 0 (10 ml l-1)
with levels of 160-170 mg l-1 S1 production (Figure 6.4c). Optimal peptone
concentration conditions were around the centre point (8.5 g l-1) (Figure 6.4 d)
producing S1 in the range 160-170 mg l-1.
Similar results were found with oily precursors and interaction with other substrates.
Overall the oily precursor (1), cottonseed flour, was the best producer of S1 in
combination with: trace elements (0) 10 ml l-1 (180 mg l-1 S1) (Figure 6.5 a), peptone
(0) 5 g l-1 (180 mg l-1 S1) (Figure 6.5 (b)), nitrogen (0) 2 g l-1 (170 mg l-1 S1) (Figure
6.5c) and precursor (-1) yeast extract (240 mg l-1 S1). The interaction between
cottonseed flour and yeast extract produced a remarkably high concentration of 240
mg l-1 (Figure 6.5d).
Overall, trace elements at level 0 (10 ml l-1) was optimal for production of S1
concentration in combination with: nitrogen (0) 2 g l-1 (160 mg l-1 S1) (Figure 6.6a),
peptone (0) 5 g l-1 (160 mg l-1 S1) (Figure 6.6c). No interaction was found between
peptone and nitrogen and the optimal concentrations were peptone (0) 5 g l-1 and
nitrogen (0) 2 g l-1 with levels of 160 mg l-1 S1 (Figure 6.6b). However, a significant
interaction between iron and trace elements produced a concentration of 190 mg l-1 S1
(Figure 6.6d).
To confirm the optimal conditions (Table 6.5) a set of four replicate experiments with
the optimal combinations of substrates and concentrations were used as confirmatory
to the forecasted production of S1. The confirmatory experiments produced 434 mg l-1
of S1. This represented a concentration 12% higher than the forecasted amount (387
mg l-1). This medium resulted in 24% more than the highest concentration of
squalestatin reported in the literature of 350 mg l-1 (Bergstrom et al., 1993) (Figure
6.7).This represented a productivity twice as high as the highest value reported in the
literature (Figure 6.8).

Chapter VI Medium Optimization for the Production of Squalestatin S1 by Phoma sp.
108
Table 6.5. Optimal medium design for the production squalestatin S1 and forecasted
production.
Terms Substrates Levels
SC Glucose
LSC 1 2.5 g l-1
OP Cottonseed flour
LOP 1 2.5 g l-1
P Yeast extract
LP 3 5 g l-1
TE Trace elements 5 ml l-1
NaCit Sodium citrate 4 g l-1
N (NH4)SO4 1 g l-1
Lac Lactose 32.5 g l-1
Pep Peptone 5 g l-1
Mg MgSO4 0.45 g l-1
Fe FeSO4·7H20 0.15 g l-1
Expected Squalestatins S1 387 mg l-1

Chapter VI Medium Optimization for the Production of Squalestatin S1 by Phoma sp.
109
Figure 6.1.Graphical analysis of the relationship between media formulation and
squalestatin S1 production. Each factor had three coded levels and the (○) represent
mean squalestatin S1 produced. The factors levels coded are: low (1), medium (2) and
high (3) as presented in Table 6.1.
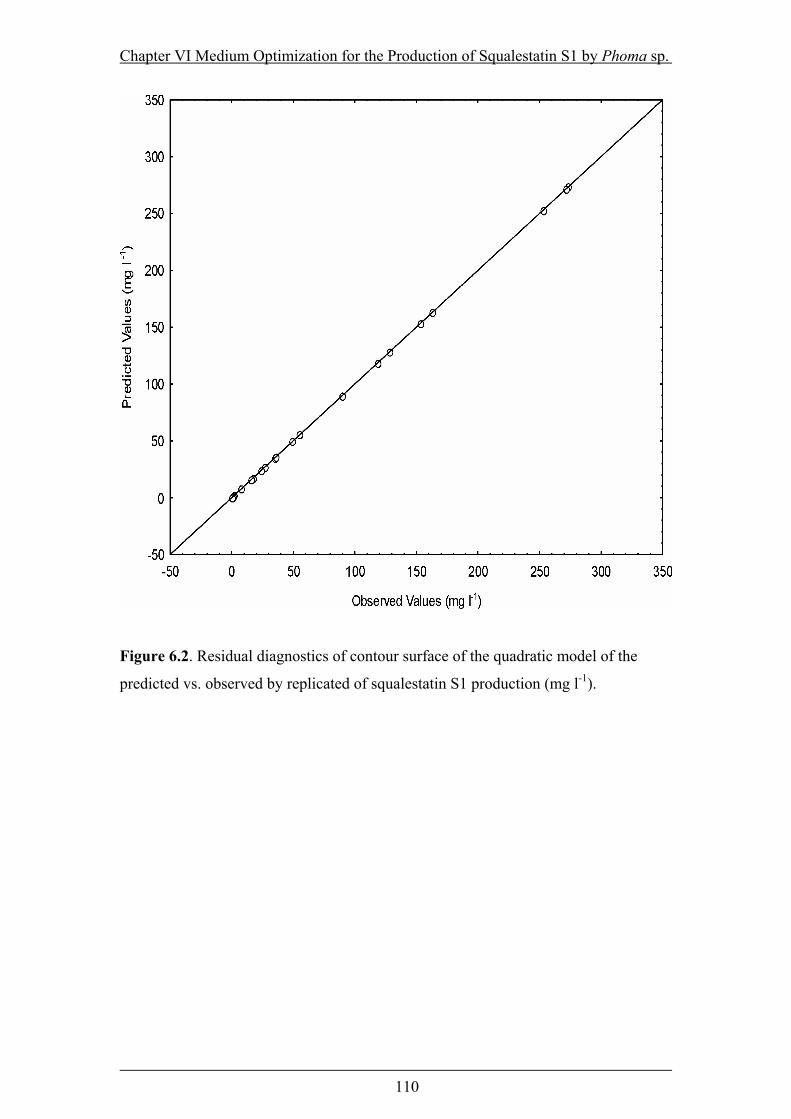
Chapter VI Medium Optimization for the Production of Squalestatin S1 by Phoma sp.
110
Figure 6.2. Residual diagnostics of contour surface of the quadratic model of the
predicted vs. observed by replicated of squalestatin S1 production (mg l-1).
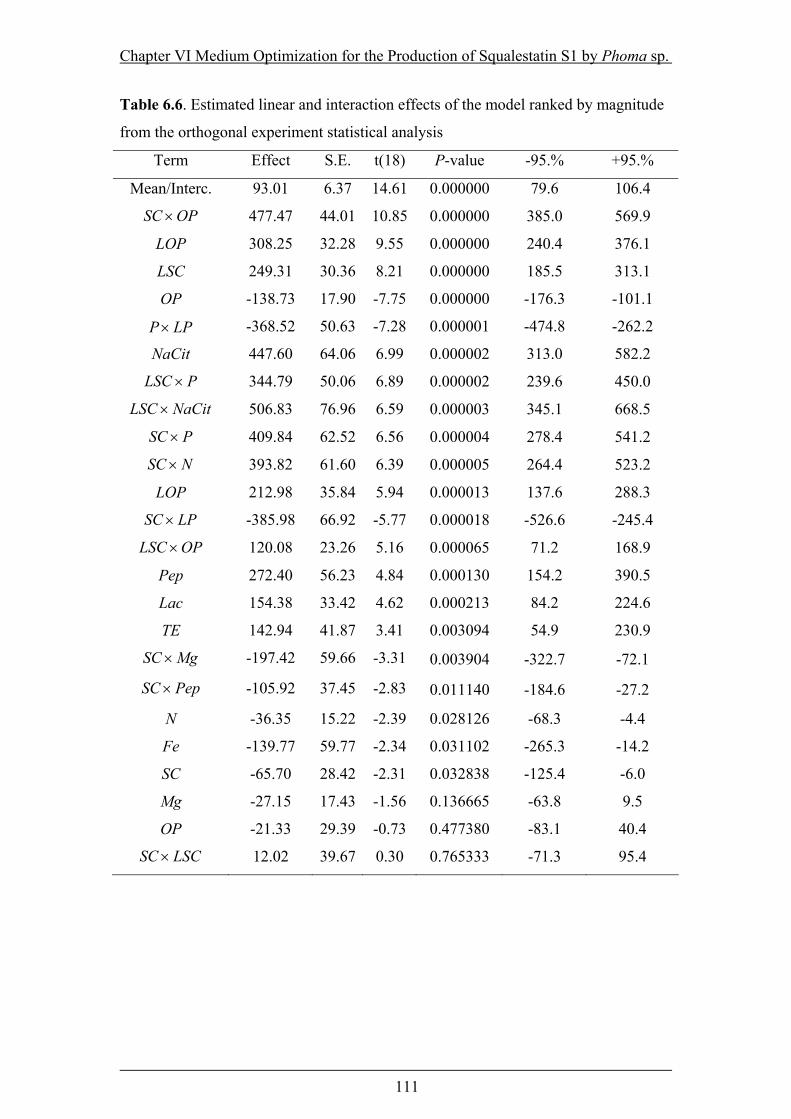
Chapter VI Medium Optimization for the Production of Squalestatin S1 by Phoma sp.
111
Table 6.6. Estimated linear and interaction effects of the model ranked by magnitude
from the orthogonal experiment statistical analysis
Term Effect S.E. t(18) P-value -95.% +95.%
Mean/Interc. 93.01 6.37 14.61 0.000000 79.6 106.4
OPSC × 477.47 44.01 10.85 0.000000 385.0 569.9
LOP 308.25 32.28 9.55 0.000000 240.4 376.1
LSC 249.31 30.36 8.21 0.000000 185.5 313.1
OP -138.73 17.90 -7.75 0.000000 -176.3 -101.1
LPP× -368.52 50.63 -7.28 0.000001 -474.8 -262.2
NaCit 447.60 64.06 6.99 0.000002 313.0 582.2
PLSC × 344.79 50.06 6.89 0.000002 239.6 450.0
NaCitLSC × 506.83 76.96 6.59 0.000003 345.1 668.5
PSC × 409.84 62.52 6.56 0.000004 278.4 541.2
NSC × 393.82 61.60 6.39 0.000005 264.4 523.2
LOP 212.98 35.84 5.94 0.000013 137.6 288.3
LPSC × -385.98 66.92 -5.77 0.000018 -526.6 -245.4
OPLSC × 120.08 23.26 5.16 0.000065 71.2 168.9
Pep 272.40 56.23 4.84 0.000130 154.2 390.5
Lac 154.38 33.42 4.62 0.000213 84.2 224.6
TE 142.94 41.87 3.41 0.003094 54.9 230.9
MgSC × -197.42 59.66 -3.31 0.003904 -322.7 -72.1
PepSC × -105.92 37.45 -2.83 0.011140 -184.6 -27.2
N -36.35 15.22 -2.39 0.028126 -68.3 -4.4
Fe -139.77 59.77 -2.34 0.031102 -265.3 -14.2
SC -65.70 28.42 -2.31 0.032838 -125.4 -6.0
Mg -27.15 17.43 -1.56 0.136665 -63.8 9.5
OP -21.33 29.39 -0.73 0.477380 -83.1 40.4
LSCSC × 12.02 39.67 0.30 0.765333 -71.3 95.4

Chapter VI Medium Optimization for the Production of Squalestatin S1 by Phoma sp.
112
Figure 6.3. Response surfaces fitted to the experimental data points corresponding to
the production of squalestatin S1 under different precursors (P) (-1=yeast extract,
0=soya milk and 1=malt extract) and glucose (0=glucose and 1=glucose replicated).
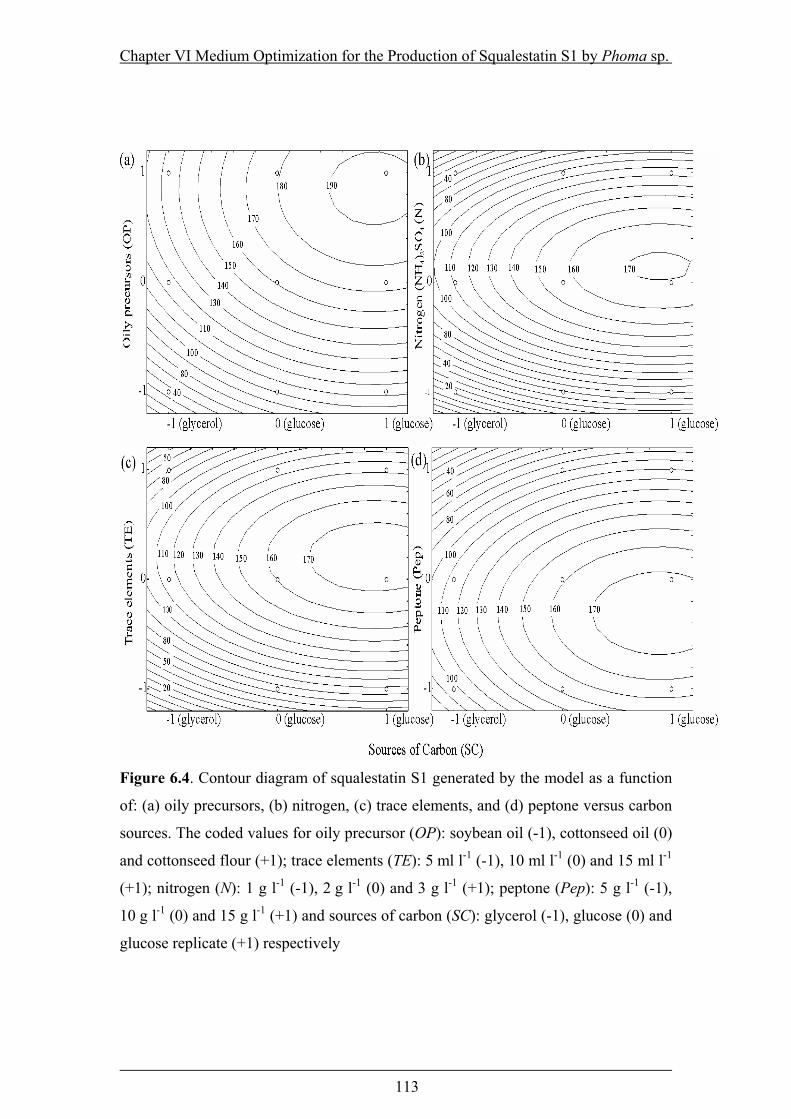
Chapter VI Medium Optimization for the Production of Squalestatin S1 by Phoma sp.
113
Figure 6.4. Contour diagram of squalestatin S1 generated by the model as a function
of: (a) oily precursors, (b) nitrogen, (c) trace elements, and (d) peptone versus carbon
sources. The coded values for oily precursor (OP): soybean oil (-1), cottonseed oil (0)
and cottonseed flour (+1); trace elements (TE): 5 ml l-1 (-1), 10 ml l-1 (0) and 15 ml l-1
(+1); nitrogen (N): 1 g l-1 (-1), 2 g l-1 (0) and 3 g l-1 (+1); peptone (Pep): 5 g l-1 (-1),
10 g l-1 (0) and 15 g l-1 (+1) and sources of carbon (SC): glycerol (-1), glucose (0) and
glucose replicate (+1) respectively
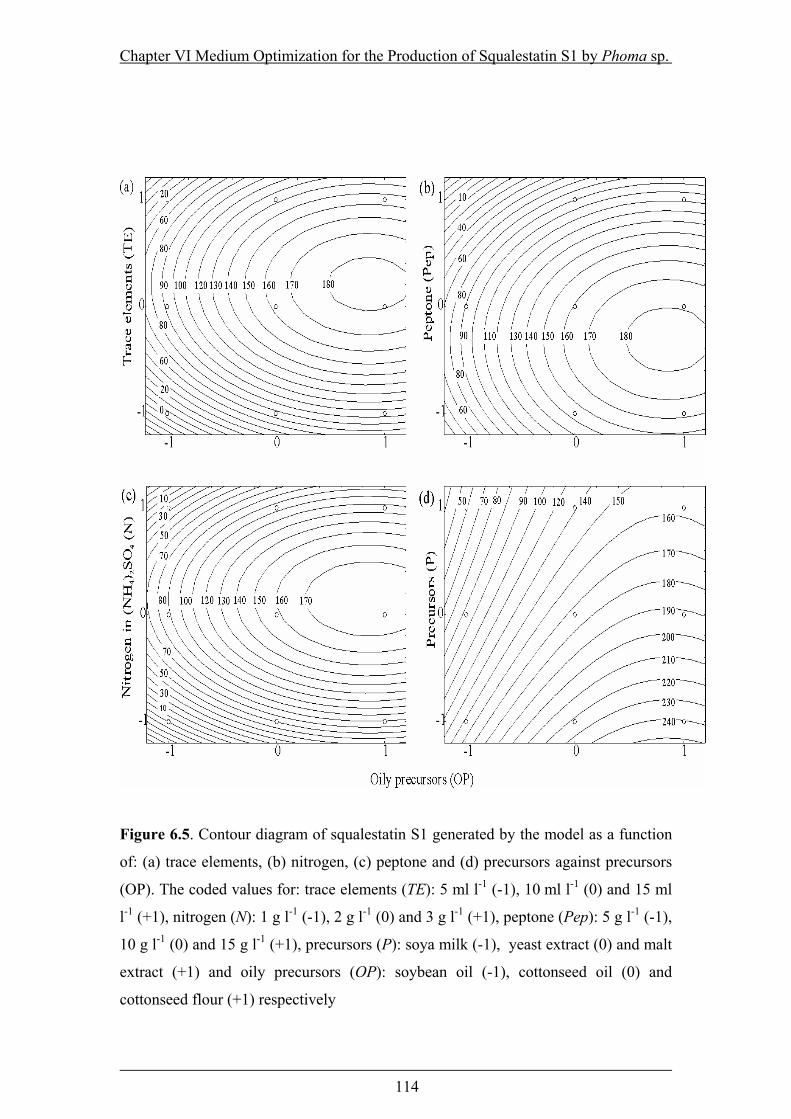
Chapter VI Medium Optimization for the Production of Squalestatin S1 by Phoma sp.
114
Figure 6.5. Contour diagram of squalestatin S1 generated by the model as a function
of: (a) trace elements, (b) nitrogen, (c) peptone and (d) precursors against precursors
(OP). The coded values for: trace elements (TE): 5 ml l-1 (-1), 10 ml l-1 (0) and 15 ml
l-1 (+1), nitrogen (N): 1 g l-1 (-1), 2 g l-1 (0) and 3 g l-1 (+1), peptone (Pep): 5 g l-1 (-1),
10 g l-1 (0) and 15 g l-1 (+1), precursors (P): soya milk (-1), yeast extract (0) and malt
extract (+1) and oily precursors (OP): soybean oil (-1), cottonseed oil (0) and
cottonseed flour (+1) respectively
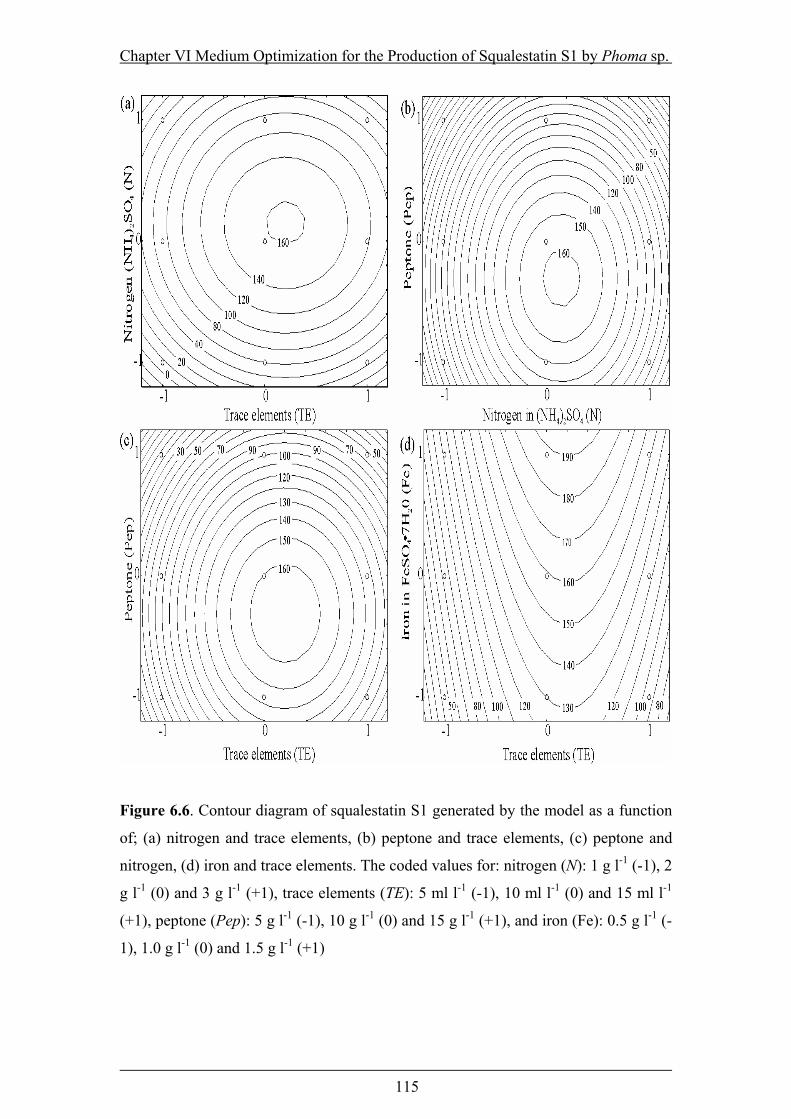
Chapter VI Medium Optimization for the Production of Squalestatin S1 by Phoma sp.
115
Figure 6.6. Contour diagram of squalestatin S1 generated by the model as a function
of; (a) nitrogen and trace elements, (b) peptone and trace elements, (c) peptone and
nitrogen, (d) iron and trace elements. The coded values for: nitrogen (N): 1 g l-1 (-1), 2
g l-1 (0) and 3 g l-1 (+1), trace elements (TE): 5 ml l-1 (-1), 10 ml l-1 (0) and 15 ml l-1
(+1), peptone (Pep): 5 g l-1 (-1), 10 g l-1 (0) and 15 g l-1 (+1), and iron (Fe): 0.5 g l-1 (-
1), 1.0 g l-1 (0) and 1.5 g l-1 (+1)

Chapter VI Medium Optimization for the Production of Squalestatin S1 by Phoma sp.
116
Figure 6.7. S1 concentrations reported in the literature for various species of fungi.
(References in brackets): A) Phoma sp. (Bergstrom et al. (1993)), B) ATCC 20986
(fungus) (Huang et al. (1992)), C) Curvularia lunata (Bergstrom et al. (1993)), D)
Exserohilum rostratum (Huang et al. (1992)), E) Drechslera bisoplata (Bergstrom et
al. (1993)), F) Phoma sp (Aldred et al. (1999)), G) Phoma sp. (Baxter et al. (1998)),
H) Phoma sp.(this work)
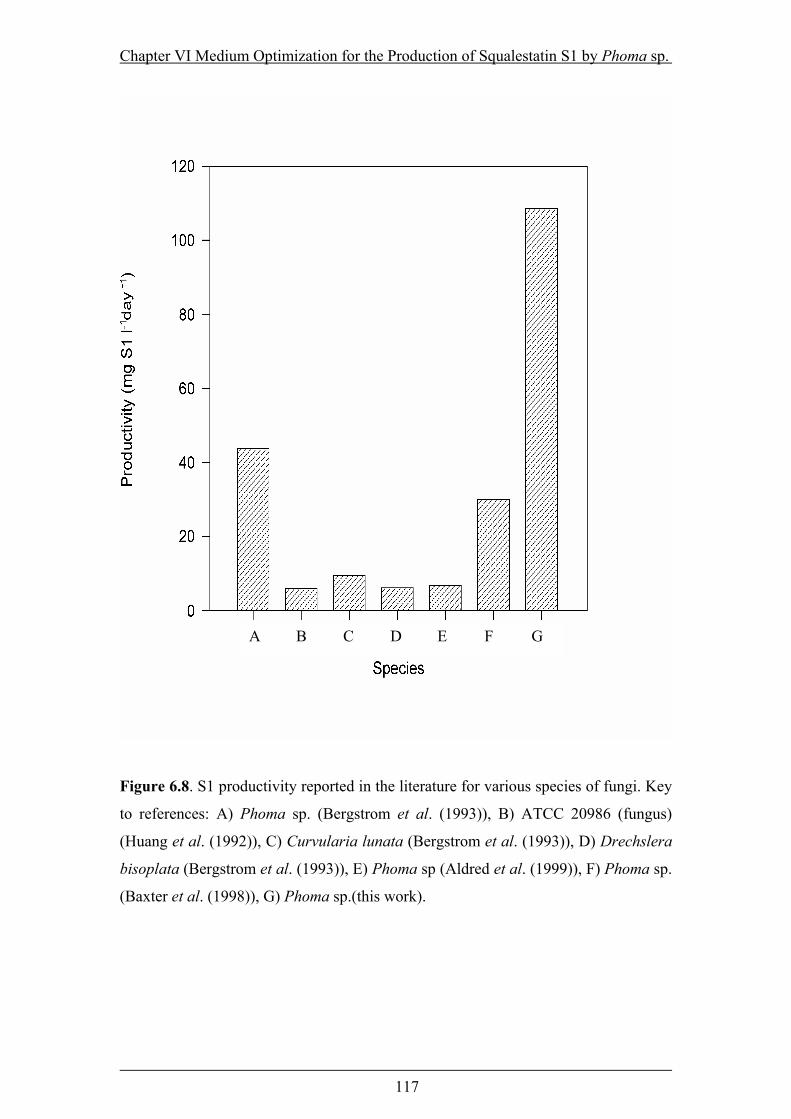
Chapter VI Medium Optimization for the Production of Squalestatin S1 by Phoma sp.
117
Figure 6.8. S1 productivity reported in the literature for various species of fungi. Key
to references: A) Phoma sp. (Bergstrom et al. (1993)), B) ATCC 20986 (fungus)
(Huang et al. (1992)), C) Curvularia lunata (Bergstrom et al. (1993)), D) Drechslera
bisoplata (Bergstrom et al. (1993)), E) Phoma sp (Aldred et al. (1999)), F) Phoma sp.
(Baxter et al. (1998)), G) Phoma sp.(this work).
A B C D E F G

Chapter VI Medium Optimization for the Production of Squalestatin S1 by Phoma sp.
118
6.4 DISCUSSION
To achieve the results obtained in this study using a full factorial design would have
required 313 x 2 replicates (3.2 x 10⁶) experiments taking into account all the variables
involved. However, by using the orthogonal matrix design, a significantly smaller
combination of factors and levels could be used for effectively examining the effect of
interacting factors on final concentration. Thus, with only 54 experiments an optimal
medium composition was found that represented a 42% increase in product
concentration compared to the non-optimized medium. The concentration of S1
achieved in this work of 387 mg l-1 represented a 24 % improvement when compared
to the highest reported in the literature (Bergstrom et al., 1993). Moreover a
considerable improvement in productivity (50%) was achieved because the new
medium was designed to achieve a more rapid S1 production with suitability for
industrial applications.
These kind of designs have been successfully applied to improving media formulation
for the production of primary and secondary metabolites in fermentation processes
(White et al., 1990; Lee et al., 1997; Escamilla et al., 2000; Li et al., 2001). For
example, concentrations of another cholesterol-lowering drug, lovastatin, produced by
Aspergillus terreus, was improved with Plackett-Burman screening factorial designs
(Lai et al., 2003). However, there are no reports of a combined orthogonal design and
contour surfaces methodology as far as we know, in the optimization of cholesterol
lowering drugs.
The combined statistical strategies of orthogonal design and surface response
succeeded in predicting the optimal condition and interactions between substrate type
and concentrations. This work demonstrated the efficacy of the combined
methodology achieving the maximum squalestatin S1 production reported in liquid
medium. It produced a rapid screening and reliable methodology for the optimization
of medium design. The contour surface methodology was a good tool to separate the
effect of interactions and to find the optimal conditions between two factors.
Evaluating the contour surface methodology provided a better understanding of the
interactions between the fermentation medium substrates and their effects on the
concentrations of S1. The R2 values of all parameters showed a good fit between the
Chapter VI Medium Optimization for the Production of Squalestatin S1 by Phoma sp.
119
model and the experimental data. Contour plots were useful to locate the optimal
points easily. This approach for medium optimization of S1 production by the Phoma
species using this combined approach has not been reported previously.
This work was also an attempt to demonstrate the applicability of the statistical design
to optimization of S1 production using a large number of medium combinations and
levels by including dummy factors to find reliability and robustness of the
experimental design. The use of a dummy factor is an in situ evaluation of the
reproducibility and robustness of the experiment. Thus, in the experiment we found
consistency of glucose and the glucose replicate. Glucose was a better substrate for
the production of squalestatin S1 in comparison with glycerol. However, only at low
concentrations did glucose produce high concentrations. This suggests that catabolic
repression of glucose occurs at higher levels (Pan and Xu, 2003). Thus, under optimal
conditions it was possible to surpass the highest squalestatin S1 concentration so far
reported in liquid fermentation.
Together, this leads to the conclusion that a combined strategy of orthogonal design
and contour surface methodology is an excellent means for fermentation medium
optimization in the production of pharmaceutical compounds and enzymes. From an
economic point of view the most important parameters for screening and optimizing
media for the production of pharmaceutical compounds are time and cost. The
combined strategies demonstrated advantages in comparison with traditional methods.
The precursor yeast extract, and the oily precursor cottonseed flour were very
important components of the medium for the production of squalestatins and this is in
agreement with previous reports (Bergstrom et al., 1993; Blow et al., 1994; Connors
et al., 1995; Dawson et al., 1991; Dufresne et al., 1992). Trace element, sodium
citrate, lactose concentration requirements were at levels similar to those in the
literature (Dufresne et al., 1992). However, the medium required the addition of
important new components such as nitrogen, magnesium and iron as part of the
improved medium for enhance S1 production. In addition to establishing optimal
fermentation medium composition for scale up, the present work makes it possible to
predict both concentrations and productivity under different conditions by means of
the contour surfaces and the polynomial model. This is useful not only for the
Chapter VI Medium Optimization for the Production of Squalestatin S1 by Phoma sp.
120
additional knowledge supplied about the process, but also for the potential in medium
engineering and evaluation under economic constrains of medium composition,
concentration and productivity. It is also possible to examine the economics of scale
up of the process from flask to bioreactor. Future work on scale-up of the squalestatin
S1 fermentation process in bioreactors will be evaluated to examine larger scale
production and the impact on concentration/productivity.
Chapter VII Design of a BC Bioreactor Based on kLa to Scale-up S1 Production
121
CHAPTER VII
DESIGN OF A BUBBLE COLUMN BIOREACTOR BASED ON THE VOLUMETRIC MASS TRANFER COEFFICIENT AND
SCALE UP OF SQUALESTATIN S1 PRODUCED BY Phoma sp.

Chapter VII Design of a BC Bioreactor Based on kLa to Scale-up S1 Production
122
7.1 INTODUCTION
The cholesterol lowering agent squalestatin produced by several fungal species has
attracted attention in recent years. It is considered an important active ingredient for
the poly-pill which prevents several deadly conditions, such as heart attacks. Among
the various species that produce squalestatins as secondary metabolites, Phoma sp. is
particularly important for its high concentrations of squalestatins (Dawson et al.,
1991; Baxter et al., 1998).
In the scale up process it is vital to investigate the type of bioreactor suitable
according to the physical and physiological requirements of the microorganism used
before starting further optimizations. In general, stirred tank reactors are the most
widely used bioreactors in the production of pharmaceutical compounds. This type of
reactor offers some advantages, such as independent control of mixing conditions and
aeration rate. The main disadvantages are the high energy consumption and high shear
stress affecting such fragile cells such as fungal mycelium. Bubble column bioreactors
(BC) are a good alternative to the stirred tank bioreactor (STR). The main advantages
of bubble column reactors include the relatively simple construction and absence of
mechanically moving parts enabling easy maintenance and low operating costs. With
regard to the internal flow and efficiency, they offer a large interfacial area and
transport rates, leading to excellent heat and mass transfer characteristics and more
suitable shear conditions for fungal growth and secondary metabolite/enzyme
production.
The objective of this study was to examine the effect of the liquid height and the
height-diameter (HD/Dr) ratios (11.1, 7.4 and 3.7) on the total volumetric mass
transfer coefficient, kLa, at different temperatures. The experimental data were also
compared with that reported in the literature for different geometries and
configurations. Once the optimal height-diameter (Hr/Dr) ratio was determined a
fermentation experiments were carried out in the bubble column bioreactors (BC) for
the production of squalestatin S1 by a Phoma sp.

Chapter VII Design of a BC Bioreactor Based on kLa to Scale-up S1 Production
123
7.2 MATERIALS AND METHODS
7.2.1 Volumetric mass transfer kLa experiment
These Figure 7.1 shows the configuration of the bubble column bioreactor designed
and used in experiments. Three bioreactors were set up in parallel to facilitate
replication (Figure 7.2). An inside diameter (Dr) of 0.07 m and heights (HL) of 0.26,
0.52 and 0.78 m were used to load 1, 2 and 3 litre volumes for the different
experimental runs. A sintered glass no 2 (Soham Scientific, United Kingdom) sparger
distributor was placed at the base of each column. The bubble column bioreactor had
a water jacket to keep the temperature constant. Water was circulated through the
jacket with a heating water bath and pump (Grant Instruments, Cambridge, UK) at
three set temperatures of 15, 25 and 30oC.
The liquid phase used in the experiments consisted of demineralised water. Air was
used as the gas phase. The sparger used was sintered glass plate No. 2. The airflow
into all columns was regulated by the use of rotameters set at different flow rates (2,
4, 6 and 8 l min-1), while nitrogen flow (used for stripping out the dissolved oxygen)
was controlled by a manually operated control valve. For the determination of gas
hold up, pressure taps were installed along the columns.
To determine the gas hold up, the gas flow rate in the columns was adjusted to the
desired value using the corresponding previously calibrated rotameter. Sufficient time
was allowed to achieve a steady state in each column after which the increase in
liquid pressure at the manometer was recorded.
The overall gas hold up ε in the bioreactor was determined by visual measurements
of the static liquid height HL and the aeration height HE. The gas hold up ε was
calculated from the following equation:
.H
HH
E
LE −=ε (Eq. 7.1)
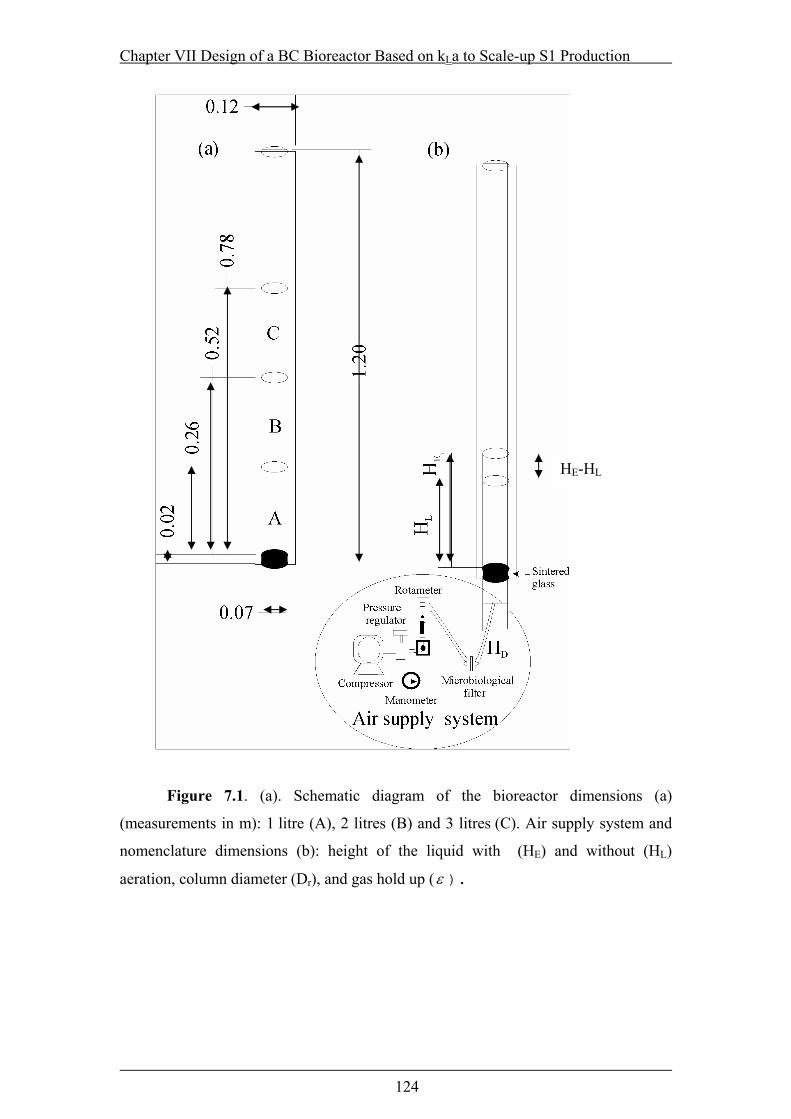
Chapter VII Design of a BC Bioreactor Based on kLa to Scale-up S1 Production
124
Figure 7.1. (a). Schematic diagram of the bioreactor dimensions (a)
(measurements in m): 1 litre (A), 2 litres (B) and 3 litres (C). Air supply system and
nomenclature dimensions (b): height of the liquid with (HE) and without (HL)
aeration, column diameter (Dr), and gas hold up (ε ).
HE-HL

Chapter VII Design of a BC Bioreactor Based on kLa to Scale-up S1 Production
125
Figure 7.2. Diagram of the bioreactor configuration and connections set.

Chapter VII Design of a BC Bioreactor Based on kLa to Scale-up S1 Production
126
The superficial gas velocity (U) as a function of the characteristics of the reactor was
calculated on the bases of the gas and liquid properties and the hydraulic conditions as
follows:
+=
h
LL
LL
m
PgH
1lngV
RTQU
ρρ
(Eq. 7.2)
Where Qm = air molar flow (kmol s-1), Ph = reactor head-space pressure (Pa), HL =
height of the liquid without aeration (m), g = acceleration due to gravity (m s-2),
ρL= water density (kg m-3), R = gas constant (8.134 J K-1 mol-1) and
T = temperature (K). The overall volumetric oxygen transfer coefficient kLa was
determined by the static gassing-in method (Bandyopadyay et al., 1967). A dissolved
oxygen probe was set at 0.2 m above the diffuser. The dissolved oxygen concentration
was measured by means of a polarographic dissolved-oxygen electrode (Thermo
Russell: PDOC122/30K/WP, Auchtermuchty, UK) with integral temperature
compensation connected to a dissolved-oxygen meter (Thermo Russell: RL425.
Auchtermuchty, United Kingdom). The oxygen electrode was placed in the bubble
column at a distance of 0.2 m above the gas distributor.
Firstly, the water was stripped of oxygen almost completely by the bubbling of pure
nitrogen through the distributor. When all the oxygen had been stripped out, air was
sparged into the column and the oxygen uptake into the liquid phase was monitored
continuously by means of the oxygen sensor. The total measurement time was long
enough to reach the oxygen saturation concentration, C*.
The concentration change of the dissolved oxygen was measured using an oxygen
meter. The kLa was calculated with reference to total reactor volume from the
following expression:
.CCCC
lnt1ak
L
0LL
−−
= ∗
∗
(Eq. 7.3)

Chapter VII Design of a BC Bioreactor Based on kLa to Scale-up S1 Production
127
where t is the time (s) and CL0 and CL are the initial oxygen concentration and the
concentration at different times. The volumetric mass transfer coefficient per unit
volume of liquid in the bubble column (kLa L) is calculated from the following
expression:
)1(aε−
= LLL
k ak (Eq. 7.4)
7.2.2 FERMENTATION
Fungal strains
See section 6.2.1
Activation and strain inoculation
See section 6.2.3
Media composition
See section 6.2.3
7.2.3 BIOREACTOR
The bubble column bioreactor (BCR) (Soham Scientific, United Kingdom) with the
geometric ratio HL/Dr= 3.7 equivalent to 1 l fermentation medium was loaded into the
BC. A sintered glass plate of porosity 30 µm and 10 mm thickness was used as aerator
in the columns. From the optimal kLa experiment the fermentations were performed at
the superficial gas velocity of U = 0.120 m s-1 and a process temperature of T = 25oC.
All reactors were equipped with sterilizable pH (PHT20) (Thermo Russell) and
oxygen (Bioengineering, Switzerland) probes, connected to a Bioengineering central
controller (Bioengineering, Switzerland) for on-line measurements. Oxygen partial
pressure measurements were measured by a polarographic electrode. Samples to
determine biomass and S1 concentration were taken from a sterile suction port.
Biomass was determined by filtering 4 ml onto filter paper (Whatman no. 2), dried in
an oven at 90oC and weighed.
Chapter VII Design of a BC Bioreactor Based on kLa to Scale-up S1 Production
128
7.2.4 ANALYSIS OF SQUALESTATIN S1 PRODUCITION
See section 6.2.4
7.3 RESULTS AND DISCUSSION
In our experiments, the diameter of the column (Dr) was 0.07 m and the heights of
liquid (HL) were 0.78 m, 0.52m and 0.26 m. The HL/Dr ratios were: 11.4, 7.4 and 3.7.
Figure 7.3 shows the relationship between gas hold up ε and superficial gas velocity
U. The gas hold up increased linearly as the superficial gas velocity increased. The
gas hold up ε was found to decrease slightly with the increase in the liquid height HL
due to increased liquid recirculation with increasing column height at the different
temperatures of the experiment (Figure 7.3 a, b, c). This result is in agreement with
various previously reported studies (Ruzicka et al., 2003; Ruzicka et al., 2001).
A number of investigators have studied the influence of HL/Dr on ε and kLa in
pneumatic bioreactors. Ruzicka et al. (2001) suggested that ε decreased as HL/Dr
increased. Chisti (1989) revealed that for solid-free liquid, the hold up declined
slightly with the height of split-cylinder bioreactors. The experiments of Weiland
(1984) were carried out using three different ratios HL/Dr of 12.8, 10.2 and 8.5. Their
optimal HL/Dr value was 10.2 at which there was a maximum value of ε .
No significant effect of the temperature on the hold up (ε ) was observed in the
experiment. However, the highest temperature of the experiment, 30oC, produced a
slightly higher hold up (0.105) in comparison to the other temperatures at the ratio
HL/Dr 3.4 at a high superficial gas velocity (0.120 m s-1). Interestingly, at the same
superficial gas velocity, with a ratio HL/Dr 7.4 and 25oC, a higher hold up was found
(0.111).
This change in the gas hold up is due to increased liquid recirculation with the
increase of the height of the column and the hydrostatic pressure (Krishan et al.,
1999). The effect of the rheological properties (viscosity and mixing) with the
increase of the ratio (HL/Dr) affects mass transfer rates, reducing the oxygen
concentration in the bulk.
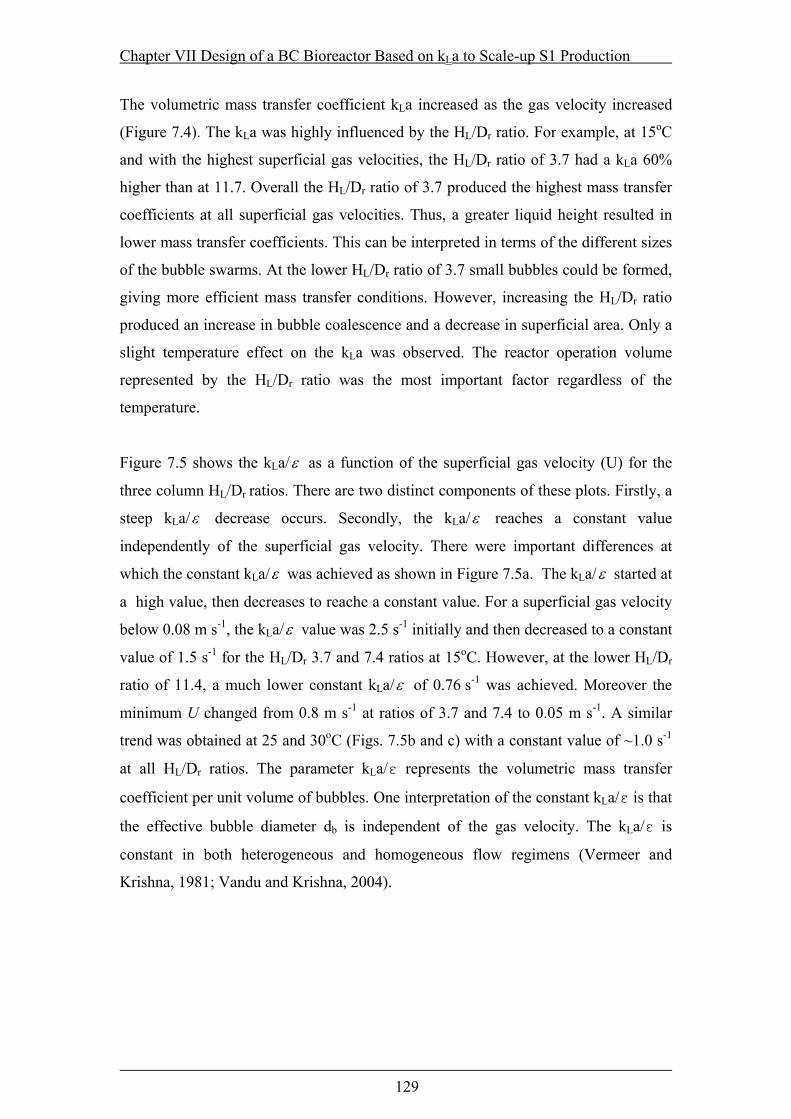
Chapter VII Design of a BC Bioreactor Based on kLa to Scale-up S1 Production
129
The volumetric mass transfer coefficient kLa increased as the gas velocity increased
(Figure 7.4). The kLa was highly influenced by the HL/Dr ratio. For example, at 15oC
and with the highest superficial gas velocities, the HL/Dr ratio of 3.7 had a kLa 60%
higher than at 11.7. Overall the HL/Dr ratio of 3.7 produced the highest mass transfer
coefficients at all superficial gas velocities. Thus, a greater liquid height resulted in
lower mass transfer coefficients. This can be interpreted in terms of the different sizes
of the bubble swarms. At the lower HL/Dr ratio of 3.7 small bubbles could be formed,
giving more efficient mass transfer conditions. However, increasing the HL/Dr ratio
produced an increase in bubble coalescence and a decrease in superficial area. Only a
slight temperature effect on the kLa was observed. The reactor operation volume
represented by the HL/Dr ratio was the most important factor regardless of the
temperature.
Figure 7.5 shows the kLa/ε as a function of the superficial gas velocity (U) for the
three column HL/Dr ratios. There are two distinct components of these plots. Firstly, a
steep kLa/ε decrease occurs. Secondly, the kLa/ε reaches a constant value
independently of the superficial gas velocity. There were important differences at
which the constant kLa/ε was achieved as shown in Figure 7.5a. The kLa/ε started at
a high value, then decreases to reache a constant value. For a superficial gas velocity
below 0.08 m s-1, the kLa/ε value was 2.5 s-1 initially and then decreased to a constant
value of 1.5 s-1 for the HL/Dr 3.7 and 7.4 ratios at 15oC. However, at the lower HL/Dr
ratio of 11.4, a much lower constant kLa/ε of 0.76 s-1 was achieved. Moreover the
minimum U changed from 0.8 m s-1 at ratios of 3.7 and 7.4 to 0.05 m s-1. A similar
trend was obtained at 25 and 30oC (Figs. 7.5b and c) with a constant value of ~1.0 s-1
at all HL/Dr ratios. The parameter kLa/ε represents the volumetric mass transfer
coefficient per unit volume of bubbles. One interpretation of the constant kLa/ε is that
the effective bubble diameter db is independent of the gas velocity. The kLa/ε is
constant in both heterogeneous and homogeneous flow regimens (Vermeer and
Krishna, 1981; Vandu and Krishna, 2004).

Chapter VII Design of a BC Bioreactor Based on kLa to Scale-up S1 Production
130
Figure 7.3. Gas hold up ε as a function of superficial gas velocity U, obtained in
three columns with height/diameter ratio (HL/Dr): 11.4 (◊), 7.4 (□) and 3.7 (∆) at three
different temperatures 15 oC (a), 25 oC (b) and 30oC (c).
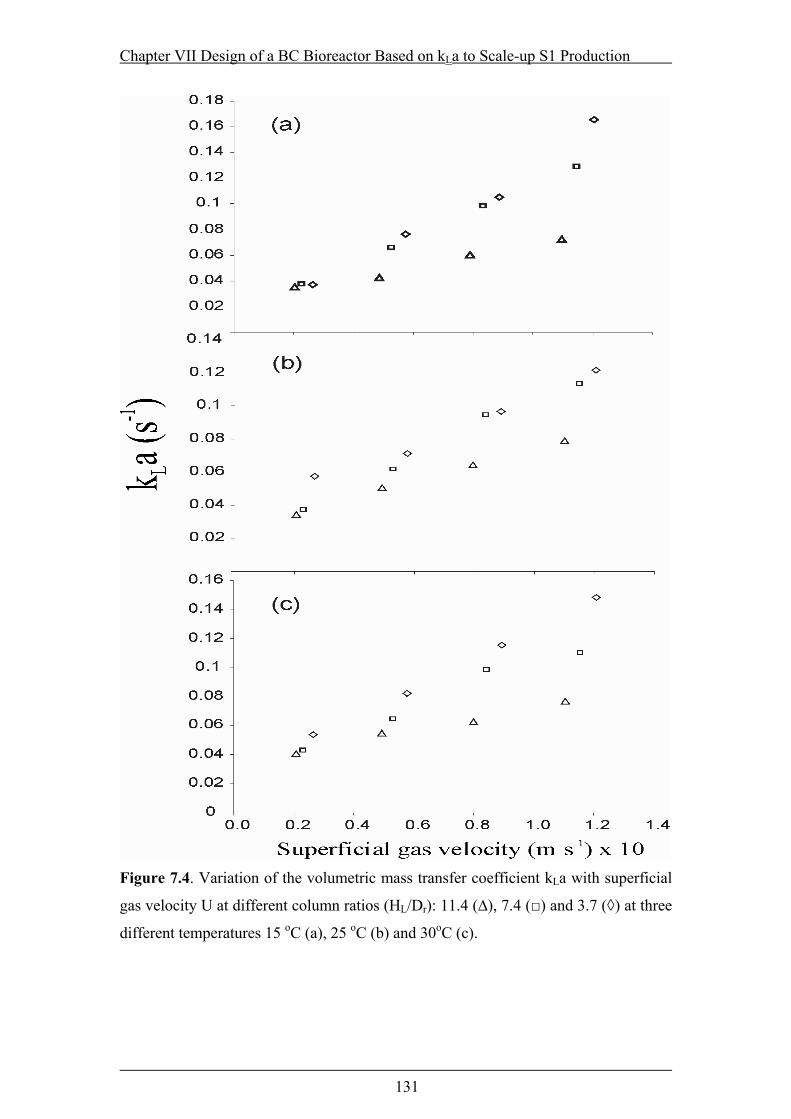
Chapter VII Design of a BC Bioreactor Based on kLa to Scale-up S1 Production
131
Figure 7.4. Variation of the volumetric mass transfer coefficient kLa with superficial
gas velocity U at different column ratios (HL/Dr): 11.4 (∆), 7.4 (□) and 3.7 (◊) at three
different temperatures 15 oC (a), 25 oC (b) and 30oC (c).
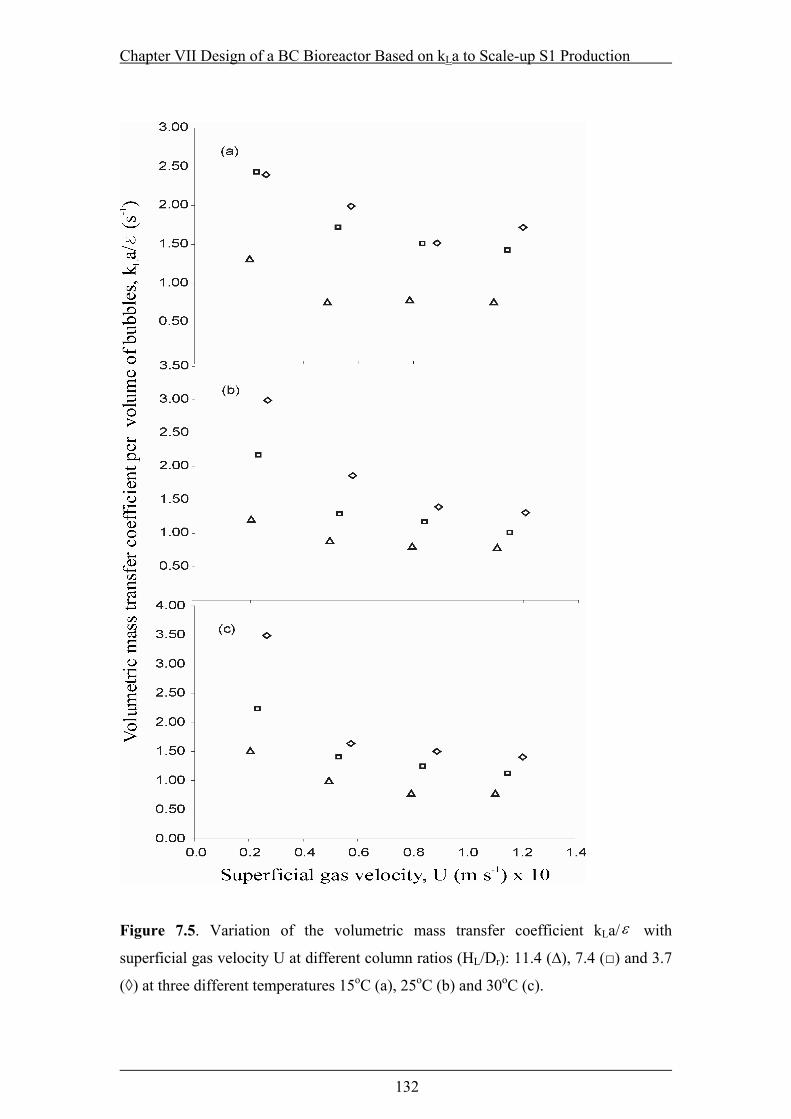
Chapter VII Design of a BC Bioreactor Based on kLa to Scale-up S1 Production
132
Figure 7.5. Variation of the volumetric mass transfer coefficient kLa/ε with
superficial gas velocity U at different column ratios (HL/Dr): 11.4 (∆), 7.4 (□) and 3.7
(◊) at three different temperatures 15oC (a), 25oC (b) and 30oC (c).

Chapter VII Design of a BC Bioreactor Based on kLa to Scale-up S1 Production
133
Figure 7.6 shows the effect of the HL/Dr ratio on the kLa at different superficial gas
velocities. Regardless of the temperature an excellent volumetric mass transfer
coefficient was achieved at high flow rates (1.3 x 10⁻⁴, 1.0 x 10⁻⁴ m3 s-1). The kLa
difference within the range of temperatures was only 0.0086 s-1 with the HL/Dr ratio of
11.4 at 15oC. In contrast, significant differences (kLa ; 0.0372 s-1) were found between
the maximal and minimal flow rates. The effect of the HL/Dr ratio on the kLa was not
observed at the lowest superficial gas velocities. This result points to the importance
of the high superficial gas velocities needed in a bubble column in order to gain a
efficient mass transfer coefficient under the set geometry. The HL/Dr ratios of 3.7 and
7.4 represent the best options for optimal mass transfer. At 25oC no significant
differences were observed between these HL/Dr ratios. Figure 7.7 shows the linear
relationship between the hold up and the power consumption (PG/VL). The curves for
the different ratios (HL/Dr) related to the power consumption and the gas hold up are
similar. Previously, Chisti (1989) reported no effect of the liquid height on gas hold
up. The commonly used volumetric mass transfer coefficient per unit volume of (gas
+ liquid) dispersion against the power consumption is shown in Figure 7.8. The
increase of kLa was directly related to the power consumption (exponentially).
Interestingly, at low temperatures a higher kLa was achieved under the different
geometric ratios and with a similar power consumption. This result points out the
effect of oxygen solubility at lower temperatures and the mixing effect related to the
viscosity as a function of temperature and shear stress. The HL/Dr ratio of 11.7 under
similar power consumption led to a more static and viscous medium, causing lower
mass transfer coefficients. No differences were found between the geometric ratios
3.7 and 7.4 at 15 and 25oC. This result could be interpreted as the influence of the
column hydrodynamics on the rheological properties of the liquid, which is influenced
by the volume of liquid. An increase in the liquid volume caused a reduction of mass
transfer under the same superficial gas velocities. Overall, superficial gas velocities
and temperatures and a HL/Dr ratio of 3.7 produced a better mass transfer in
comparison with higher ratios of 7.4 and 11.7. Chisti (1989) reported no influence of
the liquid height in a bubble column (HL) on the kLaL in any fluid. In the present study
no influence was found between the ratios 3.7 and 7.4. However a (HL/Dr) ratio of
11.4 showed significant differences. This result emphasizes the importance of
selecting a suitable HL/Dr ratio in the scale up process.
Chapter VII Design of a BC Bioreactor Based on kLa to Scale-up S1 Production
134
Figure 7.6. Effect of HL/Dr on the kLa under different average superficial gas
velocities U x 102 (m s-1): 12 (○), 8.4 (∆), 5.3 (□) and 2.3 (◊)
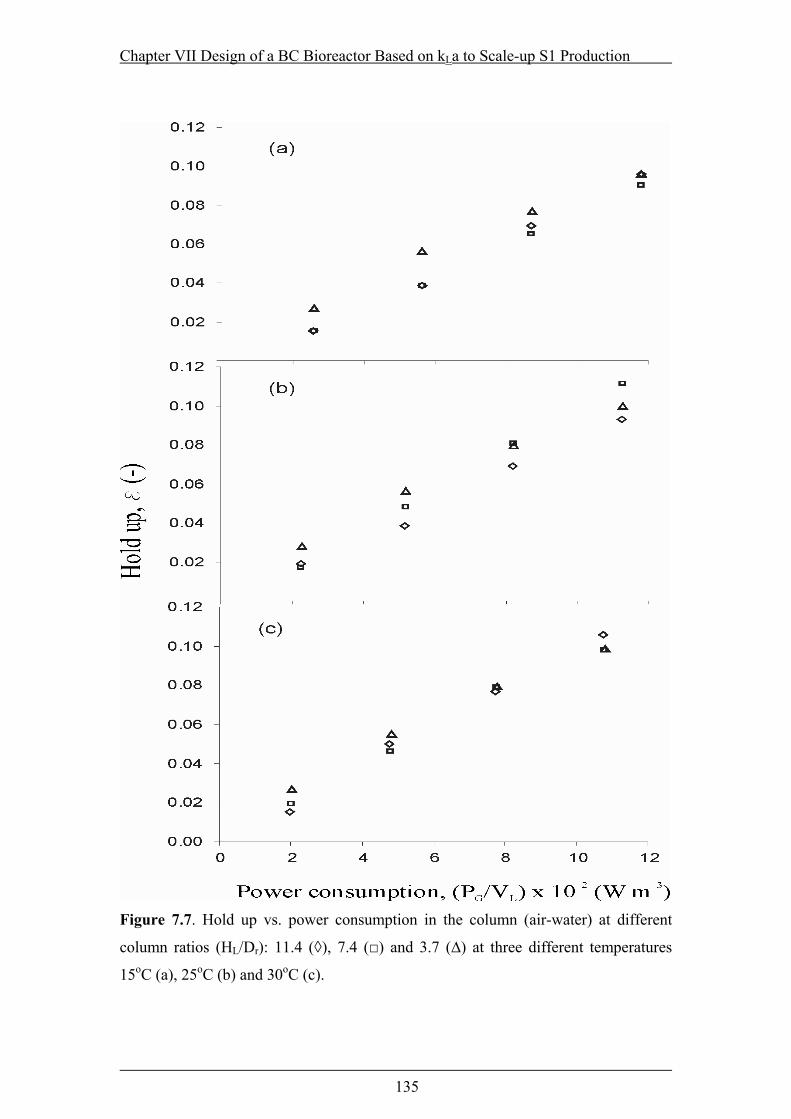
Chapter VII Design of a BC Bioreactor Based on kLa to Scale-up S1 Production
135
Figure 7.7. Hold up vs. power consumption in the column (air-water) at different
column ratios (HL/Dr): 11.4 (◊), 7.4 (□) and 3.7 (∆) at three different temperatures
15oC (a), 25oC (b) and 30oC (c).
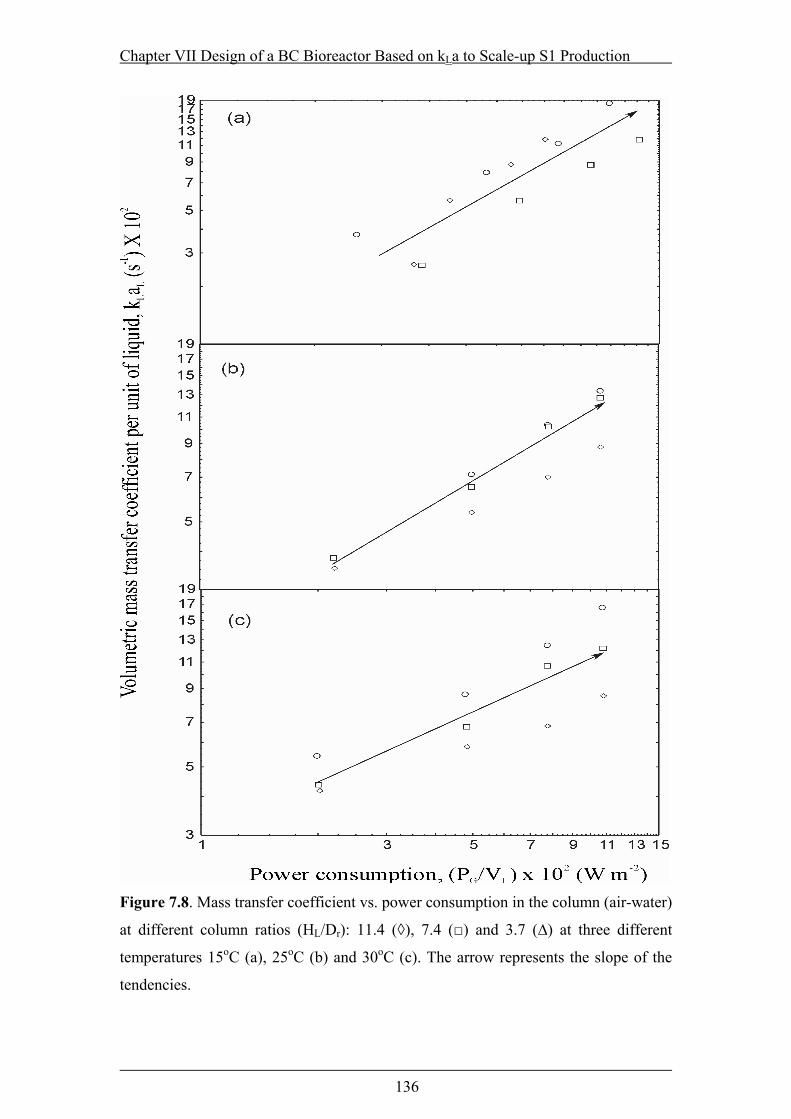
Chapter VII Design of a BC Bioreactor Based on kLa to Scale-up S1 Production
136
Figure 7.8. Mass transfer coefficient vs. power consumption in the column (air-water)
at different column ratios (HL/Dr): 11.4 (◊), 7.4 (□) and 3.7 (∆) at three different
temperatures 15oC (a), 25oC (b) and 30oC (c). The arrow represents the slope of the
tendencies.
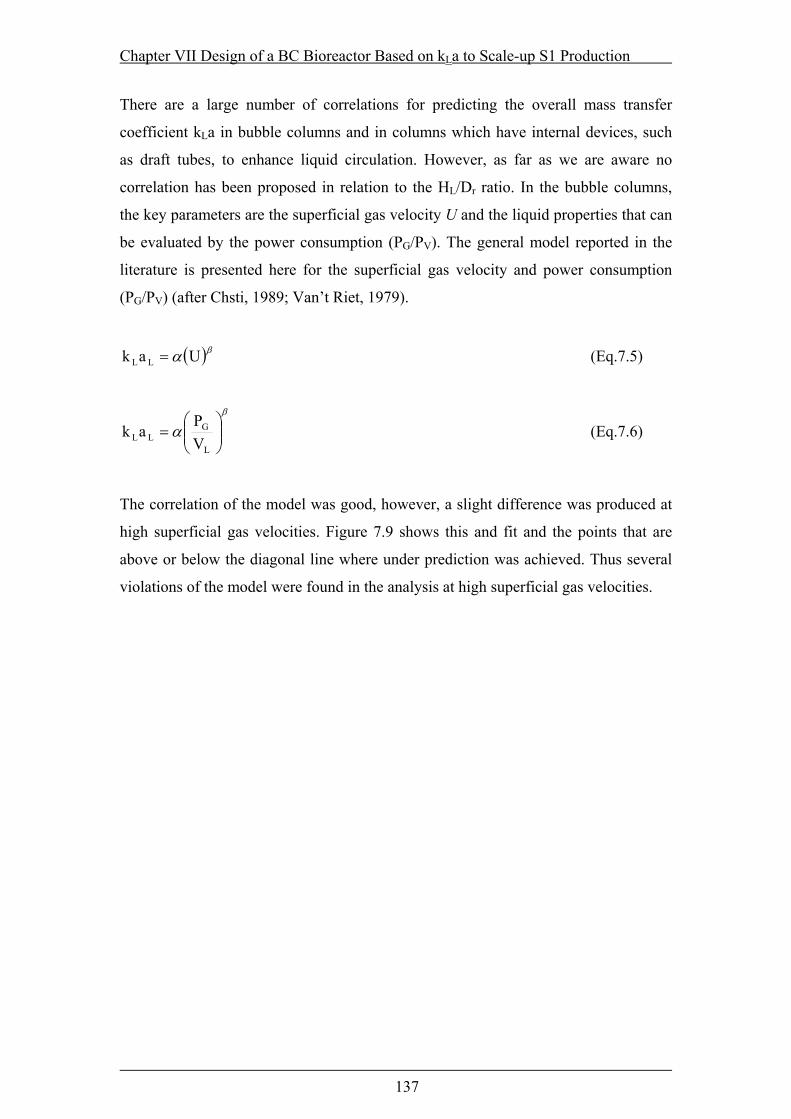
Chapter VII Design of a BC Bioreactor Based on kLa to Scale-up S1 Production
137
There are a large number of correlations for predicting the overall mass transfer
coefficient kLa in bubble columns and in columns which have internal devices, such
as draft tubes, to enhance liquid circulation. However, as far as we are aware no
correlation has been proposed in relation to the HL/Dr ratio. In the bubble columns,
the key parameters are the superficial gas velocity U and the liquid properties that can
be evaluated by the power consumption (PG/PV). The general model reported in the
literature is presented here for the superficial gas velocity and power consumption
(PG/PV) (after Chsti, 1989; Van’t Riet, 1979).
( )βα Uak LL = (Eq.7.5)
β
α
=
L
GLL V
Pak (Eq.7.6)
The correlation of the model was good, however, a slight difference was produced at
high superficial gas velocities. Figure 7.9 shows this and fit and the points that are
above or below the diagonal line where under prediction was achieved. Thus several
violations of the model were found in the analysis at high superficial gas velocities.
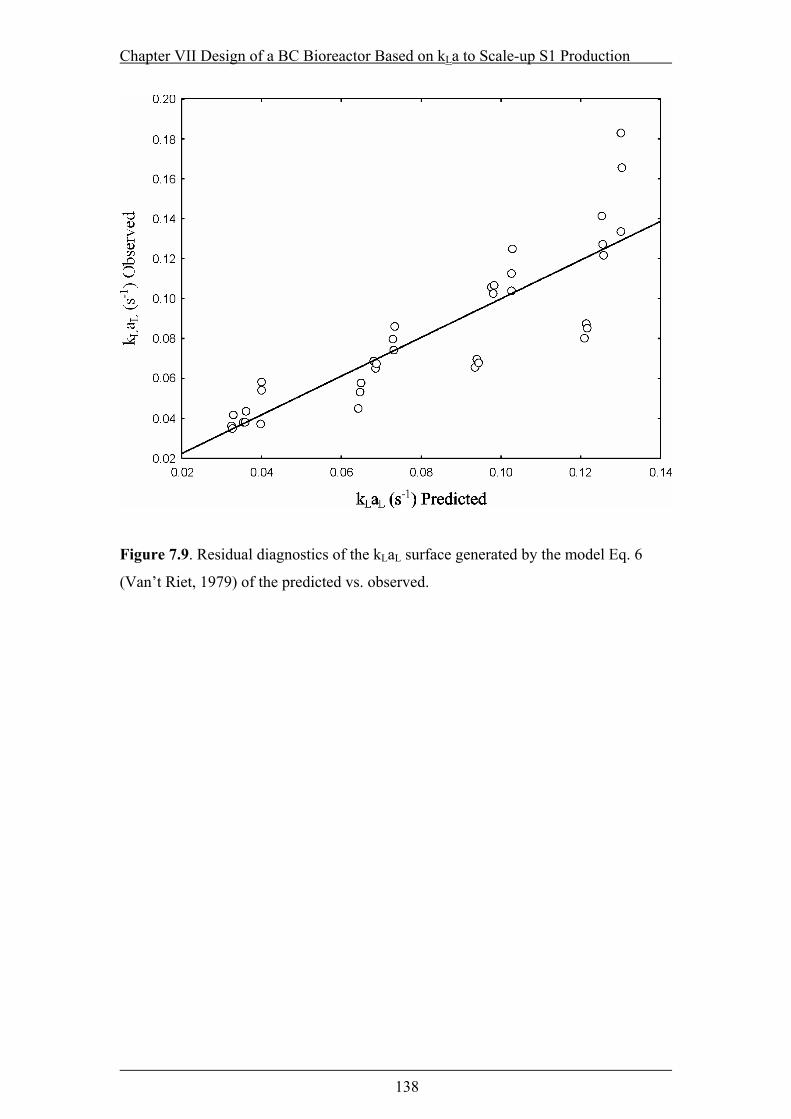
Chapter VII Design of a BC Bioreactor Based on kLa to Scale-up S1 Production
138
Figure 7.9. Residual diagnostics of the kLaL surface generated by the model Eq. 6
(Van’t Riet, 1979) of the predicted vs. observed.
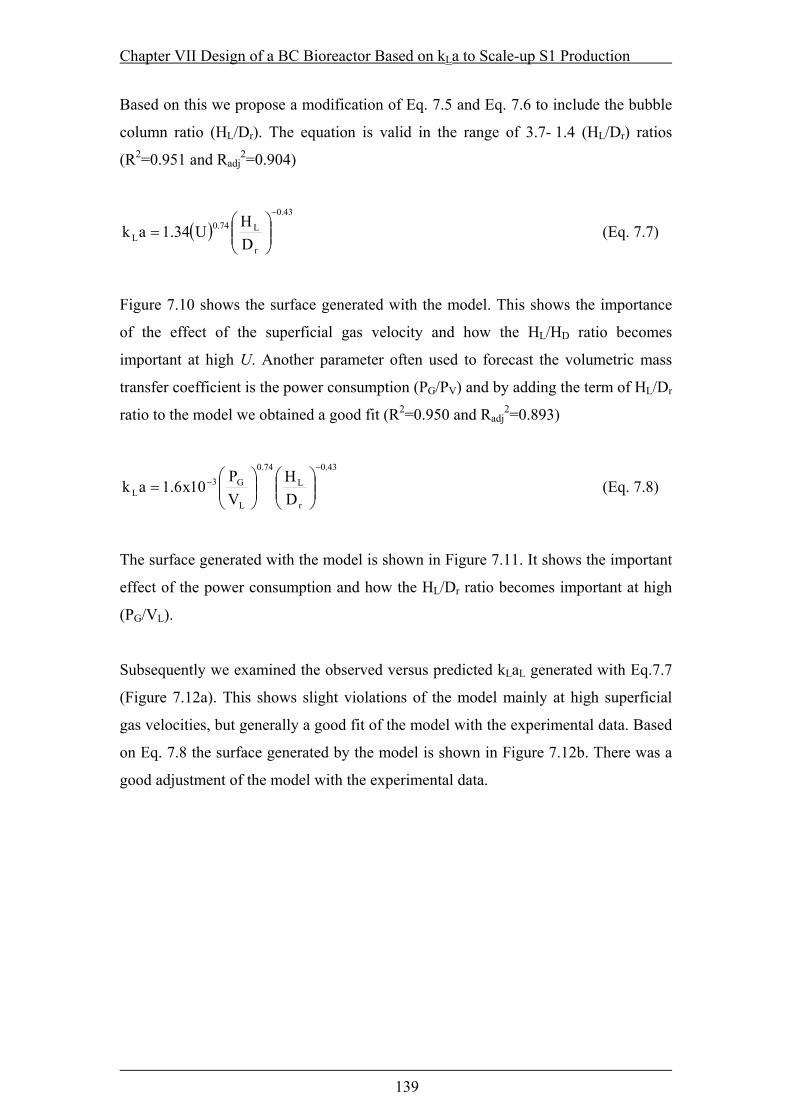
Chapter VII Design of a BC Bioreactor Based on kLa to Scale-up S1 Production
139
Based on this we propose a modification of Eq. 7.5 and Eq. 7.6 to include the bubble
column ratio (HL/Dr). The equation is valid in the range of 3.7- 1.4 (HL/Dr) ratios
(R2=0.951 and Radj2=0.904)
( )43.0
r
L74.0L D
HU34.1ak−
= (Eq. 7.7)
Figure 7.10 shows the surface generated with the model. This shows the importance
of the effect of the superficial gas velocity and how the HL/HD ratio becomes
important at high U. Another parameter often used to forecast the volumetric mass
transfer coefficient is the power consumption (PG/PV) and by adding the term of HL/Dr
ratio to the model we obtained a good fit (R2=0.950 and Radj2=0.893)
43.0
r
L
74.0
L
G3L D
HVP
10x6.1ak−
−
= (Eq. 7.8)
The surface generated with the model is shown in Figure 7.11. It shows the important
effect of the power consumption and how the HL/Dr ratio becomes important at high
(PG/VL).
Subsequently we examined the observed versus predicted kLaL generated with Eq.7.7
(Figure 7.12a). This shows slight violations of the model mainly at high superficial
gas velocities, but generally a good fit of the model with the experimental data. Based
on Eq. 7.8 the surface generated by the model is shown in Figure 7.12b. There was a
good adjustment of the model with the experimental data.
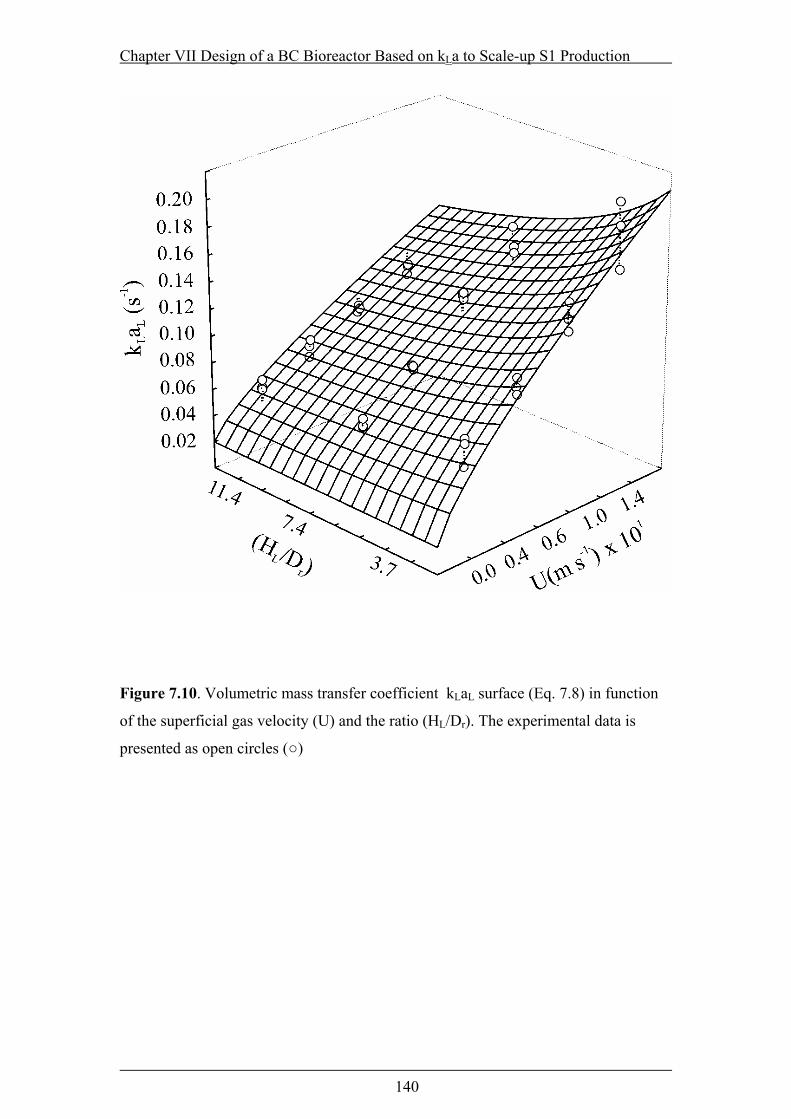
Chapter VII Design of a BC Bioreactor Based on kLa to Scale-up S1 Production
140
Figure 7.10. Volumetric mass transfer coefficient kLaL surface (Eq. 7.8) in function
of the superficial gas velocity (U) and the ratio (HL/Dr). The experimental data is
presented as open circles (○)
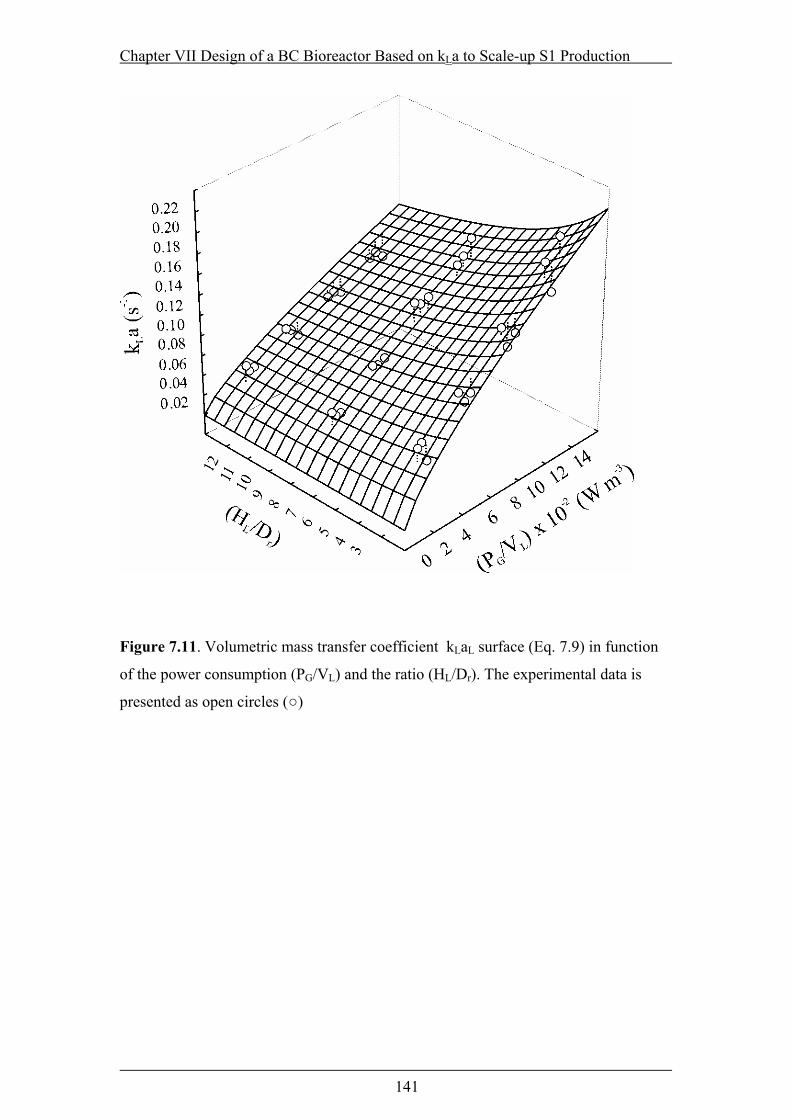
Chapter VII Design of a BC Bioreactor Based on kLa to Scale-up S1 Production
141
Figure 7.11. Volumetric mass transfer coefficient kLaL surface (Eq. 7.9) in function
of the power consumption (PG/VL) and the ratio (HL/Dr). The experimental data is
presented as open circles (○)
Chapter VII Design of a BC Bioreactor Based on kLa to Scale-up S1 Production
142
Figure 7.12. Residual diagnostics of the kLaL surface generated by the model Eq.
7.8 (a) and Eq. 7.9 (b) of the predicted vs. observed
Chapter VII Design of a BC Bioreactor Based on kLa to Scale-up S1 Production
143
In order to establish the robustness of the experimental data a comparison with
theoretical models was performed. The equation of mass transfer purely theoretically
derived from mean bubble size (dB) in dispersion and the overall gas hold up (ε ) was:
( )εε−
+
=
1ln
dk
6lnaklnB
LLL (Eq.7.9)
In theory a log-log plot kLaL against ε /(1- ε ) should have a slope = 1 for a perfect
match of the experimental values and that derived from theory. The predicted kLaL
agreed remarkably well with the experimental values. In the experiment the average
slope of all the data under the different operating conditions was 1.28. Chisti (1989)
reported from a 200 point data set under different bioreactor/ fluid combinations a
slope of 1.18. This result demonstrates that the gas hold up and the mass transfer
measurements were quite reliable.
Figure 7.13 shows the growth kinetics of the Phoma sp. and the production of
squalestatin S1 in the bubble column bioreactor using a HL/Dr ratio of 3.7.
Interstingly, no lag and stationary growth phases were observed. This absence of a
stationary phase could be due to prevention of restricted oxygen conditions because of
the high mass transfer coefficients of the geometrical ratio HL/Dr. However, the
excessive growth could also limit the total production of such secondary metabolites.
Interactions between cells produce chemical signals which can control the production
of secondary metabolites.

Chapter VII Design of a BC Bioreactor Based on kLa to Scale-up S1 Production
144
Figure 7.13. Squalestatin S1 fermentation kinetics at 25oC in the bubble column
bioreactor (BC) ratio (HL/Dr = 3.7, Fg =1.3 x 10⁻⁴ m3 s-1). Figures represent: pH (□),
biomass (○) and squalestatin S1 concentration (∆).
Chapter VII Design of a BC Bioreactor Based on kLa to Scale-up S1 Production
145
7.4 CONCLUSIONS
The following major conclusions can be drawn from this work.
1. For all the systems studied the gas hold up ε and in the volumetric mass
transfer coefficient kLa were affected by the HL/Dr ratio at high superficial gas
velocities, i.e., U>0.08 m s-1 at 25oC.
2. The kLa/ε value tend to a constant which differs depending on the ratio HL/Dr.
Low ratios produced higher constant kLa/ε .
3. Regardless of the temperature and superficial gas velocities the maximum kLa
values were obtained with the a HL/Dr ratio of 3.7.
4. Levels of power consumption (PG/VL) <1.2 kW m-3 were found to be similar
to other systems such as the stirred tank bioreactor. However, the bubble
column produced almost double the mass transfer coefficient.
5. Two new models are proposed by adding the effect of the liquid level in the
geometry of the fermentor to the widely applied correlations of superficial gas
velocity and power consumption.
6. Successful scaled up produced similar concentrations of squalestatin S1 (420
mg l-1) in the bioreactor when compared to shake flasks (434 mg l-1) (Parra et
al., 2004c). However the biomass produced was twice as much, the excessive
growth could also limit the total production of secondary metabolite.
7. This evidence strongly suggests that evaluation of different superficial gas
velocities is more suitable for secondary metabolites produced by the Phoma
sp.
8. Further studies are needed to determine the effect of different superficial gas
velocities in order to limit the biomass production which can restrict oxygen
supply or limit growth by immobilization.

Chapter VIII S1 Production by Immobilized (BC) and Free (STR) System
146
CHAPTER VIII EXPLORATION OF NOVEL IMMOBILIZATION SYSTEMS IN
BUBBLE COLUMN BIOREACTOR FOR THE PRODUCTION OF SQUALESTATIN S1 BY A Phoma SPECIES AND
COMPARISON WITH A FREE CELL CULTURE STIRRED TANK REACTOR
Chapter VIII S1 Production by Immobilized (BC) and Free (STR) System
147
8.1 INTRODUCTION
Squalestatins are a family of fungal secondary metabolites. These potent inhibitors of
squalene synthase have the potential for development as cholesterol lowering agents
and/or as antifungal agents (Bergstrom et al., 1995). Among the various species that
produce squalestatins, a Phoma sp. is particularly important because of its potential
concentration of squalestatins (Baxter et al., 1998; Dawson et al., 1991).
In 1969, the first industrial application of immobilization was applied. Since then,
numerous improvements have been made in the immobilization techniques. A large
number of supports for immobilization have been used (Emregul et al., 1995; Ohmori
and Kurokawa, 1994; Sato et al., 1994; Escamilla et al., 2000) and the total number of
their applications have also risen, particularly in the fields of environmental
engineering, food processing and medicine (Gmeiner, 1992).
Gels are some of the most widely used supports; they can either be natural, derived
from polysaccharides such as agar (Hayashi et al., 1993), alginate (Wu et al., 1994),
k-carrageenan (Sakiyama et al., 1993), pectate (Escamilla et al., 2000) or synthetic,
such as that derived from acrylamide (Axelsson et al., 1994). The immobilization of
microbial cells in different carriers leads to changes in their microenvironment
(Shreve and Vogel, 1993). Because of these changes, immobilized cells show various
modifications in physiology and biochemical composition when compared to
suspended cells (Hilg-Rotmann and Rehm, 1990).
In the past two decades advanced use of polysaccharides for gel-entrapment or
encapsulation of cells and technique optimization has become a challenging area for
the biotechnologist. The immobilization procedure can be carried out in a single step
process under very mild conditions and is therefore compatible with most viable cells.
The first step in fungal production is inoculation of vegetative cultures and subsequent
inoculum development. Inoculum quality and quantity strikingly affect the overall
production (Gancheva and Dimova, 1984; Brückner and Blechschmidt, 1991;
Mussenden, 1993).
Chapter VIII S1 Production by Immobilized (BC) and Free (STR) System
148
The optimization of immobilization parameters could permit development of an
immobilized cell fermentation which improves S1 production in a bubble column
bioreactor. However, the classical strategy of changing one variable at a time would
be very time-consuming. Optimization approaches can be performed using a Placket-
Burman experimental design and contour surfaces facilitating evaluation of
interacting factors for optimising S1 production. While immobilization can be carried
out using a mixture of polymers (alginate and pectate) and concentration of mixtures,
the changes in water availability have never been considered and measured to
evaluate the impact that such stress may have on the physiology of the microorganism
and secondary metabolite production.
The objectives of this work were to evaluate the influence of immobilization design
parameters and their interactions on S1 production and compare this with free stirred
bioreactors. The factors considered were: polymer and copolymer (alginate and
pectate) immobilization under different mixture concentrations, inoculum level, gel
inducer (calcium chloride), reinforcing agent (chitosan) and air flow in the bubble
column bioreactor. This was compared with S1 production in a free cell fermentation
using a standard stirred tank bioreactor (STR).
8.2 MATERIALS AND METHODS
8.2.1 Fungal strains
See section 6.2.1
8.2.2 Activation and inoculation
See section 6.2.2
8.2.3 Immobilization
Growing mycelia of Phoma sp. were used for immobilization. In aseptic conditions
the seeding fungus were immobilized and co-immobilized in Ca-pectate, Ca-alginate
and mixtures of both using a modified version of that previously reported by
Escamilla et al. (2000). The mycelial pellets were homogenised in a blender (50
seconds) and filtered through a sinter glass funnel to remove all the liquid. The
biomass was recovered on Whatman paper (No. 2). The inoculum was adjusted in a

Chapter VIII S1 Production by Immobilized (BC) and Free (STR) System
149
volumetric cylinder to either 10, 20 and 30 % wet mycelium inoculum:polymer ratio
by immobilization in polygalactguronic or alginic acid or a mixture (alginate-
poygalacturonate 50-50 (v/v)). The polymer concentration was 3 and 5 % w/v for
alginate, 6 and 8 % w/v for polygalacturonate and 3.5% alginate and 3.5 %
polygalacturonate for the 50-50 (v/v) mixture. The polymer-inoculum mixture aw was
modified with glycerol and forced through a multi-needle template (18 gauge for 5
mm beads) with a peristaltic pump (Watson Marlon) flowing at 10 ml min-1 and the
droplets collected in sterile gel-inducer solutions of 3, 4 or 5 % (w/v) CaCl2 with
different concentrations of chitosan (0, 0.75 and 1.5 g l-1). After soaking for 3 h the
liquid was decanted and the spherical beads was washed with sterile RO water and
stored at 4ºC for 24 hours. The water availability of the decanted beads were
measured with a Humidat-IC II apparatus (Novasina, Talstrasse, Switzerland).
8.2.4 Media preparation and incubation
See section 6.2.3
8.2.5 Bioreactors
A set of bubble column bioreactors (BCR) (Soham Scientific,United Kingdom) with
the geometric ratio HL/Dr= 3.7 equivalent to 1 l fermentation medium loaded into a
BC. For aeration, a sintered glass plate (30 µm porosity, 10 mm thick) was used.
From the optimal conditions for kLa found in previous work the fermentations were
performed at different superficial gas velocities (U = 0.057, 0.089 and 0.120 m s-1)
and process temperature (T = 25oC).
Parallel experiments with free cell fermentation were performed in a standard 5 l
stirred tank reactor (STR) (Electochem Ltd, United Kingdom). The diameter of STR
was D = 0.25 m (liquid height HL=0.102 m) and the diameter of a Rushton radial
impeller and axial turbine were DR = 0.08 m. All experiments were performed at a
superficial gas velocity of 0.024 m s-1 and the process set at T = 25oC and 150 rpm.
All reactors were equipped with sterilizable pH (PHT20) (Thermo Russell) and
oxygen (Bioengineering, Switzerland) probes, connected to a central controller
(Bioengineering, Switzerland) for on-line measurements. Oxygen partial pressure
measurements were measured by a polarographic electrode. Samples to determine
Chapter VIII S1 Production by Immobilized (BC) and Free (STR) System
150
biomass and squalestatins were taken from a sterile suction port. Biomass was
determined by filtering 4 ml through filter paper (Whaltman no. 2) and drying in an
oven at 90oC.
8.2.6 Determination of total nitrogen and carbon
All the samples were pre-filtered through a 0.2 mm (Whatman) filter. Dilutions were
preformed where nitrogen was > 10 mg l-1. The total nitrogen was determined by on-
line oxidation with persulphate in alkaline solution to nitrate in a segmented flow ion
analyser (Burkard Scientific SFA-2000). The resultant nitrite reacts with
sulphanilamide and N-1-napthylethylenediamine to form a red azo dye measured at
520 nm (Franso, 1995). The total dissolved carbon determination was carried out with
a segmented flow ion analyser (Burkard Scientific SFA-2000). The sample was first
acidified and sparged with carbon dioxide free air to remove inorganic carbon dioxide
(based on a method supplied by Burkard Scientific SFA-2000). The sample was then
mixed with acidified potassium persulphate and irradiated with UV light to convert
organic carbon to dioxide. The carbon dioxide permeates through a gas diffusion
membrane into a buffered phenolphthalein solution and the change in colour
monitored at 550 nm.
8.2.7 Squalestatin analysis
See section 6.2.4
8.2.8 Experimental design and data treatment
The aim of this work was to investigate the relationship between the immobilization
components and their concentration to maximize the production of squalestatin S1 by
Phoma sp. in a bubble column bioreactor with a screening Placket Burman design and
response surface methodology. The optimal immobilized cell fermentation was
compared with free cell fermentation in a STB.
The immobilized design composition was selected according to the experimental
design. The combinations of polymer type, polymer concentration, bead water
activity, inoculum size, gel-inducer (CaCl2), chitosan concentration and air flow rate
were selected using the experimental design module of Statistica 6.0 (SoftStat, Inc.
1984-2001, USA). A screening experimental system of the Plakett-Burman (24-7)

Chapter VIII S1 Production by Immobilized (BC) and Free (STR) System
151
design with a resolution R=III and seven independent factors and four replicates at the
centre was used. The levels of each factor were allocated into three categories: (-1)
low, (0) medium and (1) high. For the analysis, the factors were given coded values
between -1 (lowest concentration of substrate) and 1 (highest concentration of
substrate). For the response surface methodology and the polynomial regression the
coded values and the vector squalestatin production were loaded into the statistical
analysis under the experimental design module of Statistica 6.0 (SoftStat, Inc. 1984-
2001, USA). The experiment results were statistically evaluated.
A set of factors identified in the literature as potentially important in the design of
immobilized cell fermentations were evaluated. These factors, along with low and
high concentration of each level are shown in Table 8.1. The polymer type and
concentration were chosen so that some immobilizations were pure polymer (alginate
or pectate) and mixtures of both. When chitosan was evaluated the lower level
indicates the absence of this compound in the immobilization. The inoculum
treatment levels chosen were to enable differences to stand out, regardless of the
organism variability.
This strategy was designed to balance the medium experimentation between the
known factors that affect the immobilization and new sources that could represent an
improvement in the immobilization technique evaluated under extreme hydrodynamic
conditions generated in the bioreactor derived from the air flows. The 12 run Plackett-
Burman design with four centre points were use to screen the effect of the
immobilized design on S1 production.
8.3 RESULTS
The analysis of the data from the Plackett-Burman experiments involved fitting a first
order (main effects) model together with the term for curvature. The low and high
factor levels were coded as -1 and +1, respectively for the analysis of the data. The
different conditions and the resulting titres forecasted by the model after 96 hours
fermentation are shown in Table 8.2.

Chapter VIII S1 Production by Immobilized (BC) and Free (STR) System
152
The theoretical model accompanying the analysis of the Plackett-Burman results is
given by
Squalestatin S1 (mg l-1) = a0+b1X1+b2X2+...+b7X7+c0CP+error
Where a0 represent the intercept, bi is the main effect or slope associated with the ith
component of the immobilized design. The factors accompanying each main effect are
represented by X for each immobilization components, while the CP indicates
whether the experiment was a centre point (0) or a non-centre point (+1). The c0 term
is the gross curvature effect and indicates the degree to which the centre points differ
from the non-centre points. A negative c0 indicates the response at the centre exceeds
the average response at the extremes in the design space. Otherwise, the higher
responses occur at or beyond the extremes, which could prompt a shift in the factor
levels and the design space.
The R2 value was 0.998 and the model explained over 99.0% of the total variability in
the data. The parameter estimate of the immobilized design are given in descending
order in Table 8.3 and are interpreted as slopes for the change in the response for
every unit change in the coded factor level. The immobilization factors that had the
most significant effect (P-value < 0.001) were air flow, gel-inducer (calcium chloride,
CaCl2), polymer concentration and inoculum. Of secondary importance were
inoculum level (P-value < 0.005) and water activity (P-value < 0.01), while polymer
type and chitosan had marginal significance (P-value < 0.02). The curvature term was
very significant, indicating that optimal conditions probably occur inside the
experimental region.
One way to check the appropriateness of the selected model is to investigate the
observed, predicted and residual values, which are the deviations between the actual
titres and those predicted by the model. Patterns in the residuals or large residuals
usually indicate inadequacies in the model or possible suspect data. Figure 8.1a shows
the observed vs predicted concentrations of S1 with the Plackett-Burman model.
Points above or below the diagonal line represent areas of over or under prediction.
No significant violations of the model occurred in the analysis and a good fit of the
model with the experimental data was achieved. Figure 8.1b shows the studentized (t)
residual against the raw residuals. Good agreement with a Gaussian distribution of the
residuals was found.
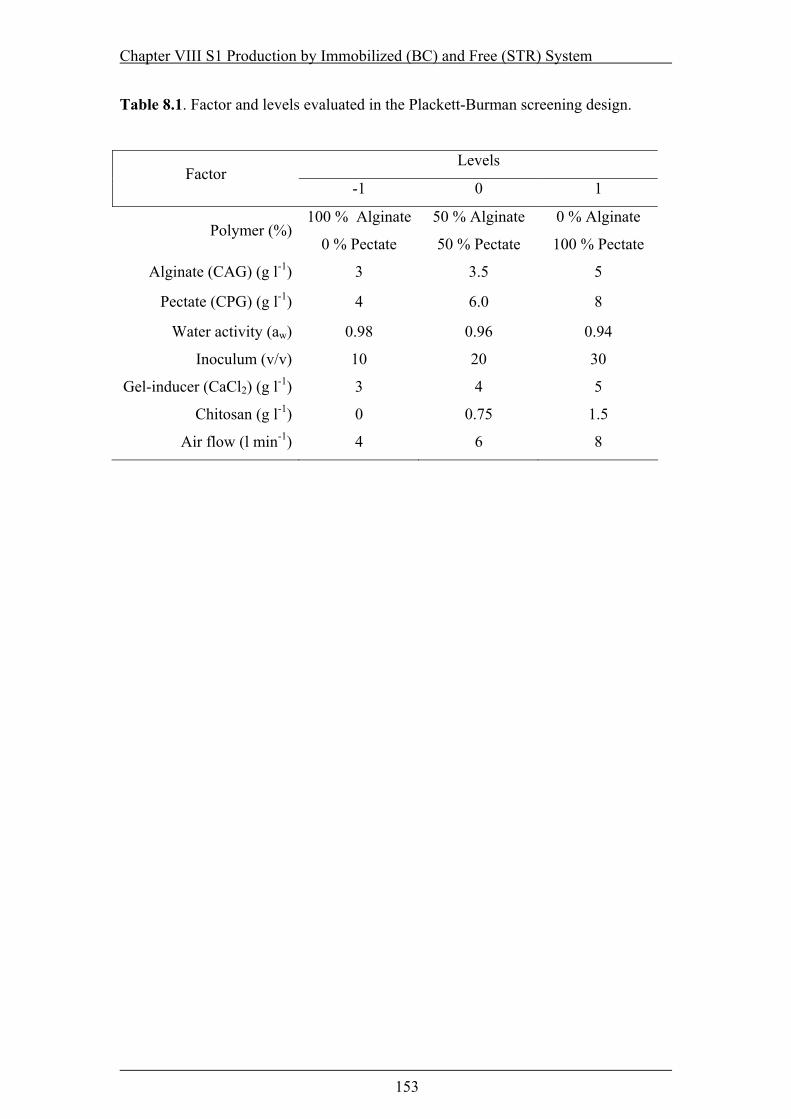
Chapter VIII S1 Production by Immobilized (BC) and Free (STR) System
153
Table 8.1. Factor and levels evaluated in the Plackett-Burman screening design.
Levels Factor
-1 0 1
Polymer (%) 100 % Alginate
0 % Pectate
50 % Alginate
50 % Pectate
0 % Alginate
100 % Pectate
Alginate (CAG) (g l-1) 3 3.5 5
Pectate (CPG) (g l-1) 4 6.0 8
Water activity (aw) 0.98 0.96 0.94
Inoculum (v/v) 10 20 30
Gel-inducer (CaCl2) (g l-1) 3 4 5
Chitosan (g l-1) 0 0.75 1.5
Air flow (l min-1) 4 6 8
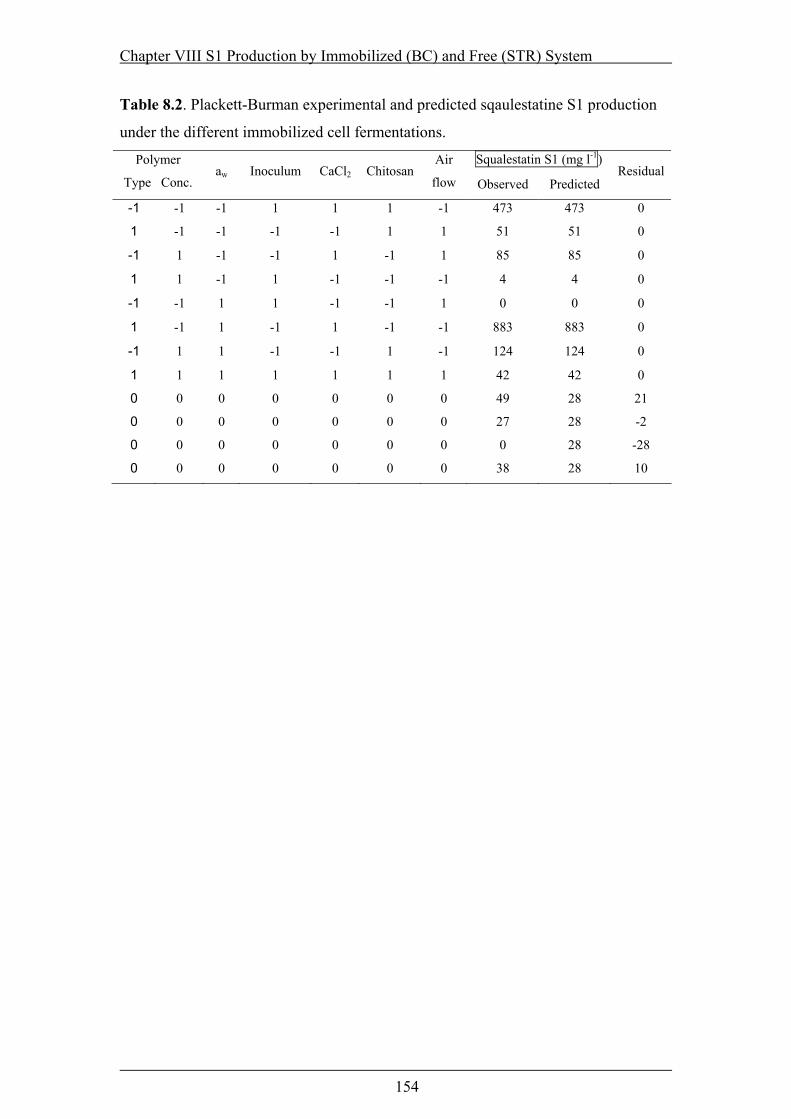
Chapter VIII S1 Production by Immobilized (BC) and Free (STR) System
154
Table 8.2. Plackett-Burman experimental and predicted sqaulestatine S1 production
under the different immobilized cell fermentations.
Squalestatin S1 (mg l-1) Polymer
Type Conc. aw Inoculum CaCl2 Chitosan
Air
flow Observed Predicted Residual
-1 -1 -1 1 1 1 -1 473 473 0
1 -1 -1 -1 -1 1 1 51 51 0
-1 1 -1 -1 1 -1 1 85 85 0
1 1 -1 1 -1 -1 -1 4 4 0
-1 -1 1 1 -1 -1 1 0 0 0
1 -1 1 -1 1 -1 -1 883 883 0
-1 1 1 -1 -1 1 -1 124 124 0
1 1 1 1 1 1 1 42 42 0
0 0 0 0 0 0 0 49 28 21
0 0 0 0 0 0 0 27 28 -2
0 0 0 0 0 0 0 0 28 -28
0 0 0 0 0 0 0 38 28 10
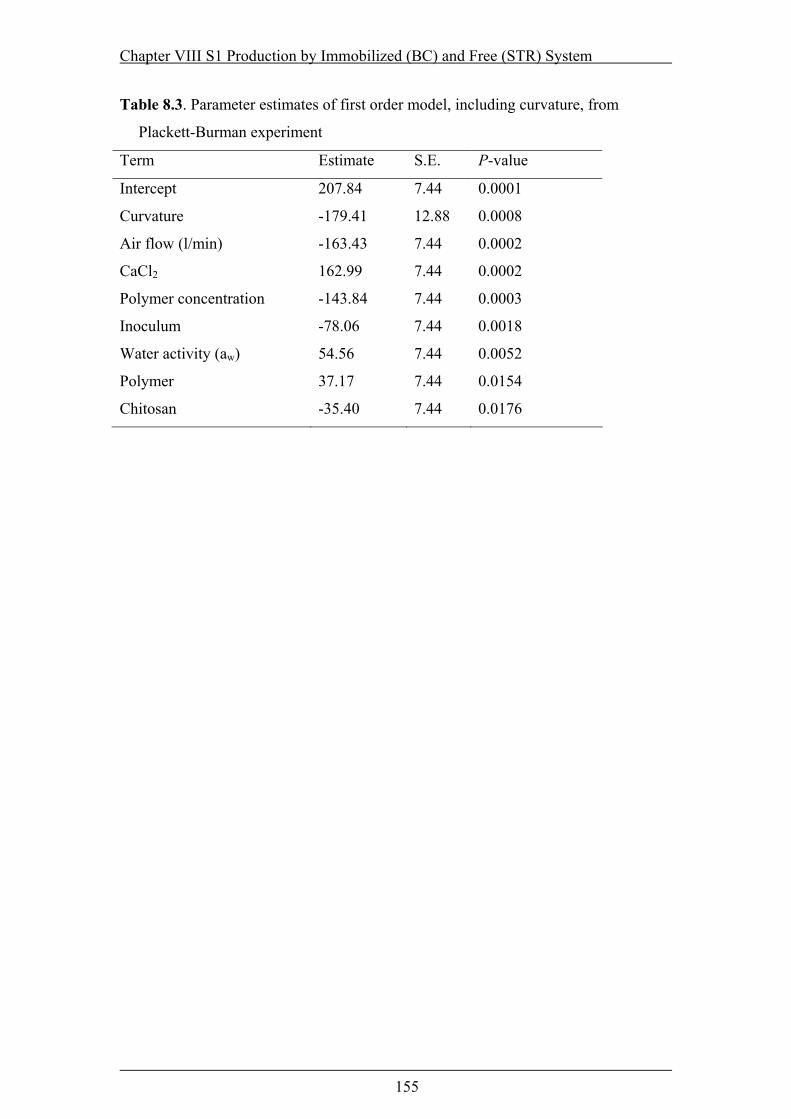
Chapter VIII S1 Production by Immobilized (BC) and Free (STR) System
155
Table 8.3. Parameter estimates of first order model, including curvature, from
Plackett-Burman experiment
Term Estimate S.E. P-value
Intercept 207.84 7.44 0.0001
Curvature -179.41 12.88 0.0008
Air flow (l/min) -163.43 7.44 0.0002
CaCl2 162.99 7.44 0.0002
Polymer concentration -143.84 7.44 0.0003
Inoculum -78.06 7.44 0.0018
Water activity (aw) 54.56 7.44 0.0052
Polymer 37.17 7.44 0.0154
Chitosan -35.40 7.44 0.0176
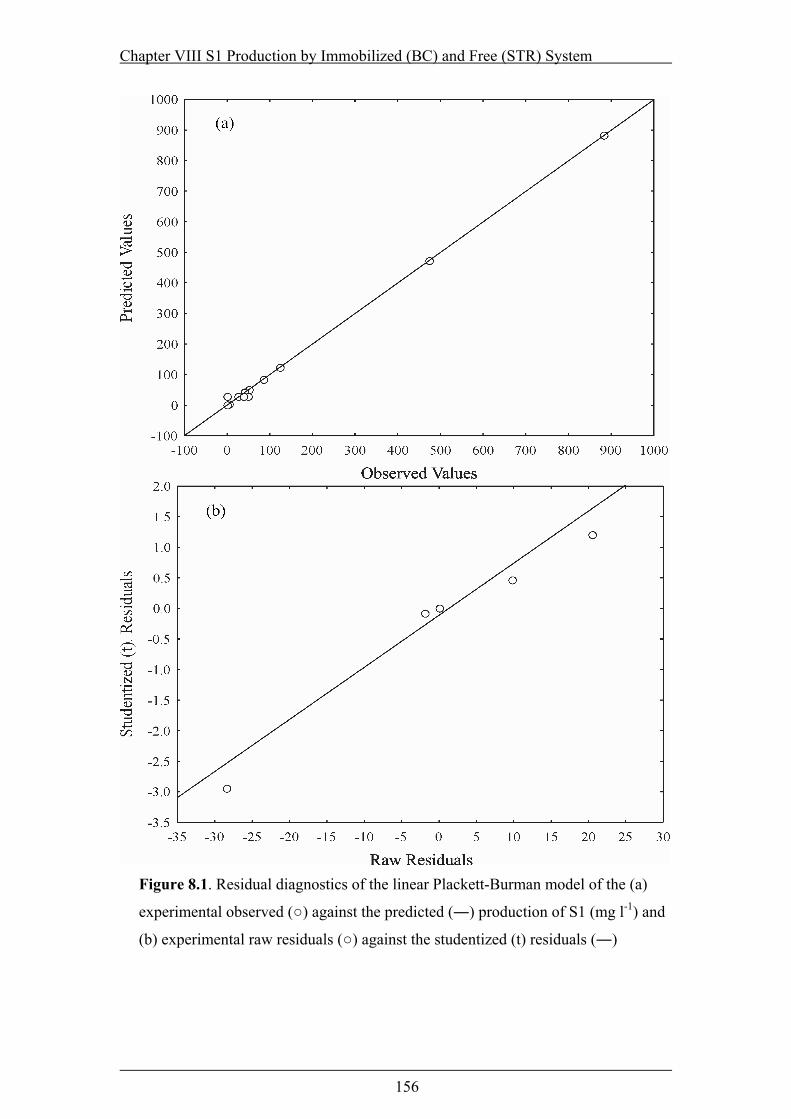
Chapter VIII S1 Production by Immobilized (BC) and Free (STR) System
156
Figure 8.1. Residual diagnostics of the linear Plackett-Burman model of the (a)
experimental observed (○) against the predicted (―) production of S1 (mg l-1) and
(b) experimental raw residuals (○) against the studentized (t) residuals (―)
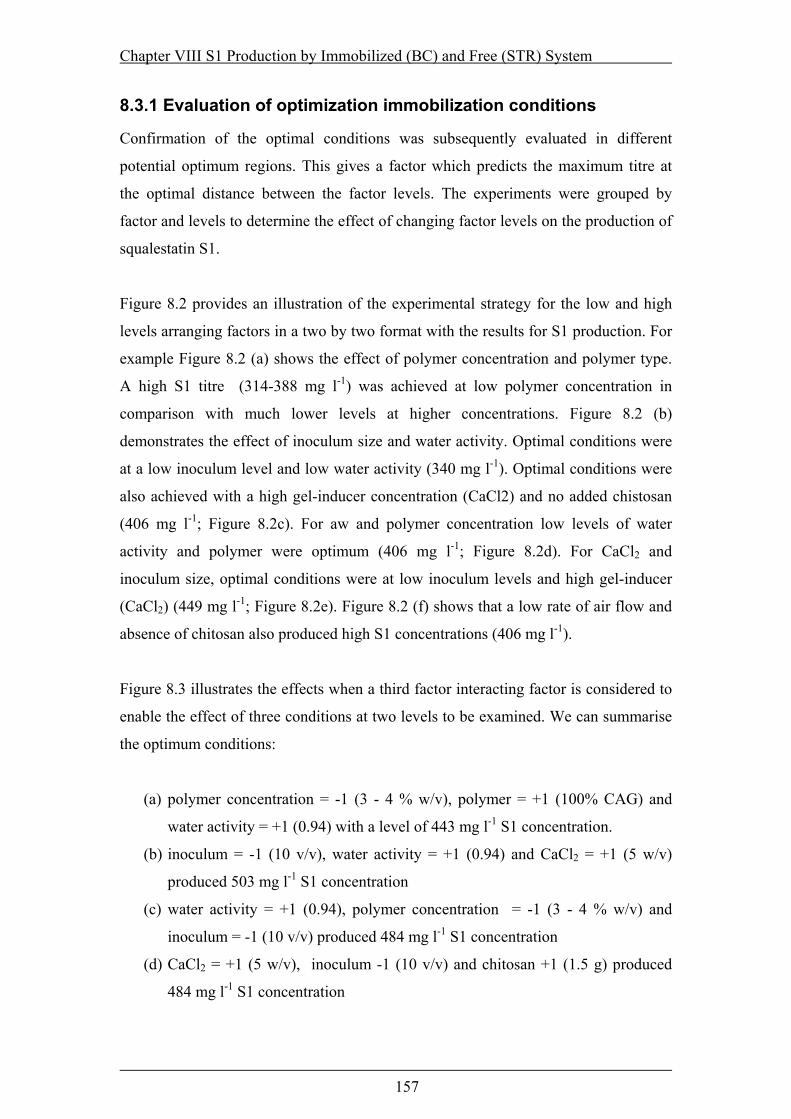
Chapter VIII S1 Production by Immobilized (BC) and Free (STR) System
157
8.3.1 Evaluation of optimization immobilization conditions
Confirmation of the optimal conditions was subsequently evaluated in different
potential optimum regions. This gives a factor which predicts the maximum titre at
the optimal distance between the factor levels. The experiments were grouped by
factor and levels to determine the effect of changing factor levels on the production of
squalestatin S1.
Figure 8.2 provides an illustration of the experimental strategy for the low and high
levels arranging factors in a two by two format with the results for S1 production. For
example Figure 8.2 (a) shows the effect of polymer concentration and polymer type.
A high S1 titre (314-388 mg l-1) was achieved at low polymer concentration in
comparison with much lower levels at higher concentrations. Figure 8.2 (b)
demonstrates the effect of inoculum size and water activity. Optimal conditions were
at a low inoculum level and low water activity (340 mg l-1). Optimal conditions were
also achieved with a high gel-inducer concentration (CaCl2) and no added chistosan
(406 mg l-1; Figure 8.2c). For aw and polymer concentration low levels of water
activity and polymer were optimum (406 mg l-1; Figure 8.2d). For CaCl2 and
inoculum size, optimal conditions were at low inoculum levels and high gel-inducer
(CaCl2) (449 mg l-1; Figure 8.2e). Figure 8.2 (f) shows that a low rate of air flow and
absence of chitosan also produced high S1 concentrations (406 mg l-1).
Figure 8.3 illustrates the effects when a third factor interacting factor is considered to
enable the effect of three conditions at two levels to be examined. We can summarise
the optimum conditions:
(a) polymer concentration = -1 (3 - 4 % w/v), polymer = +1 (100% CAG) and
water activity = +1 (0.94) with a level of 443 mg l-1 S1 concentration.
(b) inoculum = -1 (10 v/v), water activity = +1 (0.94) and CaCl2 = +1 (5 w/v)
produced 503 mg l-1 S1 concentration
(c) water activity = +1 (0.94), polymer concentration = -1 (3 - 4 % w/v) and
inoculum = -1 (10 v/v) produced 484 mg l-1 S1 concentration
(d) CaCl2 = +1 (5 w/v), inoculum -1 (10 v/v) and chitosan +1 (1.5 g) produced
484 mg l-1 S1 concentration
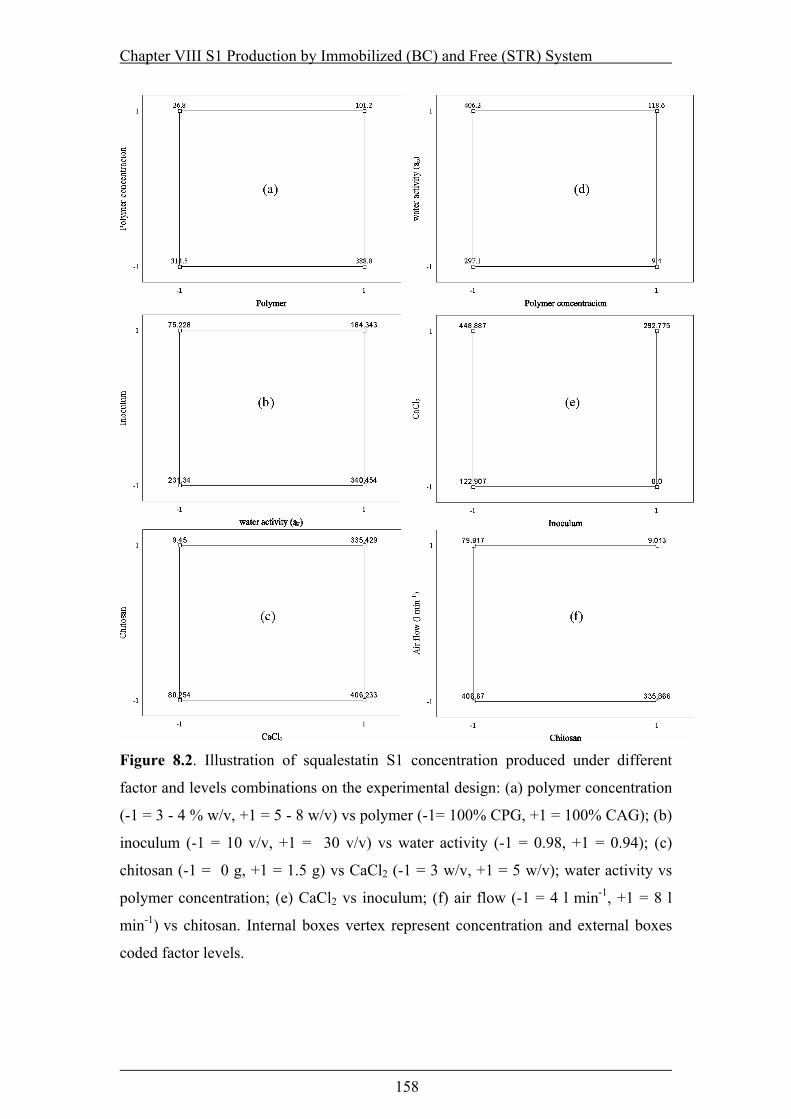
Chapter VIII S1 Production by Immobilized (BC) and Free (STR) System
158
Figure 8.2. Illustration of squalestatin S1 concentration produced under different
factor and levels combinations on the experimental design: (a) polymer concentration
(-1 = 3 - 4 % w/v, +1 = 5 - 8 w/v) vs polymer (-1= 100% CPG, +1 = 100% CAG); (b)
inoculum (-1 = 10 v/v, +1 = 30 v/v) vs water activity (-1 = 0.98, +1 = 0.94); (c)
chitosan (-1 = 0 g, +1 = 1.5 g) vs CaCl2 (-1 = 3 w/v, +1 = 5 w/v); water activity vs
polymer concentration; (e) CaCl2 vs inoculum; (f) air flow (-1 = 4 l min-1, +1 = 8 l
min-1) vs chitosan. Internal boxes vertex represent concentration and external boxes
coded factor levels.
Chapter VIII S1 Production by Immobilized (BC) and Free (STR) System
159
Overall the combined conditions in (a) to (d) is shown in (e):
(e) chitosan = -1 (0 g), CaCl2 = +1 (5 w/v) and air flow =-1 (4 l min-1) produced
569 mg l-1 S1 concentration
which represents the highest S1 concentrations.
Figure 8.4 shows the plot of the Plackett-Burman model for polymer with all the
factors at level 0 and the uncoded concentration of the binary polymer concentration.
Uncoding the polymer concentration it was observed that the two polymers had
opposite effects. Increasing the calcium alginate gel (CAG) concentration increased
the S1 concentrations. In contrast, an increase in the concentration of calcium pectate
gel (CPG) led to a reduction in S1 production. The centre point for both polymers are
considerably different. For CAG the range is between 800-880 mg l-1 S1 and for CPG
between 600-675 mg l-1 S1. The optimal composition of polymer is with pure calcium
alginate gel (CAG) (coded = +1).
Figure 8.5a shows the forecasted S1 concentrations as a function of inoculum size.
The effect of increasing the inoculum size was to reduce the total S1 produced.
Optimum conditions for the production of S1 was obtained with 10 % v/v wet
inoculum. Increasing the gel-inducer (CaCl2) level resulted in a linear increase in S1
production with optimum at +1 (5 % w/v; Figure 8.5b).
For the reinforcing agent chitosan, an inverse relationship between concentration of
chitosan and S1 was observed (Figure 8.6a). The optimum level was -1 (0 g l-1) when
no chitosan was added. Figure 6b shows that an inverse relationship between air flow
ratio and S1 production occurred. The optimum level was -1 (4 l min-1). After
analysis of all the factors and levels, the optimal factor conditions of immobilization
on the production of squalestatin S1 is summarised in Table 8.4.

Chapter VIII S1 Production by Immobilized (BC) and Free (STR) System
160
Figure 8.3. Illustration of squalestatin S1 concentration produced under three
different factors and two levels combinations on the experimental design: (a) polymer
concentration (-1 = 3 - 4 % w/v, +1 = 5 - 8 w/v), polymer (-1= 100% CPG, +1 =
100% CAG) and water activity (-1 = 0.98, +1 = 0.94); (b) inoculum (-1 = 10 v/v, +1 =
30 v/v), water activity and CaCl2 (-1 = 3 w/v, +1 = 5 w/v); (c) water activity, polymer
concentration and inoculum; (d) CaCl2, inoculum and chitosan (e) chitosan, CaCl2
and air flow (-1 = 4 l min-1, +1 = 8 l min-1).

Chapter VIII S1 Production by Immobilized (BC) and Free (STR) System
161
Figure 8.4. Coded experimental (●) and predicted (···) production of squalestatin S1
and the uncoded levels for calcium alginate gel CAG (○) and calcium pectate gel
CPG (□) gel levels of squalestatin S1 production at 72 hours of fermentation.

Chapter VIII S1 Production by Immobilized (BC) and Free (STR) System
162
Figure 8.5. Squalestatin S1 produced under different inoculum sizes (a) and gel-
inducer (CaCl2) concentration (b). The experimental (○) and forecasted (●)
squalestatin concentrations at 72 hours of fermentation, the bars represent the 95% of
confidence.

Chapter VIII S1 Production by Immobilized (BC) and Free (STR) System
163
Figure 8.6. Squalestatin S1 produced under different gel- reinforce agent (chitosan)
concentration (a) and air flow ratos (b). The experimental (○) and forecasted (●)
squalestatin concentrations at 72 hours of fermentation, the bars represent the 95% of
confidence.

Chapter VIII S1 Production by Immobilized (BC) and Free (STR) System
164
Table 8.4. Optimal conditions for Phoma sp. immobilization for the production of
squalestatin S1 evaluated in the Plackett-Burman screening design.
Factor Value
Polymer (%) 0 % Alginate
100 % Pectate
Alginate (CAG) (g l-1) 3
Pectate (CPG) (g l-1) 8
Water activity (aw) 0.94
Inoculum (v/v) 10
Gel-inducer (CaCl2) (g l-1) 5
Chitosan (g l-1) 0
Air flow (l min-1) 4
Predicted 883.28
Chapter VIII S1 Production by Immobilized (BC) and Free (STR) System
165
Figure 8.7 shows the optimal immobilized design for the production of squalestatin
S1. Figure 8.7(a) presents the kinetics of S1 production together with the biomass and
nitrogen changes. A very high S1 production of 883 mg l-1 was achieved with the
optimal design levels. The sample was taken from the medium secondary metabolite
production was only initiated when a certain nitrogen concentration was reached (1.02
g l-1). The low biomass in the medium during the whole fermentation period suggests
that the cell entrapment was very effective. Figure 8.7(b) shows the carbon and
nitrogen ratio, carbon consumption and changes in pH. The pH remained constant for
80 hours and only then increased to 6.0. The carbon uptake ratio fell sharply after 20
hours, then continued decreasing more slowly until the 80th hour. In the middle of the
fermentation period (60 hrs) when a peak production of squalestatin S1 was observed.
A linear increase in C:N ratio was due to nitrogen uptake associated with the growth
within the beads. The maximal production of squalestatin S1 was achieved with C:N
ratios of between 39-42. After 80 hours a change of the C:N ratio (C/N) was
observed.
For comparison, Figure 8.8a shows the production of squalestatin S1 in a standard
stirred tank reactor (STR) with a Ruston turbine. Fig 8.8a shows the kinetics of S1
production, biomass and nitrogen uptake by free cells of Phoma sp. Concentration
levels of 660 mg l-1 S1 were produced in the STR. The bubble column with the
optimal immobilized cell fermentation produced 34% more than the STR. The
secondary metabolite production began when a certain nitrogen concentration was
reached. In this case the squalestatin S1 production started at 1.4 g l-1 of nitrogen.
Figure 8.8b shows the C:N ratio, carbon consumption and pH. The pH remained
constant at value of 5.4 during the whole fermentation time. Carbon uptake ratio
increased rapidly after 20 hours and continued increasing during the fermentation.
The effect of the change of the carbon uptake had an effect in the squalestatin
production and the peak of S1 occurred between 50- 70 hrs. Possibly the production
could be continued for more than 72 hrs but the medium became very viscous. A fast
linear increase in the C:N ratio at the beginning of the fermentation was due to the
nitrogen uptake associated with the growth. An average value of 29.5 was established
for the rest of the fermentation.
Chapter VIII S1 Production by Immobilized (BC) and Free (STR) System
166
8.4 DISCUSSION
As the kinematical phases of a bioprocess are dynamic and are the consequences of
directed functioning of the micro-environmental generated by the immobilized cell
fermentation interacting strongly with the bioreactor operation parameters. The
influence of different immobilization systems was evaluated by the capability to
produce squalestatin S1 by statistical tools and is presented next.
It was observed an inverse effect of polymer type (alginate and pectate) on the
production of S1. The concentration of S1 produced increase as the alginate
concentration increase and pectate decrease. In this work Ca-alginate gel (CAG) was
shown to be a better polymer for cell immobilization than Ca-pectate gel (CPG) in the
production of secondary metabolite S1. Although, Ca-pectate resulted in a superior
polymer than alginate our previous work in the production of heterologous proteins
lysozyme (Parra et al., 2004d). This results point out the importance of the particular
selection of polymer according the strain and the product cause this influence the
outcome of the fermentation. Ca-alginate has been considered to be the most
important material for cell immobilization (Kumar and Lonsane, 1988; Vassileva et
al., 1998; Vílchez et al., 2001).
A 2.1 times higher production of S1 was achieved by the optimal immobilized cell
fermentation over our previous work with free cells fermentation in a fluidized bed
bioreactor (Chapter VII). Ca-alginate has a higher intrinsic viscosity than Ca-pectate
(Tomáška et al., 1995). Succinate has reported as precursors in the biosynthesis of
squalestatins (Bergstrom et al., 1995). The beads microenvironment produces an
hypoxic condition that may result in a higher expression of secondary metabolites
metabolic pathways. It is been reported the production of antibiotics with immobilized
Streptomyces Lividans was 2.4 times higher than with free cells in a fluidized bed
bioreactor (Sarrà et al., 1997). Moreover, Saccharomyces cereviciae immobilized in
ceramic had a productivity of ethanol 3.2 times that obtained with free cells (Kukaya
et al., 1996). The production of penicillin in a fluidized bed bioreactor obtained three
times higher production with immobilized Penicillium chrysogenum in a resin
(ceolite) in comparison with free cells (Gbewonyo and Wang, 1983).
Chapter VIII S1 Production by Immobilized (BC) and Free (STR) System
167
The addition of chitosan as part of design of the immobilized cell fermentation
resulted in a reduction in the concentration of squalestatin produced. The addition of
chitosan into gelling agent it was reported to improve the mechanical strength and
thermal stability of the hydrogel was greatly improved (Wang and Qian, 1999). The
addition of chitosan into the new immobilized cell fermentation may represent a
reduction of mass transfer due to the reinforcement of the gel network and lead to
lower S1 concentrations. The opposite effect observed with the gel-inducer CaCl2
may be attributed to the geometrical arrange of the mesh and the strength of the bead
permit an easy interchange of mass (substrates and product) without releasing the
fungi to the bulk. The volume of channels across the beads that allows the transport of
product and substrates increases when the water activity increases. Reducing the
immobilized inoculum load into the beads results in an increase in the S1
concentration produced. Mussenden et al. (1993) observed that a reduction of the
immobilized viable spores load of Penicillium chrysogenum from 4 x 10⁴ to 2 x 10³
spores ml-1 produced an increase in the penicillin titer of 5 times.
The bubble column (BC) bioreactor produced 34% higher S1 production than the
stirred tank reactor (STR). This could be attributed to the high mixing conditions and
high mass transfer achieved in the BC in comparison to a standard STR (Chapter VII)
It was observed that the low level of air flow (4 l min-1) produced higher S1
concentrations than higher (8 l min-1). This is attributed to the shift in the metabolic
pathway due to hypoxic conditions inside the beads. A higher air flow leads to higher
growth rates, as observed by the amount of nitrogen consumed. This was twice as
much as under the lower air flow rate.
The statistical experimental design Plackett-Burman is a methodology suitable for
immobilization design and optimization of multi-factor experiments. This work
showed that the proper use of these tools can allow a scientist to reduce the
complexity of a problem by identifying the most important components of the design
of an optimal cell immobilization. The experimental optimal conditions resulted in
much higher concentrations (34 %) of S1 compared to a free cell fermentation in a
standard bioreactor with the same fermentation medium. Some immobilization
conditions produced no squalestatin S1 and this methodology identifies which
immobilization designs should be avoided.
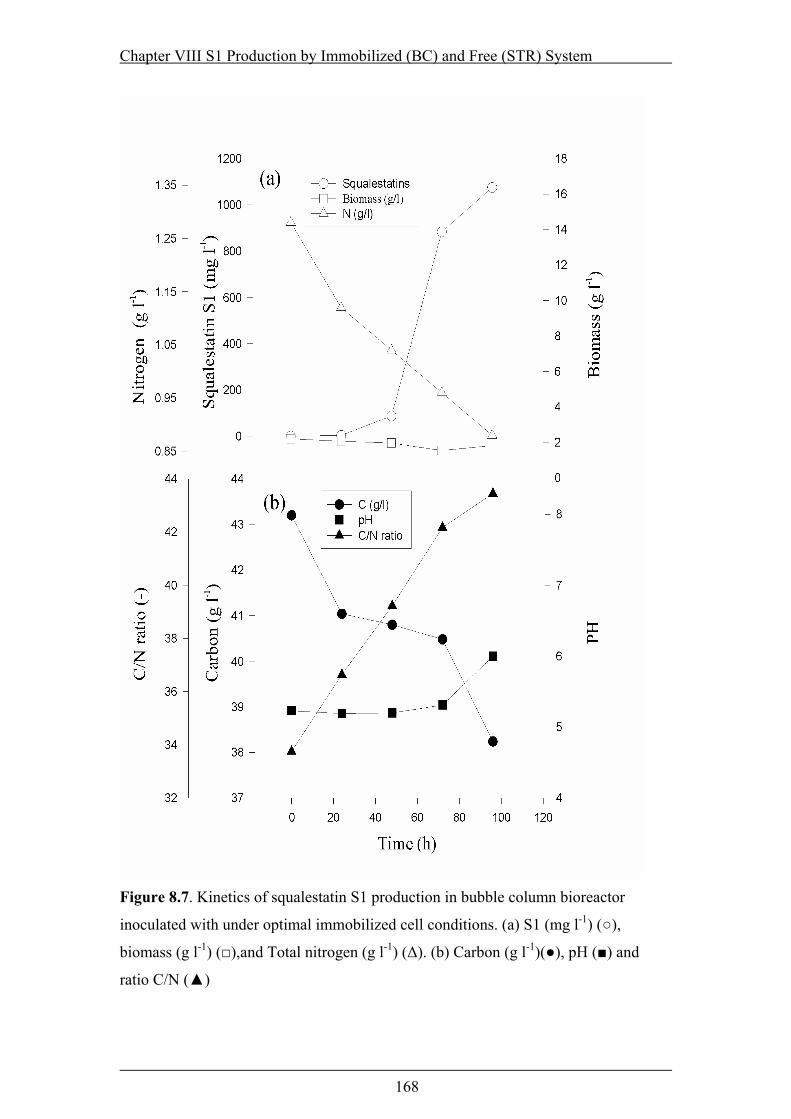
Chapter VIII S1 Production by Immobilized (BC) and Free (STR) System
168
Figure 8.7. Kinetics of squalestatin S1 production in bubble column bioreactor
inoculated with under optimal immobilized cell conditions. (a) S1 (mg l-1) (○),
biomass (g l-1) (□),and Total nitrogen (g l-1) (∆). (b) Carbon (g l-1)(●), pH (■) and
ratio C/N (▲)

Chapter VIII S1 Production by Immobilized (BC) and Free (STR) System
169
Figure 8.8. Kinetic of squalestatin S1 production in stirred tank bioreactor inoculated
with free cells. (a) S1 (mg l-1) (○), biomass (g l-1) (□),and Total nitrogen (g l-1) (∆). (b)
Carbon (g l-1)(●), pH (■) and ratio C/N (▲)

Chapter IX Conclusions and Future Work
170
CHAPTER IX CONCLUSIONS AND FURTHER WORK
Chapter IX Conclusions and Future Work
171
9.1 CONCLUSIONS
Biotechnological processes have been flourishing over the last few years and their
applications are increasing in number day by day. New metabolites are required for
the production of new drugs for the treatment of diseases now common in the
population, such as high blood pressure or heart disease.
Biotechnology is facing this new challenge by developing an interdisciplinary
approach, applying tools such as mathematical modelling and statistical strategies.
This way the research into new processes, that in the past used to take several years,
can now be optimized in a few months. The advantages include, apart from the time
saved, economical and environmental benefits, as fewer resources are consumed.
The main findings of the individual phases of the process are presented below.
Conclusions summary
Chapter II
WATER ACTIVITY , SOLUTE AND TEMPERATURE MODIFY GROWTH AND
SPORE PRODUCTION OF WILD TYPE AND GENETICALLY ENGINEERED
Aspergillus niger STRAINS
Maximum growth rates were achieved for both strains considered (L11 and
B1) under moderate aW levels.
L11 showed a higher growth rate than B1. Fastest growth was achieved at
30oC, using glycerol as solute, and 0.97 aw.
Optimal conditions for growth of strain L11 were estimated by means of
contour plot surfaces and found to be 0.965 aw with glycerol as solute at 35ºC.
Chapter IX Conclusions and Future Work
172
The predicted value of the optimum growth rate on agar was 10.5 mm day-1.
A value of 10.85 mm day-1 was obtained experimentally giving a good
correlation between the estimated and the measured results.
Sporulation was optimum for the wild type strain at 0.99-0.95 and 35oC.
However, a significantly higher production of conidia was achieved by L11 at
0.97-0.93 aw and at 0.97 aw and 35oC for strain B1.
Optimal conditions for spore production were different from those for growth
for both genetically engineered strains and wild type.
Under similar ecological conditions the wild type and both the genetically
engineered strains had different growth and sporulation patterns.
Chapter III
MODELLING THE EFFECT OF TEMPERATURE AND WATER ACTIVITY ON
GROWTH OF Aspergillus niger STRAINS AND APPLICATIONS FOR FOOD
SPOILAGE MOULDS
An extended combined model describing the growth of two strains of A.
niger, as a function of temperature (25-30oC) and aw (0.90-0.99) was
developed for the first time.
This extends the previous square root model of water activity showing the
relationship between temperature and bacterial growth rate developed by
Ratkowsky et al. (1983) and the parabolic relationship between the logarithm
of the growth rate and aw developed by Gibson et al. (1994).
A good correlation between the experimental data and the model predictions
was obtained, with regression coefficients (R2) > 0.99.
Chapter IX Conclusions and Future Work
173
The estimation of the minimum aw levels (awmin) was in accordance with data
in the literature for similar and a range of other Aspergilli and related species,
regardless of the solutes used for aw modification.
The estimation of the optimal aw (awopt) and the optimal growth rate (µopt)
were in good agreement with the experimental results and data from the
literature.
This approach enables accurate prediction of the combined effects of
environmental factors on growth of spoilage fungi for rapid prediction of
cardinal limits using surface response curves.
This approach is a rapid method for predicting optimal and marginal
conditions for growth of a wide range of spoilage microorganisms in relation
to interacting environmental conditions and will have applications for
improving the shelf-life of intermediate moisture foods.
Chapter IV
EFFECT OF WATER ACTIVITY, INOCULUM SIZE AND AUTOCLAVING
PROCEDURE ON LYZOSYME PRODUCTION BY TWO GENETICALLY
ENGINEERED Aspergillus niger STRAINS
The most important factors were the autoclaving procedure and the interaction
between the autoclaving procedure, aw level and initial spore concentration.
Although both strains of A. niger had similar lysozyme concentrations (15 mg
l-1), different production patterns were found under the experimental
conditions.
Strain B1 produced relatively higher amounts of lysozyme under water stress
(0.96 aw) with all the substrates autoclaved together. This represented an
important process advantage in the scale-up process because autoclaving all
Chapter IX Conclusions and Future Work
174
the medium substrates reduces the risk of media contamination and it’s more
economical
The concentration achieved by A. niger B1 in the autoclaving treatment (A),
low aw (0.96) and high inoculum size (2.7x10⁵ spores/ml) was twice that
achieved with the same strain when using the two other autoclaving treatments
(B; C).
The optimal conditions found on the contour surfaces for lysozyme
production with A. niger B1 was 0.96 aw, 2.0x10⁵ initial inoculation
concentration and autoclaving together all the components of the medium.
Chapter V
A NOVEL IMMOBILIZED DESIGN FOR THE PRODUCTION OF THE
HETEROLOGOUS PROTEIN LYSOZYME BY GENETICALLY ENGINEERED
Aspergillus niger STRAINS
Overall, immobilization in Ca-pectate resulted in higher lysozyme production
compared to immobilization in Ca-alginate. Similar effects were observed
when the polymer concentration was reduced. Regardless of polymer type and
polymer concentration, increasing the inoculum level increased lysozyme
production.
A 10 fold increase in lysozyme production was achieved with Ca-pectate in
comparison with Ca-alginate (20-23 and 0.5-1.7 mg l-1 respectively).
The highest lysozyme concentration achieved was 23.0 mg l-1 by
immobilization in 2% (w/v) Ca-pectate and 33% (v/v) mycelium with 3.5%
(w/v) of gel-inducing agent (CaCl2).
The optimal pH condition for the production of lysozyme was in the range of
4.5-5.0.
Chapter IX Conclusions and Future Work
175
Only 0.94 aw produced significant lysozyme concentrations regardless of
polymer type.
Chapter VI
MEDIUM OPTIMIZATION FOR THE PORODUCTION OF THE SECONDARY
METABOLITE SQUALESTATIN S1 BY A Phoma sp COMBINING
ORTHOGONAL DESIGN AND REPONSE SURFACE METHODOLOGY
A combined statistical methodology of orthogonal design L27(313) and
response surface techniques succeeded in optimizing the composition and
concentration of a liquid fermentation medium for the production of
squalestatin S1 by a Phoma species.
The sources of carbon, their concentration and interactions with oily
precursors were statistically significant factors.
The optimal medium composition produced average concentrations of 434 mg
l-1 in a five day fermentation at 25oC. This represented an improvement of
60% of the maximum concentration predicted, and a two-fold increased
productivity in comparisons with reported productivities for S1 in liquid
fermentations with different fungal species.
This approach enables rapid identification of key control parameters for
optimizing production systems.
Chapter IX Conclusions and Future Work
176
Chapter VII
DESIGN OF A NOVEL BUBBLE COLUMN BIOREACTOR BASED ON THE
VOLUMETRIC MASS TRANSFER COEFFICIENT AND SCALE UP OF
SQUALESTATIN S1 PRODUCED BY Phoma sp.
Two kLa models are proposed. One representing a function of the superficial
gas velocity (m s-1) and ratio (HL/Dr) (R2=0.951).
and the other a function of the power consumption (PG/VL) and ratio (HL/Dr)
(R2=0.950).
Regardless of the temperature effect, high volumetric mass transfer
coefficients (0.14-0.17 s-1) were found under the lower ratio (HL/Dr) at the
highest superficial gas velocities (0.115 m s-1).
A free cell fermentation was performed in the bubble column with a ratio of
(HL/Dr)= 3.7 and superficial gas velocity of U= 0.120 m s-1, at 25oC. The
production of the secondary metabolite squalestatin S1 reached 420 mg l-1.
The bioreactor scale up succeeded in maintaining the high S1 concentration
obtained in flask culture (434 mg l-1) but in a shorter time period.
Chapter VIII
EXPLORATION OF NOVEL IMMOBILIZATION SYSTEMS IN BUBBLE
COLUMN BIOREACTOR ON THE PRODUCTION OF SQUALESTATIN S1 BY
A Phoma SPECIES AND COMPARISON WITH A FREE STIRRED TANK
REACTOR
A linear model for S1 concentration gave a very good fit (R2 = 0.99).
The factors having the most significance (P-value < 0.001) were air flow, gel-
inducer (CaCl2), polymer concentration and inoculum level.
Chapter IX Conclusions and Future Work
177
Optimal conditions for production of S1 resulted in concentrations of 883 mg
l-1 which represented a 34 % improvement over that achieved (660 mg l-1) in a
stirred tank bioreactor (STR) system.
Overall findings
This is the fist time that a series of optimization strategies have been applied in two
different models, with a secondary metabolite and a heterologous protein. The results
were more promising for the secondary metabolite S1, as the work achieved the
highest reported production of S1 reported in the literature for liquid fermentation.
Lysozyme production was strongly influenced by the immobilization of the
engineered fungi.
The present study succeeded in designing and developing a novel biotechnological
process for the production of two important compounds: the secondary metabolite
squalestatin S1 and the heterologous protein lysozyme, as well as establishing the
guidelines for the production of similar compounds produced by fungi. These
guidelines were:
• The development of a mathematical model which describes the growth rate of
fungi under various environmental conditions.
• An ecophysiological approach to enhance the production of enzymes.
• The use of statistical tools to optimize the medium composition to enhance
secondary metabolite production.
• The design of a novel immobilization design succeeded in improving the
production of secondary metabolites and enzymes as compared with free-cell
systems.
The use of these guidelines resulted in a considerable saving of time and resources
and the robustness of the process was demonstrated.

Chapter IX Conclusions and Future Work
178
9.2 FUTURE WORK
Lysozyme produced by Aspergillus niger B1
Evaluation of growth rate by modifying the water activity with a polar solute
(NaCl)
Evaluation of the effect of immobilized Aspergillus niger B1 in the
bioreactors and comparison with free cell fermentations
Evaluation of the bubble column operation parameters such as air flow, pH
and temperature on the production of lysozyme
Evaluation of the kinetic parameters of Aspergillus niger, and correlations of
the production of the heterologous and homologous proteins
Squalestatin 1 produced by Phoma sp.
Evaluation of the effect the dynamic kLa on S1 production
Elucidation of the correlation between volatiles and biochemical stages on the
S1 production
Evaluation and modelling a non-invasive method to quantify biomass on
immobilized cell fermentations by optical methods
Developing techniques for assessing the rheological properties in the
bioreactor

Appendix I Refereed Papers in this Work
179
APPENDIX I REFEREED PAPERS IN THIS THESIS
Parra R., Magan N (2004) Modelling the effect of temperature and water activity on
growth of Aspergillus niger strains and applications for food spoilage moulds. Journal
of Applied Microbiology 35:232-237.
Parra R., Aldred D., Archer D., Magan N (2004) Water activity, and temperature
modify growth and spore production of wild type and genetically engineered
Aspergillus niger strains. Enzyme and Microbial Technology. 97:429-438. (Available
on line at www.sciencedirect.com)
Parra R., Aldred, D., Archer D & Magan N (2004) Effect of Water Activity,
Inoculum Size and Autoclaving Procedure on Lysozyme Production by Two
Genetically Engineered Aspergillus niger Strains. Biotechnological Progress.
Submitted.
Parra R., Aldred D., Archer D & Magan N (2004) A novel immobilized design for
the production of the heterologous protein lysozyme by a genetically engineered
Aspergillus niger strain. Applied Microbiology and Biotechnology. In Press.
Parra R., Aldred D., Magan N (2004) Medium optimization for the production of
secondary metabolite squalestatin S1 by Phoma sp combining orthogonal design and
response surface methodology. Applied and Environmental Microbiology. Submitted.
Parra R & Magan, N (2004) Design of a novel bubble column bioreactor based on
the volumetric mass transfer coefficient and scale up of squalestatin S1 produced by
Phoma sp. Biotechnology and Bioengineering. In preparation
Parra, R & Magan, N. 2004. Exploration of novel immobilization systems in bubble
column bioreactor on the production of squalestatin S1 by Phoma sp and compared
with free cell fermentations in a stirred tank reactor. Journal of Industrial
Microbiology and Biotechnology. In preparation.
References
180
REFERENCES
Adam W., Lukacs Z., Kahle C., Sha-Möller CR., Schreier P (2001) Biocatalytic
asymmetric hydroxylation of hydrocarbons by free and immobilized Bacillus
megaterium cells. Journal of Molecule Catalysis B: Enzymatic 11:377-385.
Aguero JMZ., de Macêdo GR., Facciotti MCR., Schmidell W (1990) Infuencia do
pH na sintese e liberacao de glicoamilase por Aspergillus awamori NRRL 3112
Aspergillus niger NRRL 375. Review in Microbiology. Sao Paulo. 21:355-360.
Aldred D., Magan N., Lane BS (1999) Influence of water activity and nutrient on
growth and production of squalestatin S1 by a Phoma sp. Journal of Applied
Microbiology 87:842-48.
Anderson TM., Bodie EA., Goodman N., Schwartz RD (1986) Inhibitory effect of
autoclaving whey-based medium on propionic acid production by
Propionibacterium shermanii. Applied Environmental and Microbiology 51:427-
428.
Angelova M., Sheremetska P., Lekov M (1998) Enhanced polymethylgalacturonase
production from Aspergillus niger 26 by calcium alginate immobilization. Process
Biochemistry 33:299-305.
Angelova MB, Pashova SB, Slokoska LS (2000) Comparison of antioxidant enzyme
biosynthesis by free and immobilized Aspergillus niger cells. Enzyme and
Microbial Technology 26:544-549.
Archer DB (2000) Filamentous fungi as microbial cell factories for food use. Current
Options in Biotechnology 11:478-83.
Archer DB, Mackenzie DA, Jeenes DJ, Roberts IN (1992) Proteolytic degradation
of heterologous proteins expressed Aspergillus niger. Biotechnology Letters
14:357-362.
Archer DB, Jeenes DJ, MacKenzie DA, Brightwell G, Lambert N, Lowe G,
Radford SE, Dobson CM (1990a) Hen egg with lysozyme expressed in, and
secreted from, Aspergillus niger is correctly processed and folded.
Bio/Technology 8:741-745.
Archer DB, Roberts IN and Mackenzie DA (1990b) Heterologous protein secretion
from Aspergillus niger in phosphate-buffered batch culture. Applied Microbiology
and Biotechnology 34:313-315.

References
181
Axelesson A., Sisak C., Westrin B.A., Szajani B (1994) Diffusion characteristics of
a swelling gel and its consequences for bioreactor performance. Journal of
Biochemical Engineering. 55:B35-B39.
Ayerst G (1969) The effects of moisture and temperature on growth and spore
germination in some fungi. Journal of Stored Product Research 5:127-141.
Bandyopadyay B., Humphrey AE., Taguchi H (1967) Dynamic measurement of
the volumetric oxygen transfer coefficient in fermentation systems. Biotechnology
and Bioengineering 38:533-38.
Baxter CJ (1997) Influences of some environmental factors on fungal growth and
production of aflatoxins in solid state fermentation. Journal of Scientific and
International Research 55:365-72.
Baxter CJ., Magan N., Lane B., Wildman HG (1998) Influence of water activity
and temperature on in vitro growth of surface culture of a Phoma sp. and
production of the pharmaceutical metabolites, squalestatins S1 and S2. Applied
Microbiology and Biotechnology 49:328-332.
Becerra M., Baroli B., Fadda AM., Blanck MJ., González SMI (2001) Lactose
bioconversion by calcium-alginate immobilization of Kluyveromyces lactis cells.
Enzyme and Microbial Technology 29:506-512.
Belli N., Ramos AJ., Sanchis V., Marin S (2004) Incubation time and water activity
effects on ochratoxin A production by Aspergillus section Nigri strains isolated
from grapes. Letters in Applied Microbiology 38:72-77.
Berger R., Rühlemann I (1988) Stable ionotropic gel for cell immobilization using
high molecular weight pectin acid. Acta Biotechnologica 5:401-405.
Bergstrom JD., Dufresne C., Bills GF., Nallin-Omstead., Byrne K (1995)
Discovery, biosynthesis, and mechanism of action of zaragozic acids: Potent
inhibitor of squalene synthase. Annual Review of Microbiology 49:607-639.
Bergstrom JD., Kurtz MM., Rew DJ., Amend AM., Karkas JD., Bosteador RG.,
Bansal VS., Dufresne C., Van Middlesworth FL., Hensen OD., Liesch JM.,
Zink DL., Wilson KE., Onishi J., Milligan JA., Bills G., Kaplan L., Naillin
Omstead, M., Jenkins RG., Huang L., Meinz MS., Quinn L., Burg RW.,
Kong YL., Mochales S., Mojena M., Martin I., Pelaez F., Diez M., Alberts
AW (1993) Zaragozic acids: a family of fungal metabolites that are picomolar
competitive inhibitors of squalene synthase. Proceedings of the National Academy
of Science of the United States of America 90:80-84.
References
182
Betina V (1994) Physiological regulation of secondary metabolism, In Betina V (Ed),
Bioactive secondary metabolite of microorganismsProcess in industrial
microbiology, Vol. 30. Elsevier Science, Amsterdam & New York, pp. 66-80.
Blows WM., Foster G., Lane SJ., Nobel D., Piercey JE., Sidebootom J., Webb G
(1994) The squalestatins, Novel Inhibitor of Squalene Synthase Produced by a
spices of Phoma. Journal of Antibiotics 47:740-754.
Bobowicz-Lassocika T., Grajek W (1995) Changes in protein secretion of
Aspergillus niger caused by the reduction of the water activity by potassium
chloride. Acta Biotechnologica 15:277-287.
Brückner B., and Blechschmidt D (1991) The gibberellin fermentation. Critical
Review in Biotechnology 11:163-192
Bruno-Bárcena JM., Lucca ME., Siñeriz., and Ramón D (2002) pH regulation of
enzyme production in Aspergillus nidulans growing in aerobic batch fermentation.
Biotechnology Letters 24:576-572.
Buchanan RL. and Phillips JG (1990) Response surface model for predicting the
effects of temperature, pH, sodium chloride content, sodium nitrate concentration
and atmosphere on the growth of Listeria monocytogenes. Journal of Food
Protection 53:370-376.
Büchs J., Maier U., Milbradt C., Zoels B (2000) Power consumption in shaking
flask on rotatory shaking machines : I. Power consumption measurements in
unbaffled flasks at low liquid viscosity. Biotechnology and Bioengineering
68:594-601.
Büchs J., Maier U., Milbradt C., Zoels B (2000a) Power consumption in shaking
flask on rotatory shaking machines : II. Nondimensional description of specific
power consumption and flow regimes in unbaffled flask at elevated liquid
viscosity. Biotechnology and Bioengineering 68:589-593.
Calam CT (1987) Process development in antibiotic fermentations. In: Cambridge
studies in biotechnology 4. Cambridge: Cambridge University Press.
Castro PML., Hayter PM., Ison AP., Bull AT (1992) Application of statistical
design to the optimization of culture medium for recombinant interferon-gamma
production by Chinese hamster ovary cells. Applied Microbiology and
Biotechnology 38:84-90.
Charelt S., Gillet F., Villareal ML., Barbotin JB., Fliniaux MA., Nava-Saucedo
JE (2000) Immobilization of Solanum chrysotrichum plant cells within Ca-
References
183
alginate gel beds to produce an antimycotic spirostanol saponin. Plant Physiology
and Biochemistry 38:875-880.
Chen YC, Yin BD, Lin SC, Hsu WH (1999) Production of N-carbamoyl-D-
hydroxyphenylglycine by D-hydantoinase activity of recombinant Escherichia
coli. Process Biochemistry 35:285-290.
Chisti MY (1989) Chapter VI: Advances in gas-liquid mass transfer. In: Chisti (Ed.).
Airlift bioreactors. Elsevier Science. London, p. 345.
Christensen T, Woeldike H, Boel E, Mortinsen SB, Hjortshoej K, Thim L,
Hansen MT (1988) High level expression of recombinant gene in Aspergillus
oryzae. Bio/Technology 6:1419-22.
Conesa A., Punt PJ., van Luijk N., van den Hondel CAMJJ (2001) The secretion
pathway in filamentous fungi: A biotechnological view. Fungal Genetics and
Biology 33:155-171.
Connors N., Prevoznak R., Brix T., Sleeley A., Gbewonyo K., Greasham.,
Salomon P (1995) Effects of medium sterilization on the production of zaragozic
acids by the fungus Leptodontidium elatius. Journal of Industrial Microbiology
15:503-508.
Cuero RG., Smith JE. and Lacey J (1987) Interaction of water activity, temperature
and substrate on mycotoxin production by Aspergillus flavus, Penicillium
viridicatum and Fusarium graminearum in irrigated grains. Transactions of the
British Mycological Society 89:221-226.
Cullen D., Gray GL, Wilson LJ., Hayenga KJ, Lamsa MH., Rey MW., Norton S.,
Berka RM (1987) Controlled expression and secretion of bovine chymosin in
Aspergillus nidulans. Bio/Technology 5:369-76.
Cuppers HGAM., Oomes S., Brul S (1997) A model for the combined effects of
temperature and salt concentration on growth rate of food spoilage moulds.
Applied and Environmental Microbiology 63:3764-3769
Dawson MJ., Farthing JE., Marshall S., Middleton RF., O’Neill, MJ.,
Shuttleworth, A., Stylli C., Tait RM., Taylor PM., Wildman HG., Buss AD.,
Langley D., Hayes, MV (1991) The squalestatins, novel inhibitors of squalene
synthase produced by a species of Phoma I. Taxonomy, fermentation, isolation,
physico-chemical properties and biological activity. Journal of Antibiotics
45:639-645.
References
184
Demain AL (1992) Microbial secondary metabolism: a new theoretical frontier for
academia, a new opportunity for industry. In Chadwick DJ and Whelan (ed.),
Secondary metabolites: their function and evolution. John Wiley & Sons,
Chichester, U.K, p. 3
Dominguez FC., Quiroz JA., Carbal JMS., Fonseca LP (2000) The influence of
cultura conditions on mycelial structure and cellulase production by Trichoderma
reesei Rut C-30. Enzyme and Microbial Technology 26:394-401.
Dufresne C., Wilson KE., Singh SB., Zink DL., Bergstrom JD., Polishook JD.,
Meinz M., Huang L., Silverman KC., Lingham R (1993) Zaragozic acids D and
D2: potent inhibitors of squalene synthase and of ras farnesyl-protein transferase.
Journal of Natural Products 56:1923-1929.
Dufresne C., Wilson KE., Zink DL., Smith J., Bergstrom JD., Kurtz M, Rew D.,
Naillin Omstead M., Jenkins R., Bartizal K., Trainor C., Billis G., Meinz M.,
Huang L., Onishi J., Milligan J., Mojena M., Pelaez F (1992) The isolation and
structure elucidation of zaragozic acid C, a novel potent squalene synthase
inhibitor. Tetrahedron 48:10221-10226.
During K., Porsh P., Mahn., Brinkman O., Giffers W (1999). The non-enzymatic
microbial activity of lysozymes. FEBS Letters 449:93-100.
Emregul E., Sungur S., Akbulut U (1995) Investigation on carrier systems fro
alpha-amylase enzyme immobilization source. Journal Macromolecular Science
Pure and Applied Chemistry A32:301-308.
Enfors SO (1992) Control of in vivo proteolysis in the production of recombinant
proteins. Trends in Biotechnology 3:31-315.
Escamilla EM., Dendooven L., Magaña, IP., Parra R., De la Torre M (2000)
Optimization of gibberellic acid production by immobilized Gibberella fujikuroi
mycelium in fluidized bioreactors. Journal of Biotechnology 76:147-155.
Evans PJ., Wang HY (1984) Pigment production form immobilized Monascus sp.
utilizing polymeric resin adsorption. Applied and Environmental Microbiology
42:1323-1326.
Franson MAH (1995) Standard method for the examination of water and wastewater.
19th Edition. US Environmental Protection Agency USA, pp. 59345-59378.
Furuhashi K., Takagi M (1984) Optimization of medium for the production of 1,2-
epoxyteradecane by Nocardia coralline B-276. Applied Microbiology and
Biotechnology 20:6-9.
References
185
Gbewonyo K., Wang DIC (1983) Enhancing gas-liquid mass transfer rates in non-
newtonian fermentations by confining mycelial growth to microbeads in bubble
column. Biotechnology and Bioengineering 25:2873-2887.
Gmeiner P., Nahálka J., Vikartovská A., Nahálkivá J., Tomáška M., Šturdík E.,
Markovič O., Malovíková A., Zatková I., Ilavskỳ M (1996) Calcium pectate
gel could be a better alternative to calcium alginate gel in multiple applications of
immobilized cells. Wijffels RH, Buitelaar RM, Bucke C, Tramper J (Eds).
Immobilized cells: basics and applications. Elsevier Science. London, pp. 73-83.
Gmeiner PG (1992) Enzyme engineering. In: P.G. Gmeiner (ed.), Ellis Horwood
series in biochemistry and biotechnology. Alfa Publishers, London, pp. 30-45.
Gencheva V., Dimova TS (1984) Biosynthesis of giberellins. II. Influence of the
quantity and age of inoculum on the biosynthesis of gibberellins from the strain
Fusarium moniliforme IM-11. Acta Microbiologica Bulgarica 14:74-79.
Gervais P., Belin JM., Grajek W., Sarrette M (1988) Influence of water activity on
aroma production by Trichoderma viride TS growing on a solid substrate. Journal
of Fermentation Technology 4:403-7.
Gervais P., Molin P (2003) The role of water in solid-state fermentation.
Biochemical Engineering Journal 13:85-101.
Gibson AM., and Hocking AD (1997) Advances in the predictive modelling of
fungal growth in food. Trends in Food Science and Technology 8:353-358.
Gibson AM., Baranyi J., Pitt JI., Eyles MJ., Roberts TA (1994) Predicting fungal
growth: the effect of water activity on Aspergillus flavus and related species.
International Journal of Food Microbiology 23:419-431.
Gouka RJ., Punt PJ., Hessing JGM., van den Hondel CAMJJ (1996) Analysis of
heterologous protein production in defined recombinant Aspergilluis awamori
strains. Applied and Environmental Microbiology 62:1951-1957.
Gouka RJ., Punt PJ., van den Hondel CAMJJ (1997) Efficient production of
secreted proteins by Aspergillus: progress, limitations and prospects. Applied and
Microbiology Biotechnology 47:1-11.
Gwynne DI., Buxton FP., Williams SA., Garven S., Davies RW (1987) Genetically
engineered secretion of active human interferon and a bacterial endoglucanase
from Aspergillus nidulans. Bio/Technology 5:713-19.

References
186
Hayashi T., Matsubara M., Kurimoto E., Nohara D., Sakai T (1993) Refolding of
subtilisin Bpn achieved almost quantitatively by covalent immobilization o fan
agarose gel. Chemical Pharmaceutical Bulletin 4:2063-2065.
Hilge-Rotmann B., Rehm H-J (1990)Comparison of fermentation properties and
specific enzyme activities of free and calcium-alginate-entrapped Saccharomyces
cerevisiae. Applied Microbiology and Biotechnology 33:54-58.
Holmquist GU., Walker HW., Stahr HM (1983) Influence of temperature pH and
water activity and antifungal agents on growth of Aspergillus flavus and A.
parasiticus. Journal of Food Science 48:778-782.
Horner KJ., Anagnostopoulos GD (1973) Combined effects of water activity, pH
and temperature on the growth and spoilage potential of fungi. Journal of Applied
Bacteriology 36:427-436.
Huang L., Onishi J., Milligan J., Mojena M., Pelaez F (1992) The isolation and
structure elucidation of zaragozic acid C, a novel potent squalene synthase
inhibitor. Tetrahedron 48:10221-10226.
Humphrey A (1998) Shake flask to fermentor: what have we learned? Biotechnology
Progress 14:3-7
International Commision of Microbiological Specifications for Foods (ICMSF)
(1993) Toxigenic fungi. In: Micro-organsims in foods, 5: Characteristics of
microbial pathogens, edited by the International Commission of Microbiological
Specifications for Foods. James & James, London, pp.445-448.
Jain D., Buckland BD (1988) Scale-up of the efrotomycin fermentation using a
computer–controlled pilot plant. Bioprocess and Biosystems Engineering 3:399-
402.
Jeenes DJ., MacKenzie DA., Roberts IN., Archer DB (1991) Heterologous protein
production by filamentous fungi. Biotechnology and Genetic Engineering Review
9:327-67.
Jianlong W., Liping H., Hanchang S., Yi Q (2001) Biodegradation of quinoline by
gel immobilized Burkholderia sp. Chemosphere 44:1041-1046.
Kemp TL., Karim MN., Linder JC., Tengerdy RP (1989) Response surface
optimization of Lactobacillius plantarum batch growth. Biotechnology Letters
11:817-820.
Krishna MI., Urseanu JM., van Baten JM., Ellenberger J (1999) Influence of
scale on the hydrodynamics of bubble columns operating in the churn-turbulent

References
187
regime: experiment vs. Eulerian simulations. Chemical Engineering Science
54:4903-4911.
Kumar PKR., Lonsane BK (1988) Immobilized growing cells of Giberella fujikuroi
P-3 for the production of gibberellic acid and pigment in bath and semi-
continuous cultures. Applied Microbiology and Biotechnology 28:537-542.
Lai L-ST., Pan C-C., Tzeng B-K (2003) The influence of medium design of
lovastatin production and pellet formation with a high-producing mutant of
Aspergillus terreus in submerged cultures. Process in Biochemistry 38:1317-1326.
Leach CK (1992) 1.1 The commercial context of bioreactor use. In: van Dam-Mieras,
de Jeu WH., de Vries J., Currell RB., James JW., Leach JW and Patmore RA
(Eds.) Operational modes of bioreactors. Butterworth-Heinemann Ltd. Jordan
Hill, Oxford, pp. 4-7.
Lee JM (1992) Introduction. In: Stewart (Ed.). Biochemical engineering. Prentice-
Hill, Inc. A Simon & Schuster Company. Englewood Cliffs, New Jersey, pp.
74-150.
Lee MT., Chen WC., Chou CC (1997) Medium improvement by orthogonal array
designs for cholesterol oxidase production by Rhodococcus equi No. 23. Process
in Biochemistry 32:697-703.
Lee S-L., Chen W-C (1997) Optimization of medium composition for the production
of glucosyltransferase by Aspergillus niger with response surface methodology.
Biotechnology and Bioengineering 21:436-440.
Lee YK., Chen DC., Chauvatcharin S., Seki S., Yoshida T (1995) Production of
Monaqscus pigment by solid-liquid state culture method. Journal Fermentations
and Bioengineering 79:516-518.
Li Y., Chen J., Lun SY., Rui XS (2001) Efficient pyrubate production by a multi-
vitamin auxotroph of Torulopsis glabrata: key role and optimization of vitamin
levels. Applied Microbiology and. Biotechnology. 55:680-685.
Lin CF (1973) Isolation and culture conditions of Monascus sp. for the production of
pigment in a submerged culture. Journal of Fermentation Technology 51:407-
414.
Lin LW., Feldberg RS., Clark EDB (1993) Kinetics of cell growth and
heterologous glucoamylase production in recombinant Aspergillus nidulans.
Biotechnology and Bioengineering 41:273-279.
References
188
Lin TF., Demain AL (1991) Effect of nutrition of Monascus sp. on formation of red
pigments. Applied Microbiology and Biotechnology 36:70-75.
Long-Shan TL., Chieg-Chang P., Bo-Kun T (2003) The influence of medium
design on lovastatin production and pellet formation with high-producing mutant
of Aspergillus terreus in submerged cultures. Process in Biotechnology 38:1317-
1326.
MacKenzie DA., Gendron LCG., Jeenes DJ., Archer DB (1994) Physiological
optimizarion of secreted protein production by Aspergillus niger. Enzyme and
Microbial Technology 16:276-280.
Magan N (1997) Fungi in extreme environments. The Mycota IV. Environmental and
Microbial Relationships. Wicklow/Soderstrom (Eds.). Springer-Verlag Berlin
Heidelberg 7:99-114.
Magan N., Lacey J (1984) Effect of temperature and pH on water relations of field
and storage fungi. Transactions of the British Mycological Society 82:71-81
Magan N., Sanchis V., Aldred D (2004) Role of spoilage fungi in seed deterioration.
Chapter 28. In: Fungal Biotechnology in Agricultural, Food and Environmnetal
Applications. DK Aurora Marcell Dekker, pp.311-323.
Mainwaring DO., Wiebe MG., Robson GD., Golcrick M., Jeenes DJ., Archer
DG., Trinci APJ (1999) Effect of pH on hen egg white lysozyme production and
evolution of a recombinant strain of Aspergillus niger. Journal of Biotechnology
75:1-10.
Marin S., Sanchis V., Magan N (1995) Water activity, temperature, and pH effects
on growth of Fusarium moniliforme and Fusarium proliferatum isolates from
maize. Canadian Journal of Microbiology 41:1063-70.
Marin S., Sanchis V., Saenz R., Ramos AJ., Vinas I., Magan N (1998) Ecological
determinants for germination and growth of some Aspergillus and Penicillium sp.
from maize grain. Journal of Applied Microbiology 84:25-36.
Martinsen A., Skjåk-Bræk G., Smidsrød O (1989) Alginate as immobilization
material: I. Correlation between chemical and physical properties of alginate gel
beads. Biotechnology and Bioengineering 33:79-89.
McMeekin TA., Chandler RE., Doe PE., Garland CD., Olley J., Putro S.,
Ratkowsky DA (1987) A model for combined effect of temperature and salt
concentration/ water activity on the growth rate of Staphylococcus xylosus.
Journal of Applied Bacteriology 62:453-550.
References
189
Mitchell D., Aldred D., Magan N (2003) Impact of ecological factors on the growth
and ochratoxin A production by Aspergillus carbonarius from different regions of
Europe. Aspects of Applied Biology 68:109-116.
Mitchell D., Parra R., Aldred D., Magan N (2004) Water and temperature relations
of growth and ochratoxin A production by Aspergillus carbonarius from grapes in
Europe and Israel. Journal of Applied Microbiology 97:439-445.
Mizrahi S., Ramon O., Silberberg-Bouhnik M., Eichler S., Cohen Y (1997)
Scaling approach to water sorption isotherms of hydrogels and foods.
International Journal of Food Science and Technology 32:95-105.
Montes MC., Magaña IP (1991) ∆′-Dehydrogenation of steroids by Arthrobacter
simplex immobilized in calcium polyglacturonate beads. Journal of Industrial
Microbiology 8:259-264.
Murphy R., Power RFG (2001) Expression of Saccharomyces cerevisiae
endochitinase in Aspergillus awamori. Biotechnology Letters 23:903-906.
Nandakumar MP., Tocaj A., Mattiasson B (1999) Use of micro-expanded bed
containing immobilized lysozyme for cell disruption in flow injection analysis.
Bioseparation 8:247-254.
Mussenden P., Keshavarz T., Saunders G., Bucke C (1993) Physiological studies
related to the immobilization of Penicillium chrysogenum and penicillin
production. Enzyme and Microbial Technology 15:2-7.
Nava-Saucedo JE., Audras B., Jan S., Bazinet CE., Barbotin JN (1994) Factors
affecting densities, distribution and growth pattern of cells inside immobilization
supports. FEMS Microbiology Reviews-Federation of European Microbiological
Society 14:93-98.
Northolt MD., Bullerman LB (1982) Prevention of mould growth and toxin
production through control of environmental conditions. Journal of Food
Protection 45:519-526.
O’Donnell D., Wang MG., Xu J., Ridgway D., Moo-Young M (2001) Enhanced
heterologous protein production in Aspergillus niger through pH control of
extracellular protease activity. Biochemical Engineering Journal 8:187-193.
Ohmori Y., Kurokawa Y (1994) Preparation of fibre-entrapped enzyme using
cellulose acetate-titanium-iso-peroxide composite as gel matrix. Journal of
Biotechnology 33:205-209.
References
190
Osman HM., El-Didrawy D., Debever JM (1995) The inhibitory effect of HEWL
on growth of some pathogenic and spoilage bacteria. Alejandria Journal of
Agricultural Research 40:169-176
Owen RO., Chase L (1997). Direct purification of lysozyme using continuous
counter-current expanded bed adsorption. Journal of Chromatography A 757: 41-
49.
Palsson E., Nandakumar B., Mattiasson P., Larsson O (2000). Miniaturized
expanded-bed column with low dispersion suitable for fast flow-ELISA analysis.
Biotechnology Letters 22:245-250.
Pan J., Xu J-H (2003) Marked enhancement of epoxide hydrolase production form
Trichosporon loubierii ECU 1040 by substrate induction and feed-batch
fermentation. Enzyme and Microbial Technology 33:527-533
Panda T., Sushma R., Nair R., Kumar MP (2004) Regulatiuon of syntesis of the
pectolytic enzymes of Aspergillus niger. Enzyme Microbial Technology 34:466-
473.
Papagianni M (1999) Fungal morphology. In: Kristiansen B, Matteey M, Linden J,
editors. Citric acid biotechnology. Taylor and Francis. London, pp. 69-84.
Papagianni M., Moo-Young M (2002) Protease secretion in glucoamylase producer
Aspergillus niger cultures: fungal morphology and inoculum effects. Process
Biochemistry 37:1271-1278.
Parra R., Magan N (2004) Modelling the effect of temperature and water activity on
growth of Aspergillus niger strains and applications for food spoilage moulds.
Journal of Applied Microbiology 35:232-237.
Parra R., Aldred D., Archer D & Magan N (2004a) Water activity, and temperature
modify growth and spore production of wild type and genetically engineered
Aspergillus niger strains. Enzyme and Microbial Technology 97:429-438.
Parra R., Aldred D., Archer D., Magan N (2004b) Effect of Water Activity,
Inoculum Size and Autoclaving Procedure on Lysozyme Production by Two
Genetically Engineered Aspergillus niger Strains. Biotechnological Progress.
Submitted.
Parra R., Magan N (2004c) Medium optimization for the production of secondary
metabolite squalestatin S1 by Phoma sp. combining orthogonal design and
response surface methodology. Applied and Environmental Microbiology.
Submitted.
References
191
Parra, R., Aldred, D., Archer., Magan N (2004d) A novel immobilized design for
the production of the heterologous protein lysozyme by a genetically engineered
Aspergillus niger strain. Applied Microbiology and Biotechnology. In Press
Pashova S., Slokoska L., Krumova E., Angelova M (1999) Induction of
polymethylgalacturonase . biosynthesis by immobilized cells of Aspergillus niger.
Enzyme and Microbial Technology 24:535-540.
Pitson SM., Seviour RJ., McDougall (1996) Proteolytic inactivation of an
extracellular (1-3)-β-glucanase from the fungus Acremonium persicinum in
associated with growth neutral or alkaline medium pH. Microbiological Letters
145:287-293.
Pitt JI., Hocking AD (1977) Influence of solute and hydrogen ion concentration on
the water relations of some xerophilic fungi. Journal of General Microbiology
101:35-40.
Prapulla SG., Jacob Z., Chad N., Rajalkshmi D., Karanth NG (1992)
Maximization of lipid production by Rhodotorula gracilis CFR-1 using response
surface methodology. Biotechnology and Bioengineering 40:965-970.
Punt PJ., Van Biezen N., Conesa A., Alberts A., Mangnus J., Van den Hondel C
(2002) Filamentous fungi as cell factories for heterologous protein production.
Trends in Biotechnology 22:200-6.
Punt PJ., van den Hondel CAMJJ (1995) Molecular genetic strain improvement
for the over-production of fungal proteins by filamentous fungi. Applied
Microbiology and Biotechnology 43:195-205.
Ramos AJ., Labernia N., Martin S., Sanchis V., Magan N (1998) Effect of
temperature on growth and ochratoxin production by three strains of Aspergillus
ochraceus on a barley extract medium and on barley grains. International Journal
of Food Microbiology 44:133-140.
Ratkowsky DA., Lowry RK., McMeeking TA., Stokes AN., Chandler RE (1983)
Model for bacterial growth rate throughout the entire biokinetic temperature
range. Journal of Bacteriology 154:1222-1226.
Roserio JC, Esgalhado ME., Amaral Collado MT., Enero AN (1992) Medium
development for xanthan production. Process Biochemistry 27:167-175.

References
192
Rosso L., Lobry JR., Bajard S., and Flandrois JP (1995) Convenient model to
describe the combined effects of temperature and pH on microbial growth.
Applied and Environmental Microbiology 61:610-616.
Roy G., Sauve R (1987) Effect of anisotonic media on volume, ion and amino acid
content and membrane potential of kidney cells (MDCK) in culture. Journal of
Membrane Biology 100:83-96.
Rühlemann I., Richter K., Berger R (1990) Ethanolic fermentation with
Saccharomyces cerevisiae cells immobilized in pectate gel. Acta Biotechnologica
10:55-61.
Ruzicka MC., Drahoš J., Fialová M., Thomas NH (2001) Effect of bubble column
dimensions on flow regime transition. Chemical Engineering Science 56:35-53.
Ruzicka MC., Drahoš J., Mena PC., Teixeira JA (2003) Effect of viscosity on
homogeneous-heterogeneous flow regime transition in bubble columns. Chemical
Engineering Journal l96:15-22.
Sakiyama T., Chu C.H., Fuji T., Yano T (1993) Preparation of a polyelectrolite
complex gel from chitosan and kappa-carrageenan and its ph-sensitivity swelling.
Journal of Applied Polymer Science 50:2021-2025.
Samaranayke YH., MacFarlane TW., Aitchison TC., Samaranayke LP (1993).
The in vivo HEWL susceptibility of Candida albicans cultured in carbohydrate-
supplemented media. Oral Microbiology and Immunology 8:177-181.
Sanchez OR., Pasantes-Morales H., Lazaro A., Cereijido M (1991) Osmolarity-
sensitivity release of free amino acids from cultured kidney cells (MDCK).
Journal of Membrane Biology 21:1-9.
Sanchis V., Magan N (2004) Environmental profiles for growth and mycotoxin
production. In: Mycotoxins in food: detection and control. N. Magan and M.
Olsen (Eds.). Woodhead Publishing Ltd.
Sathosh A., Ogawa H., Satomura Y (1976) Regulation of N-acetylk-anamycin
amidohydrolase in the idophase in Kanamycin fermentation. Agricultural Biology
and Chemistry 40:191-196.
Sato S., Murakata T., Ochifuji M., Fukushima M., Suzuki T (1994) Development
of immobilised enzyme entrapped within inorganic matrix and its catalytic activity
in organic medium. Journal of Chemical Engineering Japan 27:732-736.

References
193
Sautour M., Dantigny P., Divies C., Bensoussan M (2001) A temperature-type
model for describing the relationship between fungal growth and water activity.
International Journal of Food Microbiology 67:63-69.
Schügerl K, Gerlach, Siedenberg D (1996) Influence of the process parameters on
the morphology and enzyme production of Aspergilli. Advances in Biochemical
Engineering/Biotechnology 60:197-264.
Scott WJ (1957) Water relations of food spoilage microorganisms. Advances in Food
Research. 7:83-127
Sarrà M., Casas C., Gódia F. (1997) Continuous production of hybrid antibiotic by
Streptomyces Lividans TK21 pellets in a three-phase fluidized bed-bioreactor.
Biotechnology and Bioengineering 6:601-610.
Shreve GS., Vogel TM (1993) Comparison of substrate utilization and growth
kinetics between immobilized and suspended Pseudomonas cells. Biotechnology
and Bioengineering 41:370-379.
Skjårk-Bræk G., Grasdalen H., Smidsrød (1989) Inhomogeneous polysaccharide
ion gels. Carbohydrate Polymers 10:31-54.
Swift RJ., Karandikar A., Punt AM., van den Hondel CAMJJ., Robinson GD.,
Trinci APJ., Wiebe MG (2000) The effect of organic nitrogen sources on
recombinant glucoamylase production by Aspergillus niger in chemostat culture.
Fungal Genetics and Biology 31:125-133.
Tomáška M., Gmeiner P., Materín I., Šturdík A., Handríková (1995) Calcium
pectate gel beads for cell entrapment: a study on the stability of Kluyveromyces
marxianus whole-cell lactose entrapped in hardened calcium pectate and calcium
alginate gels. Applied Biotechnology and Biochemistry 21:347-356.
Trinci APJ (1969) A kinetic study of the growth of Aspergillus nidulans and other
fungi. Journal of Genetic Microbiology 57:11-24.
Trinci APJ., Collinge A (1973) Influence of L-sorbose on the growth and
morphology of Neurospora crassa. Journal of General Microbiology 78:179-192.
Tucker KG., Thomas CR (1992) Mycelial morphology: the effect of spore inoculum
level. Biotechnology Letters 14:1071-4.
Turnbull IF., Rand K., Willets NS., Hynes MJ (1989) Expression of the
Escherichia coli enterotoxin subunit B gene in Aspergillus nidulans.
Bio/Technology 7:169-74.

References
194
Ujam LB., Clemmitt HA., Chase A (2000) Cell separation by expanded bed
adsorption: use of ion exchange chromatography for the separation of E. coli and
S. cerevisiae. Bioprocess Engineering 23:245-250.
Upshill A., Kumar AA., Bailey MC., Parker MD., Favreau MA., Lewison KP.,
Joseph ML., Maraganore JM., McKnight GL (1987) Secretion of active human
tissue plasminogen from the filamentous fungus Aspergillus nidulans.
Bio/Technology 5:1301-1304.
van den Hombergh JPTW., van de Vondervoort PJI., van der Heijden NCBA.,
Visser J (1995) New protease mutants in Aspergillus niger result in strongly
reduce in vitro degradation of target proteins; genetical and biochemical
characterization of seven complementation groups. Current Genetics 28:299-308.
van Hartingsveldt W., Marttern IE., van Zeijl CMJ., Pouwels PH., van den
Hondel, CAMJJ (1987) Development of a homologous transformation system for
Aspergillus niger based on the pyrG gene. Journal of Molecular and General
Genetics 206:71-75.
van Suijdam JC., Kossen, NWF., Paul PG (1980) An inoculum technique for the
production of fungal pellets. European Journal of Applied Microbiology and
Biotechnology 10:211-221.
Van’t Riet K (1979) Review of measuring methods and results in non viscous gas-
liquid mass transfer in stirred vessels. Industrial and Engineering Chemical
Process Design and Development 18:357-364.
Vandu CO., Krishna R (2004) Influence of scale on the volumetric mass transfer
coefficients in bubble columns. Chemical Engineering Process 43:575-579.
Vassileva M., Azcon R., Barea JM., Vassilev N (1998) Application of an
encapsulated filamentous fungus in solubilization of inorganic phosphate. Journal
of Biotechnology 63:67-72.
Vecht-Lifshitz SE., Magdassi S., Braun S (1990) Pellet formation and cellular
aggregation in Streptomyces tendae. Biotechnology and Bioengineering 35:890-
896
Verdoes JC., Punt PJ., van den Honel CAMJJ (1995). Molecular genetic strain
improvement for the over-production of fungal proteins by filamentous fungi.
Applied Microbiology and Biotechnology 43:195-205.

References
195
Vermeer DJ., Krishna R (1981) Hydrodynamics and mass transfer in bubble
columns in operating in the churn-turbulent regimen. Industrial and Engineering
Chemical Process Design and Development 20:475-482.
Vílchez C., Garbayo I., Markvicheva E., Galván F., León R (2001) Studies on the
suitability of alginate-entrapped Chlamydomonas reinhardtii cells for sustaining
nitrate consumption processes. Bioresources Technology 78:55-61.
Wang DIC., Cooney CL., Demain AL., Dunnill., Humphrey., Lilly MD (1979) In:
Fermentation and Enzyme Technology. Wiley. New York, pp 138-156.
Wang J., Qian Y (1999) Microbial degradation of 4-chlorophenol by microorganisms
entrapped in carrageenan-chitosan gels. Chemosphere 38:3109-3117
Ward M., Wilson LJ., Kodama KH., Rey MW., Berka RM (1990) Improved
production of chymosin in Aspergillus by expression as a glucoamylase-chymosin
fusion. Bio/Technology 8:435-40.
Weiland P (1984) Influence of draft tube diameter on operator behaviour on air-lift
loop reactor. German Chemical Engineering 7:374-385.
Wheeler KA., Hocking AD., Pitt JI (1988) Water relations of some Aspergillus
species isolates for dried fish. Transactions of the British Mycological Society
91:631-637.
White MD., Shalita ZP., Marcus D., Reuveny S (1990) A systematic routh fro
optimization of media and growth conditions. In White M.D., Reuveny, S.,
Shafferman, A (ed.), 34th Oholo Conference, Biotechnologicals for recombinant
microorganisms and animal cells: Production and Recovery. Eilat, Israel,
pp.111-116
Wiebe MG (2003) Stable production of recombinant proteins in filamentous fungi-
problems and improvements. Mycologist 17:140-144.
Wiebe MG., Karandikar A., Robson GD., Trinci APJ., Candia JLF., Trappe S.,
Wallis G., Rinas U., Derkx PMF., Madrid SM., Sisniega H, Faus I., Montijn
R., van den Hondel CAMJJ., Punt PJ (2001) Production of tissue plasminogen
activator (t-PA) in Aspergillus niger. Biotechnology and Bioengineering 76:164-
174.
Wiesner P., Casolari A (1983) Water activity and radial growth rate in Aspergillus
strains. Industrial Conserve 58:82-85.

References
196
Wills NK., Millinoff LP., Crowe WE (1991) Na+ channel activity in cultured renal
(A6) epithelium: regulation by solution osmolarity. Journal of Membrane Biology
121:79-90.
Wu W., Sidhoum M., Delancey GB (1994) Diffusion of acetophenone and
phenethyl alcohol in the calcium-alginate-baker’s yeast-hexane system.
Biotechnology and Bioengineering 44:1217-1227.
Wu Y., Hobbs MW (1987) Quality Engineering: Product & Process Design
Optimization In: Taguchi GM, editor. American Supplier Institute Inc, Derbon,
Michigan USA, pp.3-469.
Xu C-P., Kim, S-W., Hwang H-J., Choi J-W., Yun J-W (2003) Optimization of
submerged culture conditions for mycelial growth and exo-biopolymer production
by Paecilomyces tenuipes C240. Process Biochemistry 38:1025-1030.
Yadwad VB., Wilson S., Ward OP (1996) Effect of culture conditions and induction
strategies on production of human interleukin-6 by a recombinant Aspergillus
nidulans strain. Mycological Research 100:356-360.
Zheng XF., Kobayashi Y., Takeuchi M (1998) Construction of a low-serine-type-
caroxypeptidase-producing mutant of Aspergillus oryzae by the expression of
antisense RNA and its use as a host for heterologous protein secretion. Applied
Microbiology and Biotechnology 49:39-44
Zwietering M.H., Wit J.C., Cuppers HGAM., Van’t Riet, K (1994) Modelling of
bacterial growth with shifts in temperature. Applied and Environmental
Microbiology 60:204-213.
Top Related