


Languages
Pages
Legal


Scholars' Mine Scholars' Mine
Masters Theses Student Theses and Dissertations
Summer 2015
Optimal techno-economic sizing of wind/solar/battery hybrid Optimal techno-economic sizing of wind/solar/battery hybrid
microgrid system using the forever power method microgrid system using the forever power method
Sami Hamed Alalwani
Follow this and additional works at: https://scholarsmine.mst.edu/masters_theses
Part of the Electrical and Computer Engineering Commons
Department: Department:
Recommended Citation Recommended Citation Alalwani, Sami Hamed, "Optimal techno-economic sizing of wind/solar/battery hybrid microgrid system using the forever power method" (2015). Masters Theses. 7427. https://scholarsmine.mst.edu/masters_theses/7427
This thesis is brought to you by Scholars' Mine, a service of the Missouri S&T Library and Learning Resources. This work is protected by U. S. Copyright Law. Unauthorized use including reproduction for redistribution requires the permission of the copyright holder. For more information, please contact [email protected].
OPTIMAL TECHNO-ECONOMIC SIZING OF WIND/SOLAR/BATTERY HYBRID
MICROGRID SYSTEM USING THE FOREVER POWER METHOD
by
SAMI HAMED ALALWANI
A THESIS
Presented to the Faculty of the Graduate School of the
MISSOURI UNIVERSITY OF SCIENCE AND TECHNOLOGY
In Partial Fulfillment of the Requirements for the Degree
MASTER OF SCIENCE IN ELECTRICAL ENGINEERING
2015
Approved by
Dr. Jonathan W. Kimball, Advisor
Dr. Mehdi Ferdowsi
Dr. Pourya Shamsi

2015
Sami Alalwani
All Rights Reserved
iii
ABSTRACT
Advancement in power electronics, energy storage, control, and renewable energy
sources has led to the use of integrated renewable energy sources in islanded microgrids
(MG). Also, the uses of integrated renewable energy sources have become more
technically applicable, more economically feasible, and more environmentally friendly
than conventional sources. As a result, electrification of rural villages using renewable
energy technologies has started to become widely adopted around the world. Since
generating power from renewable energy sources is highly intermittent and difficult to
predict, the use of proper energy storage technology is important to eliminate mismatches
between the load demand and generation. Obtaining proper unit sizing for energy
sources and storage is critical in determining the cost and reliability of the system. It is
challenging to properly optimize the size of hybrid micro-sources for islanded MGs with
minimum capital and operational cost while still achieving the targeted availability of the
power supply. In this research, typical meteorological data is used with the Forever
Power method to generate all possible combinations of PV modules and wind turbines
along with the corresponding availability of the power supply. The goal of the study is to
allow the designer of the system to select the size that best fits the targeted availability of
the power supply with the most economical cost. As a case study, this method has been
applied to an isolated MG for four homes in a rural area outside of Yanbu City, Saudi
Arabia. A techno-economic analysis was applied using MATLAB to find the optimal size
of the hybrid micro-sources.

iv
ACKNOWLEDGMENTS
First and foremost, I would like to express gratitude and appreciation to
Dr.Jonathan Kimball, my advisor throughout my Master’s program. He provided me
with incredible guidance and provided me with great knowledge throughout my time at
Missouri University of Science and Technology. I would also like to thank Dr. Mehdi
Ferdowsi and Dr. Pourya Shamsi, two committee members for my thesis.
Also, I would like to give my sincere gratitude to the Royal Commission of
Yanbu Colleges and Institutes (RCYCI) for providing me with a full scholarship to
pursue my higher education and obtain my Master’s degree at one of the most prestigious
universities in the United States. I am very thankful for H.E. Dr. Alaa Nassif, the
Executive President of the Royal Commission of Yanbu for his approval to build a
partnership with the Office of Sustainable Energy and Environmental Engagement at
Missouri University of S&T to design and build the Yanbu Solar Village. Also, I would
like to thank Dr. Ahmed Dabroom, the Managing Director of RCYCI, for his support
throughout my career and academic journey.
Finally, I am deeply grateful to my mother and wife for their patience and support
throughout my studies. I would like to dedicate this thesis to my brother, Ibrahim
Alalwani, and my cousins, Ghazi and Mohammed Alalwani.

v
TABLE OF CONTENTS
Page
ABSTRACT ....................................................................................................................... iii
ACKNOWLEDGMENTS ................................................................................................. iv
LIST OF ILLUSTRATIONS ............................................................................................ vii
LIST OF TABLES .............................................................................................................. x
SECTION
1. INTRODUCTION ................................................................................................. 1
1.1. GLOBAL SOLAR RADIATION IN SAUDI ARABIA ................................ 5
1.2. SOLAR ENERGY PROJECTS IN SAUDI ARABIA ................................... 8
1.3. SOLAR ENERGY CAPACITY AT YANBU CITY ................................... 10
1.4. WIND ENERGY CAPACITY IN SAUDI ARABIA .................................. 12
1.5. WIND CAPACITY AT YANBU CITY ...................................................... 13
2. LITERATURE REVIEW .................................................................................... 17
2.1. ITERATIVE APPROACH ........................................................................... 20
2.2. ARTIFICIAL INTELLIGENCE (AI) APPROACH .................................... 23
2.3 MULTI-OBJECTIVE DESIGN APPROACH .............................................. 26
2.4. PROBABILISTIC APPROACH .................................................................. 29
2.5. ANALYTICAL METHOD .......................................................................... 31
2.6. COMPUTER SOFTWARE DESIGN TOOL .............................................. 31
2.7. THE FOREVER POWER METHOD .......................................................... 32
3. MODELLING OF PV MODULE, WIND TURBINE, AND BATTERY .............
ENERGY STORAGE ......................................................................................... 33
3.1. PHOTOVOLTAIC SYSTEM MODELING ................................................ 33
3.2. WIND TURBINE MODEL .......................................................................... 35
3.3 BATTERY BANK MODEL........................................................................ 37
4. THE FOREVER POWER METHODOLOGY FOR THE OPTIMAL ...................
SIZING PROBLEM ............................................................................................ 42
4.1. INTRODUCTION ........................................................................................ 42
4.1.1 Reliability Criteria. .......................................................................... 42

vi
4.2.1 System Cost. .................................................................................... 45
5. APPLICATION ON A RURAL VILLAGE AT YANBU .................................. 49
5.1 ELECTRICAL LOAD ................................................................................. 49
5.1.1 Variable Load................................................................................... 49
5.1.2 Applying the Forever Power Iterative Method ................................ 52
5.1.3 Calculating the LCOE of the Hybrid MG System ........................... 54
5.1.4 Varying the Capacity of the Battery Energy Storage ....................... 58
5.1.5. Constant Load .................................................................................. 65
5.2. Using Smaller Wind Generator .................................................................... 67
5.3. Comparing To HOMER Pro Software ......................................................... 67
5.4. Utilizing Excess Power Generation .............................................................. 68
6. CONCLUSION .................................................................................................... 71
REFERENCES ................................................................................................................. 73
VITA..................................................................................................................................82

vii
LIST OF ILLUSTRATIONS
Figure Page
1.1 Percentage of electricity production by type of fuel ....................................................1
1.2 Power generation capacity per type of generation, 2013 .............................................2
1.3 Projection of domestic oil consumption in Saudi Arabia ............................................3
1.4 Load variation in Saudi Arabia, 2013 ..........................................................................4
1.5 Average Daily Total GHI in JUNE for years 1999-2012 ...........................................6
1.6 Average daily seasonal variation of global solar radiation for Saudi Arabia .............7
1.7 Average variation of sunshine duration over a year in Saudi Arabia ..........................7
1.8 Solar irradiance at Yanbu City (2007-2014) ..............................................................10
1.9 Annual variability of yearly sums of GHI at Yanbu ..................................................11
1.10 Monthly sums of GHI: long-term average, minimum and maximum .......................12
1.11 Annual average wind speed at Yanbu ........................................................................14
1.12 Frequency distribution of wind speeds (2007-2014) .................................................15
1.13 Average monthly wind speeds (2007-2014) ..............................................................16
2.1 General structure of a microgrid system ...................................................................17
2.2 Microgrid configurations: a) AC coupled b) DC coupled c) Hybrid coupled ..........18
2.3 Sizing methodologies of IRES ...................................................................................19
2.4 Algorithm for optimal sizing of the hybrid PV/ Wind sources ..................................22
2.5 Flow chart of the HSWSO method ............................................................................23
2.6 Pareto front for a MOP ..............................................................................................27
2.7 Design principal of the MOP ....................................................................................29
viii
3.1 Typical IV characteristics of a PV array ...................................................................33
3.2 Effect of (a) solar irradiance (b) temperature on the output ........................................
power of a PV module .............................................................................................34
3.3 WG output power curve ...........................................................................................36
3.4 Power curve for 2.5 kW wind generator ...................................................................37
3.5 Effect of DOD on the battery life cycle ...................................................................40
4.1 The Forever Power loop.............................................................................................43
4.2 Overall Algorithm for unit sizing of PV/Wind/Battery Hybrid MG system .............44
5.1 Monthly consumptions by the village ........................................................................49
5.2 Load and temperature variations versus time for one day in January and August ....50
5.3 Long term average temperature variation at Yanbu (2007-2014) .............................51
5.4 Numbers of PV modules and WGs with their corresponding availability ....................
for 2000 kWh storage .................................................................................................53
5.5 LCOE of all numbers of PV/wind energy sources with/without utilizing EPG ........54
5.6 SOC of the battery storage throughout the system life cycle ........................................
(a) Only PV modules (b) PV modules with One WGs ...............................................56
5.7 SOC of the battery storage throughout the system life cycle ........................................
(a) PV modules with two WGs (b) PV modules with three WGs ..............................57
5.8 LCOEU at different storage capacity using only PV modules ...................................59
5.9 Effect of battery energy storage on LCOEt and LCOEu at 100% availability ..............
of power supply..........................................................................................................60
5.10 SOC of the battery storage throughout the system life cycle with 600kWh .................
battery storage ............................................................................................................61
5.11 SOC of the battery storage throughout the system life cycle (a) 700 kWh ..................
(b) 800 kWh ...............................................................................................................62
5.12 SOC of the battery storage throughout the system life cycle (a) 900kWh ....................
(b) 1000 kWh .............................................................................................................63
5.13 SOC of the battery storage throughout the system life cycle at ....................................
(a) 1100 kWh (b) 1200 kWh ......................................................................................64

ix
5.14 Availability of power at fixed and variable loads with only PV modules ................ 66

x
LIST OF TABLES
Table Page
1.1 List of solar energy projects conducted by the ERI, KACST ………………..…….....9
3.1 Capital cost of battery energy storage ..........................................................................38
3.2 Comparison of properties of different types of battery storage technologies ..............39
5.1 PV Module type ...........................................................................................................52
5.2 Wind generator type .....................................................................................................52
5.3 LCOE corresponding to two values of availabilities of power supply ........................55
5.4 SOC of the battery storage for each solution ...............................................................58
5.5 LCOEU of the PV/wind/battery energy MG system ....................................................60
5.6 LCOEt of the PV/wind/battery energy MG system .....................................................61
5.7 SOC of each battery capacities throughout the system life cycle ................................65
5.8 SOC of 600kWh battery storage for variable and constant loads ................................66
5.9 Effect of wind generator size on the LCOEU ...............................................................67
5.10 Optimal solution.........................................................................................................68
5.11 desalination unit technical specification ....................................................................69
5.12 using EPG to power two portable desalination units (for 25 years) ......................... 70

1. INTRODUCTION
The energy demand in the Kingdom of Saudi Arabia has increased dramatically in
response to significant industrial, commercial, and residential developments. According
to BP Statistical Review of World Energy 2014, the total electrical energy generated in
2013 was 292.2 TWh, approximately 7% more than the electrical energy generated in
2000 [1]. The generation capacity in the kingdom is about 58 GW with all plants being
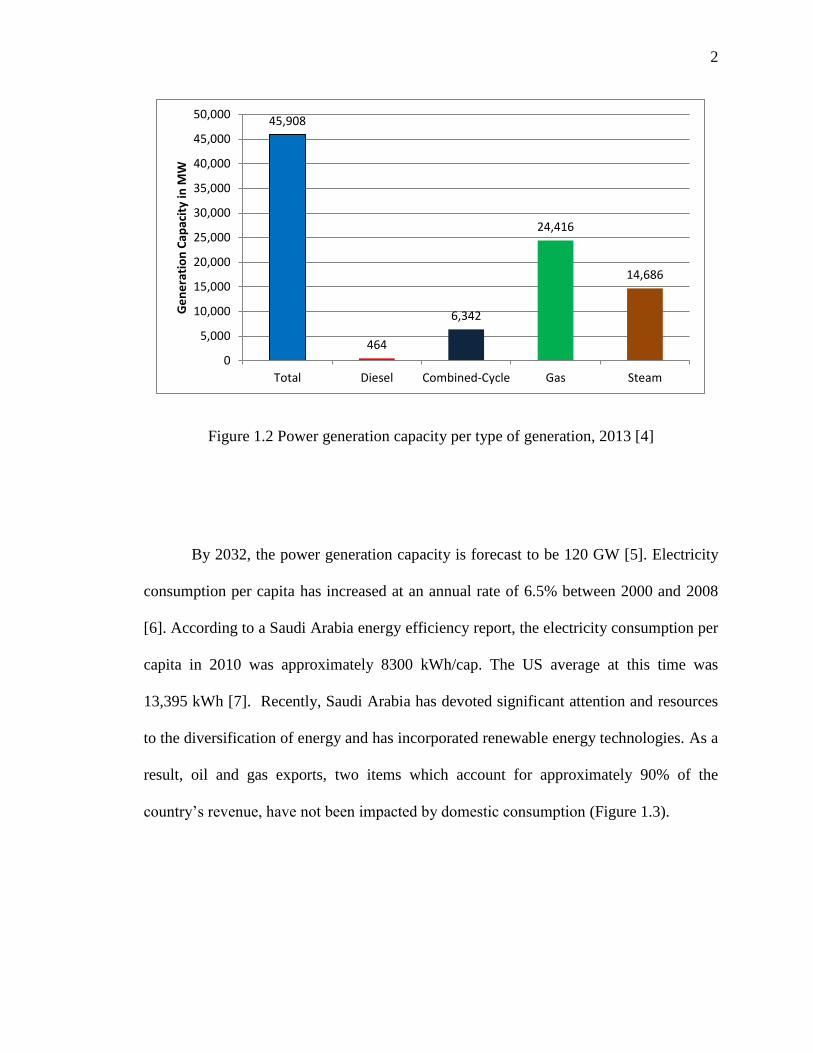
powered by either oil or natural gas as shown in Figure 1.1 [2] [3]. Figure 1.2 shows the
generation capacity based on the type of energy source used by Saudi Electricity
Company (SEC) [4].
Figure 1.1 Percentage of electricity production by type of fuel [3]
2
Figure 1.2 Power generation capacity per type of generation, 2013 [4]
By 2032, the power generation capacity is forecast to be 120 GW [5]. Electricity
consumption per capita has increased at an annual rate of 6.5% between 2000 and 2008
[6]. According to a Saudi Arabia energy efficiency report, the electricity consumption per
capita in 2010 was approximately 8300 kWh/cap. The US average at this time was
13,395 kWh [7]. Recently, Saudi Arabia has devoted significant attention and resources
to the diversification of energy and has incorporated renewable energy technologies. As a
result, oil and gas exports, two items which account for approximately 90% of the
country’s revenue, have not been impacted by domestic consumption (Figure 1.3).
45,908
464
6,342
24,416
14,686
0
5,000
10,000
15,000
20,000
25,000
30,000
35,000
40,000
45,000
50,000
Total Diesel Combined-Cycle Gas Steam
Ge
ne
rati
on
Cap
acit
y in
MW

3
Figure 1.3 Projection of domestic oil consumption in Saudi Arabia [10].
Government of Saudi Arabia provides consumption subsidies to electrical energy
producers to sell power below cost. In 2013, the total electrical energy subsidy by the
government was approximately $40 billion. In the same year, the average cost of kWh
sold by the SEC was 3.76 cents/kWh. Without the government subsidies, the cost would
have been 21.33 cents/ kWh [10].
Saudi Arabia has two main seasons, winter and summer. The peak power demand
during summer is much higher than in winter due to heavy air conditioning use as
illustrated by Figure 1.4. In addition, winter in Saudi Arabia is relatively mild and very
few heaters need to be used.
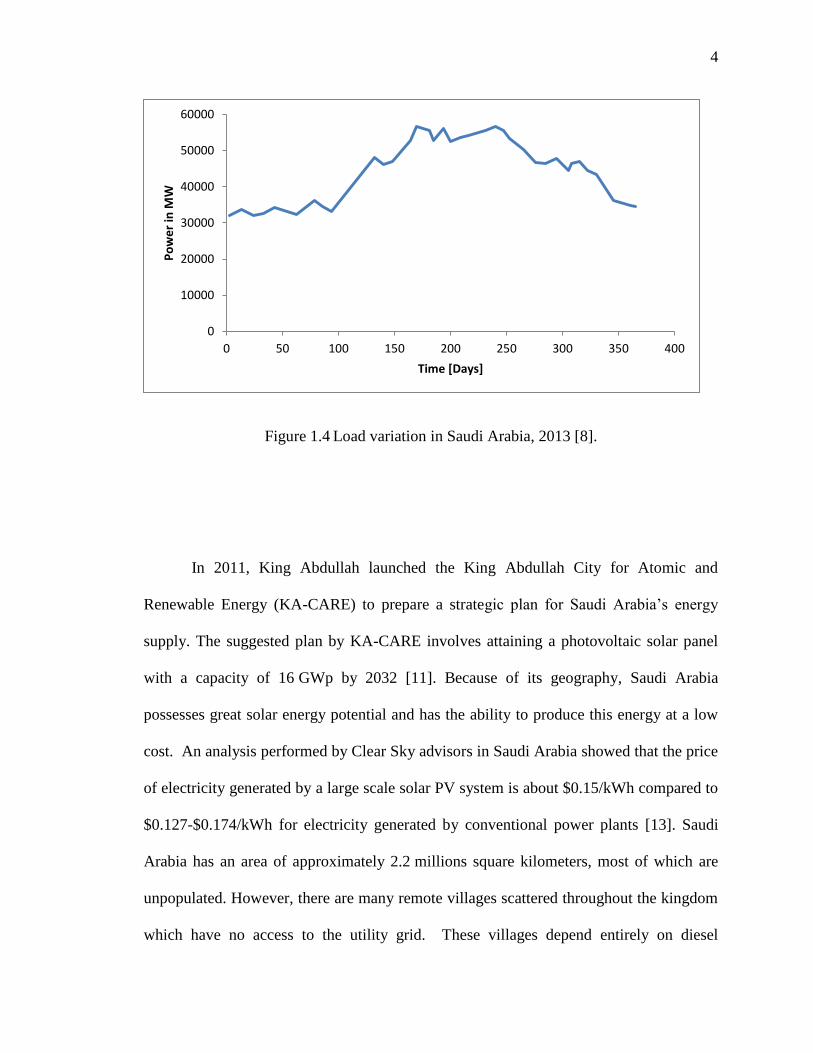
4
Figure 1.4 Load variation in Saudi Arabia, 2013 [8].
In 2011, King Abdullah launched the King Abdullah City for Atomic and
Renewable Energy (KA-CARE) to prepare a strategic plan for Saudi Arabia’s energy
supply. The suggested plan by KA-CARE involves attaining a photovoltaic solar panel
with a capacity of 16 GWp by 2032 [11]. Because of its geography, Saudi Arabia
possesses great solar energy potential and has the ability to produce this energy at a low
cost. An analysis performed by Clear Sky advisors in Saudi Arabia showed that the price
of electricity generated by a large scale solar PV system is about $0.15/kWh compared to
$0.127-$0.174/kWh for electricity generated by conventional power plants [13]. Saudi
Arabia has an area of approximately 2.2 millions square kilometers, most of which are
unpopulated. However, there are many remote villages scattered throughout the kingdom
which have no access to the utility grid. These villages depend entirely on diesel
0
10000
20000
30000
40000
50000
60000
0 50 100 150 200 250 300 350 400
Po
we
r in
MW
Time [Days]

5
generators as their main source of electricity. These isolated villages have a total power
generation capacity of 2.489 GW [4].
There are many disadvantages associated with using diesel generators including
high maintenance and operational costs. In addition, competitive technologies such as
solar and wind generators (WGs) are becoming viable energy sources. These
technologies can be used with either diesel generators to maximize performance and
reduce the total cost of producing energy or can be hybridized with an appropriate energy
storage technology.
1.1 GLOBAL SOLAR RADIATION IN SAUDI ARABIA
Rehman et al. found that the average global solar radiation in Saudi Arabia varied
between a minimum of 1.63 MWh/m2
yr and a maximum of 2.65 MWh/m2-yr at Tabuk
and Bisha, respectively [14]. As shown in Figure 1.6 and 1.7, Saudi Arabia receives high
solar radiation intensity and has many hours of intense sunlight [14] [15]. The average
daily global solar insolation in the Kingdom of Saudi Arabia is high and exceeds 6
kWh/m2-day from April to September. Figure 1.6 illustrates how this high solar
insolation coincides with high load demand during these months. As a result, solar energy
can be utilized for peak load sharing for the national grid. Rehman et al. also found that
the average sunshine duration across 41 locations in Saudi Arabia was 8.89 hours per day
and that the mean value of the specific yield was 260.83 kWh/m2 [14].

6
Figure 1.5 Average Daily Total GHI in JUNE for years 1999-2012 [16]
Yanbu

7
Figure 1.6 Average daily seasonal variation of global solar radiation for Saudi Arabia[14]
Figure 1.7 Average variation of sunshine duration over a year in Saudi Arabia [14]

8
1.2 SOLAR ENERGY PROJECTS IN SAUDI ARABIA
In 1977, Saudi Arabia initiated an international joint program involving the Saudi
Arabian Energy Research Institute (ERI), American SOLERAS program, and the German
HYSOLAR program [14]. Between 1981 and 1987, the joint program was able to design
and build a solar village with a total PV generation capacity of 350 kWp that was able to
generate between 1 to 1.5 MWh per day [12]. Table 1.1 shows other projects conducted
by ERI using a PV energy system [17].
In 2010, there were 9300 PV modules installed on the campus of King Abdullah
University of Science and Technology. The modules were able to produce a peak power
of 2 MW [14]. In 2011, a 500 kWp solar power plant was constructed at Farasan Island,
south of Saudi Arabia. In addition, Aramco, a Saudi oil company, constructed its
headquarters in Dhahran of Saudi Arabia, the world’s largest solar parking project that
has a power capacity of 10 MW [15].

9
Table 1.1 List of solar energy projects conducted by the ERI, KACST [17]
Projects Location Duration Applications
350 kW PV system Solar Village 1981-87
AC/DC electricity for
remote areas
350 kW PV hydrogen production
plant Solar Village 1987-93
Demonstration plant
for solar hydrogen
production
Solar cooling
Saudi
universities 1981-87
Developing of solar
cooling laboratory
1 kW solar hydrogen generator Solar Village 1989-93
Hydrogen
production, testing
and measurement
(laboratory scale)
2 kW solar hydrogen KAU, Jeddah 1986-91
Testing of different
electrode materials
for solar hydrogen
plant
3 kW PV test system Solar Village 1987-90
Demonstration of
climatic effects
4 kW PV system
Southern regions
of Saudi Arabia 1996
AC/DC electricity
for remote areas
6 kW PV system Solar seawater
desalination Solar Village 1996-98 PV grid connection
PV water desalination
(0.6 m3 per hour) Sadous Village 1994-99 PV/RO interface
Solar-thermal desalination Solar Village 1996-97
Solar distillation of
brackish water
PV in agriculture (4 kWp) Muzahmia 1996
AC/DC grid
connected
Long-term performance of PV
(3 kW) Solar Village Since 1990
Performance
evaluation
Fuel cell development
(100±1000 W) Solar Village 1993-2000 Hydrogen utilization

10
1.3 SOLAR ENERGY CAPACITY AT YANBU CITY
Yanbu City is located on the Red Sea coast of Saudi Arabia (figure 1.5) and has
geographic coordinates of 24° 5' 7" North, 38° 2' 55" East. It is 6 meters above sea level.
Yanbu City has favorable conditions for using solar energy. Figure 1.8 shows the solar
irradiance for Yanbu from 2007 to 2014. The average peak amount of sun at Yanbu lasts
for approximately 6.27 hours and has an average solar irradiance of 261.4 W/m2.
Figure 1.8 Solar irradiance at Yanbu City (2007-2014)

11
The long term average of the yearly sum of global horizontal irradiance (GHI) at
Yanbu is 2290.9 kWh/m2. Figure 1.9 below shows the average yearly sum of GHI from
2007 to 2014.
Figure 1.9 Annual variability of yearly sums of GHI at Yanbu
The long-term sum of the average monthly GHI (kWh/m2) at Yanbu from 2007 to
2014 is shown in Figure 1.10. The figure illustrates that solar energy during summer is
higher than in winter, something which coincides with trends in electricity demand. The
maximum is 247.9 kWh/m2
(July, 2010) and the minimum is 125.2 kWh/m2 (January,
2008).

12
Figure 1.10 Monthly sums of GHI: long-term average, minimum and maximum
1.4 WIND ENERGY CAPACITY IN SAUDI ARABIA
Saudi Arabia is characterized by two vast coastal windy regions, namely the
Arabian Gulf and the Red Sea. The annual mean wind speed in these two regions
exceeds 4.63 m/s [18]. In 1970, meteorological data collection stations were installed in
Saudi Arabia airports. Ansari et al. [19] developed a wind atlas in 1986 using hourly
wind speed data in Saudi Arabia. To accurately assess wind energy potential, certain
statistical features of wind speed must be studied. For example, the Weibull probability
distribution function is used to find the monthly frequency distribution of wind speed

13
measurement. Also, Rehman et al. found the Weibull parameter for 10 locations in Saudi
Arabia using the Weibull distribution function and used long-term wind speed data for 20
locations throughout Saudi Arabia [19] and used this data to calculate the cost of kilowatt
hours of electricity produced using different wind machines [20]. The monthly and
annual wind speeds and wind powers at these locations, ranged from 2.5 to 4.4 m/s2 and
from 21.8 to 77.7 W/m2, respectively [22]. The strategic plane presented by KA-Care
revealed that the cumulative wind power capacity will reach 9 GW of power by 2032
[12].
1.5 WIND CAPACITY AT YANBU CITY
According to Ansari et al., Yanbu has 86,748 recorded hours of wind speed at a
height of 10 meters [19]. A wind power cost analysis conducted by Rehman at twenty
locations through the kingdom of Saudi Arabia concluded that Yanbu has the highest
wind potential of all areas tested [20]. According to Rehman [23], an annual energy
production of 4941487.2 kWh was obtained using a 2500 kW wind turbine and achieved
the lowest energy cost ($0.0234/kWh). Using meteorological data at a height of 10
meters recorded since 1970, Rehman investigated the recorded wind speeds at Yanbu
during a 13-year span and showed that the yearly mean wind speed at Yanbu varied from
a high of 6 m/s to a low of 3 m/s. The same study also found that the monthly mean
variation of wind speed was greater than 4 m/s in all months. The mean wind speed is
higher during the summer, something which coincides with a higher load trend in Yanbu.
Data collected from 1970 to 1983 also showed that wind speeds between 4 and 10 m/s
were measured almost 60% of the time and speeds greater than 10 m/s were measured
8% of the time [20].

14
Further research performed by Rehman et al. found that the development of a
wind park with a capacity of a 1500 kW machine will result in a reduction of greenhouse
gases by 31,369 tons per year. The same study showed that the years-to-positive cash
flow (YPCF) or the return on investment for Yanbu was the lowest of the five locations
in Saudi Arabia that could be made into wind farms. Yanbu had YPCF as low as 5.1
years for a 1.5 MW turbine [23]. Another study by Rehman et al. showed that the daily
mean value of wind speed at Yanbu from 1990 to 2006 was 3.76 m/s with a maximum
speed of 10.3 m/s [24].
In this study, Yanbu wind data from the beginning of 2007 to the end of 2014
were used. During this time, the mean wind speed was 3.72 m/s. Generally, a wind speed
above 4 m/s is recommended for small scale wind turbines. Figure 1.11 below shows the
annual average wind speed at Yanbu for eight consecutive years.
Figure 1.11 Annual average wind speed at Yanbu
0
0.5
1
1.5
2
2.5
3
3.5
4
4.5
2007 2008 2009 2010 2011 2012 2013 2014
Win
d S
pe
ed
(m
/s)
year

15
The highest wind speed recorded was 11.9 m/s. Most small scale WGs require a
wind speed of 3 m/s to generate power. At Yanbu, wind speeds recorded from 2007 to
2014 were greater than or equal to 3 m/s 63.13% of the time. Figure 1.12 shows the
frequency distribution of wind speeds during the full period used in this study.
Figure 1.12 Frequency distribution of wind speeds (2007-2014)
Moreover, figure 1.13 shows that there is not much variation in wind speed
throughout the year and that makes it predictable and reliable. A higher average wind
speed was observed during summer for eight consecutive years which coincide with the
increased electricity demand. On the other hand, lower wind speeds were observed
during the winter months, a time when electricity demand is lower.

16
Figure 1.13 Average monthly wind speeds (2007-2014)

17
2. LITERATURE REVIEW
There are many rural villages in countries around the world that do not have
access to electricity. According to International Energy Agency (IEA), more than 1.3
billion people around the world do not have access to electricity. Approximately 84% of
these people live in rural villages [25]. Recently, because of the advancement in power
electronics, renewable energy sources and energy storage technologies have allowed the
cost of led the cost of energy from renewable resources to compete with conventional
resources. One of the existing solutions to electrify rural villages is the use of MG energy
systems. An MG can be defined as a group of interconnected loads and distributed energy
resources within clearly defined electrical boundaries. These resources act as a single
controllable entity that connects or disconnects from the grid to enable it to operate in a
grid-connected or “island” mode [26] [27]. The hybridization and integration of
renewable energy resources for an MG are used to obtain optimal control and energy
management. Figure 2.1 shows a block diagram for a MG energy system [28].
Figure 2.1 General structure of a microgrid system [28]
18
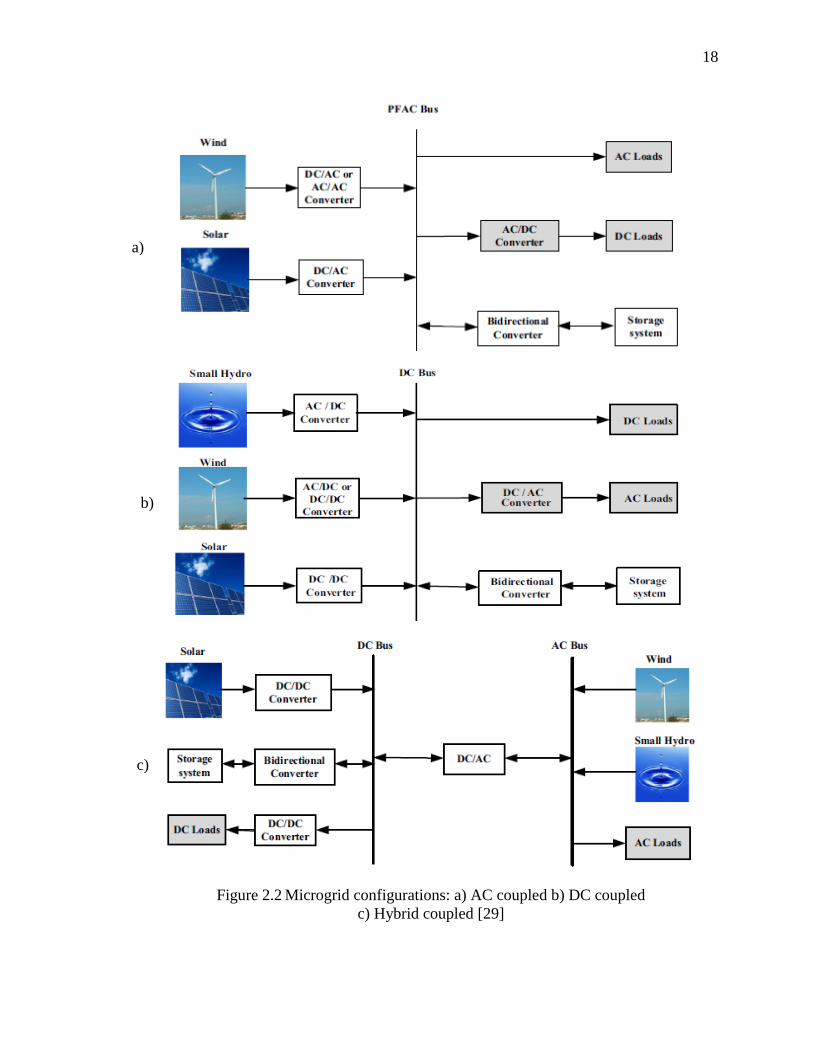
Figure 2.2 Microgrid configurations: a) AC coupled b) DC coupled
c) Hybrid coupled [29]
a)
b)
c)

19
Integration configurations between different energy sources and loads in an MG
can be categorized into three possible configurations: AC coupled, DC coupled, and
hybrid coupled configuration as shown in Figure 2.2 [29]. Each configuration has its own
advantages and disadvantages in terms of control complexity, cost, efficiency and
reliability.
Unit sizing of photovoltaic (PV) panels and wind turbines with energy storage for
an islanded MG has been studied by many researchers. The criteria for choosing the
optimal size of integrated renewable energy system (IRES) are usually influenced by
economic and power reliability factors. There are many methodologies applied to proper
unit sizing of an isolated hybrid PV-wind MG system which can be summarized as
shown in Figure 2.3 below [29].
Figure 2.3 Sizing methodologies of IRES [29]
Sizing
Methodologies
Artificial
Intelligence
Analytical
method
Iterative
method
Available
Computer
tools
Probabilistic
Approach
Multi-
Objective
Approach

20
2.1 ITERATIVE APPROACH
Sizing IRES with an iterative method approach is achieved by using typical
metrological year (TMY) data such as solar irradiance, wind speed, and temperature.
Then, an algorithm is used to find the best economic result using net present value (NPV)
and/or levelized cost of energy (LCE) at the required Loss of Power Supply Probability
(LPSP), deficiency of power supply (DPSP), or other reliability criteria such as
availability of power supply.
Daif et al. [30] used an iterative methodology to apply a technical and economic
assessment to optimally size the PV and wind to an isolated microgrid system. The
authors used one year of metrological data at three locations in Corsica Island, France.
The flow chart in Figure 2.4 provides hourly data of solar irradiance, temperature, and
load. These data were applied to PV and wind turbine models to determine how much
they much energy is generated to supply the load or charges the battery if there is excess
energy. A set of system configurations were generated based upon the required LPSP.
After that, an economic analysis was performed to determine the lowest LCE among all
system configurations and find the optimal solution. Based on the analysis, the battery
bank was chosen to be replaced every 4 years and a daily load of 3 kWh for each
residential house was used.
Another study by Parsad and Natarajan [31] showed how iterative optimizing
methodology for PV-Wind hybrid system was applied. Software has been developed to
provide simulations using various parameters such as deficiency of power supply
(DPSP), relative excess power generated (REPG), utilized energy probability (UEP), and
LCE of power generation with battery bank. The software allows the designer to select
21
any location for the hybrid MG system and find the optimal size based upon specified
DPSP with minimum life cycle unit cost (LUC). For determining the optimal size, three
loops were used. The outer loop is first initiated by sizing the wind machines from
various wind machine models. The middle loop is then used to calculate the number of
solar panels with each the values assigned to each wind machine model. Finally, the
inner loop is used to calculate the energy of the battery storage.
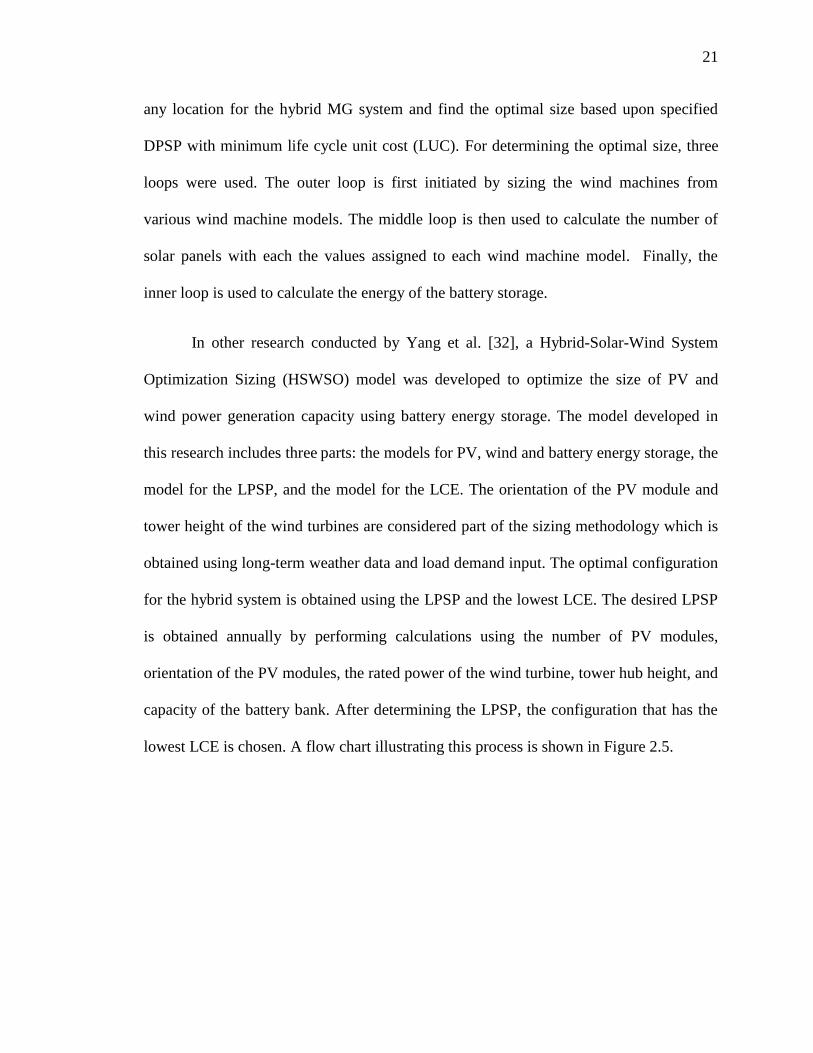
In other research conducted by Yang et al. [32], a Hybrid-Solar-Wind System
Optimization Sizing (HSWSO) model was developed to optimize the size of PV and
wind power generation capacity using battery energy storage. The model developed in
this research includes three parts: the models for PV, wind and battery energy storage, the
model for the LPSP, and the model for the LCE. The orientation of the PV module and
tower height of the wind turbines are considered part of the sizing methodology which is
obtained using long-term weather data and load demand input. The optimal configuration
for the hybrid system is obtained using the LPSP and the lowest LCE. The desired LPSP
is obtained annually by performing calculations using the number of PV modules,
orientation of the PV modules, the rated power of the wind turbine, tower hub height, and
capacity of the battery bank. After determining the LPSP, the configuration that has the
lowest LCE is chosen. A flow chart illustrating this process is shown in Figure 2.5.

22
Figure 2.4 Algorithm for optimal sizing of the hybrid PV/ Wind sources [32]

23
Figure 2.5 Flow chart of the HSWSO method [30].
2.2 ARTIFICIAL INTELLIGENCE (AI) APPROACH
When AI is used, weather data may not be needed to find the proper size for
renewable energy resources and battery energy storage. In the literature, numerous AI
techniques have been used.
Yang et al. [33] developed a genetic algorithm (GA) to optimally size the hybrid
solar-wind system to achieve a LPSP with minimum ACS to meet consumer demands.
24
When compared to conventional methods, this system yields the global optimum for the
hybrid energy system with computational simplicity. The optimization process includes
the PV module number, PV module slope angle, wind turbine number, turbine height,
and the number of battery units. The researchers applied this method to a
telecommunication station in China and found that 3 to 5 days of energy storage with
80% DOD yielded a 1% to 2% of LPSP, respectively. In their study, losses due to system
components were not taken into consideration. Thus, the LPSP will be worse than the
desired value, a factor which can cause a designer to oversize the system components.
Likewise, Xu et al. [34] used GA to minimize the total capital cost using the
constraint of LPSP. The method was applied to a standalone wind/PV MG system. The
sizing methodology uses the type and size of WG, tilt angle and size of the PV panels,
and the capacity of the batteries. In their proposed methodology, TMY data, including
extraterrestrial horizontal radiation, global horizontal radiation, diffuse horizontal
radiation, temperature, and wind speed were utilized. The WG ratings used in this study
were 1 kW, 3 kW, 5 kW, 7.5 kW, and 10 kW. Each PV panel used had a power rating of
50Wpeak. In addition, the battery capacity for each battery was 200 Ah. The round-trip
efficiency of the battery bank was 0.7 with 50% DOD and a constant load of 2KW with a
1% LPSP was used.
Askarzadeh developed a novel methodology by merging the following three
algorithms: chaotic search (CS), harmony search (HS), and simulated annealing (SA).
These three algorithms were combined to find the optimal size of PV panels along with
the number of wind turbine and batteries with minimum total annual cost [35]. The
constraints for the system were the maximum and minimum number of wind turbines, PV

25
panels, and number of batteries. Also, the maximum DOD of the battery energy storage
was considered as a constraint in this method. Askarzadeh found that the invented
discrete chaotic harmony search-based simulating annealing algorithm (DCHSSA)
provided a good optimum sizing of the wind/PV hybrid system.
Kumar et al. [36] used a biogeography based optimization (BBO) algorithm to
attain global optimum solution to identify the size, control, and power management
strategy for the wind/PV hybrid energy system based upon the total cost and ability to
insure the availability of power supply. The BBO method leads to an excellent
convergence property with less computational time compared to conventional methods.
In contrast to the BBO method, Ekren et al. [37] used a response surface
methodology (RSM). This methodology is a collection of statistical mathematical
methods used to optimally size PV/wind integrated hybrid energy system with battery
storage. Historical hourly mean solar radiation and wind speed data for the past two years
were used to develop a simulation model. The simulation model was then used to predict
solar radiation, wind speed, and electricity consumption of the load. Following these
predictions, a regression metamodel of the hybrid energy system was obtained using the
simulation model data. Finally, the RSM optimization technique was used to optimize the
metamodel to find the PV area, wind turbine rotor swept area, and battery capacity.
Arabali et al. [38] applied GA based optimization approach with fuzzy C-Means
(FCM) to minimize the cost function that guarantees minimum PV, wind generation
installation, and storage requirements to supply a controllable HVAC load. Different
percentages of load shifting have been used under different scenarios to examine the
efficiency of the system. To match the energy generation from PV and WGs with
26
controllable HVAC load, a smart grid strategy was been applied. By increasing the load
shifting percentage, the system becomes more flexible. Also, the efficiency of the system
will increase and the excess energy production from renewable resources will decrease.
This study shows that the cost of the system increases as the risk of failure increases.
Kashefi et al. [39] also applied an advance variation of particle swarm
optimization (PSO) algorithm to optimally design hydrogen-based stand-alone wind/PV
generating system. The researchers proposed a reliability evaluation method for the
hybrid system to reduce the time and computations. Their main goal in designing a
hybrid system was to provide a reliable supply of power to the load under varying
weather conditions with minimum system cost. The wind/PV/FC hybrid generating
system is designed to operate for 20 years. The novel variation of PSO achieves a global
optimum. A MATLAB code was been developed to consider the outage probability of the
three major components of the hybrid system, namely the wind turbine generator, PV
array, and DC/AC converter. The study then provided a reliability/cost assessment. In
addition, factors such as the uncertainty in wind speed, solar radiation, and load data was
been considered. The research showed that a DC/AC converter plays a significant role in
the reliability of the system and can be considered an upper limit for the system’s
reliability.
2.3 MULTI-OBJECTIVE DESIGN APPROACH
Optimal sizing of hybrid MG resources a variety of objectives including
reliability, cost, and occasionally greenhouse gas emissions. In addition, these objectives
might conflict with one another such as reliability and cost. As a result, the problem of
optimal sizing of MG energy sources is considered a multi-objective problem (MOP). As

27
with any problem, there are usually a set of constraints that must be followed to finding a
solution. However, an MOP often does not lead to a single solution, but rather provides a
set of solutions which are trade-offs between various objectives. Figure 19 shows the
trade-offs of the MOP which are the Pareto optimum sets [29].
Figure 2.6 Pareto front for a MOP [28]
Katsigiannis et al. [40] applied an evolutionary multi-objective algorithm
approach with a non-dominated genetic algorithm (NDGA-II) to solve the MOP of an
isolated hybrid MG system. The constraints of the MOP were initial cost, unmet load,
capacity storage, fuel consumption, minimum renewable fraction, and component size
constraints. The researchers examined this method on the hybrid MG system with two
types of energy storage: lead acid batteries and hydrogen storage combined with a fuel
cell. They concluded that lead acid batteries were superior to hydrogen storage when

28
evaluated using economic and environmental criteria. The researchers also used diesel
and biodiesel generators in addition to wind and PV energy sources. The use of diesel and
biodiesel generators reduced the cost, but increased the greenhouse gas emissions. As a
result, the choice of the size of the system’s energy sources depends on the designer
target of cost and desired environmental effect.
Pedro and Almeida [41] proposed a novel multi-objective method to optimize the
size of wind, solar, and hydropower renewable systems. In this method, large-scale
demand-side management (DSM) and demand response (DR) technologies were
considered. The method used to maximize the renewable energy contribution to peak
load while minimizing the intermittence of these sources at minimal cost.
Ould Bilal et al. [42] used a multi-objective genetic algorithm to optimally size a
hybrid solar-wind-battery isolated MG system to achieve minimum ACS with
corresponding LPSP. The isolated system is located at Potou on the northern coast of
Senegal. Three load profiles with the same daily energy demand were proposed to study
the effect of load on the system component size. The study concluded that load profile
influenced the design criteria which included the cost and system reliability.
Another study by Abbes et al. [43] used a triple multi-objective optimization to
combine the LCC, embodied energy (EE), and LPSP. The optimal configuration between
the hybrid wind, PV, and battery MG system can be found by using the dynamic model
and applying a controlled elitist genetic algorithm for the multi-objective optimization
(Figure 20). Both economic and environmental factors have been considered in this study
which was designed to investigate the consumption of non-renewable primary energy
sources to find the environmental impact on the design criteria. The results show that the

29
hybrid system is greatly undersized when load shedding is tolerated. As a result, the cost
of the system and environmental impact are reduced.
Figure 2.7 Design principal of the MOP [43]
2.4 PROBABILISTIC APPROACH
The probabilistic approach is used to create a risk model from generation and/or
load models. Out of all the various optimization techniques, it is considered the simplest
method used to optimize the hybrid integrated renewable energy sources. However, it
does not yield the best solutions [29]. In the literature, several research papers have been
published which use this type of approach.
Karaki et al. [44] developed a general probabilistic approach to optimize an
autonomous solar-wind energy system. Various wind turbines and solar modules were

30
also considered as well as the state of charge (SOC) and how its battery energy storage
capabilities satisfy certain load profiles. A model has been developed that represents the
modes that the equipment can utilize in the event of failure and the availability of the
power supply. Although cost was not considered in this paper, the authors indicated that
a production costing program can be associated with their approach.
Yang and Burnett [45] developed a simulation model to analyze the probability of
power supply failure for a hybrid wind/PV generation system with battery energy storage.
Their model can also be used to analyze the reliability of the system. The simulation
showed that solar power and wind power complement each other very well. To study its
usefulness, this methodology was applied to a case study of an isolated hybrid MG
system to supply power for a telecommunication system. Different desired LPSPs were
used to find the optimal combination between the hybrid system components. The study
also showed that load profile impacts the priority sequence of which type of system
should be selected. The sequence, from best to worst should be the hybrid PV-wind
power generation system, wind power system alone, and PV system alone.
Tina and Gagliano [46] performed a probabilistic analysis of weather data for a
hybrid PV-wind MG system using long-term meteorological data from Acrieale, Italy.
Their proposed approach was to check if the probability distribution functions (PDFs) of
Hollands, Huget, and Weibull were good fits for real PDFs of clearness index. The PDFs
of each energy source was then calculated. This methodology required knowledge of the
daily maximum irradiance and the 3-hour interval per day of wind speed due to non-
linearity in wind turbine power curve.

31
Tina et al. [47] developed a probabilistic design approach to optimize the hybrid
PV-wind MG system. This approach is based on the convolution technique to assess
long-term performance of a hybrid PV-wind MG system based on Expected energy not
supplied (EENS).
2.5 ANALYTICAL METHOD
The analytical method uses computational models of system energy components
to describe component size as a function of system feasibility. Once the model is set,
system performance can be evaluated according to certain criteria. Long-term
meteorological data are needed to perform this methodology.
Khatod et al. [48] applied a systematic analytical approach to optimally size an
isolated PV-wind hybrid MG system. The proposed method associated the uncertainties
of solar irradiance, wind speed, power demand, and outages of each generating unit.
Also, a production-costing simulation was performed and the results were compared
using the Monte Carlo simulation (MCS) method. The results of the proposed analytical
method were shown to be accurate, computationally efficient, and required less
meteorological data than MCS.
2.6 COMPUTER SOFTWARE DESIGN TOOL
There are various computer software packages that provide proper unit sizing for
different power generation units in a hybrid MG system. The Hybrid Optimization Model
for Electric Renewables (HOMER) is one of the most widely used software programs
[29]. HOMER was developed by the National Renewable Energy Laboratory (NREL)
and is capable of modeling the physical behaviors of different system components while
considering system life cycle costs. The inputs for the HOMER software are load

32
demand, resource data, component cost, constraints, system control, and emission data.
The output data that HOMER software generates are net present cost, cost of energy,
unmet load, excess energy, fuel consumption, and renewable energy fraction. When
more accurate results are required, the HYBRID2 program is used [29]. This program
combines probabilistic and time series models and can model systems with time steps
from 5 minutes to 2 hours. The input data for HYBRID2 are load demand, resource data,
power system component data, and financial data. The program’s output data are a
technical analysis, sizing optimization, and financial evaluation [29]. RETScreen is
another software tool that was developed by the Ministry of Natural Resources in
Canada. It is able to analyze the technical, financial, energy efficiency, and sensitivity
factors of a hybrid renewable energy system and can also provide a risk analysis.
However, the program does not account for temperature effect on solar PV system
performance [29].
2.7 THE FOREVER POWER METHOD
The Forever Power method, developed by Kimball et al. 2009, can iteratively find
the optimal size of PV/Wind/battery energy sources based upon availability of power
supply and economic criteria. A year around of hourly solar irradiance, wind speed and
temperature are needed to find the optimal solution for a particular load at a particular
location. Also, information in the manufacturers’ data sheets of the PV module and wind
generator is needed to be able to execute the Forever Power method. It can lead to a
global optimal solution based on system cost.
33
3. MODELLING OF PV MODULE, WIND TURBINE, AND BATTERY
ENERGY STORAGE
3.1 PHOTOVOLTAIC SYSTEM MODELING
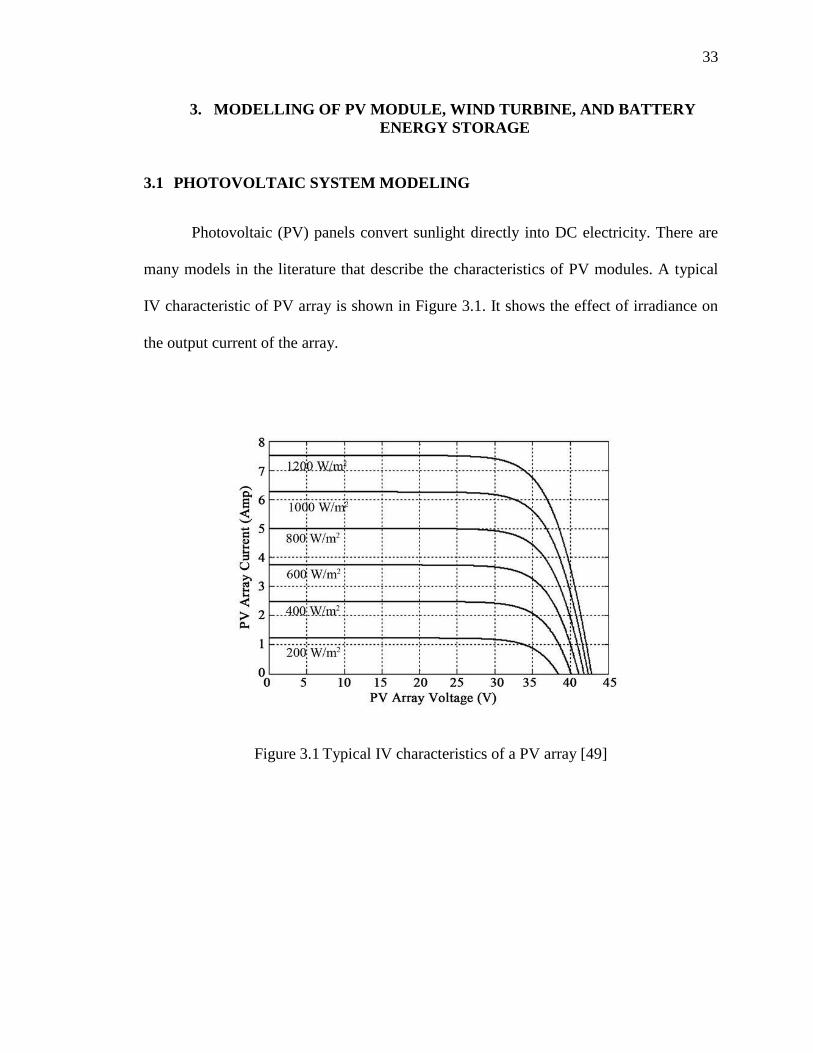
Photovoltaic (PV) panels convert sunlight directly into DC electricity. There are
many models in the literature that describe the characteristics of PV modules. A typical
IV characteristic of PV array is shown in Figure 3.1. It shows the effect of irradiance on
the output current of the array.
Figure 3.1 Typical IV characteristics of a PV array [49]
34
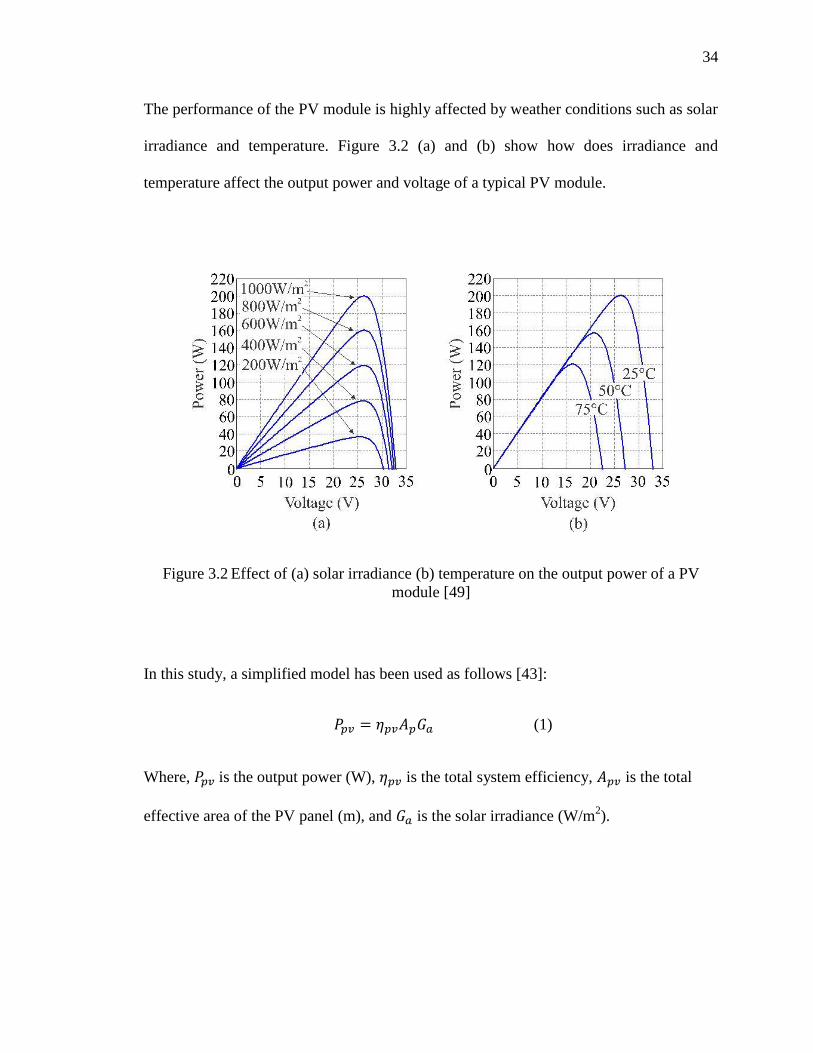
The performance of the PV module is highly affected by weather conditions such as solar
irradiance and temperature. Figure 3.2 (a) and (b) show how does irradiance and
temperature affect the output power and voltage of a typical PV module.
Figure 3.2 Effect of (a) solar irradiance (b) temperature on the output power of a PV
module [49]
In this study, a simplified model has been used as follows [43]:
𝑃𝑝𝑣 = 𝜂𝑝𝑣𝐴𝑝𝐺𝑎 (1)
Where, 𝑃𝑝𝑣 is the output power (W), 𝜂𝑝𝑣 is the total system efficiency, 𝐴𝑝𝑣 is the total
effective area of the PV panel (m), and 𝐺𝑎 is the solar irradiance (W/m2).

35
The PV module efficiency is affected by the cell temperature which can be
expressed in the following equation:
𝜂𝑝𝑣 = 𝜂𝑟𝜂𝑝𝑐[1 − 𝜇 (𝜃𝑐 − 25)] (2)
In this equation, 𝜂𝑟 is the rated PV module efficiency, 𝜂𝑝𝑐 is the power converter
efficiency, μ is the temperature coefficient at maximum power (/Co), and 𝜃𝑐 is the cell
temperature (Co). Also, the cell temperature can be calculated using equation (3) below:
𝜃𝑐 = 𝑇𝑎 + [(𝑁𝑂𝐶𝑇−20)
800× 𝐺𝑎] (3)
In this equation, 𝑇𝑎 is the ambient temperature and NOCT is the normal operating cell
temperature. The hourly data of the solar irradiance and temperature can be used to find
the hourly output power from each panel once the efficiency of the solar panel and the
power converter used are determined and taken into account [43].
3.2 WIND TURBINE MODEL
It is important to choose the appropriate model to determine the performance of a
single wind turbine which is characterized by its power curve. The electrical output
power of any wind turbine is a function of wind speed and its hub-height. For unit sizing
of MG energy sources, many researchers use a simple model that represents the output
power curve for any typical WG as shown in Figure 3.3 [51].

36
Figure 3.3 WG output power curve [51]
The operating limits of any wind turbine are determined by its cut-in and cut-out speed.
Rated power is generated by the WG at the rated speed. These data are provided by the
manufacturer of the wind turbine. The following wind power generation output equation
is used in most papers [52] [43]:
𝑃𝑤 = {
𝑃𝑟 (𝑉(𝑡)2−𝑉𝑐
2
𝑉𝑟2−𝑉𝑐
2 ) 𝑉𝑐 ≤ 𝑉(𝑡) < 𝑉𝑟
𝑃𝑟 𝑉𝑟 ≤ 𝑉(𝑡) < 𝑉𝑓
0 𝑉(𝑡) < 𝑉𝑐 𝑜𝑟 𝑉(𝑡) > 𝑉𝑓
(4)
In this equation, 𝑃𝑤 is the output power of the WG, 𝑃𝑟 is the rated power of the wind
generator, 𝑉𝑐 is the cut-in speed of the wind turbine at which the wind turbine begins
rotating, 𝑉𝑟 is the rated speed of the wind turbine, and 𝑉𝑓 is the cut-out speed at which the
wind turbine stops rotating. Equation (4) shows that wind speed is squared because it
produces power as indicated in manufacturer data sheet. Figure 24 below shows a power
curve vs wind speed of a 2.5 kW wind generator which has 2.7 m/s cut-in speed, 25 m/s
cut-out speed, and 11 m/s rated speed.
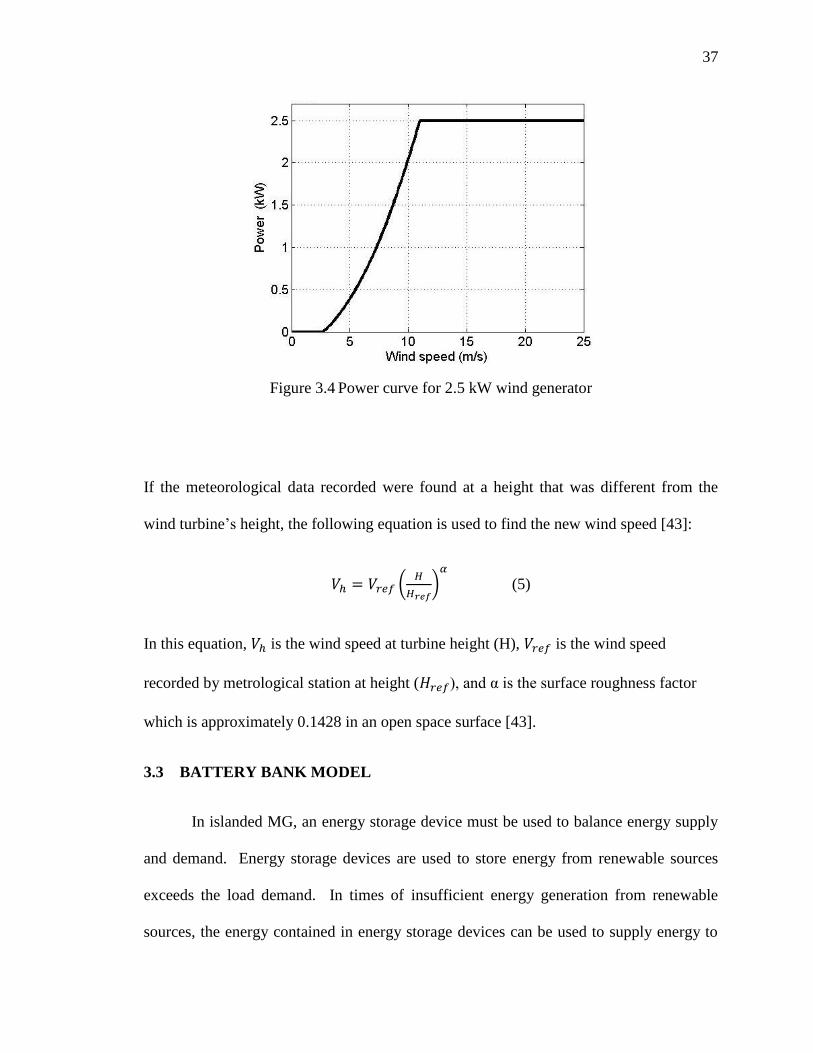
37
Figure 3.4 Power curve for 2.5 kW wind generator
If the meteorological data recorded were found at a height that was different from the
wind turbine’s height, the following equation is used to find the new wind speed [43]:
𝑉ℎ = 𝑉𝑟𝑒𝑓 (𝐻
𝐻𝑟𝑒𝑓)
𝛼
(5)
In this equation, 𝑉ℎ is the wind speed at turbine height (H), 𝑉𝑟𝑒𝑓 is the wind speed
recorded by metrological station at height (𝐻𝑟𝑒𝑓), and α is the surface roughness factor
which is approximately 0.1428 in an open space surface [43].
3.3 BATTERY BANK MODEL
In islanded MG, an energy storage device must be used to balance energy supply
and demand. Energy storage devices are used to store energy from renewable sources
exceeds the load demand. In times of insufficient energy generation from renewable
sources, the energy contained in energy storage devices can be used to supply energy to
38
the load. Many storage technologies of this kind are available in the market. Each
technology has its own characteristics in terms of specific energy (Wh/kg), specific
power (W/kg), maturity, siting ease, footprint, and overall cycle efficiency [52].
Electrochemical Battery energy storage (BES) technologies namely Lead Acid (LA),
Nickle-Cadmium (NiCd), Nickle-metal hydride (Ni-MH), Lithium ion (Li-ion), and
Sodium-Sulfur (NaS) batteries are widely used in MG energy systems [53]. The selection
of the appropriate storage technology depends on factors such as reliability and the total
cost including life cycle cost, round trip efficiency, low self-discharge, time response,
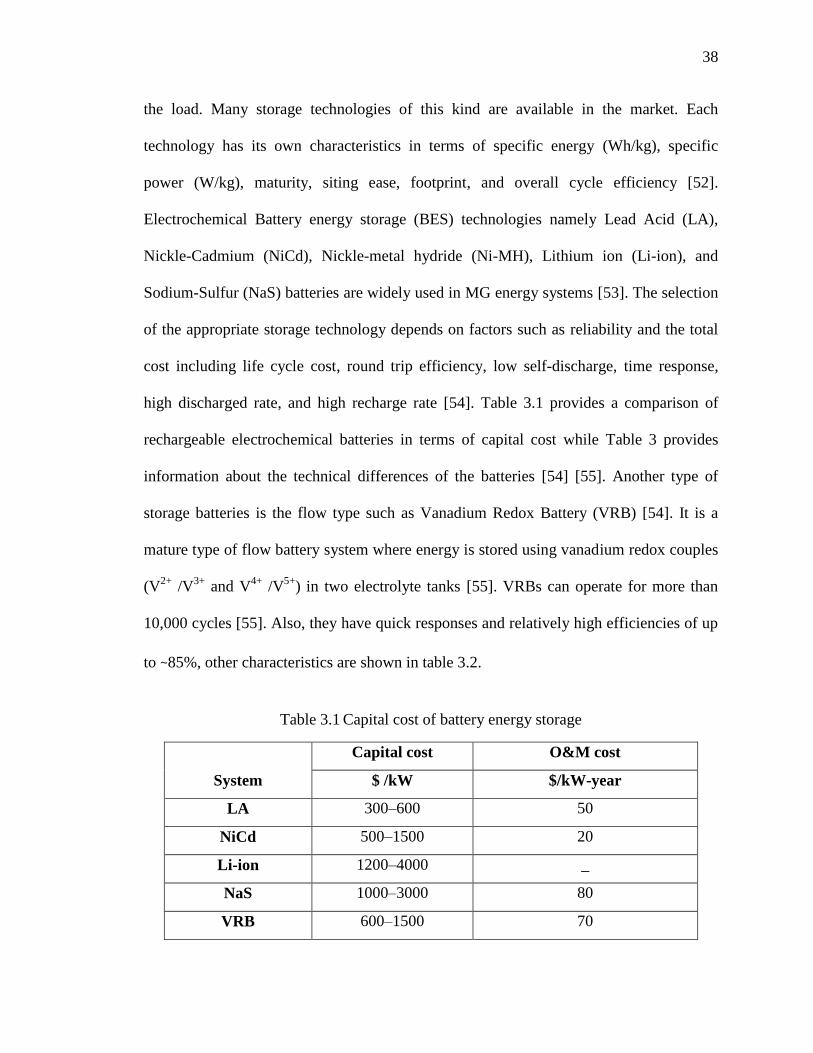
high discharged rate, and high recharge rate [54]. Table 3.1 provides a comparison of
rechargeable electrochemical batteries in terms of capital cost while Table 3 provides
information about the technical differences of the batteries [54] [55]. Another type of
storage batteries is the flow type such as Vanadium Redox Battery (VRB) [54]. It is a
mature type of flow battery system where energy is stored using vanadium redox couples
(V2+
/V3+
and V4+
/V5+
) in two electrolyte tanks [55]. VRBs can operate for more than
10,000 cycles [55]. Also, they have quick responses and relatively high efficiencies of up
to ∼85%, other characteristics are shown in table 3.2.
Table 3.1 Capital cost of battery energy storage
System
Capital cost O&M cost
$ /kW $/kW-year
LA 300–600 50
NiCd 500–1500 20
Li-ion 1200–4000 _
NaS 1000–3000 80
VRB 600–1500 70

39
Table 3.2 Comparison of properties of different types of battery storage technologies
Technology
Power
rating
(MW)
Discharge
time
Discharge
losses
(day)
Suitable
storage
duration
Cycling
capacity
Life
time
(years)
NaS 0.05–8
Seconds–
hours ∼20%
Seconds–
hours 2500 10–15
Ni–Cd 0–40
Seconds–
hours 0.2–0.6%
Minutes–
days
2000–
2500 10–20
Lead–acid 0–20
Seconds–
hours 0.1–0.3%
Minutes–
days
500–
2000 5–15
Li-ion 0–0.1
Minutes–
hours 0.1–0.3%
Minutes–
days
1000–
10,000+ 5–15
VRB ∼ 0.03–3 Seconds–
hours Small
Hours–
Months +10,000 5-10
Lead acid batteries are one of the most widely used energy storage technologies in
an MG system because they have low energy cost per kWh ($300-$600 per kWh) and it
is a mature technology [55]. Lead acid batteries have low self-discharged rates of less
than 0.3% and a high cycle efficiency of up to 90% [55]. Deep cycle lead acid batteries
are designed to withstand more deep discharge cycles which make them a good choice
for an islanded MG system. There are two types of deep cycle lead acid batteries, flooded
and valve-regulated. The valve-regulated type includes Absorbent Glass Mat (AGM) and
gel technologies to eliminate the need for water addition. Battery life cycle is affected
significantly by the DOD, current, performance of charge controller, temperature, and
duration of time the battery at a low SOC [56] [57]. Temperature effects on the capacity
of lead acid batteries and their lifespan are often ignored because of the assumption that
the battery bank is in a climate control system [58]. In this research, only DOD is
considered from the manufacturer data sheet. Figure 3.5 shows a typical curve that
represents the number of cycles versus the DOD of the battery [56]. There are many
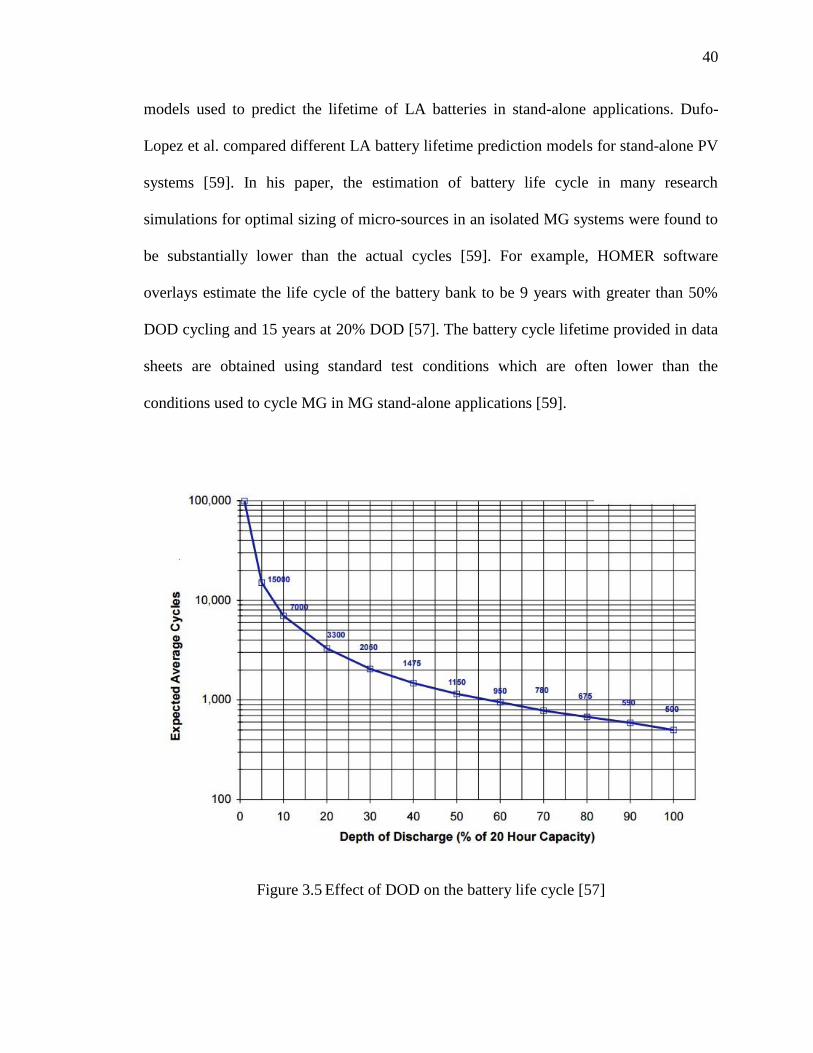
40
models used to predict the lifetime of LA batteries in stand-alone applications. Dufo-
Lopez et al. compared different LA battery lifetime prediction models for stand-alone PV
systems [59]. In his paper, the estimation of battery life cycle in many research
simulations for optimal sizing of micro-sources in an isolated MG systems were found to
be substantially lower than the actual cycles [59]. For example, HOMER software
overlays estimate the life cycle of the battery bank to be 9 years with greater than 50%
DOD cycling and 15 years at 20% DOD [57]. The battery cycle lifetime provided in data
sheets are obtained using standard test conditions which are often lower than the
conditions used to cycle MG in MG stand-alone applications [59].
Figure 3.5 Effect of DOD on the battery life cycle [57]
41
To represent the SOC of the battery storage, the following simplified model is
used [43] [31]:
SOC (t) = 𝐸𝐵(𝑡 − 1) + [𝐸𝑔(𝑡) − 𝐸𝐿 (𝑡)]𝜂𝐵 (6)
𝐷𝑂𝐷(𝑡) = 1 − 𝑆𝑂𝐶(𝑡) (7)
In this equation, t represents the time in hours, 𝐸𝐵 is the remaining battery energy
capacity, 𝐸𝑔 is the generated power by the PV modules, WG, 𝐸𝐿 is the load energy
demand, and 𝜂𝐵 is the round trip efficiency of the battery storage.
In a hybrid MG system, it is important to measure the excess power generated
(EPG) to find the annual excess amount of power generated by the hybrid micro-sources
[30]. For any combination of PV/Wind/battery system, there will be times when load
demand is lower than the load generation and the excess power is not utilized due to fully
charged battery energy storage. EPG is defined as ratio of the total annual excess of
power generated by the hybrid micro-sources in a MG system in year to the total annual
load in the year. The following equation represents this relationship [30]:
𝐸𝑃𝐺 = ∑ [𝐸𝐵 + (𝐸𝑔 − 𝐸𝐿)]ℎ𝑡=1 (8)
The remaining utilized energy (UE) is used for the economic evaluation of system cost
and can be found using the following equation:
𝑈𝐸 = (𝐸𝐺 − 𝐸𝑃𝐺) (9)
In this equation, EG is the energy generated by the PV modules and WGs.

42
4. THE FOREVER POWER METHODOLOGY FOR THE OPTIMAL SIZING
PROBLEM
4.1 INTRODUCTION
The Forever Power method is an iterative method that uses the number of PV
modules, WGs, and the capacity of battery storage units to achieve the targeted
availability of power supply, the fraction of the time when energy is available, and
economic criteria [59]. This method was first introduced by Kimball et al. to find the
optimal size of PV/battery hybrid system [60].
4.1.1 Reliability Criteria. Availability is markedly different from reliability.
Reliability is the ability of a system to operate without failure while availability is the
fraction of time at which the energy is available to the load throughout the system life
cycle. However, a highly reliable renewable energy system does not guarantee high
availability of power due to insufficient energy storage. Therefore, assuming that a
hybrid energy system is reliable, the availability of power supply can be used as a
criterion of reliability. The Forever Power method in Figure 26 has been used to provide
hourly checks that the power demand by the load (PL) is met while the energy content of
the battery bank does not fall below the minimum DOD. In this flowchart, n and m are
the number of PV modules and WGs, respectively, Ppv is the power generated by PV
modules, and Pw is the power generated by WGs. To find all availabilities and LCOE
that correspond to all combinations of PV modules and WGs, the flow chart in Figure 4.1
is used. To apply this method, the hourly data of solar irradiance, temperature, and wind
speed of the selected location for the MG. Moreover, other data are taken from

43
manufacturer technical sheet such 𝐴𝑝𝑣, 𝜂𝑟, 𝜂𝑝𝑐, NOCT, 𝑃𝑟, 𝑉𝑓, 𝑉𝑟, 𝑉𝑐, and hub height of
the wind turbine.
Figure 4.1 The Forever Power loop
ES(t-1)= Maximum Stored Capacity
ES (t) =ES(t-1)+[ Ppv(t)× 𝑛 + Pw(t) ×𝑚 − PL(t)]
ES> 𝐸𝑚𝑎𝑥
ES< 𝐸𝑚𝑖𝑛
ES=Emax
ES
=E
min
Unav
ailability
=unav
ailability
+1
More time
available?
Availability=1 −unavailability
total time
Yes
Yes
No
No
No
Yes
t=t+1

44
Figure 4.2 Overall Algorithm for unit sizing of PV/Wind/Battery Hybrid MG system

45
The Forever Power algorithm is applied to the PV module alone with battery
energy storage to find the maximum number of PV modules needed to reach 100%
availability of power. The algorithm is then applied to the WG alone to determine the
maximum number of WGs needed to reach 70 % availability of power. These algorithms
are shown in Figure 4.2. Following these calculations, a total power matrix can be created
which contains all combinations of PV modules and WGs as shown in (10) below.
𝑃𝑡 =
[ 𝑃𝑝𝑣 (𝑃𝑝𝑣 + 𝑃𝑤) … (𝑃𝑝𝑣 + 𝑚𝑃𝑤)
2𝑃𝑝𝑣 (2𝑃𝑝𝑣 + 𝑃𝑤) … (2𝑃𝑝𝑣 + 𝑚𝑃𝑤)
⋮𝑛𝑃𝑝𝑣
⋱…
⋮(𝑛𝑃𝑝𝑣 + 𝑚𝑃𝑤)]
(10)
Finally, the total power matrix is used again with the forever power loop of Figure 26 to
find the availability matrix below (11).
𝐴𝑣𝑎𝑖𝑙 = [
𝑎𝑣𝑎𝑖𝑙11 𝑎𝑣𝑎𝑖𝑙12 … 𝑎𝑣𝑎𝑖𝑙1𝑚
𝑎𝑣𝑎𝑖𝑙21 𝑎𝑣𝑎𝑖𝑙22 … 𝑎𝑣𝑎𝑖𝑙2𝑚
⋮𝑎𝑣𝑎𝑖𝑙𝑛1
⋱…
⋮𝑎𝑣𝑎𝑖𝑙𝑛𝑚
] (11)
4.1.2 System Cost. The cost of an integrated hybrid PV/wind/battery MG
system plays an important role in choosing the optimal size of the system components.
To satisfy the economic requirements of the optimal system size, researchers have
investigated many economic measures. To determine the optimal size of a system from
an economic viewpoint, researchers used methods such as measure the internal rate of
return (IRR), payback period, return of investment (ROI), and levelized cost of energy
(LCOE). In this study, LCOE was chosen to select the best economic result. It includes
the total energy generation from each source and the replacement, maintenance, and
operation costs of the system components. LCOE is measured in $/kWh which can be

46
easily compared to the cost of electricity from the utility. LCOE can be measured
according to equation (12) below:
𝐿𝐶𝑂𝐸 =𝐿𝐶𝐶
𝑈𝐸 𝑖𝑛 𝑘𝑊ℎ (12)
In this equation, LCC is the life cycle cost of the system components and UE is the
utilized energy in kWh. LCC includes initial, replacement, maintenance, and operational
costs. The objective of calculating the LCOE is to find the minimum value among all
combinations of PV/wind/battery energy sources with the targeted availabilities of power
supply. This can be achieved by minimizing the LCC and/or increasing the UE. In this
case, the availability of the power supply matrix can be used to determine the minimum
value of LCOE. To determine the total LCC of the system components, the LCC of the
PV system (LCCpv), LCC of wind generation system (LCCw), and LCC of the battery
energy system (LCCB) must be found. The following expressions are used to find the
present worth (PW) of capital cost for each system component [43]:
PWc = Pr × Co (13)
Pr = (1+i
1+d)n
= xn (14)
In this equation, Co is the component capital cost, Pr is the present worth factor for each
component which will be the purchased n years later, i corresponds to the inflation rate,
and d represents the discount rate.
As a result, the following expression is used to find the LCC of each system component
[43]:
LCC = PWc + PWmaint + PWreplace (15)

47
In this equation, PWmaint is the present worth of maintenance cost of each component and
can be calculated using the cumulative compound factor as follows [43]:
PWmaint = Cmaint (𝑥)2 (1−𝑥𝑛
1−𝑥) (16)
In this equation, Cmaint is the maintenance cost value taken as a percentage of the capital
cost. In this study, it is assumed that the present worth of replacement cost is zero for the
PV and wind throughout the system life cycle because the replacement of the power
converters is included in the maintenance cost. The battery energy storage is assumed to
be replaced four times for the project life cycle and is measured as follows (17):
PWreplace,b = 𝐶𝑜 . xn−𝑛
5 + 𝐶𝑜 . xn−2𝑛
5 + 𝐶𝑜 . xn−3𝑛
5 + 𝐶𝑜 . xn−4𝑛
5 (17)
The capital cost of a wind turbine [63] is composed of 65% for turbine, tower, and
converter. The remaining 35% is composed of the cost of installation, cables, connectors,
and protective measures. The maintenance cost is considered to be 2% of the capital
investment in the wind energy system.
The cost of a PV system [61] is composed of 50% for the cost of modules and
50% for the cost of installation, converter(s), and racking system. The maintenance cost
is considered as 1% of the total capital cost of the PV energy system.
Using equations from 8 to 17, the EPG matrix, UE matrix, and total LCC matrix
for all combinations of PV/wind for a particular battery capacity can be determined and
used to find the LCOE matrix as shown below (18-21):

48
𝐸𝑃𝐺𝑛×𝑚 = [
𝐸𝑃𝐺11 𝐸𝑃𝐺12 … 𝐸𝑃𝐺1𝑚
𝐸𝑃𝐺21 𝐸𝑃𝐺22 … 𝐸𝑃𝐺2𝑚
⋮𝐸𝑃𝐺𝑛1
⋱…
⋮𝐸𝑃𝐺𝑛𝑚
] (18)
𝐿𝐶𝐶𝑛×𝑚 = [
𝐿𝐶𝐶11 𝐿𝐶𝐶12 … 𝐿𝐶𝐶1𝑚
𝐿𝐶𝐶21 𝐿𝐶𝐶22 … 𝐿𝐶𝐶2𝑚
⋮𝐿𝐶𝐶𝑛1
⋱…
⋮𝐿𝐶𝐶𝑛𝑚
] (19)
𝑈𝐸𝑛×𝑚 = [
𝑈𝐸11 𝑈𝐸12 … 𝑈𝐸1𝑚
𝑈𝐸21 𝑈𝐸22 … 𝑈𝐸2𝑚
⋮𝑈𝐸𝑛1
⋱…
⋮𝑈𝐸𝑛𝑚
] (20)
𝐿𝐶𝑂𝐸𝑛×𝑚 = [
𝐿𝐶𝑂𝐸11 𝐿𝐶𝑂𝐸12 … 𝐿𝐶𝑂𝐸1𝑚
𝐿𝐶𝑂𝐸21 𝐿𝐶𝑂𝐸22 … 𝐿𝐶𝑂𝐸2𝑚
⋮𝐿𝐶𝑂𝐸𝑛1
⋱…
⋮𝐿𝐶𝑂𝐸𝑛𝑚
] (21)
Finally, prices of kWh for each combination of PV/wind and battery storage
capacity can compared. Also, a minimum cost can be determined that corresponds to
each value in the availability of power supply.

49
5. APPLICATION ON A RURAL VILLAGE AT YANBU
5.1 ELECTRICAL LOAD
5.1.1 Variable Load. This study assumes 4 houses with two apartments at each
house located at a rural area near Yanbu city in Saudi Arabia. The hourly loads patterns
of these houses are assumed to be identical and were taken from Alaidroos and He paper
[62]. According to [62], the total load for a residential community at Yanbu was obtained
from Marafiq utility company. Then, Alaidroos and He [62] implemented a building
energy simulation using eQuest to generate the hourly electrical load for the residential
community. The average electrical load for the four houses is 21 kWh. The monthly
energy consumption of these houses is shown in figure 5.1.
Figure 5.1 Monthly consumptions by the village

50
Figure 5.2 shows the load variation versus temperature for 1st of January and 1
st of
August months. As shown, the temperature in the month of August causes the electricity
demand to increase due to large air conditioning loads. While, in the month of January
the temperature is low and no air conditioning is used.
Figure 5.2 Load and temperature variations versus time for one day in January and
August
It is shown in figure 5.2 that during summer the energy consumption increases. For
example, energy consumption in August is about 50% more than in January due to heavy

51
air conditioning needed during summer. Figure 5.3 shows the long term minimum and
maximum average temperature variation at Yanbu from 2007 till 2014. The maximum
temperature recorded at Yanbu during this period is about 48.5oC (119.3 F) and a
minimum value of 7.8oC (46.04 F).
Figure 5.3 Long term average temperature variation at Yanbu (2007-2014)

52
5.1.2 Applying the Forever Power Iterative Method. To apply the Forever
Power iterative method, a fixed value of battery energy storage capacity is used to test the
methodology. In literature, it is common to select a three days storage capacity [43].
Since the load is variable, the average energy per day varies from a minimum of
499.2kWh/day in January and a maximum of 775.92kWh/day in August. The average
energy per day between these two extremes is 637.56kWh/day. As a result, the three days
storage capacity considered in this study is 2000 kWh. Table 5.1 and 5.2 shows the data
of the PV module and the WG required for the Forever Power loop.
Table 5.1 PV Module type
Manufacturer Astronergy
Power at STC 305 W
NOCT 47 Co
𝜼𝒓 15.7%
𝝁 -0.445%
𝑨𝒑𝒗 1.944
Table 5.2 Wind generator type
Manufacturer Polaris America LCC
Power at rated speed 25 kW
Rated speed 10 m/s
Cut in speed 2.7 m/s
Cut out speed 25 m/s
Tower Height 30 m

53
The following combinations of PV modules and WGs were obtained as shown in figure
5.4.
Figure 5.4 Numbers of PV modules and WGs with their corresponding availability for
2000 kWh storage

54
5.1.3 Calculating the LCOE of the Hybrid MG System. The LCOE is then
found by the economic evaluation loop of all combinations of the numbers of PV
modules, WGs and battery storage MG system as shown in Figure 5.5. The figure shows
the LCOE when all the energy generated is utilized (LCOEt) and when the EPG is not
utilized (LCOEU). It is assumed that EPG is utilized at no extra cost. It is shown that the
difference between the LCOEt and LCOEU decreases as the number of WGs increase.
For example, in this particular application the LCOEU decreases by from 0.7833 $/kWh
to 0.6622 $/kWh when numbers of WGs used increase from zero to maximum as
indicated in table 5.3.
Figure 5.5 LCOE of all numbers of PV/wind energy sources with/without utilizing EPG
LC
OE
($/k
Wh
)

55
Table 5.3 below shows a comparison between two values of availabilities (99.5%
and 100%) with their LCOE including and excluding EPG. It is observed that when EPG
is utilized the LCOE has the lowest value using maximum number of WGs while it has
the highest value when EPG is not utilized. Also, decreasing the availability of power
supply by 0.5% led to a decrease in the numbers of PV modules by 18, 21, 28, and 38
modules with 0 to 3 WGs respectively. Consequently, the LCOEU and LCOEt have the
lowest value when three WGs are used. However, the decreasing numbers of PV modules
did not lead to a lower LCOE compared to 100% availability. That is because the amount
of energy generated by the numbers of PV modules used in the 100% availability is
greater in terms of cost than the cost of the number of PV modules saved throughout the
system life cycle. On the other hand, the increase of LCOEU is negligible when there is a
decrease of 0.5% in the availability of power supply.
Table 5.3 LCOE corresponding to two values of availabilities of power supply
Storage kWh 2000
Availability 99.50% 100% 99.5% 100% 99.5% 100% 99.5% 100%
number of PV
modules 285 303 231 252 192 220 158 196
number of
Wind
Generators 0 0 1 1 2 2 3 3
LCOEt
($/kWh) 0.3195 0.311 0.3345 0.3135 0.3242 0.2997 0.3112 0.2826
LCOEU($/kWh) 0.7857 0.7833 0.7108 0.7071 0.6765 0.672 0.6691 0.6622
Then, the SOC of the battery energy storage for each solution is shown in figure 5.6 (a,b),
and figure 5.7 (a, b).
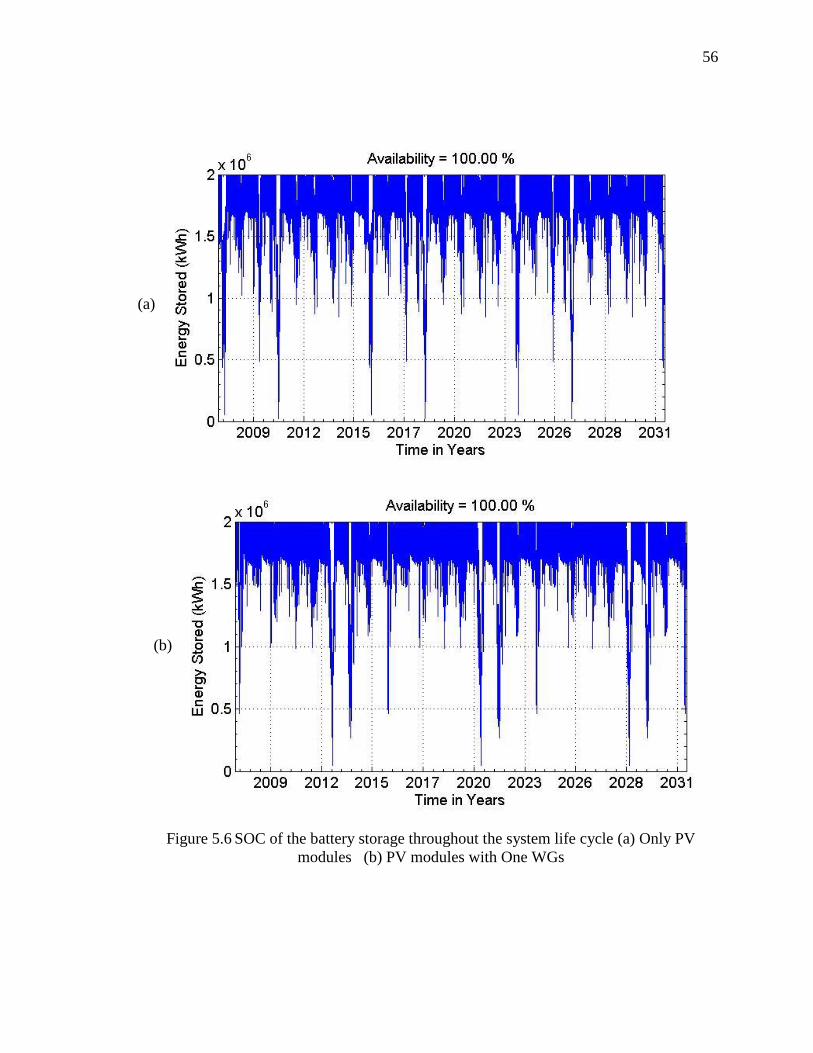
56
Figure 5.6 SOC of the battery storage throughout the system life cycle (a) Only PV
modules (b) PV modules with One WGs
(a)
(b)
57
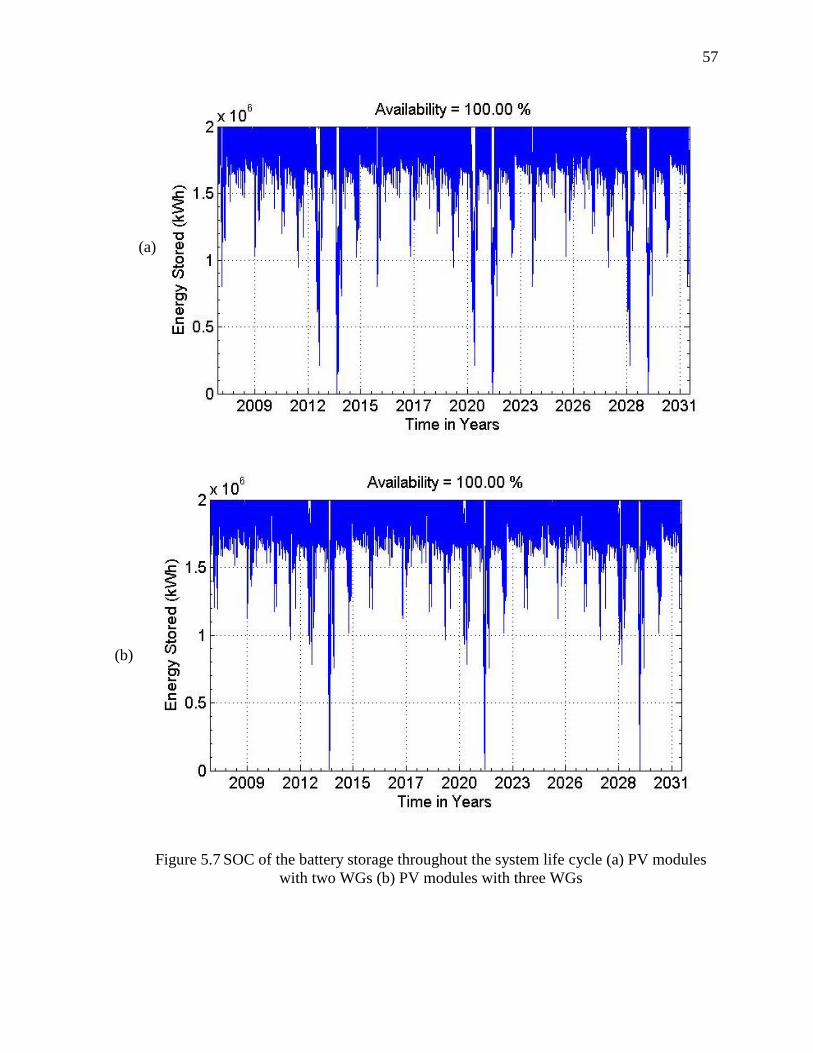
Figure 5.7 SOC of the battery storage throughout the system life cycle (a) PV modules
with two WGs (b) PV modules with three WGs
(b)
(a)
58
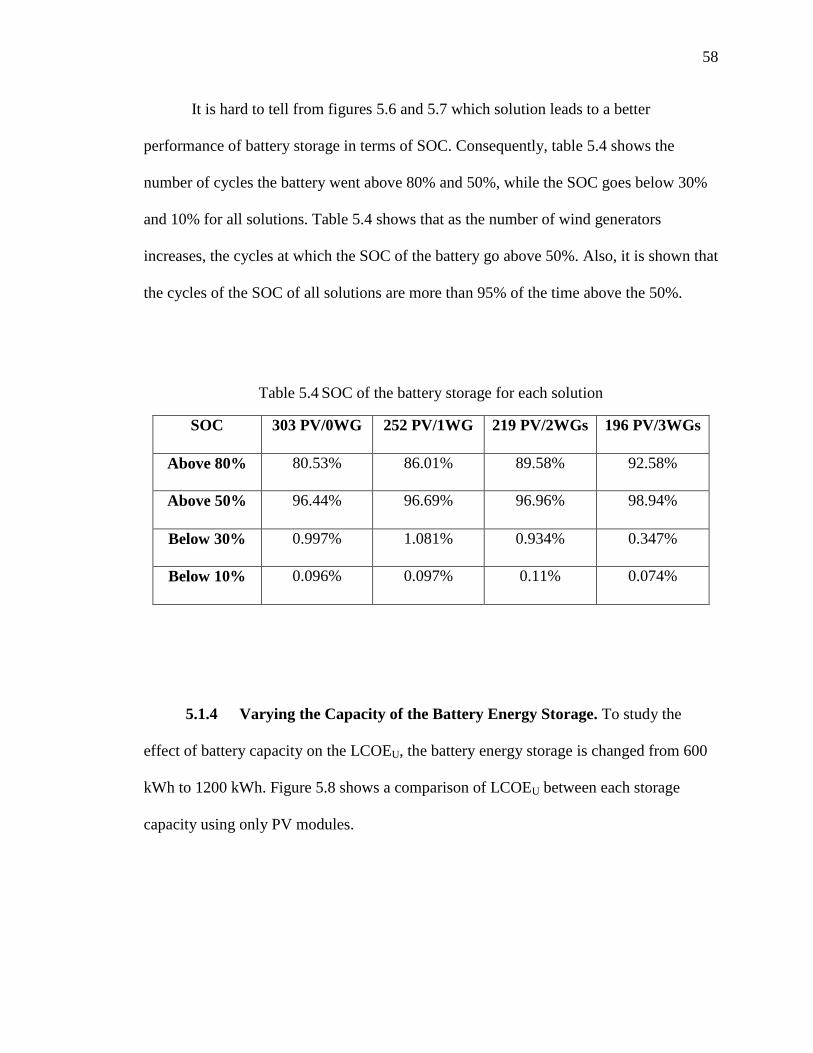
It is hard to tell from figures 5.6 and 5.7 which solution leads to a better
performance of battery storage in terms of SOC. Consequently, table 5.4 shows the
number of cycles the battery went above 80% and 50%, while the SOC goes below 30%
and 10% for all solutions. Table 5.4 shows that as the number of wind generators
increases, the cycles at which the SOC of the battery go above 50%. Also, it is shown that
the cycles of the SOC of all solutions are more than 95% of the time above the 50%.
Table 5.4 SOC of the battery storage for each solution
SOC 303 PV/0WG 252 PV/1WG 219 PV/2WGs 196 PV/3WGs
Above 80% 80.53% 86.01% 89.58% 92.58%
Above 50% 96.44% 96.69% 96.96% 98.94%
Below 30% 0.997% 1.081% 0.934% 0.347%
Below 10% 0.096% 0.097% 0.11% 0.074%
5.1.4 Varying the Capacity of the Battery Energy Storage. To study the
effect of battery capacity on the LCOEU, the battery energy storage is changed from 600
kWh to 1200 kWh. Figure 5.8 shows a comparison of LCOEU between each storage
capacity using only PV modules.

59
Figure 5.8 LCOEU at different storage capacity using only PV modules
Figure 5.9 is provided to show the effect of battery storage on the LCOEU and
LCOEt at 100% availability. It is observed that the cost of energy increases as the
capacity of battery storage increases for LCOE at utilized and unutilized EPG. Also, as
the battery capacity increases, more energy is utilized and that reduces the rate at which
the LOCEU increases with respect to the number of PV modules. Also, table 5.5 and table
5.6 show the numerical values of LCOEU and LCOEt versus the capacity of the battery
energy storage with the corresponding numbers of PV modules and WGs. It is concluded

60
that the lowest LCOEU is 0.279 $/kWh when the battery capacity is the lowest with 439
PV modules and one wind generator. On the other hand, the lowest cost of LCOEt is
0.0384 $/kWh at 600 kWh battery capacity and 1425 PV modules. However, if there is a
space limitation to this large number of PV modules, different combination is used.
Figure 5.9 Effect of battery energy storage on LCOEt and LCOEu at 100% availability of
power supply
Table 5.5 LCOEU of the PV/wind/battery energy MG system
Availability 100%
Storage (kWh) 600 700 800 900 1000 1100 1200
number of PV
modules 439 294 309 252 246 243 240
number of Wind
Generators 1 2 1 2 2 2 2
LCOEU($/kWh) 0.279 0.304 0.330 0.3586 0. 3868 0.4150 0.4434

61
Table 5.6 LCOEt of the PV/wind/battery energy MG system
Availability 100%
Storage (kWh) 600 700 800 900 1000 1100 1200
number of PV
modules 1425 961 522 397 369 347 337
number of Wind
Generators 0 0 0 0 0 0 0
LCOEt($/kWh) 0.0384 0.052 0.0874 0.12 0.1394 0.1597 0.1770
Moreover, the SOC of the battery storage for all solutions in table 5.6 are shown
in figure 5.10, figure 5.11 (a, b), figure 5.12 (a, b), and figure 5.13.
Figure 5.10 SOC of the battery storage throughout the system life cycle with 600kWh
battery storage

62
Figure 5.11 SOC of the battery storage throughout the system life cycle (a) 700 kWh (b)
800 kWh
(b)
(a)

63
Figure 5.12 SOC of the battery storage throughout the system life cycle (a) 900kWh (b)
1000 kWh
a)
b)

64
Figure 5.13 SOC of the battery storage throughout the system life cycle at (a) 1100 kWh
(b) 1200 kWh
a)
b)

65
Now, the SOC of battery storage for each capacity is calculated and given in table
5.7 below. It can be observed that as the storage capacity increases, the percentage of the
time the SOC of the battery is above 80% increases. As a result, the battery life will
improve.
Table 5.7 SOC of each battery capacities throughout the system life cycle
SOC 600
kWh
700
kWh
800
kWh
900
kWh
1000
kWh
1100
kWh
1200
kWh
Above
80%
68.97% 75.1% 71.3% 77.61% 79.95% 82.57% 85.66%
Above
50%
98.5% 98.41% 98.18% 97.36% 97.38% 97.64% 97.83%
Below
30%
0.084% 0.358% 0.418% 0.73% 0.669% 0.505% 0.413%
Below
10%
0.001% 0.029% 0.005% 0.045% 0.045% 0.0036% 0.026%
5.1.5 Constant Load. So far, Forever Power method has been applied to a
hybrid energy system with variable load. Now, we consider a constant load with 21 kW
throughout the life cycle of the system. To compare the results of variable load a 600
kWh has been used. Figure 5.14 gives an example to show the difference in terms of
availability between variable load and constant load. It can be observed that there is a
very small difference for all combinations of the hybrid micro-sources.
The results of the LCOE is also found for constant load and compared to the
LCOE for the variable load. The minimum LCOEU at 100 % availability is 0.2870 $/kWh
at 430 PV modules and two WGs compared to 0.279 $/kWh for variable load. Also, the
numbers of PV modules used decrease by around 9 modules for constant load while the
number of WGs used increased by one. Thus, the LCOEU is higher for constant load than
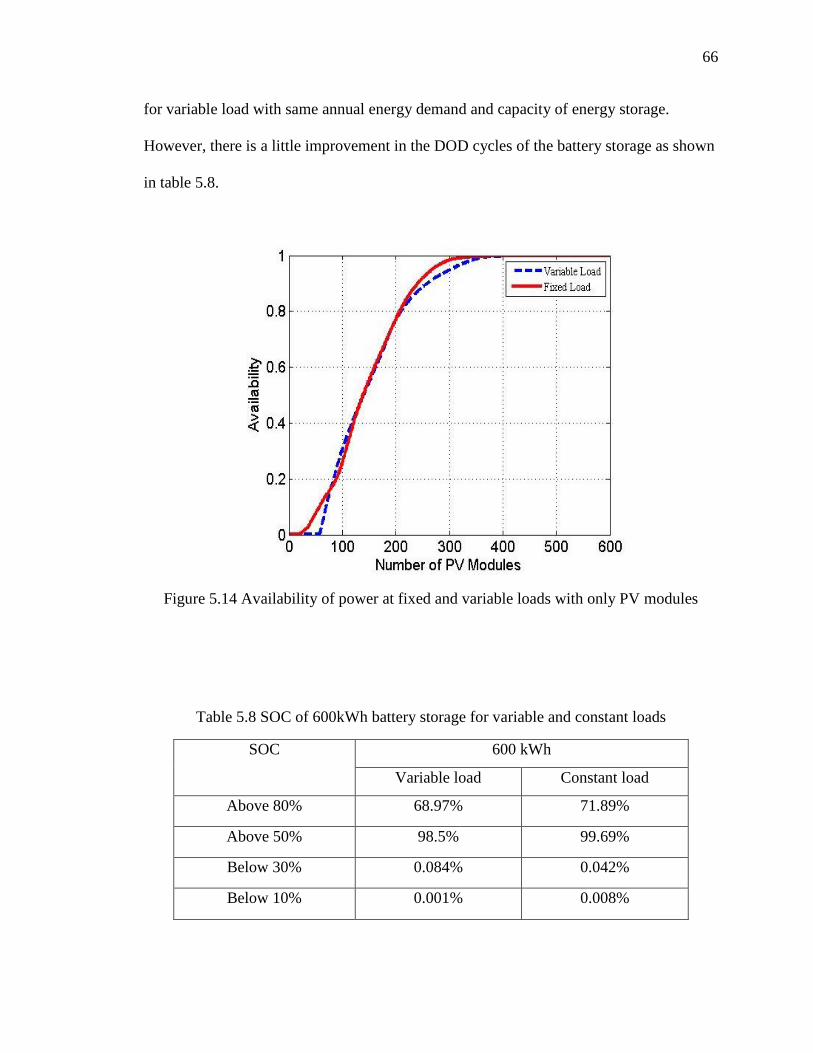
66
for variable load with same annual energy demand and capacity of energy storage.
However, there is a little improvement in the DOD cycles of the battery storage as shown
in table 5.8.
Figure 5.14 Availability of power at fixed and variable loads with only PV modules
Table 5.8 SOC of 600kWh battery storage for variable and constant loads
SOC 600 kWh
Variable load Constant load
Above 80% 68.97% 71.89%
Above 50% 98.5% 99.69%
Below 30% 0.084% 0.042%
Below 10% 0.001% 0.008%

67
5.2 USING SMALLER WIND GENERATOR
To study the effect of the size of wind generator used on the LCOE, different sizes has
been consider in this section as shown in table 5.9. Also, a 600 kWh of battery storage
has been used.
Table 5.9 Effect of wind generator size on the LCOEU
Availability 100%
Battery capacity 600 kWh
Wind generator size 25 kW 20 kW 10 kW
Number of Wind generators 1 2 5
LCOEU ($/kWh) 0.279 0.2910 0.2857
From table 5.9 we can conclude that there is a little effect of the size of wind
generator on the cost of energy. The lowest LCOEU is 0.279 $/kWh which can be
achieved by using a wind generator with rated power of 25 kW.
5.3 COMPARING TO HOMER PRO SOFTWARE
To study the effectiveness of this technique, it is compared to HOMER software.
A one year wind, solar irradiance, temperature and load have been loaded into the
program. The optimal solution, with one day storage and 0% LPSP, is shown in table
5.10. It is found that the LCOEU is 0.33 $/kWh which is higher than our results, 0.279
$/kWh, because the PV modules fade with time and are assumed to exhibit a power
output of around 80% less of the minimum peak power after 25 years. Also, different

68
rating of wind generator is used in HOMER software since it does not have a 25 kW
wind generator.
Table 5.10 Optimal solution
Power Source Type HOMER Pro Forever Power
Number of PV module (305 W) 495 439
Number of wind generators 1 (10 kW) 1 (25 kW)
Number of Battery units (1
kWh)
600 600
Initial capital cost ($) 514,900 585,253
NPC/LCC ($) 1,034,734 768,307
LCOEU ($/kWh) 0.33 0.279
5.4 UTILIZING EXCESS POWER GENERATION
To utilize the excess power generation from the PV and wind generators
economically, it is better to use this energy than storing it. The proposed solution is to use
the amount of excess power generation to supply power to a portable desalination unit at
the proposed rural village in Saudi Arabia. The country is under extreme water shortages
since there are no rivers or lakes [63]. Also, annual rainfall in Saudi Arabia is less than
100 mm [63]. The average cost of desalinated sea water is $0.8 per cubic meter while an
average Saudi family only pays $2 per year with an average consumption of 260 liter per
capita per day, which costs $0.208 to produce [63]. In this case study, it is assumed that
the total demand for water is 5,000 liter per day, sufficient for 19-20 people. Table 5.11
shows the technical specification of the selected two desalination units for this village.
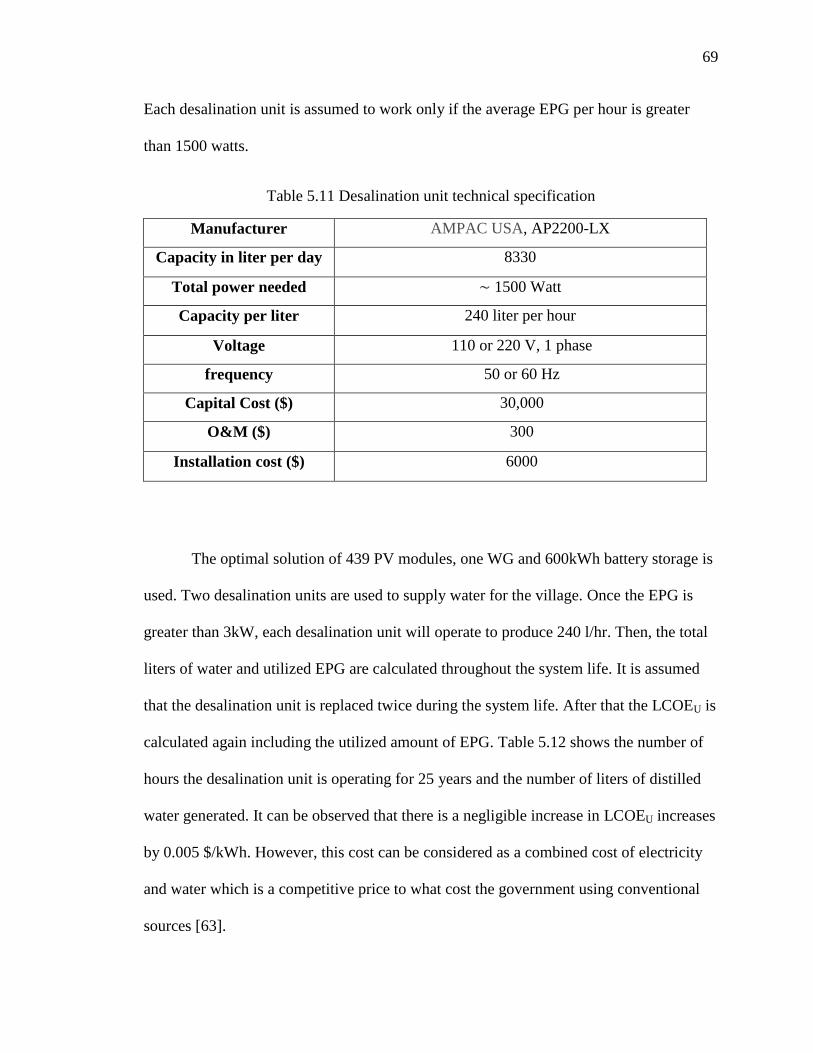
69
Each desalination unit is assumed to work only if the average EPG per hour is greater
than 1500 watts.
Table 5.11 Desalination unit technical specification
Manufacturer AMPAC USA, AP2200-LX
Capacity in liter per day 8330
Total power needed ∼ 1500 Watt
Capacity per liter 240 liter per hour
Voltage 110 or 220 V, 1 phase
frequency 50 or 60 Hz
Capital Cost ($) 30,000
O&M ($) 300
Installation cost ($) 6000
The optimal solution of 439 PV modules, one WG and 600kWh battery storage is
used. Two desalination units are used to supply water for the village. Once the EPG is
greater than 3kW, each desalination unit will operate to produce 240 l/hr. Then, the total
liters of water and utilized EPG are calculated throughout the system life. It is assumed
that the desalination unit is replaced twice during the system life. After that the LCOEU is
calculated again including the utilized amount of EPG. Table 5.12 shows the number of
hours the desalination unit is operating for 25 years and the number of liters of distilled
water generated. It can be observed that there is a negligible increase in LCOEU increases
by 0.005 $/kWh. However, this cost can be considered as a combined cost of electricity
and water which is a competitive price to what cost the government using conventional
sources [63].

70
Table 5.12 using EPG to power two portable desalination units (for 25 years)
Number of desalination unit 2
Number of hours the desalination units
operate
93,815 hours
EPG used 281,445 kWh
Average water per day 5346 liter per day
Updated LCOEU 0.2845 $/kWh

71
6. CONCLUSION
In this thesis the Forever Power methodology has been developed to iteratively
find the optimal size of PV/wind/battery hybrid energy system based on the availability
of power supply and the lowest cost of energy. In this method, typical meteorological
year data sets of hourly solar irradiance, temperature, and wind speed are needed to apply
this method to a known electrical load. To verify the effectiveness of the methodology
and the assumptions made, it was applied to a rural village near Yanbu city, Saudi
Arabia. The village was assumed to have four homes with identical variable loads that
have a combined average power of 21 kW. The battery storage was assumed to have four
replacements throughout the system life cycle. This is justified since the DOD does not
go below 50% for more than 97% of the time. Moreover, it was demonstrated that
constant load profile can lead to almost similar LCOEU as for variable load with same
average power. Also, it was observed that the size of the wind turbine has negligible
effect on the LCOEU. On the other hand, the battery capacity has a large effect on the
LCOEU. It is recommended to start the iteration with one day storage and increment up to
three days storage for the hybrid MG system. The optimal solution on this particular case
study was found to be 0.279 $/kWh which is higher than what cost from utility, 0.2133
$/kWh, before government subsidies. However, after utilizing EPG to power two
desalination units to cover water demand by the village the combined cost of electricity
and water is 0.281 $/kWh which is lower than the combined cost of water and electricity
from utility [63]. It is recommended that government of Saudi Arabia need to use wind
and solar hybrid energy system to electrify rural villages and provide water supply
instead of using diesel generators for economic and environmental benefits.

72
In this thesis, simplified model of PV, wind and battery energy storage have been
used. It is better to have more accurate model for the PV array that includes tilt angle
effect on PV model. Also, a more accurate model for wind generator to include swept
area will be considered. Moreover, accurate model for the battery energy storage that
includes temperature effect on the capacity is going to be used. Finally, fading of PV
module and battery capacity will be included in the iteration.

73
REFERENCES
[1] U.S. Energy Information Administration (EIA), 'Saudi Arabia - Analysis - U.S.
Energy Information Administration (EIA)', 2015. [Online]. Available:
http://www.eia.gov/countries/cab.cfm?fips=SA. [Accessed: 20- Feb- 2015].
[2] Middle East Economic Survey, "Saudi Arabia in Power Generation Efficiency
Drive" (April 4, 2014), page 8.
[3] A. Alshehry and M. Belloumi, 'Energy consumption, carbon dioxide emissions and
economic growth: The case of Saudi Arabia', Renewable and Sustainable Energy
Reviews, vol. 41, pp. 237-247, 2015.
[4] Saudi Electricity Company, 'Saudi Electricity Company Annual Report 2013',
2014. [Online]. Available: https://www.se.com.sa/en-us/Pages/AnnualReports.aspx.
[Accessed: 03- Feb- 2015].
[5] Middle East Economic Survey, "KACARE Outlines Saudi Electricity Energy
Source Scenario" (May 3, 2013), page 7.
[6] Alghanim. M.H, Mallick. P.K,“ Utilization of Smart Grid and Renewable Energy
toward a Sustainable Future in Saudi Arabia.” International Conference on
Renewable Energies and Power Quality (ICREPQ’15), March, 2015.
[7] Saudi Arabia energy efficiency report, ABB global, April, 2012. (Online, 2015)
[8] The Electricity & Cogeneration Regulatory Authority (ECRA) 'Activities and
Achievements of the Authority 2013', 2014. [Online]. Available:
http://www.ecra.gov.sa/reports.aspx. [Accessed: 05- Feb- 2015].
[9] I. Mahtab, 'Global Markets: Solar in Saudi Arabia', Saudi Arabia Solar Industry
Association, 2014.
[10] The Electricity & Cogeneration Regulatory Authority (ECRA) 'Activities and
Achievements of the Authority 2013', 2014. [Online]. Available:
http://www.ecra.gov.sa/reports.aspx. [Accessed: 05- Feb- 2015].

74
[11] Ecra.gov.sa, 'The electricity & cogeneration Regulatory Authority', 2015. [Online].
Available: http://www.ecra.gov.sa/home.aspx. [Accessed: 07- Mar- 2015].
[12] Middle East Economic Survey, "KACARE Outlines Saudi Electricity Energy
Source Scenario" (May 3, 2013), page 7
[13] Deaves, M. “Solar achieves grid parity in Saudi Arabia – Significant developments
expected”, ClearSky Advisors, Feb. 2015 [online]
[14] S. Rehman, M. Bader and S. Al-Moallem, 'Cost of solar energy generated using
PV panels',Renewable and Sustainable Energy Reviews, vol. 11, no. 8, pp. 1843-
1857, 2007.
[15] A. Almasoud and H. Gandayh, 'Future of solar energy in Saudi Arabia', Journal of
King Saud University - Engineering Sciences, vol. 27, no. 2, pp. 153-157, 2015.
[16] State University of New York/ Albany, March 1999 – February 2013; DeLorme
World Base Map 2010, DeLorme Publishing Company. Inc.
[17] S. Alawaji, 'Evaluation of solar energy research and its applications in Saudi
Arabia — 20 years of experience', Renewable and Sustainable Energy Reviews,
vol. 5, no. 1, pp. 59-77, 2001.
[18] M. Amin and M. El-Samanoudy, 'Feasibility study of wind energy utilization in
Saudi Arabia',Journal of Wind Engineering and Industrial Aerodynamics, vol. 18,
no. 2, pp. 153-163, 1985.
[19] Ansari J, Madni IK, Bakhsh H. Saudi Arabian wind energy atlas. Riyadh, Saudi
Arabia: KACST; 1986, p. 1-27.
[20] S. Rehman, T. Halawani and T. Husain, 'Weibull parameters for wind speed
distribution in Saudi Arabia', Solar Energy, vol. 53, no. 6, pp. 473-479, 1994.
[21] S. Rehman, T. Halawani and M. Mohandes, 'Wind power cost assessment at
twenty locations in the kingdom of Saudi Arabia', Renewable Energy, vol. 28, no.
4, pp. 573-583, 2003.

75
[22] Said SAM, El-Amin IM, Al-Shehri AM. Renewable energy potentials in Saudi
Arabia. In: Beirut regional collaboration workshop on energy efficiency and
renewable energy technology. American University of Beirut; April 2004. p.76-82.
[23] S. Rehman, 'Prospects of wind farm development in Saudi Arabia', Renewable
Energy, vol. 30, no. 3, pp. 447-463, 2005.
[24] Rahman F, Rehman S, Arif M, Majeed A., “Overview of energy storage systems
for storing electricity from renewable energy sources in Saudi Arabia.” Renew
Sustain Energy Rev, Vol. 16, pp.274–283, 2012.
[25] International Energy Agency, 'World Energy Outlook 2014', 2015. [Online].
Available: http://www.worldenergyoutlook.org/resources/energydevelopment/.
[Accessed: 06- Apr- 2015].
[26] The Department of Energy, "Summary Report: 2012 DOE Microgrid Workshop,"
DOE EERE, Chicago, 2012.
[27] T. Glenwright, "http://www.smartgrid-live.com/wp-
content/uploads/2012/12/Introduction to-Microgrids-by-Tristan-Glenwright.pdf.,"
December 2012. [Online].
[28] R. Luna-Rubio, M. Trejo-Perea, D. Vargas-Vázquez and G. Ríos-Moreno,
'Optimal sizing of renewable hybrids energy systems: A review of
methodologies', Solar Energy, vol. 86, no. 4, pp. 1077-1088, 2012.
[29] A. Chauhan and R. Saini, 'A review on Integrated Renewable Energy System
based power generation for stand-alone applications: Configurations, storage
options, sizing methodologies and control', Renewable and Sustainable Energy
Reviews, vol. 38, pp. 99-120, 2014.
[30] S. Diaf, M. Belhamel, M. Haddadi and A. Louche, 'Technical and economic
assessment of hybrid photovoltaic/wind system with battery storage in Corsica
island', Energy Policy, vol. 36, no. 2, pp. 743-754, 2008.
[31] A. Prasad and E. Natarajan, 'Optimization of integrated photovoltaic–wind power
generation systems with battery storage', Energy, vol. 31, no. 12, pp. 1943-1954,
2006.

76
[32] H. Yang, L. Lu and W. Zhou, 'A novel optimization sizing model for hybrid solar-
wind power generation system', Solar Energy, vol. 81, no. 1, pp. 76-84, 2007.
[33] H. Yang, W. Zhou, L. Lu and Z. Fang, 'Optimal sizing method for stand-alone
hybrid solar–wind system with LPSP technology by using genetic algorithm', Solar
Energy, vol. 82, no. 4, pp. 354-367, 2008.
[34] Hongxing Yang , Lin Lu, Wei Zhou. A novel optimization sizing model for hybrid
solar-wind power generation system, Solar Energy 81 (2007) 76–84.
[35] A. Askarzadeh, 'A discrete chaotic harmony search-based simulated annealing
algorithm for optimum design of PV/wind hybrid system', Solar Energy, vol. 97,
pp. 93-101, 2013.
[36] R. Kumar, R. Gupta and A. Bansal, 'Economic analysis and power management of
a stand-alone wind/photovoltaic hybrid energy system using biogeography based
optimization algorithm', Swarm and Evolutionary Computation, vol. 8, pp. 33-43,
2013.
[37] O. Ekren and B. Ekren, 'Size optimization of a PV/wind hybrid energy conversion
system with battery storage using response surface methodology', Applied Energy,
vol. 85, no. 11, pp. 1086-1101, 2008.
[38] A. Arabali, M. Ghofrani, M. Etezadi-Amoli, M. Fadali and Y. Baghzouz, 'Genetic-
Algorithm-Based Optimization Approach for Energy Management', IEEE Trans.
Power Delivery, vol. 28, no. 1, pp. 162-170, 2013.
[39] A. Kashefi Kaviani, G. Riahy and S. Kouhsari, 'Optimal design of a reliable
hydrogen-based stand-alone wind/PV generating system, considering component
outages', Renewable Energy, vol. 34, no. 11, pp. 2380-2390, 2009.
[40] Y. Katsigiannis, P. Georgilakis and E. Karapidakis, 'Multiobjective genetic
algorithm solution to the optimum economic and environmental performance
problem of small autonomous hybrid power systems with renewables', IET Renew.
Power Gener., vol. 4, no. 5, p. 404, 2010.
[41] P. Moura and A. de Almeida, 'Multi-objective optimization of a mixed renewable
system with demand-side management', Renewable and Sustainable Energy
Reviews, vol. 14, no. 5, pp. 1461-1468, 2010.

77
[42] B. Ould Bilal, V. Sambou, P. Ndiaye, C. Kébé and M. Ndongo, 'Optimal design of
a hybrid solar–wind-battery system using the minimization of the annualized cost
system and the minimization of the loss of power supply probability
(LPSP)', Renewable Energy, vol. 35, no. 10, pp. 2388-2390, 2010.
[43] D. Abbes, A. Martinez and G. Champenois, 'Life cycle cost, embodied energy and
loss of power supply probability for the optimal design of hybrid power
systems', Mathematics and Computers in Simulation, vol. 98, pp. 46-62, 2014.
[44] S. Karaki, R. Chedid and R. Ramadan, 'Probabilistic performance assessment of
autonomous solar-wind energy conversion systems', IEEE Trans. On energy
Conversion, vol. 14, no. 3, pp. 766-772, 1999.
[45] H. Yang, L. Lu and J. Burnett, 'Weather data and probability analysis of hybrid
photovoltaic–wind power generation systems in Hong Kong', Renewable Energy,
vol. 28, no. 11, pp. 1813-1824, 2003.
[46] G. Tina and S. Gagliano, 'Probabilistic analysis of weather data for a hybrid
solar/wind energy system', International Journal of Energy Research, vol. 35, no.
3, pp. 221-232, 2011.
[47] G. Tina, S. Gagliano and S. Raiti, 'Hybrid solar/wind power system probabilistic
modelling for long-term performance assessment', Solar Energy, vol. 80, no. 5, pp.
578-588, 2006.
[48] D. Khatod, V. Pant and J. Sharma, 'Analytical Approach for Well-Being
Assessment of Small Autonomous Power Systems With Solar and Wind Energy
Sources', IEEE Transactions on Energy Conversion, vol. 25, no. 2, pp. 535-545,
2010.
[49] N. Mohammad, M. Quamruzzaman, M. Hossain and M. Alam, 'Parasitic Effects
on the Performance of DC-DC SEPIC in Photovoltaic Maximum Power Point
Tracking Applications', SGRE, vol. 04, no. 01, pp. 113-121, 2013.
[50] R. Francisco and D. Cruz, 'An Optimized Maximum Power Point Tracking Method
Based on PV Surface Temperature Measurement', Sustainable Energy - Recent
Studies, 2012.

78
[51] National Instruments, “Wind Turbine Control Methods.” Published: Dec, 03,2008,
available online: http://www.ni.com/white-paper/8189/en/
[52] J. Tester, Sustainable energy. Cambridge, Mass.: MIT Press, 2005.
[53] A. Ernesto, M. Gustavo and P. Enrique, 'Dynamic Modelling of Advanced Battery
Energy Storage System for Grid-Tied AC Microgrid Applications', Energy Storage
- Technologies and Applications, 2013.
[54] H. Zhao, Q. Wu, S. Hu, H. Xu and C. Rasmussen, 'Review of energy storage
system for wind power integration support', Applied Energy, vol. 137, pp. 545-553,
2015.
[55] X. Luo, J. Wang, M. Dooner and J. Clarke, 'Overview of current development in
electrical energy storage technologies and the application potential in power
system operation', Applied Energy, vol. 137, pp. 511-536, 2015.
[56] James J. Kauzlarich, “Wheelchair batteries II: Capacity, sizing, and life” Journal of
Rehabilitation Research and Development Vol . 27 No. 2, 1990 Pages 163-170.
[57] U.S. Battery, Leader in Deep Cycle Batteries, 'Expected Cycle Life vs. DOD',
2014. [Online]. Available: http://usbattery.com/. [Accessed: 13- May- 2015].
[58] E. Hittinger, T. Wiley, J. Kluza and J. Whitacre, 'Evaluating the value of batteries
in microgrid electricity systems using an improved Energy Systems
Model', Energy Conversion and Management, vol. 89, pp. 458-472, 2015.
[59] R. Dufo-López, J. Lujano-Rojas and J. Bernal-Agustín, 'Comparison of different
lead–acid battery lifetime prediction models for use in simulation of stand-alone
photovoltaic systems', Applied Energy, vol. 115, pp. 242-253, 2014.
[60] J. Kimball, B. Kuhn and R. Balog, 'A System Design Approach for Unattended
Solar Energy Harvesting Supply', IEEE Transactions on Power Electronics, vol.
24, no. 4, pp. 952-962, 2009.
[61] T. Johansson and L. Burnham, Renewable energy. Washington, D.C.: Island Press,
1993.

79
[62] A. Alaidroos and L. He, 'Feasibility Of Renewable Energy Based Distributed
Generations In Yanbu, Saudi Arabia', Oxford Abstracts: American Solar Energy
Society, 2012. [Online]. Available: https://ases.conference-services.net. [Accessed:
10- Oct- 2014].
[63] Ouda. Omar, “Towards Assessment of Saudi Arabia Public Awareness of Water
Shortage Problem.” Resources and Environment, vol. 3.pp.10-13, 2013.

80
VITA
Sami Hamed Alalwani was born on March 13, 1985 at Yanbu, Saudi Arabia. His
high school education was completed in Haneen High school, Yanbu, Saudi Arabia. He
received his Bachelor of Science degree in Electrical Engineering Technology from
Yanbu Industrial College, Yanbu, Saudi Arabia in April 2011. In June of 2011, Sami
joined Royal Commission of Yanbu Colleges and Institutes as an instructor in the
Electrical power engineering technology department. In August 2013, he began his
Master of Science program in Electrical Engineering at Missouri University of Science
and Technology. He obtained his Master’s degree in August, 2015.
Top Related