


Languages
Pages
Legal


Operations Exploration Using Mine Scale Structural Using Mine Scale Structural
Definition, Cobar NSW including a including a
CSA Mine Case Study““Rejuvenating historical and
producing operations”
Cobar Conference August 6, 2010
Jason Hosken
XstractGroup.com Xstract – Excellence from the outset
ENVIRONMENT | GEOLOGY | MINING | PROCESSING | VALUATION | RISK | TECHNOLOGIES

Introduction
Adding value using mine geology based on my experience inAdding value using mine geology based on my experience in Cobar, 2002 – 2006 (CSA Mine):
Process: h l f Overview historical information Visit nearby operations Detailed mine mapping Regional versus mine scale controls Geology constrained block models Exploration targetingp g g Seek $$$$$$ Drill ...... then drill some more
XstractGroup.com 2

Cobar Basin (David, 2006)
XstractGroup.com 3

Cobar Deposits – Overview
Formation during inversion of Cobar BasinFormation during inversion of Cobar Basin Typically sediment hosted St t ll t ll d R i l l f lt/ h fl id Structurally controlled: Regional scale fault/shear fluid
channels (Peak to Endeavor)D til hi h t i t i ll i l f ld li b Ductile high strain zones typically on regional fold limbs
Deposits are elongate in the dominant stretching li tilineation Down plunge extent >400m to >1km N idth l 30 Narrow width, commonly <30m Strike length, <300m
XstractGroup.com 4
Cobar Deposits – Overview contcont.,
f b d h i i l Geometry of orebody host structures is not simple Deposits locations shown within regional structures
hosting mine ‘footprint’ – bedding, folding, shears, cleavage
Mine scale structures/controls not always shown in detail
XstractGroup.com 5

Peak Deposit Plan at 500L (Lawrie Hinman 1998) (Lawrie, Hinman, 1998)
XstractGroup.com 6

Endeavor Deposit
XstractGroup.com 7
Lawrie, Hinman 1998 (after Lawrie 1988, 1989)Nicholson, Mares, Smith 2006

New Occidental Deposit (Stegman Pocock 1996)(Stegman, Pocock, 1996)
After Mulholland and Rayner, 1961
XstractGroup.com 8

CSA Mine Geology Plan
M D tt S ith J ff 1996McDermott, Smith, Jefferey, 1996
XstractGroup.com 9
Mineralisation Footprint
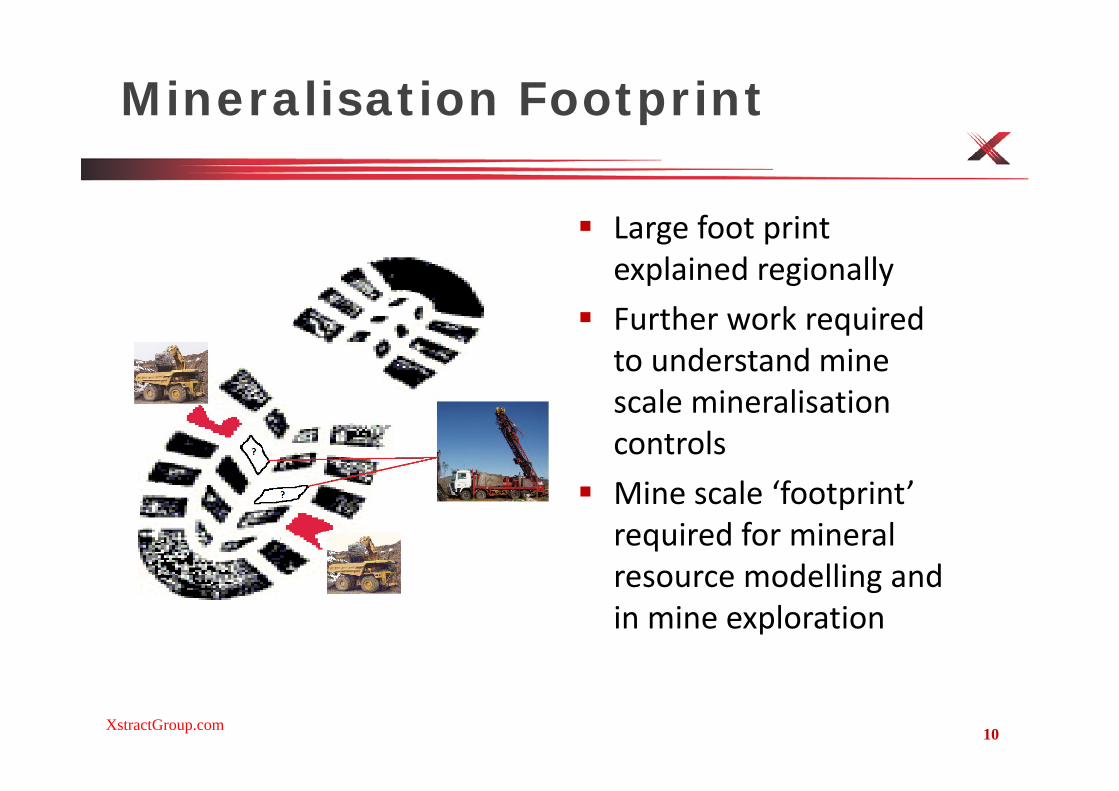
f i Large foot print explained regionally
Further work required to understand mine
l i li tiscale mineralisation controlsMi l ‘f t i t’ Mine scale ‘footprint’ required for mineral resource modelling andresource modelling and in mine exploration
XstractGroup.com 10

Mine Geologist Predicament
How to model dataHow to model data Inside regional footprint ‐ Join the
dots? Short term mine future takes Short term mine future takes
priority (no mine = no drilling) Looking for geological
relationshipsrelationships Structures defining grade
boundaries Structure intersections Structure intersections Mappable boundaries required
for mineral resource definition and target generationand target generation
XstractGroup.com 11
(CSA Mine 2006)

CSA Copper Mine: In Mine Exploration Case Study Mine HistoryCase Study. Mine History
Discovered 1871 Large scale mechanised mining
commenced in 1965 Mine closed in 1998 Glencore re‐open mine in 1999 (low
tonnage, high grade focus) 1999‐2002: teething issues, focus on1999 2002: teething issues, focus on
production and daily issues. Mapping not a focus
2002‐2003: Push to catch up mapping p pp gand understand controls
2003‐2004: develop structurally constrained block models
2004‐2006: ramp up in mine exploration using targets defined by structural definition
XstractGroup.com 12
2006‐2010: increased production rates

CSA Footprint
Extensive documentation on Extensive documentation on CSA regional geology
Four mineralised ‘systems’ine
005) Four mineralised systems
within CSA regional footprint Mapping trends over time
ning
CSA
Mtockton, 20
with different theories Extensive underground
kmalies d
efin
McQ
ueen, S
workings expose structures controlling mineralisation
nsoil an
om(M
unro, M
Cu+P
b+Zn
footprint
XstractGroup.com 13

CSA: 9L to 11L Compilation 1993 9L to 11L Compilation, 1993
XstractGroup.com 14
Mapping and Exploration Strategy – QTS NorthStrategy – QTS North
Stage 1: Start with small lenses can see lens controlling Stage 1: Start with small lenses – can see lens controlling structures in a small area
Stage 2: Move to larger lenses Stage 2: Move to larger lenses Stage 3: Begin to define local mine scale footprint in 3D
St 4 D t i t t l ti i f h t t t Stage 4: Determine structural timing of host structures Stage 5: Use mine scale footprint to define exploration
targetstargets
XstractGroup.com 15

Stage 1: Small Lode Scale MappingMapping
9185 R Lens 9185 R Lens Begin building knowledge
on quartz veining andon quartz veining and relationship to mineralisation
XstractGroup.com 16

Stage 2: Defining Structural ControlsControls
XstractGroup.com 17
9010L Map 9010L Model
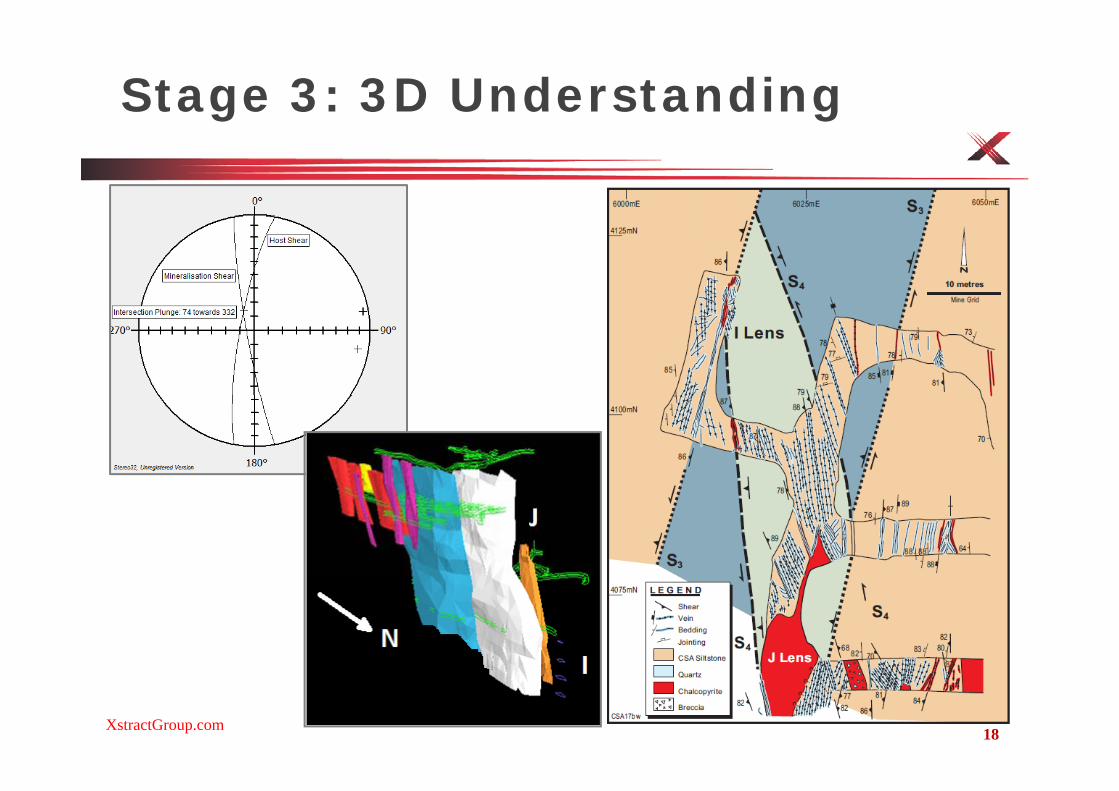
Stage 3: 3D Understanding
XstractGroup.com 18

Stage 4: Structural Timing
N
XstractGroup.com 19

QTS North: Schematic Diagram of Mineralisation - Footprintof Mineralisation - Footprint
XstractGroup.com 20
CSA Deposits – Exploration ModelModel
Mapping provided:Mapping provided:1. Confidence for mineral resource interpretation2 Mine scale structural understanding (local pods mirror Ore2. Mine scale structural understanding (local pods mirror Ore
System features)3 Tool for down plunge exploration3. Tool for down plunge exploration4. Can project mapping structures and interpret historic drilling
datadata5. Opportunity to apply the same footprint to other locations
within the mine and test
XstractGroup.com 21

QTS South Exploration
Apply QTS North Apply QTS North structural understanding tounderstanding to explore for repeat mineralisation at QTS er
ey, 1
996
mineralisation at QTS South
QTS South 700m Smith
, Jef
fe
QTS South 700m below surface, 500m down plunge and
McD
erm
ott,
S
p gmined out
No down plunge
M
XstractGroup.com 22
p gextension?

QTS South Exploration
Review historical QTS South mappingD fi i l t t Define regional structures
Understand mineralisation plungeT i l d li i b l Target potential duplication below old workings towards the south
XstractGroup.com 23

QTS South Repeat – Exploration CoreCore
XstractGroup.com 24

QTS South Repeat
9300 Level
N
9300 Level
XstractGroup.com 25

CSA TVM and Sampling (QTS North)North)
16000
18000
20000
8000
9000
10000
10000
12000
14000
VM 5000
6000
7000
e Po
ints
6000
8000
10000
TV
3000
4000
5000
Sam
ple
0
2000
4000
9010 8980 8950 8920 8890 8860 8830 8800 8770 8740 8710 8680 8650 8620 8590 8560 8530 8500 8470 84400
1000
2000
9010 8980 8950 8920 8890 8860 8830 8800 8770 8740 8710 8680 8650 8620 8590 8560 8530 8500 8470 8440
Level (RL)
tvm 2006 tvm 2005 tvm 2004 Samples 2006 Samples 2005 Samples 2004
XstractGroup.com 26

CSA Resource 2003-2006
Category Tonnes (Mt) Cu% Cu (kt) Tonnes (Mt) Cu% Cu (kt) Measured 0 8 7 0 53 1 1 6 3 70
Mineral Resource 2003 Mineral Resource 2006
Measured 0.8 7.0 53 1.1 6.3 70Indicated 1.1 7.0 76 3.1 7.2 223Inferred 2.4 8.4 205 5.3 6.5 348 Total 4.3 7.8 334 9.5 6.7 641
June 2010 Mineral Resource: 11.2 Mt at 6.2% Cu (701kt Cu) (to be assessed for JORC compliance) Production 2003 2010: approx 5 0 Mt at 6 0% Cu (300kt Cu) Production 2003 – 2010: approx 5.0 Mt at 6.0% Cu (300kt Cu)
XstractGroup.com 27

Operations Exploration Using Mine Scale Structural Definition: SummaryStructural Definition: Summary
Research (site visits papers)Research (site visits, papers) Mapping (structural interpretation, resource models) U d t d l f i li ti Understand scales of mineralisation
– Regional, mine, lens, potential duplicationh l d k l d Interpret historical data using new knowledge
Generate exploration targets
XstractGroup.com 28

Acknowledgements
Cobar Management Pty Limited – CSA MineCobar Management Pty Limited CSA Mine Derek Webb ‐ Exploration Superintendent CSA Mine
XstractGroup.com 29
Top Related