


Languages
Pages
Legal


Operating Experience with a Near-Real-Time Ambient Airborne Metals Instrument System (Cooper Environmental Systems Xact 620)
Missouri Department of Natural Resources, Air Pollution Control Program and Environmental Services ProgramWashington University, St. LouisU. S. EPA
National Ambient Air Monitoring Conference, Nashville, Tennessee
November 2-5, 2009

Introduction
●
The St. Louis Community Air Project (CAP) and the Blair St. National Air Toxics Trends Station (NATTS) have measured elevated concentrations of airborne arsenic in St. Louis.
●
Missouri DNR and Washington University obtained a Community-Scale Air Toxics grant from EPA to better determine sources of arsenic and other species in St. Louis.
●
A Cooper Xact 620 was purchased on this grant and operated at multiple sites.

Project Plan
• Phase I. Spatially and Temporally Enhanced 24-hour Integrated Measurements– 1-in-3 day PM10 sampling and metals analysis by
ICPMS at 4 sites in the St. Louis area for 1 year (MDL~0.02-0.03 ng/m3, 24-hr samples)
• Phase II. High Time Resolution Measurements– Time-resolved near-real-time analysis at six sites in
the St. Louis area for 1 month at each site (MDL<0.1 ng/m3, possibly as low as 0.01 ng/m3, 2- hr samples)
• Data Analysis and Reporting– Source apportionment, source identification, model
comparisons

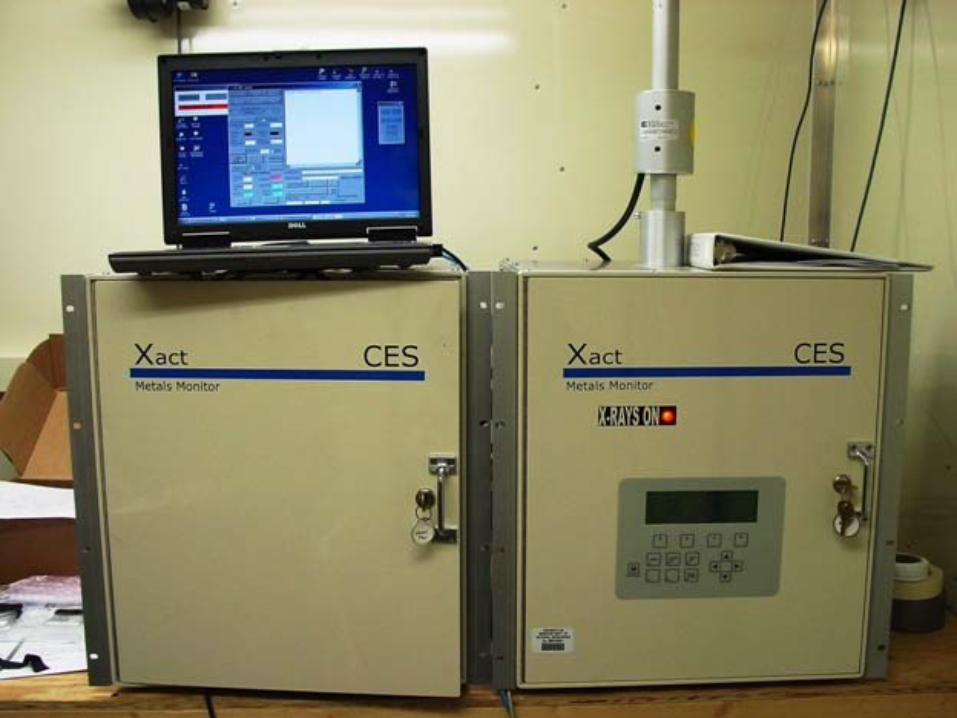
Cooper Environmental Services Xact 620 Ambient Air Toxic Metals Monitor
PM10 size-selective inlet
Temperature controlled cabinet
Heater
Sampling & Analysis Module
Operator interface/control panel
Flow control module


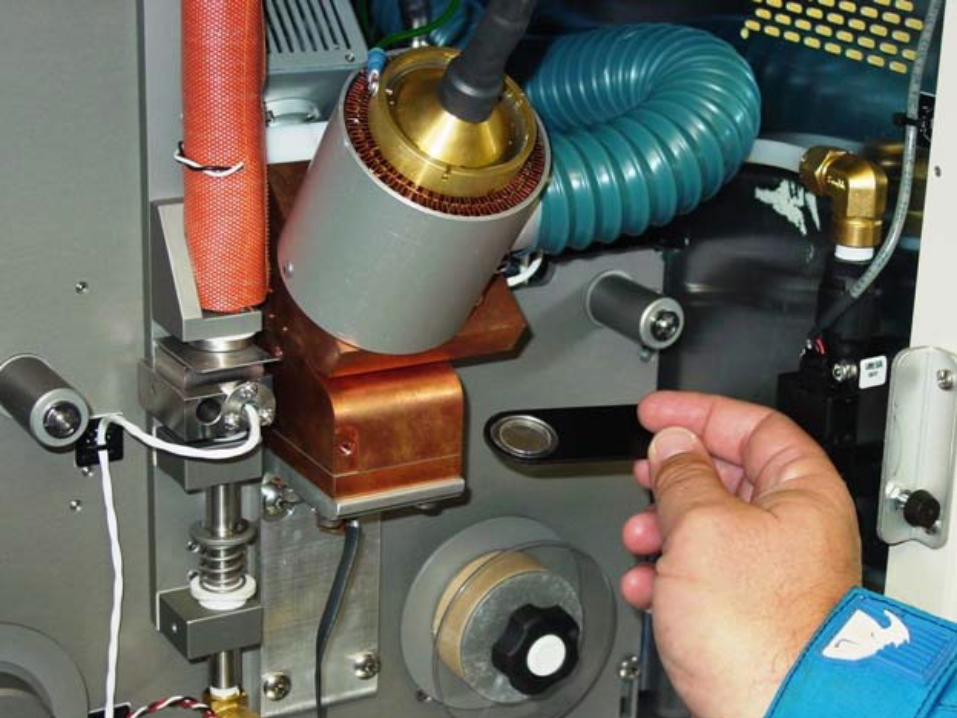
Xact Sampling and Analysis
XX--Ray TubeRay Tube
Filter TapeFilter Tape
Aerosol DepositAerosol Deposit
Chemistry ZoneChemistry Zone
Sample FlowSample Flow
Analysis AreaAnalysis Area
Filter TapeFilter Tape
Previous sample is analyzed while current sample is collected


Xact Tape Deposits
Deposit Area 0.747 cm2


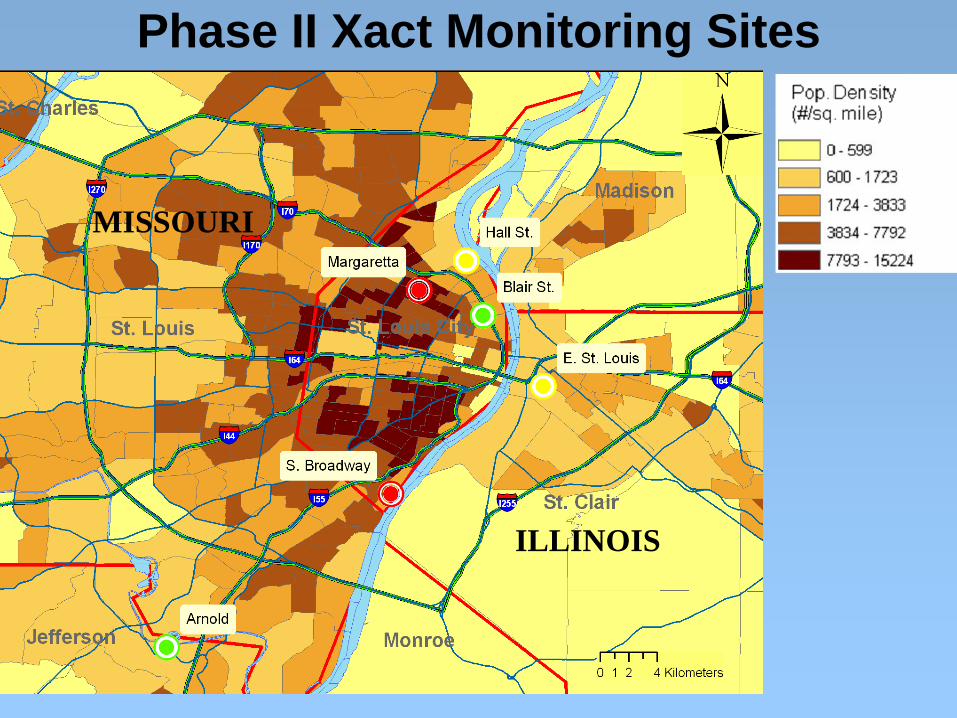
Phase II Xact Monitoring Sites
MISSOURI
ILLINOIS
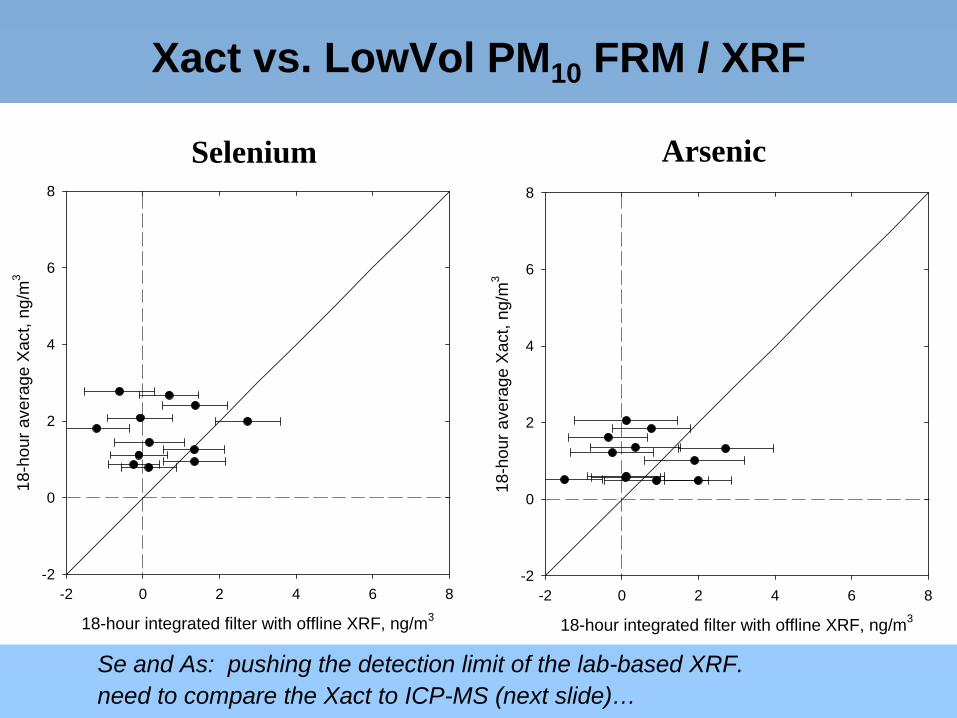
Xact vs. LowVol PM10 FRM / XRF
18-hour integrated filter with offline XRF, ng/m3
-2 0 2 4 6 8
18-h
our a
vera
ge X
act,
ng/m
3
-2
0
2
4
6
8
Selenium
18-hour integrated filter with offline XRF, ng/m3
-2 0 2 4 6 8
18-h
our a
vera
ge X
act,
ng/m
3
-2
0
2
4
6
8
Arsenic
Se and As: pushing the detection limit of the lab-based XRF.need to compare the Xact to ICP-MS (next slide)…
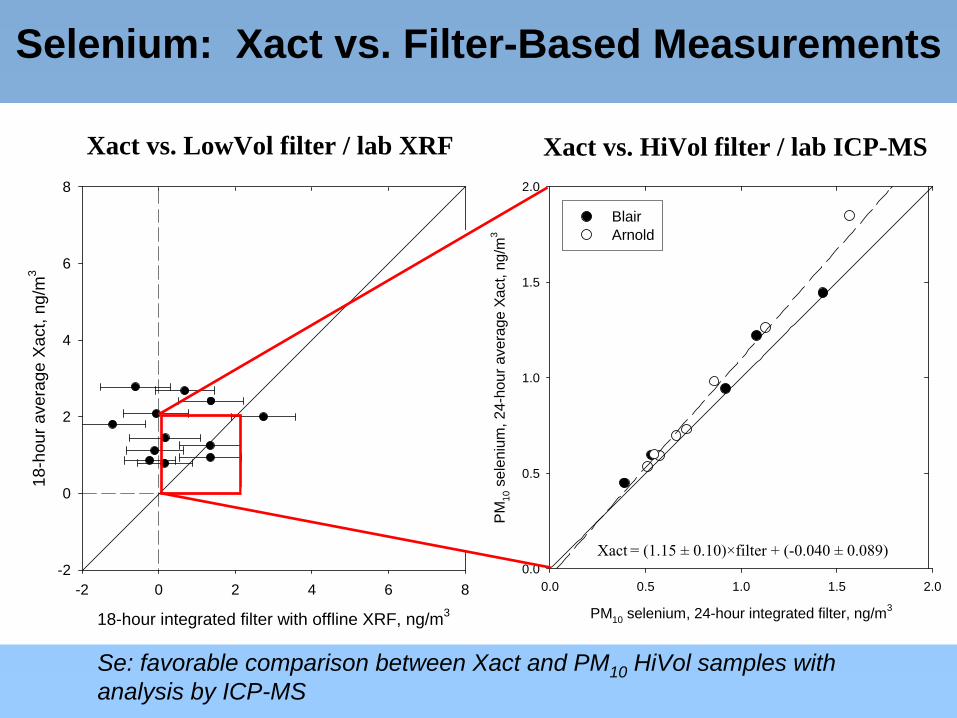
Selenium: Xact vs. Filter-Based Measurements
PM10 selenium, 24-hour integrated filter, ng/m3
0.0 0.5 1.0 1.5 2.0
PM
10 s
elen
ium
, 24-
hour
ave
rage
Xac
t, ng
/m3
0.0
0.5
1.0
1.5
2.0
BlairArnold
Xact
= (1.15 ±
0.10)×filter + (-0.040 ±
0.089)
Xact vs. HiVol filter / lab ICP-MS
18-hour integrated filter with offline XRF, ng/m3
-2 0 2 4 6 8
18-h
our a
vera
ge X
act,
ng/m
3
-2
0
2
4
6
8
Xact vs. LowVol filter / lab XRF
Se: favorable comparison between Xact and PM10 HiVol samples with analysis by ICP-MS

Arsenic – Methods Comparisons
MDNR/WUSTL analysis, ng/m3
-2 0 2 4 6 8
NA
TTS
/ E
RG
ana
lysi
s, n
g/m
3
-2
0
2
4
6
8
Collocated HiVol SamplersBlair site, 4th Quarter 2008
24-hour integrated HiVol PM10, ng/m3
-2 0 2 4 6 8
24-h
our a
vera
ge X
act,
ng/m
3
-2
0
2
4
6
8
Xact vs. WUSTL HiVolDec 2008 / Jan 2009
As: favorable comparison between Xact and PM10 HiVol samples with analysis by ICP-MS.
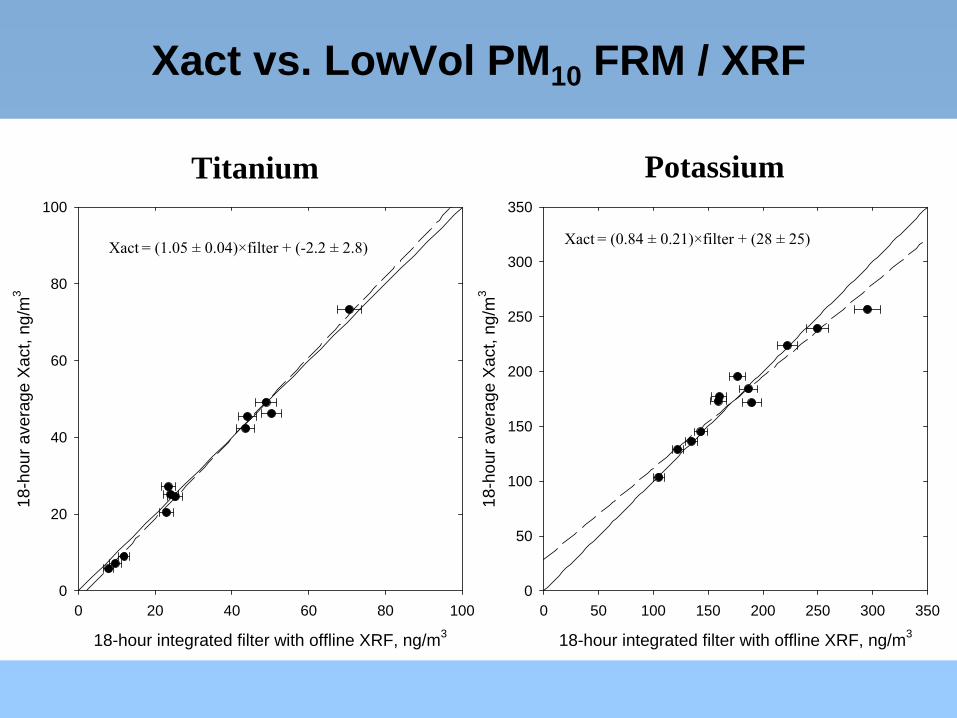
Xact vs. LowVol PM10 FRM / XRF
18-hour integrated filter with offline XRF, ng/m3
0 20 40 60 80 100
18-h
our a
vera
ge X
act,
ng/m
3
0
20
40
60
80
100
Titanium
Xact
= (1.05 ±
0.04)×filter + (-2.2 ±
2.8)
18-hour integrated filter with offline XRF, ng/m3
0 50 100 150 200 250 300 350
18-h
our a
vera
ge X
act,
ng/m
3
0
50
100
150
200
250
300
350
Xact
= (0.84 ±
0.21)×filter + (28 ±
25)
Potassium
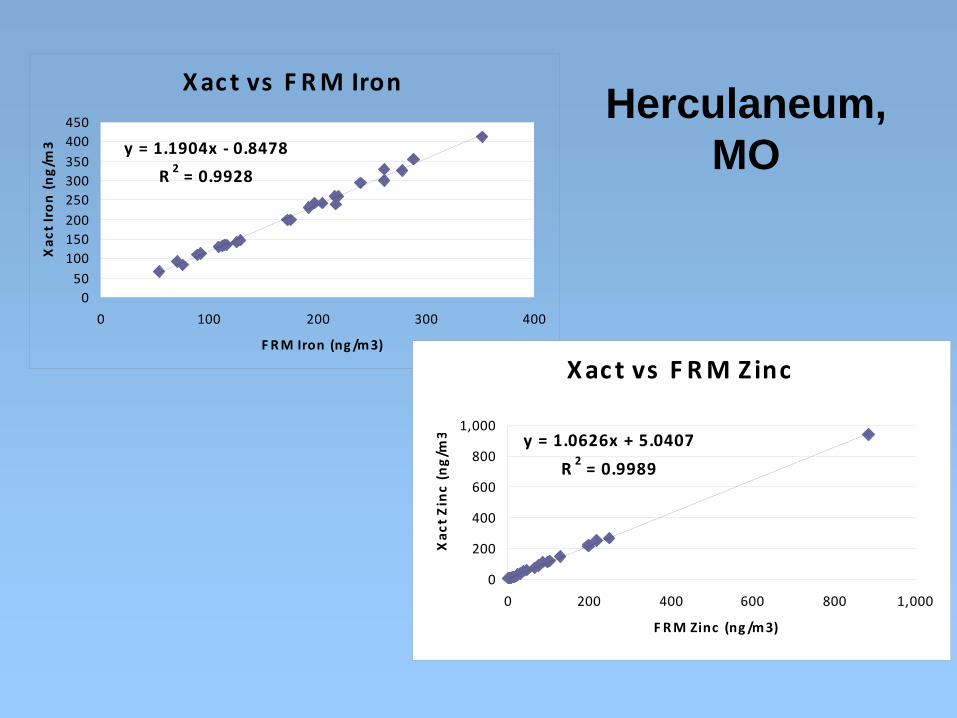
Xac t vs F RM Iron
y = 1.1904x ‐ 0.8478
R 2 = 0.9928
050
100150200250300350400450
0 100 200 300 400
F RM Iron (ng /m3)
Xac
t Iron (ng/m
3
X ac t vs F RM Zinc
y = 1.0626x + 5.0407
R 2 = 0.9989
0
200
400
600
800
1,000
0 200 400 600 800 1,000
F RM Zinc (ng /m3)
Xac
t Zinc (ng/m
3
Herculaneum, MO

Xact vs. LowVol PM10 FRM / XRF
18-hour integrated filter with offline XRF, ng/m3
0 5 10 15 20 25 30
18-h
our a
vera
ge X
act,
ng/m
3
0
5
10
15
20
25
30
Manganese
Xact
= (1.46 ±
0.18)×filter + (0.7 ±
1.6)
18-hour integrated filter with offline XRF, ng/m3
-5 0 5 10 15 20 25 30
18-h
our a
vera
ge X
act,
ng/m
3
-5
0
5
10
15
20
25
30
Lead
Xact
= (1.02 ±
0.10)×filter + (-0.1 ±
1.8)
Mn: biased but highly correlated
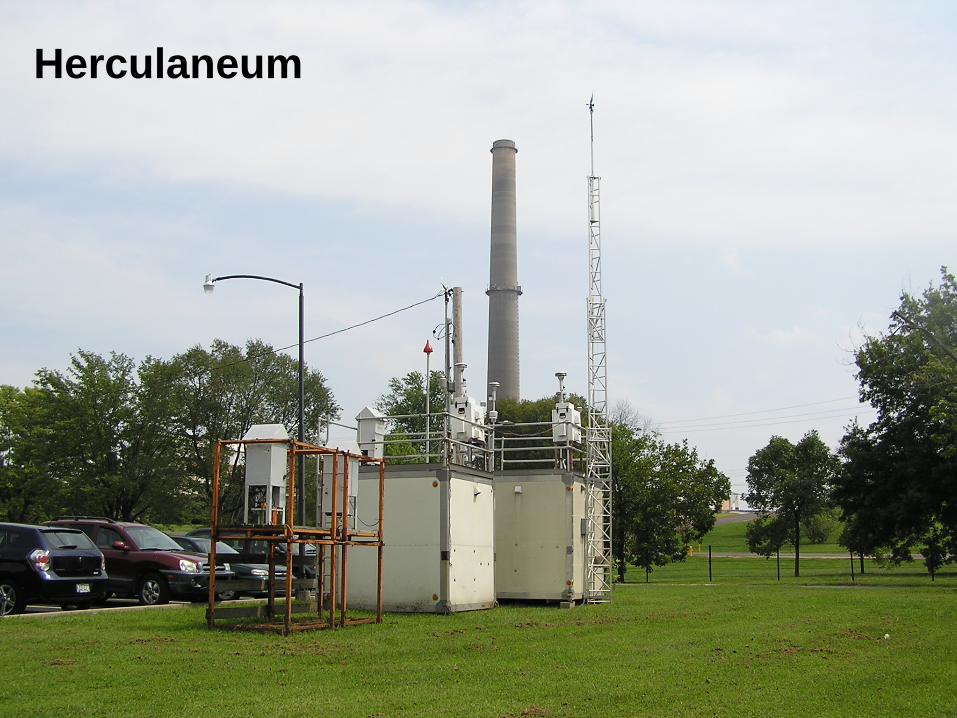
Herculaneum
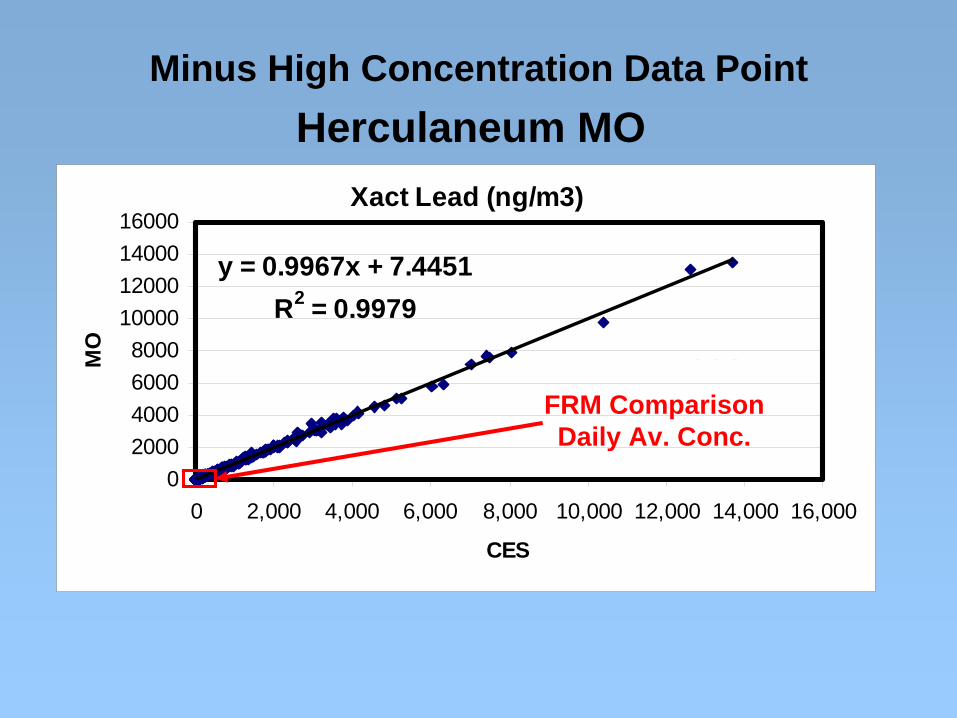
Xact Lead (ng/m3)
y = 0.9967x + 7.4451R2 = 0.9979
02000400060008000
10000120001400016000
0 2,000 4,000 6,000 8,000 10,000 12,000 14,000 16,000
CES
MO
n = 202
Minus High Concentration Data Point
FRM Comparison Daily Av. Conc.
Herculaneum MO
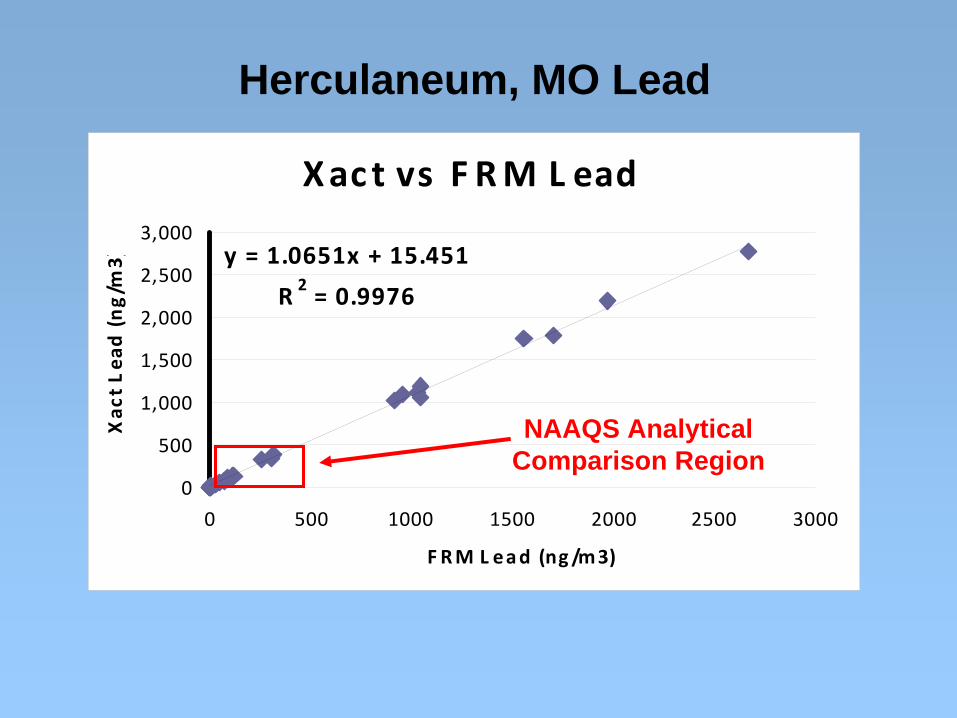
Xac t vs F RM L ead
y = 1.0651x + 15.451
R 2 = 0.9976
0
500
1,000
1,500
2,000
2,500
3,000
0 500 1000 1500 2000 2500 3000
F RM L ead (ng /m3)
Xac
t Lea
d (ng/m
3)Herculaneum, MO Lead
NAAQS Analytical Comparison Region

y = 1.1783x - 1.2202R2 = 0.9946
0
50
100
150
200
250
300
350
400
0 50 100 150 200 250 300 350
FRM v. Xact Lead Comparison
FRM (ng/m3)
Xact
(ng/
m3)
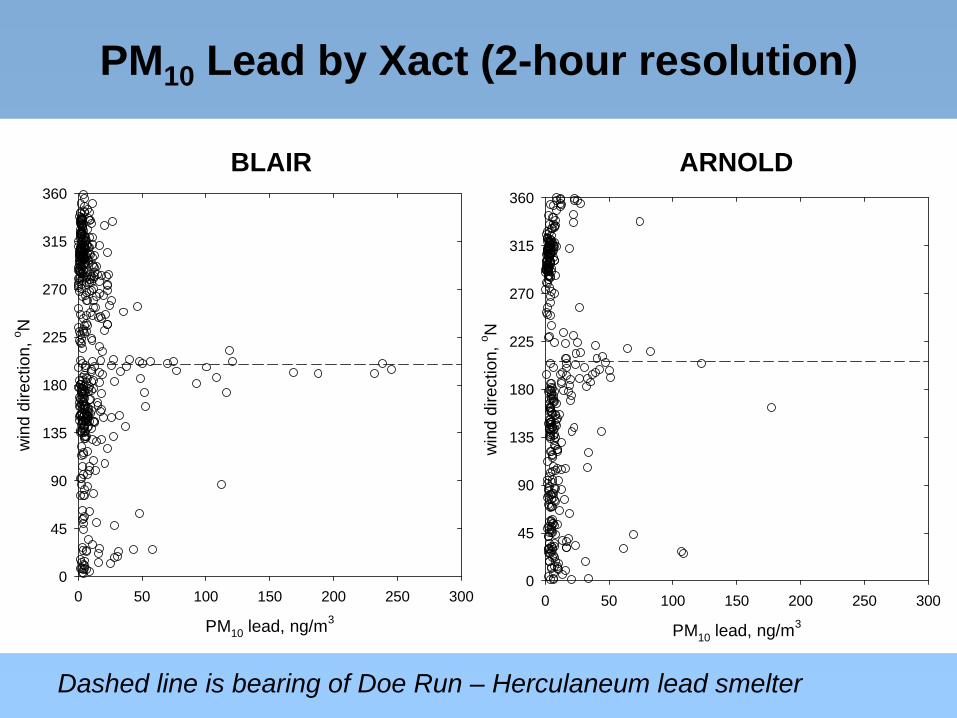
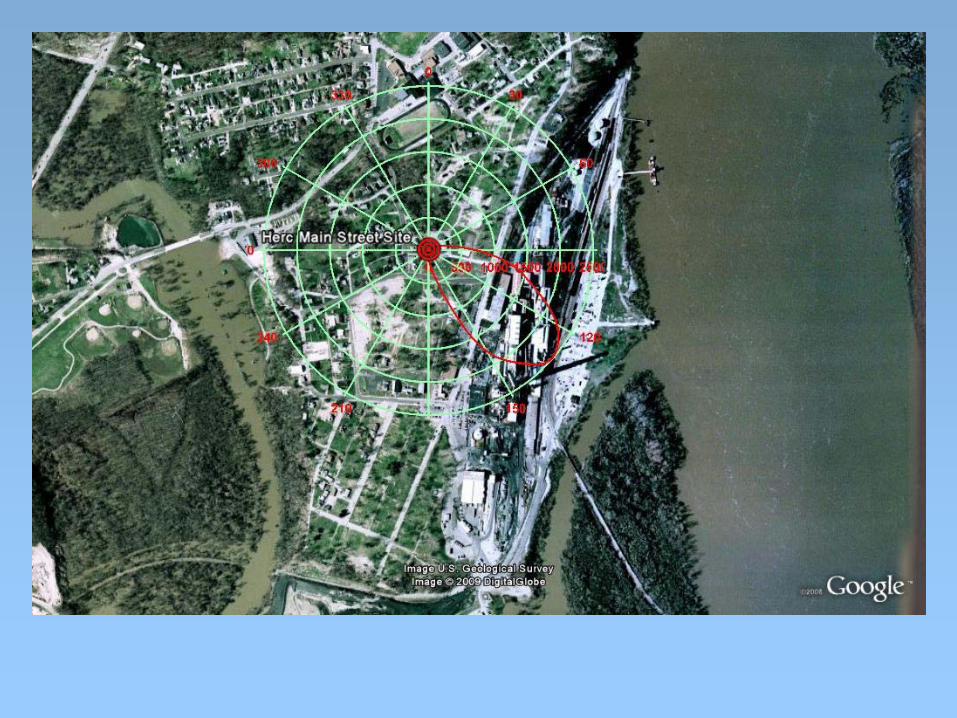
PM10 Lead by Xact (2-hour resolution)
Dashed line is bearing of Doe Run – Herculaneum lead smelter
PM10 lead, ng/m3
0 50 100 150 200 250 300
win
d di
rect
ion,
o N
0
45
90
135
180
225
270
315
360
BLAIR ARNOLD
PM10 lead, ng/m3
0 50 100 150 200 250 300
win
d di
rect
ion,
o N
0
45
90
135
180
225
270
315
360

Hourly PM10 Lead, Herculaneum Main Street Site, 8/8/09 – 10/10/09Excludes hours with wind speeds less than 0.5 mph
Excludes one value > 15,000 ng/m3
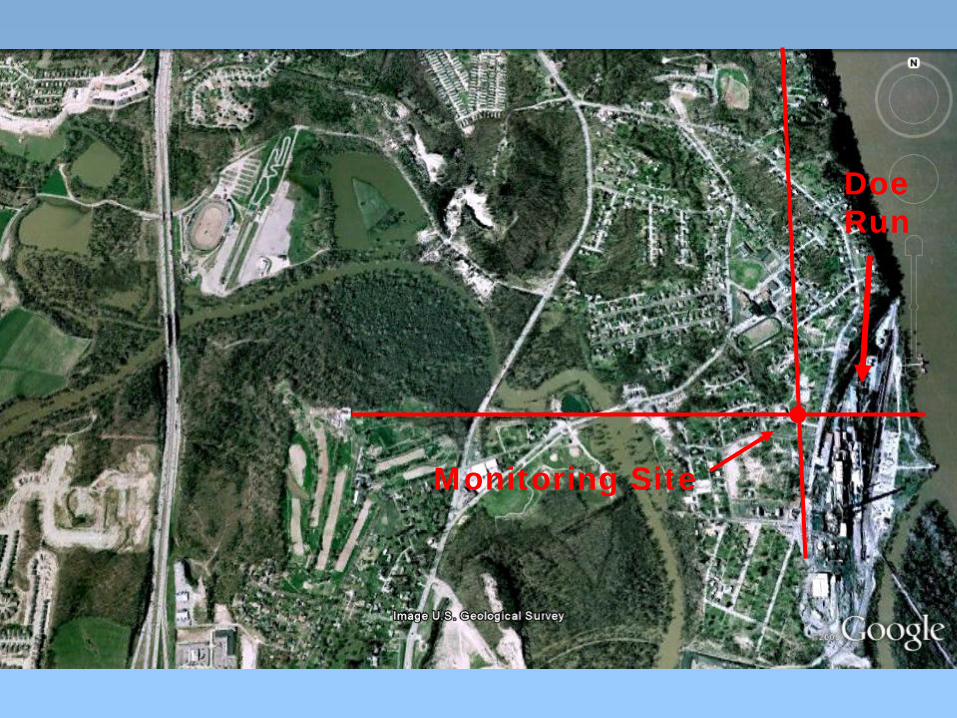
Monitoring Site
Doe Run

Herculaneum Airborne Lead ConcentrationAugust and September 2009
-0.5
0.0
0.5
1.0
1.5
2.0
2.5
3.0
3.5
4.0
4.5
8/1/20
098/3
/2009
8/5/20
098/7
/2009
8/9/20
098/1
1/200
98/1
3/200
98/1
5/200
98/1
7/200
98/1
9/200
98/2
1/200
98/2
3/200
98/2
5/200
98/2
7/200
98/2
9/200
98/3
1/200
99/2
/2009
9/4/20
099/6
/2009
9/8/20
099/1
0/200
99/1
2/200
99/1
4/200
99/1
6/200
99/1
8/200
99/2
0/200
99/2
2/200
99/2
4/200
99/2
6/200
99/2
8/200
99/3
0/200
9ug
/m3
TSP Hi-Vol ug/3m Xact ug/3m
Every Day Sampling

Herculaneum Airborne Lead ConcentrationAugust and September 2009
0.0
0.5
1.0
1.5
2.0
2.5
3.0
3.5
4.0
4.5
8/1/20
098/3
/2009
8/5/20
098/7
/2009
8/9/20
098/1
1/200
98/1
3/200
98/1
5/200
98/1
7/200
98/1
9/200
98/2
1/200
98/2
3/200
98/2
5/200
98/2
7/200
98/2
9/200
98/3
1/200
99/2
/2009
9/4/20
099/6
/2009
9/8/20
099/1
0/200
99/1
2/200
99/1
4/200
99/1
6/200
99/1
8/200
99/2
0/200
99/2
2/200
99/2
4/200
99/2
6/200
99/2
8/200
99/3
0/200
9ug
/m3
DR City Hall ESP Main St. ESP Main St. Co Xact
Every 3 Day Sampling
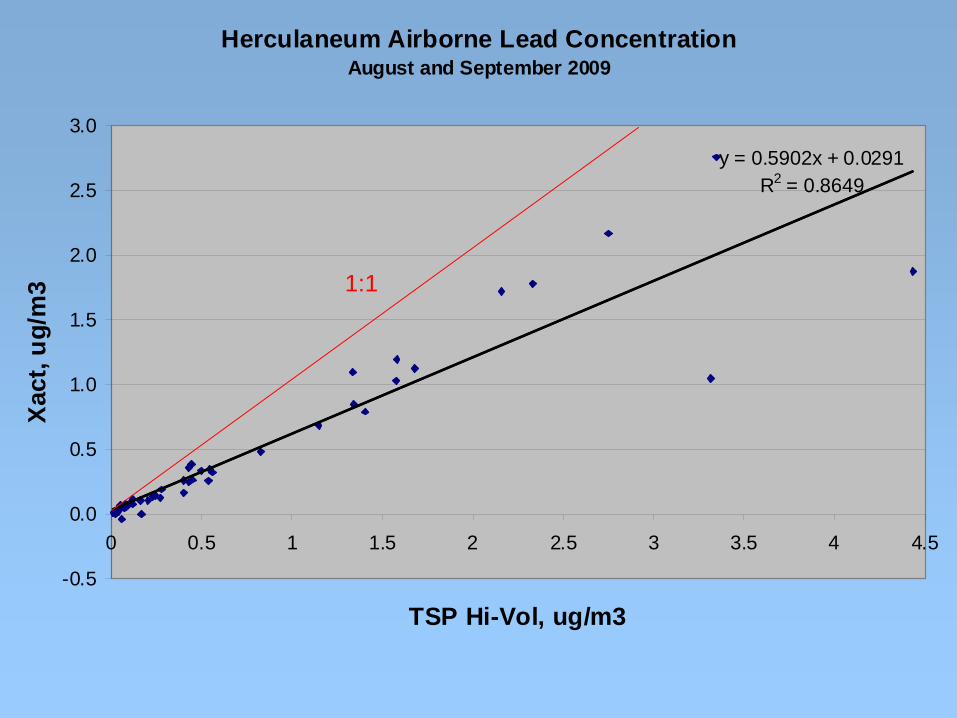
Herculaneum Airborne Lead ConcentrationAugust and September 2009
y = 0.5902x + 0.0291R2 = 0.8649
-0.5
0.0
0.5
1.0
1.5
2.0
2.5
3.0
0 0.5 1 1.5 2 2.5 3 3.5 4 4.5
TSP Hi-Vol, ug/m3
Xac
t, ug
/m3 1:1

Herculaneum Airborne Lead ConcentrationAugust and September 2009
y = 0.771x - 0.0386R2 = 0.982
-0.5
0.0
0.5
1.0
1.5
2.0
2.5
3.0
3.5
0 0.5 1 1.5 2 2.5 3 3.5
TSP Hi-Vol, ug/m3 (2 high days not included)
Xac
t, ug
/m3 1:1

Conclusions
• Maintenance and operation of the Xact is comparable to that of other air monitoring instruments. The Xact has operated reliably following initial problems addressed by software and firmware upgrades.
• Xact airborne metallic species results compare well with both low volume and high volume filter sample analysis results.
• Xact results demonstrate the utility of time- dependent measurement for source attribution.

Acknowledgements• Missouri Department of Natural Resources
• Jim Brunnert, Jerry Downs, Celeste Koon, Dustin Kuebler, Robert Nilges, Terry Rowles, Will Wetherell
• Washington University• Stephen Feinberg, Jay Turner, Varun Yadav
• Cooper Environmental Services• John Cooper, Krag Petterson
• City of St. Louis Air Pollution Control• Joe Gallagher,Don Simpson, Tom Wiese
• U.S. EPA / Office of Air Quality Planning and Standards• Mike Jones
• U.S. EPA / Region VII• Gwen Yoshimura
• U.S. EPA / Office of Research and Development• Teri Conner, Gary Norris, Bob Willis

Online Current Data
• http://www.dnr.mo.gov/env/esp/aqm/allguide.htm(Click on “Current Air Pollution Data Report” at mid-page, scroll down to St. Louis Metals Data)
Top Related