![HERE Maps Update SD...10 IV. Layout Change ① Button layout change in the【INFO】screen. On the【INFO】screen, [User SD] was moved back. ② The change of【TMC】screen.【TMC】screen](https://static.fdocuments.us/doc/165x107/6129d263036e2d1cbd7f3d0f/here-maps-update-sd-10-iv-layout-change-a-button-layout-change-in-theinfoscreen.jpg)


Languages
Pages
Legal


1. Nyelvi beállítások az Office 2007-hez (Language settings for Office 2007 (not 2003))→
English.
2. Double click on the Word 2007 icon on your desktop.
3. View / Zoom / Page width.
4. View / Show/Hide / Turn on the ruler (check the checkbox).
5. Home / Paragraph / Show paragraph marks and other hidden formatting symbols (top right
icon).
6. Set the margins (you can use a real ruler).
Screen Layout
The Microsoft Office Button
You click on it to see these options: New, Open, Save, Save As, Print, Prepare,
Send, Publish and Close.
Microsoft
Office button
Quick Access Toolbar
Ribbon
View choices
Cursor
Scroll bar
Opening Microsoft Word 2007
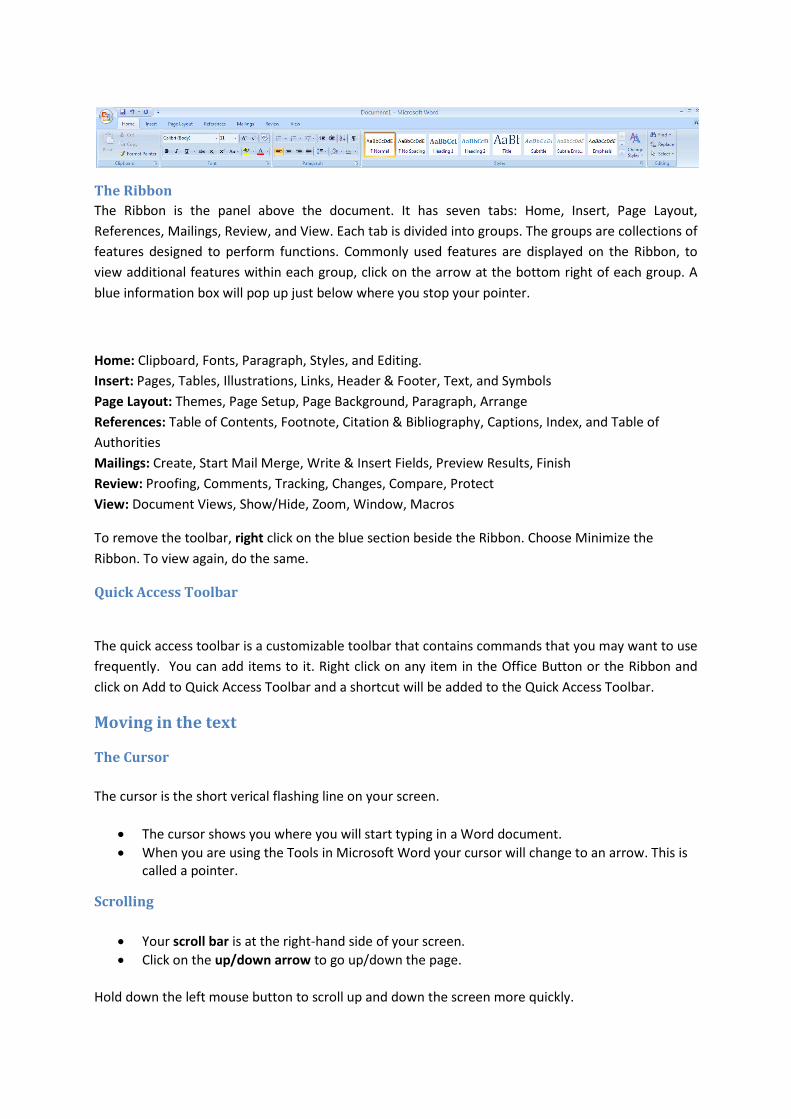
The Ribbon
The Ribbon is the panel above the document. It has seven tabs: Home, Insert, Page Layout,
References, Mailings, Review, and View. Each tab is divided into groups. The groups are collections of
features designed to perform functions. Commonly used features are displayed on the Ribbon, to
view additional features within each group, click on the arrow at the bottom right of each group. A
blue information box will pop up just below where you stop your pointer.
Home: Clipboard, Fonts, Paragraph, Styles, and Editing.
Insert: Pages, Tables, Illustrations, Links, Header & Footer, Text, and Symbols
Page Layout: Themes, Page Setup, Page Background, Paragraph, Arrange
References: Table of Contents, Footnote, Citation & Bibliography, Captions, Index, and Table of
Authorities
Mailings: Create, Start Mail Merge, Write & Insert Fields, Preview Results, Finish
Review: Proofing, Comments, Tracking, Changes, Compare, Protect
View: Document Views, Show/Hide, Zoom, Window, Macros
To remove the toolbar, right click on the blue section beside the Ribbon. Choose Minimize the
Ribbon. To view again, do the same.
Quick Access Toolbar
The quick access toolbar is a customizable toolbar that contains commands that you may want to use
frequently. You can add items to it. Right click on any item in the Office Button or the Ribbon and
click on Add to Quick Access Toolbar and a shortcut will be added to the Quick Access Toolbar.
Moving in the text
The Cursor
The cursor is the short verical flashing line on your screen.
• The cursor shows you where you will start typing in a Word document.
• When you are using the Tools in Microsoft Word your cursor will change to an arrow. This is
called a pointer.
Scrolling
• Your scroll bar is at the right-hand side of your screen.
• Click on the up/down arrow to go up/down the page.
Hold down the left mouse button to scroll up and down the screen more quickly.

Using the Keyboard in MS Word
• The arrow keys on your keyboard move your cursor around.
• To make a letter a capital letter:
• Hold down the Shift and the letter key at the same time.
• For the signs on your keyboard:
• Hold down the Shift and the number key at the same time.
• The Shift keys are on both sides of the keyboard.
• The Space bar makes spaces between words when typing. Tap the bar one time to make a
space.
• Use the Enter key to move your cursor to finish the line and make a new one.
• The Backspace key deletes everything to the left of the cursor.
• The Delete key will erase everything to the right of the cursor.
• To make the cursor go to the end of the line press End.
• To make the cursor go to the start of a line press Home.
• To make the cursor go to one page up/down press Page Up/Page Down.
• To make the cursor go to the top/end of the document press Ctrl+Home/Ctrl+End.
Selecting text
• Put the cursor at the beginning or end of the words you want to select.
• Put your finger on the left mouse button.
• Hold down the left mouse button.
• Move the mouse across the words.
• Lift up your finger.
• The word will be highlighted in blue. When this is done, you can move words or change the
size, the colour, and the style of the words on the computer.
Alternatives
To select a word, double click within the word.
To select a paragraph, triple-click within the paragraph.
To select the entire document: Home/Editing/Select/Select All or press Ctrl+A
To Deselect
Click your mouse on any WHITE part of the page to deselect.

Basic actions with documents
Create a New Document
There are several ways to create new documents, open existing documents, and save documents in
Word:
Microsoft Office Button / New / Blank document
Opening an Existing Document
Microsoft Office Button -> Open -> Choose from the list
Saving a Document
Microsoft Office Button/ Save or Save as
or
Press Ctrl+S on the keyboard,
or
Click the File icon on the Quick Access Toolbar
Working on Multiple Documents
Several documents can be opened. All open documents will be listed in the View Tab of the Ribbon
when you click on Switch Windows. The current document has a checkmark beside the file name.
Select another open document to view it.

Document Views
• Print Layout: This is a view of the document as it would appear when printed. It includes all
tables, text, graphics, and images.
• Full Screen Reading: This is a full view length view of a document. Good for viewing two
pages at a time.
• Web Layout: This is a view of the document as it would appear in a web browser.
• Outline: This is an outline form of the document in the form of bullets.
• Draft: This view does not display pictures or layouts, just text.
• To view a document in different forms, click the document views shortcuts at the bottom of
the screen or:
• Click the View Tab on the Ribbon
• Click on the appropriate document view.
Close a Document
Microsoft Office Button / Close
Editing document
Inserting Additional Text:
• Type Text: Put your cursor where you want to add the text and begin typing
• Copy and Paste Text: Highlight the text you wish to copy and right click and click Copy (or
Ctrl+C), put your cursor where you want the text in the document and right click and click
Paste (or Ctrl+V).
• Cut and Paste Text: Highlight the text you wish to cut and right click and click Cut (or Ctrl+X)
, put your cursor where you want the text in the document and right click and click Paste (or
Ctrl+V).
Editing
Clipboard

• Drag Text: Highlight the text you wish to move, click on it and drag it to the place where you
want the text in the document.
You can also use the Clipboard group on the Ribbon (Home tag).
Search and Replace Text
To find a particular word or phrase in a document:
• Editing / Find
To find and replace a word or phrase in the document:
• Editing / Replace
Undo Changes
Click the Undo Button on the Quick Access Toolbar.

Formatting text
On the Home Tab of the Ribbon, there are several areas controlling the style of the document: Font,
Paragraph, and Styles. A style is a format enhancing tool that includes font typefaces, font size,
effects (bold, italics, underline, etc.), colors and more.
Change Font Typeface and Size
Click the arrow next to the font name and choose a font and size.
You can preview how the new font will look by highlighting the text, and hovering over the new font
typeface.
Font Styles and Effects
Font styles are predefined formatting options that are
used to emphasize text: Bold, Italic, and Underline.
• Select the text and click the Font Styles included
on the Font Group of the Ribbon, or
• Select the text and right click to display the font
tools
Home
Font, Paragraph, Styles
Font and size
Change the spacing between characters
Selecting Expanded or Condensed alters the spacing between all selected letters by the same
amount. Kerning alters the spacing between particular pairs of letters.
Expand or condense the space evenly between all the selected characters
• Select the text that you want to change.
• On the Home tab, click the Font Dialog Box Launcher, and then click the Character Spacing
tab.
• In the Spacing box, click Expanded or Condensed, and then specify how much space you want
in the By box.
Change Text Color
• Select the text and click the Colors button
included on the Font Group of the Ribbon,
or
• Highlight the text and right click and
choose the colors tool.
• Select the color by clicking the down arrow
next to the font color button.
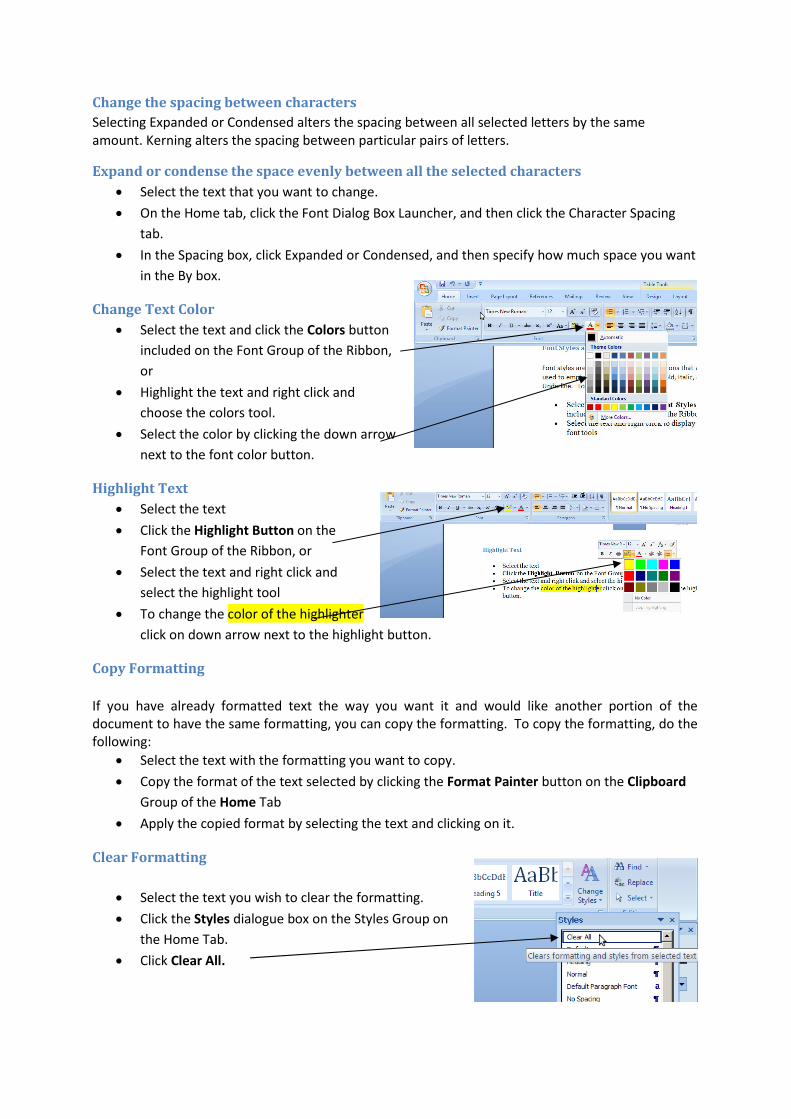
Highlight Text
• Select the text
• Click the Highlight Button on the
Font Group of the Ribbon, or
• Select the text and right click and
select the highlight tool
• To change the color of the highlighter
click on down arrow next to the highlight button.
Copy Formatting
If you have already formatted text the way you want it and would like another portion of the
document to have the same formatting, you can copy the formatting. To copy the formatting, do the
following:
• Select the text with the formatting you want to copy.
• Copy the format of the text selected by clicking the Format Painter button on the Clipboard
Group of the Home Tab
• Apply the copied format by selecting the text and clicking on it.
Clear Formatting
• Select the text you wish to clear the formatting.
• Click the Styles dialogue box on the Styles Group on
the Home Tab.
• Click Clear All.

Make a Hyperlink
• Select the text you wish to by a hyperlink.
• Click the Insert tab.
• Click on Hyperlink and OK.
Insert current Date and Time
• Click the Insert tab.
• Click on Date & Time.
• Select the appropriate language and format.
Formatting Paragraphs
Formatting paragraphs allows you to change the look of the overall document. You can access many
of the tools of paragraph formatting by clicking the Page Layout Tab of the Ribbon or the Paragraph
Group on the Home Tab of the Ribbon.
Change Paragraph Alignment
• Click the Home Tab
• Choose the appropriate button for alignment on
the Paragraph Group.
o Align Left: the text is aligned with your
left margin
o Center: The text is centered within your
margins
o Align Right: Aligns text with the right margin
o Justify: Aligns text to both the left and right margins.
Indent Paragraphs
Indenting paragraphs allows you set text within a paragraph at different margins. There are several
options for indenting:
• First Line: Controls the left boundary for the first line of a paragraph
• Hanging: Controls the left boundary of every line in a paragraph except the first one
• Left: Controls the left boundary for every line in a paragraph
• Right: Controls the right boundary for every line in a paragraph
Page Layout
Paragraph

To indent paragraphs, you can do the following:
• Click the Indent buttons to control the indent.
• Click the Indent button repeated times to
increase the size of the indent.
• Click the dialog box of the Paragraph Group
• Click the Indents and Spacing Tab
• Select your indents
Alignment also can be changed within this Tab.
Change Spacing Between Paragraphs and
Lines
• Select the paragraph or paragraphs you
wish to change.
• On the Home Tab, Click the Paragraph
Dialog Box
• Click the Indents and Spacing Tab
• In the Spacing section, adjust your spacing
accordingly
Add Borders and Shading
You can add borders and shading to paragraphs
and entire pages.
• Select the area of text where you want the
border or shading.
• Click the Borders Button on the Paragraph
Group on the Home Tab
• Choose the Border and Shading
• Choose the appropriate options
Drawing horzontal line
• Put your cursor where you want to add the horizontal line.
• Click the Borders Button on the Paragraph Group on the Home
Tab
• Choose the Horizontal line
• Click on the line
• Choose the appropriate options in the pop up window.

Styles
The use of Styles in Word will allow you to quickly format a
document with a consistent and professional look. Styles can
be saved for use in many documents.
Apply Styles
There are many styles that are already in Word ready for you
to use. To view the available styles click the Styles dialog box
on the Styles Group in the Home Tab. To apply a style:
1. Select the text
2. Click the Styles Dialog Box, or Styles Drop Down
menu
3. Click the Style you choose
Creating New Styles
• Click the Styles Dialog Box
• Click the New Style Button
• Complete the New Style dialog box.
At the bottom of that dialog box, you can choose to add this to the Quick Style List or to make it
available only in this document.
New Quick Style
• Insert your cursor anywhere in the text formatted as the chosen style
• Click the Styles dialog box
• Click on New style and click on Add to Quick Style list and OK.
Style Inspector
To determine the style of a particular section of a document:
• Insert cursor anywhere in the text that you want to explain the style
• Click the Styles Drop Down Menu
• Put the arrow on the bordered style. The formatting options will appear in a text box.
New Style

Set, edit, or clear tabs
Set the tab stops
With the ruler it is possible to set manual tab stops at the left side, middle, and right side of your
document.
Note: If you don't see the horizontal ruler that runs along the top of the document, click the View
Ruler button at the top of the vertical scroll bar.
It is easy to set tabs by clicking the tab selector at the left end of the ruler until it displays the type of
tab that you want and then clicking the ruler at the location you want. Tab types:
A Left Tab stop sets the start position of text that will then run to the right as you type.
A Center Tab stop sets the position of the middle of the text. The text centers on this
position as you type.
A Right Tab stop sets the right end of the text. As you type, the text moves to the left.
A Decimal Tab stop aligns numbers around a decimal point. Independent of the number of
digits, the decimal point will be in the same position.
A Bar Tab stop doesn't position text. It inserts a vertical bar at the tab position.
For more precise positions, use the Tabs dialog box: double-click any tab stop on the ruler, or:
• On the Page Layout tab, click the Paragraph Dialog Box Launcher.
• At the bottom of Paragraph dialog box, click Tabs.
Add leaders between tab stops
You can add dot leaders between tab stops or choose other formatting
options in the Tabs dialog box.
• Type the text that you want.
• On the horizontal ruler, set the tab stop that you want.
• On the Page Layout tab, click the Paragraph Dialog Box Launcher.
• In the Paragraph dialog box, click Tabs.
• Under Leader, click the leader option that you want.
When you press ENTER to start a new line, the formatted tab stop is available on the new line.
View ruler button
Tab selector Tab

Adding Tables
Create a Table:
• Place the cursor on the page where you want the new table
• Click the Insert Tab of the Ribbon
• Click the Tables Button on the Tables Group. You can
create a table one of four ways:
o Highlight the number of row and columns
o Click Insert Table and enter the number of rows
and columns
o Click the Draw Table, create your table by clicking
and entering the rows and columns
o Click Quick Tables and choose a table
Enter Data in a Table:
• Place the cursor in the cell where you wish to enter the
information. Begin typing.
Modify the Table Structure and Format a Table
• Click the table and notice that you have two new tabs on the Ribbon: Design and Layout.
These pertain to the table design and layout.
On the Design Tab, you can choose:
• Table Style Options
• Choose Table Styles
• Shading and Borders
To format a table, click the table and then click the Layout Tab on the Ribbon. This Layout tab allows
you to:
• View Gridlines and Properties (from the Table Group)
• Insert Rows and Columns (from the Rows & Columns Group)
• Delete the Table, Rows and/or Columns (from the Rows & Columns Group)
• Merge or Split Cells (from the Merge Group)
• Increase and Decrease cell Height and Width size (Cell Size Group)
• Align text within the cells and change text directions (Alignment Group)
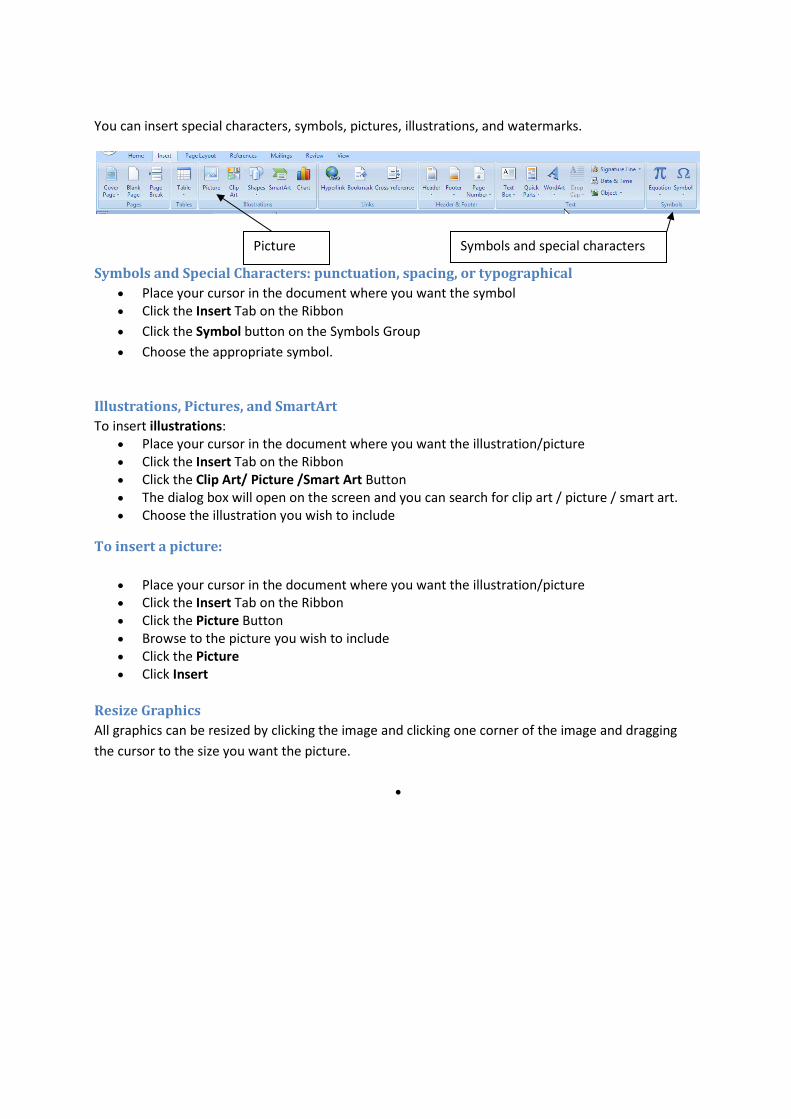
You can insert special characters, symbols, pictures, illustrations, and watermarks.
Symbols and Special Characters: punctuation, spacing, or typographical
• Place your cursor in the document where you want the symbol
• Click the Insert Tab on the Ribbon
• Click the Symbol button on the Symbols Group
• Choose the appropriate symbol.
Illustrations, Pictures, and SmartArt
To insert illustrations:
• Place your cursor in the document where you want the illustration/picture
• Click the Insert Tab on the Ribbon
• Click the Clip Art/ Picture /Smart Art Button
• The dialog box will open on the screen and you can search for clip art / picture / smart art.
• Choose the illustration you wish to include
To insert a picture:
• Place your cursor in the document where you want the illustration/picture
• Click the Insert Tab on the Ribbon
• Click the Picture Button
• Browse to the picture you wish to include
• Click the Picture
• Click Insert
Resize Graphics
All graphics can be resized by clicking the image and clicking one corner of the image and dragging
the cursor to the size you want the picture.
•
Picture Symbols and special characters

Page Formatting
Modify Page Margins:
• Click the Page Layout Tab on the Ribbon
• On the Page Setup Group, Click Margins
• Click a Default Margin, or
• Click Custom Margins and complete the dialog box.
Orientation, Size of the Page, or Columns:
• Click the Page Layout Tab on the Ribbon
• On the Page Setup Group, Click the Orientation, Size, or Columns drop down menus
• Click the appropriate choice
Page Border and Color
• Click the Page Layout Tab on the Ribbon
• On the Page Background Group, click the Page Colors or Page Borders drop down menus
Insert Common Header and Footer Information
To insert Header and Footer information such as page numbers, date, or title, first, decide if you
want the information in the header (at the top of the page) or in the Footer (at the bottom of the
page), then:
• Click the Insert Tab on the Ribbon
• Click Header or Footer
• Choose a style
Footnotes
Footnotes are sometimes necessary for providing additional information in your document. They
normally use a superscript number as a marker, making it easy for the reader to simply look down
from the text to the notes at the bottom to gather further information. Word automatically keeps
track of the numbering and placement of the footnotes for you, making this a painless task to
perform when writing that thesis, book, or scientific paper. To insert footnotes into your Word
document, do the following…
• Click the place in your document that you wish to place the insertion point for the reference
mark to the footnote.
• In the Ribbon, click the References tab.
• In the Footnotes section, click Insert Footnote. Word will insert the reference mark at the
point you selected and then take you to the bottom of the page.
• Type your footnote.
• When you are done, right-click the footnote and select Go to Footnote to take you back to
the insertion point in the main body so you can continue working on your document.
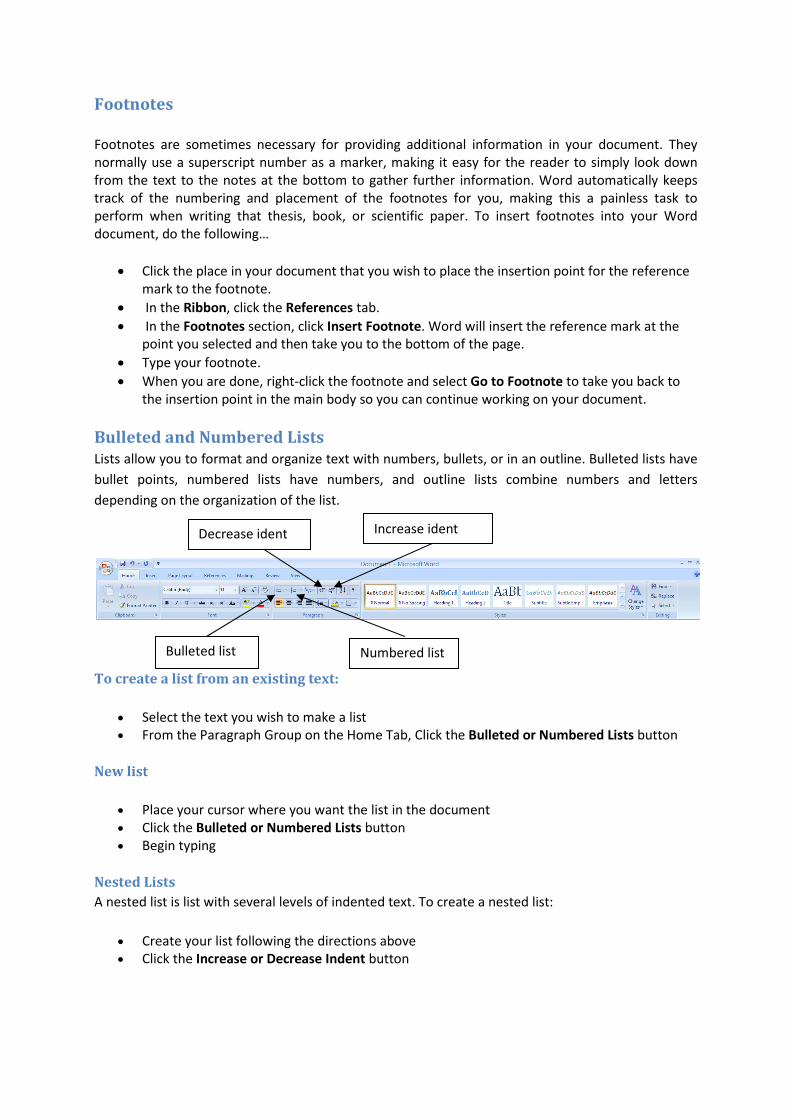
Bulleted and Numbered Lists
Lists allow you to format and organize text with numbers, bullets, or in an outline. Bulleted lists have
bullet points, numbered lists have numbers, and outline lists combine numbers and letters
depending on the organization of the list.
To create a list from an existing text:
• Select the text you wish to make a list
• From the Paragraph Group on the Home Tab, Click the Bulleted or Numbered Lists button
New list
• Place your cursor where you want the list in the document
• Click the Bulleted or Numbered Lists button
• Begin typing
Nested Lists
A nested list is list with several levels of indented text. To create a nested list:
• Create your list following the directions above
• Click the Increase or Decrease Indent button
Bulleted list Numbered list
Increase ident Decrease ident
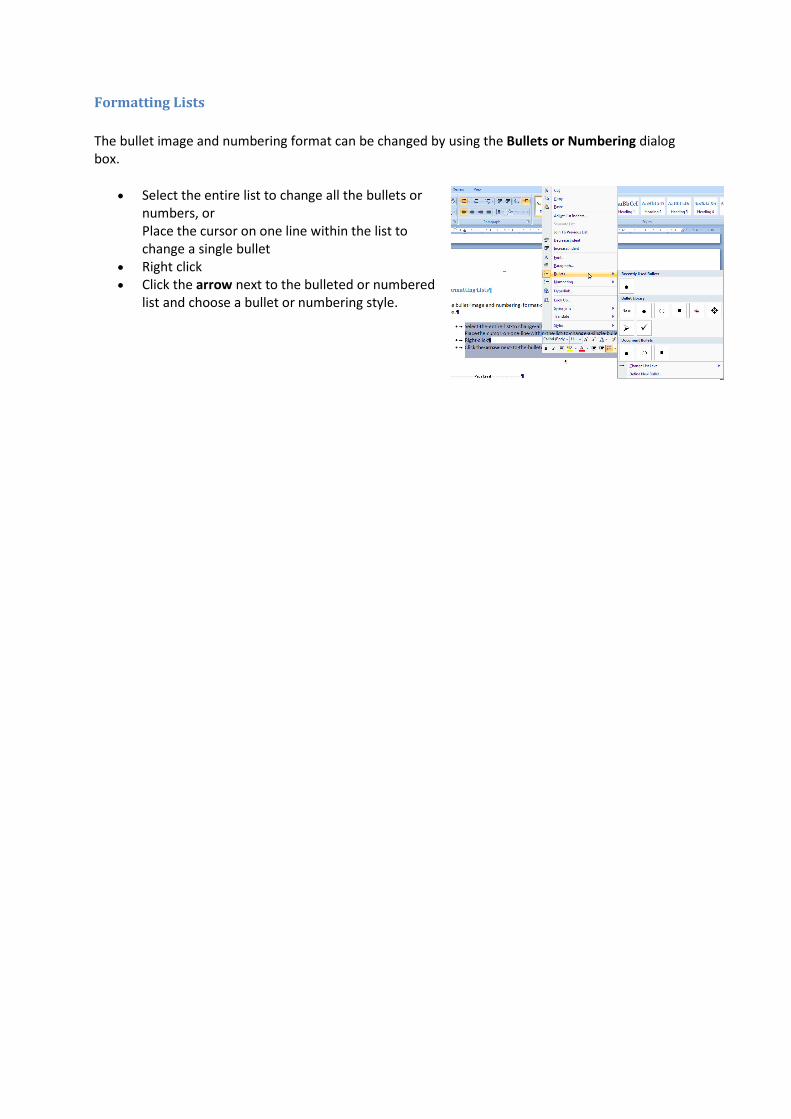
Formatting Lists
The bullet image and numbering format can be changed by using the Bullets or Numbering dialog
box.
• Select the entire list to change all the bullets or
numbers, or
Place the cursor on one line within the list to
change a single bullet
• Right click
• Click the arrow next to the bulleted or numbered
list and choose a bullet or numbering style.
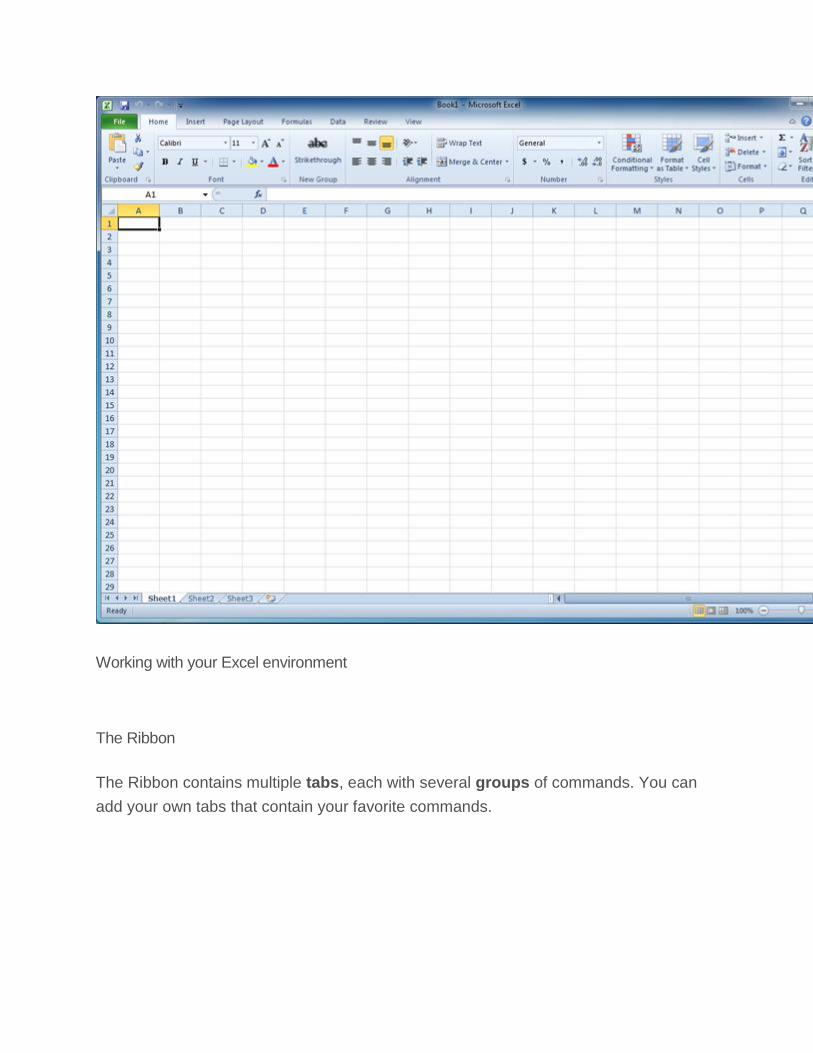
Working with your Excel environment
The Ribbon
The Ribbon contains multiple tabs, each with several groups of commands. You can
add your own tabs that contain your favorite commands.

Certain programs—such as Adobe Acrobat Reader—may install additional tabs to the
Ribbon. These tabs are called add-ins.
To customize the Ribbon:
You can customize the Ribbon by creating your own tabs that house your desired
commands. Commands are always housed within a group, and you can create as
many groups as you need to keep your tabs organized. You can also add commands to
any of the default tabs as long as you create a custom group within the tab.
1. Right-click the Ribbon, then select Customize the Ribbon. A dialog box will appear.
2. Click New Tab. A new tab will be created with a new group inside it.

3. Make sure the new group is selected.
4. Select a command from the list on the left, then click Add. You can also drag commands directly into a group.
5. When you are done adding commands, click OK.
If you do not see the command you want, click the Choose commands drop-down box
and select All Commands.

To minimize and maximize the Ribbon:
The Ribbon is designed to be easy to use and responsive to your current tasks;
however, if you find that it's taking up too much of your screen space, you
can minimize it.
1. Click the arrow in the upper-right corner of the Ribbon to minimize it.
2. To maximize the Ribbon, click the arrow again.
When the Ribbon is minimized, you can make it reappear by clicking a tab. However,
the Ribbon will disappear again when you're not using it.
The Quick Access toolbar
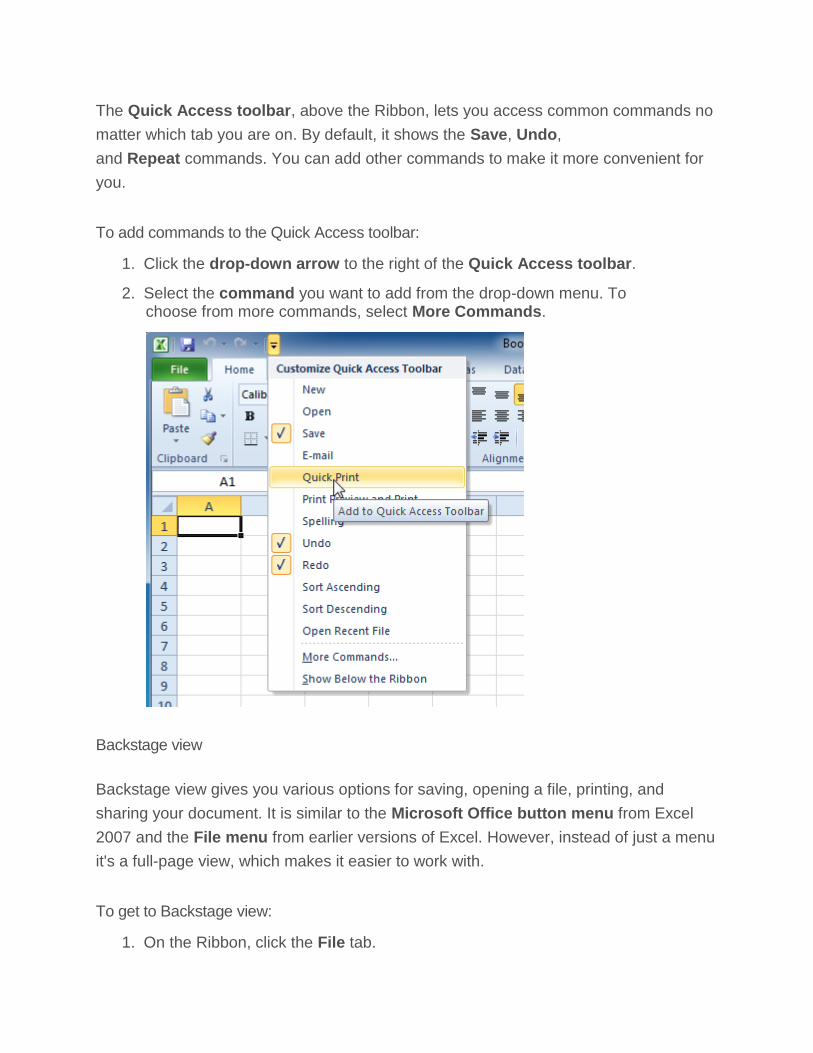
The Quick Access toolbar, above the Ribbon, lets you access common commands no
matter which tab you are on. By default, it shows the Save, Undo,
and Repeat commands. You can add other commands to make it more convenient for
you.
To add commands to the Quick Access toolbar:
1. Click the drop-down arrow to the right of the Quick Access toolbar.
2. Select the command you want to add from the drop-down menu. To choose from more commands, select More Commands.
Backstage view
Backstage view gives you various options for saving, opening a file, printing, and
sharing your document. It is similar to the Microsoft Office button menu from Excel
2007 and the File menu from earlier versions of Excel. However, instead of just a menu
it's a full-page view, which makes it easier to work with.
To get to Backstage view:
1. On the Ribbon, click the File tab.

2. Choose your desired option, or return to your workbook by clicking any tab on the Ribbon.
Click the buttons in the interactive below to learn about the different things you can do in
Backstage view.

Creating and opening workbooks
Excel files are called workbooks. Each workbook holds one or more worksheets (also
known as spreadsheets).
To create a new blank workbook:
1. Click the File tab. This takes you to Backstage view.
2. Select New.

3. Select Blank workbook under Available Templates. It will be highlighted by default.
4. Click Create. A new blank workbook appears in the Excel window.
To save time, you can create your document from a template, which you can select
under Available Templates. We'll talk more about this in a later lesson.
To open an existing workbook:
1. Click the File tab. This takes you to Backstage view.
2. Select Open. The Open dialog box appears.

3. Select your desired workbook, then click Open.
If you have opened the existing workbook recently, it may be easier to
choose Recent from the File tab instead of Open to search for your workbook.

Excel cell
You will need to know the basic ways you can work with cells and cell content in Excel
to be able to use it to calculate, analyze, and organize data. In this lesson, you will learn
how to select cells, insert content, and delete cells and cell content. You will also
learn how to cut, copy, and paste cells; drag and drop cells; and fill cells using the
fill handle.
Introduction to cells and cell content
Cells are the basic building blocks of a worksheet. They can contain a variety of content
such as text, formatting attributes, formulas, and functions. To work with cells, you'll
need to know how to select them, insert content, and delete cells and cell content.
The cell
Each rectangle in a worksheet is called a cell. A cell is the intersection of a row and
a column.

Each cell has a name, or a cell address based on which column and row it intersects.
The cell address of a selected cell appears in the name box. Here, you can see
that C5 is selected.
You can also select multiple cells at the same time. A group of cells is known as a cell
range. Rather than a single cell address, you will refer to a cell range using the cell
addresses of the first and last cells in the cell range, separated by a colon. For
example, a cell range that included cells A1, A2, A3, A4, and A5 would be written
as A1:A5.
To select a cell:
1. Click a cell to select it. When a cell is selected, you will notice that
the borders of the cell appear bold and the column heading and row heading of the cell are highlighted.
2. Release your mouse. The cell will stay selected until you click another cell in the worksheet.
You can also navigate your worksheet and select a cell by using the arrow keys on
your keyboard.
To select multiple cells:

1. Click and drag your mouse until all of the adjoining cells you want are highlighted.
2. Release your mouse. The cells will stay selected until you click another cell in the worksheet.
Cell content
Each cell can contain its own text, formatting, comments, formulas, and functions.
Text Cells can contain letters, numbers, and dates.
Formatting attributes Cells can contain formatting attributes that change the way letters, numbers, and dates are displayed. For example, dates can be formatted as MM/DD/YYYY or M/D/YYYY.
Comments Cells can contain comments from multiple reviewers.
Formulas and functions Cells can contain formulas and functions that calculate cell values. For example, SUM(cell 1, cell 2...) is a formula that can add the values in multiple cells.
To insert content:
1. Click a cell to select it.
2. Enter content into the selected cell using your keyboard. The content appears in the cell and in the formula bar. You can also enter or edit cell content from the formula bar.

To delete content within cells:
1. Select the cells containing content you want to delete.
2. Click the Clear command on the Ribbon. A dialog box will appear.
3. Select Clear Contents.

You can also use your keyboard's Backspace key to delete content from a single
cell or the Delete key to delete content from multiple cells.
To delete cells:
1. Select the cells you want to delete.
2. Choose the Delete command from the Ribbon.
There's an important difference between deleting the content of a cell and deleting
the cell itself. If you delete the cell, by default the cells underneath it will shift up and
replace the deleted cell.
To copy and paste cell content:
1. Select the cells you want to copy.
2. Click the Copy command. The border of the selected cells will change appearance.

3. Select the cell or cells where you want to paste the content.
4. Click the Paste command. The copied content will be entered into the highlighted cells.

To cut and paste cell content:
1. Select the cells you want to cut.
2. Click the Cut command. The border of the selected cells will change appearance.
3. Select the cells where you want to paste the content.
4. Click the Paste command. The cut content will be removed from the original cells and entered into the highlighted cells.
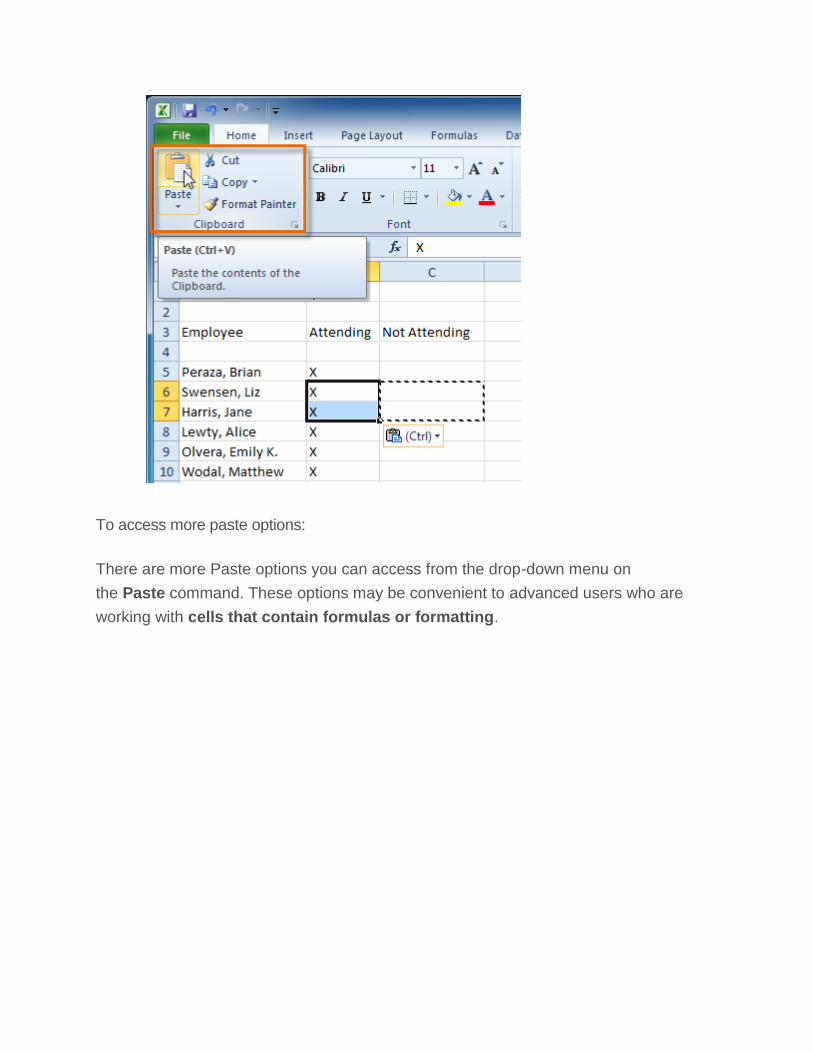
To access more paste options:
There are more Paste options you can access from the drop-down menu on
the Paste command. These options may be convenient to advanced users who are
working with cells that contain formulas or formatting.

To access formatting commands by right-clicking:
1. Select the cells you want to format.
2. Right-click the selected cells. A dialog box will appear where you can easily access many commands on the Ribbon.

To drag and drop cells:
1. Select the cells you want to move.
2. Position your mouse on one of the outside edges of the selected cells.
The mouse changes from a white cross to a black cross with 4
arrows .
3. Click and drag the cells to the new location.

4. Release your mouse, and the cells will be dropped there.
To use the fill handle to fill cells:
1. Select the cell or cells containing the content you want to use. You can fill cell content either vertically or horizontally.
2. Position your mouse over the fill handle so the white cross becomes a black cross .
3. Click and drag the fill handle until all of the cells you want to fill are highlighted.
4. Release the mouse, and your cells will be filled.


WORKBOOK
When you open a new blank workbook, the cells are set to a default size. You have the
ability to modify cells, as well as to insert and delete columns, rows, and cells as
needed. In this lesson, you will learn how to change row height and column
width, insert and delete rows and columns, wrap text in a cell, and merge cells.
Working with columns, rows, and cells
By default, every row and column of a new workbook is set to the
same height and width. Excel allows you to modify column width and row height in
different ways.
To modify column width:
1. Position your mouse over the column line in the column heading so
the white cross becomes a double arrow .
2. Click and drag the column to the right to increase column width or to the left to decrease column width.
3. Release the mouse. The column width will be changed in your spreadsheet.

If you see pound signs (#######) in a cell, it means the column is not wide enough to
display the cell content. Simply increase the column width to show the cell content.
To set column width with a specific measurement:
1. Select the columns you want to modify.
2. Click the Format command on the Home tab. The format drop-down menu appears.
3. Select Column Width.
4. The Column Width dialog box appears. Enter a specific measurement.

5. Click OK. The width of each selected column will be changed in your worksheet.
Select AutoFit Column Width from the format drop-down menu, and Excel will
automatically adjust each selected column so all of the text will fit.
To modify row height:
1. Position the cursor over the row line so the white cross becomes
a double arrow .
2. Click and drag the row downward to increase row height or upward to decrease height.
3. Release the mouse. The height of each selected row will be changed in your worksheet.
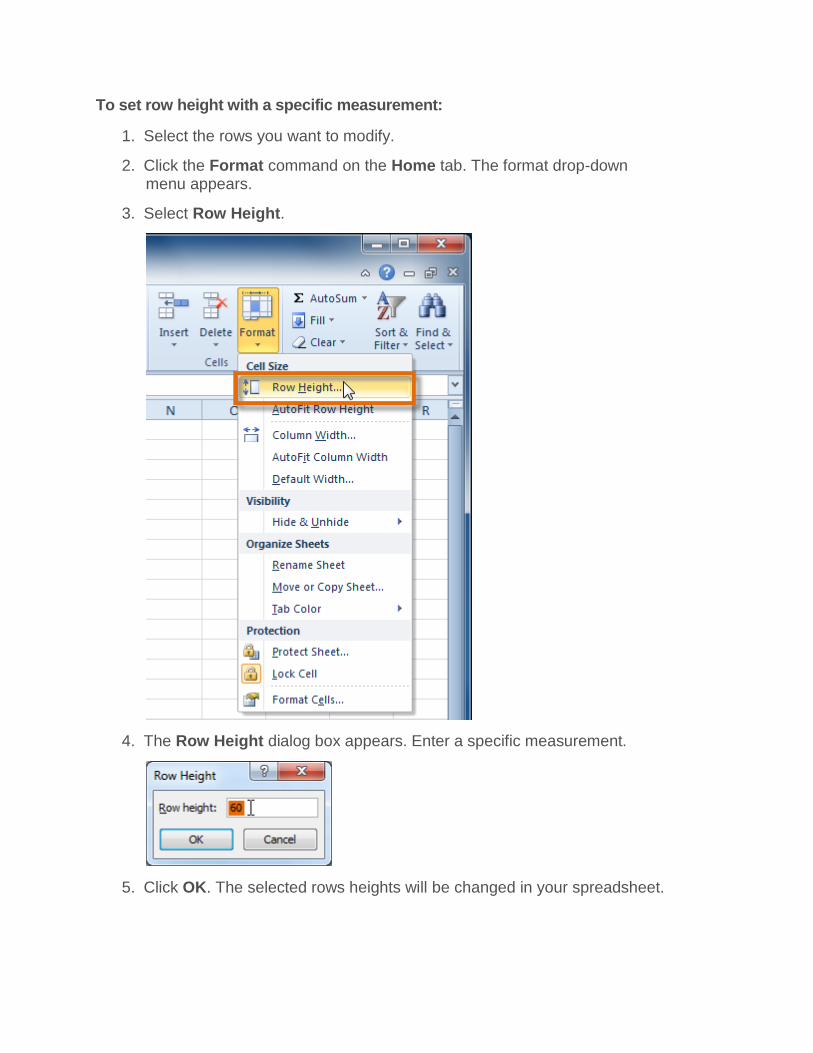
To set row height with a specific measurement:
1. Select the rows you want to modify.
2. Click the Format command on the Home tab. The format drop-down menu appears.
3. Select Row Height.
4. The Row Height dialog box appears. Enter a specific measurement.
5. Click OK. The selected rows heights will be changed in your spreadsheet.

Select AutoFit Row Height from the format drop-down menu, and Excel will
automatically adjust each selected row so all of the text will fit.
To insert rows:
1. Select the row below where you want the new row to appear.
2. Click the Insert command on the Home tab.
3. The new row appears in your worksheet.

When inserting new rows, columns, or cells, you will see the Insert Options button by
the inserted cells. This button allows you to choose how Excel formats them. By default,
Excel formats inserted rows with the same formatting as the cells in the row above
them. To access more options, hover your mouse over the Insert Options button and
click the drop-down arrow that appears.
To insert columns:
1. Select the column to the right of where you want the new column to appear. For example, if you want to insert a column between A and B, select column B.

2. Click the Insert command on the Home tab.
3. The new column appears in your worksheet.

By default, Excel formats inserted columns with the same formatting as the column to
the left of them. To access more options, hover your mouse over the Insert
Options button and click the drop-down arrow that appears.
When inserting rows and columns, make sure to select the row or column by clicking its
heading so all of the cells in that row or column are selected. If you select just a cell in
the row or column, only a new cell will be inserted.
To delete rows:
1. Select the rows you want to delete.
2. Click the Delete command on the Home tab.

3. The rows are deleted from your worksheet.
To delete columns:
1. Select the columns you want to delete.

2. Click the Delete command on the Home tab.
3. The columns are deleted from your worksheet.

Wrapping text and merging cells
If a cell contains more text than can be displayed, you can choose to wrap the text
within the cell or merge the cell with empty adjoining cells. Wrap text to make it display
on multiple lines of the cell. Merge cells to combine adjoining cells into one larger cell.
To wrap text:
1. Select the cells with text that you want to wrap.
2. Select the Wrap Text command on the Home tab.
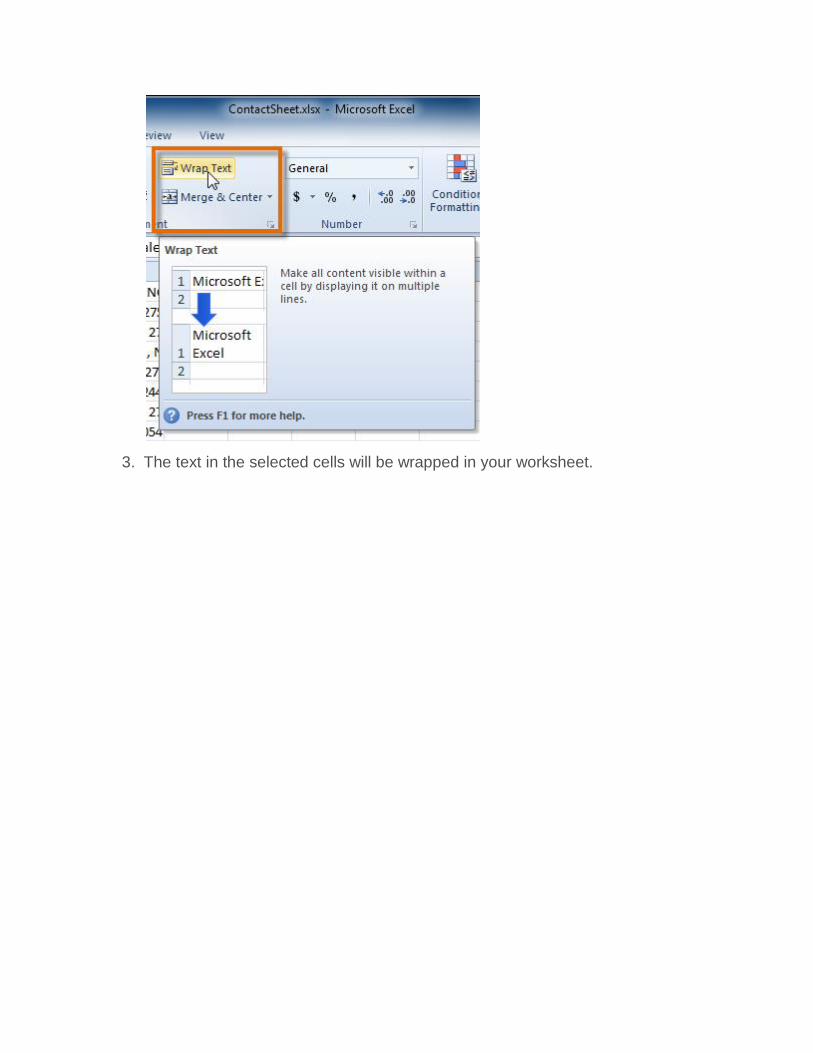
3. The text in the selected cells will be wrapped in your worksheet.

If you change your mind, reclick the Wrap Text command to unwrap the text.
To merge cells using the Merge & Center command:
1. Select the cells you want to merge.

2. Select the Merge & Center command on the Home tab.
3. The selected cells will be merged, and the text will be centered.

If you change your mind, reclick the Merge & Center command to unmerge the cells.
To access more merge options:
Click the drop-down arrow next to the Merge & Center command on the Home tab.
The merge drop-down menu appears.
Merge & Center: Merges selected cells into one cell and centers the text
Merge Across: Merges each row of selected cells into larger cells; useful when merging content across multiple rows of cells rather than creating one large cell
Merge Cells: Merges selected cells into one cell
Unmerge Cells: Unmerges selected cells
Although merging cells can be useful, it can also cause problems with some
spreadsheets. Watch the video below to learn about some of the problems with merging
cells.

Formatting Cells
Introduction
Spreadsheets that have not been formatted can be difficult to read. Formatted text and
cells can draw attention to specific parts of the spreadsheet and make the spreadsheet
more visually appealing and easier to understand.
In Excel, there are many tools you can use to format text and cells. In this lesson, you
will learn how to change the color and style of text and cells, align text, and apply
special formatting to numbers and dates.
Formatting text
Many of the commands you will use to format text can be found in the Font, Alignment,
and Number groups on the Ribbon. Font commands let you change the style, size, and
color of text. You can also use them to add borders and fill colors to
cells. Alignment commands let you format how text is displayed across cells both
horizontally and vertically. Number commands let you change how selected cells
display numbers and dates.
To change the font:
1. Select the cells you want to modify.
2. Click the drop-down arrow next to the Font command on the Home tab. The font drop-down menu appears.
3. Move your mouse over the various fonts. A live preview of the font will appear in the worksheet.

4. Select the font you want to use.
To change the font size:
1. Select the cells you want to modify.
2. Click the drop-down arrow next to the font size command on the Home tab. The font size drop-down menu appears.
3. Move your mouse over the various font sizes. A live preview of the font size will appear in the worksheet.

4. Select the font size you want to use.
You can also use the Grow Font and Shrink Font commands to change the size.
To use the bold, italic, and underline commands:
1. Select the cells you want to modify.
2. Click the Bold, Italic, or Underline command on the Home tab.

To add a border:
1. Select the cells you want to modify.
2. Click the drop-down arrow next to the Borders command on the Home tab. The border drop-down menu appears.
3. Select the border style you want to use.
You can draw borders and change the line style and color of borders with the Draw
Borders tools at the bottom of the Borders drop-down menu.
To change font color:
1. Select the cells you want to modify.
2. Click the drop-down arrow next to the font color command on the Home tab. The color menu appears.

3. Move your mouse over the various font colors. A live preview of the color will appear in the worksheet.
4. Select the font color you want to use.
Your color choices are not limited to the drop-down menu that appears. Select More
Colors at the bottom of the menu to access additional color options.
To add a fill color:
1. Select the cells you want to modify.
2. Click the drop-down arrow next to the fill color command on the Home tab. The color menu appears.
3. Move your cursor over the various fill colors. A live preview of the color will appear in the worksheet.
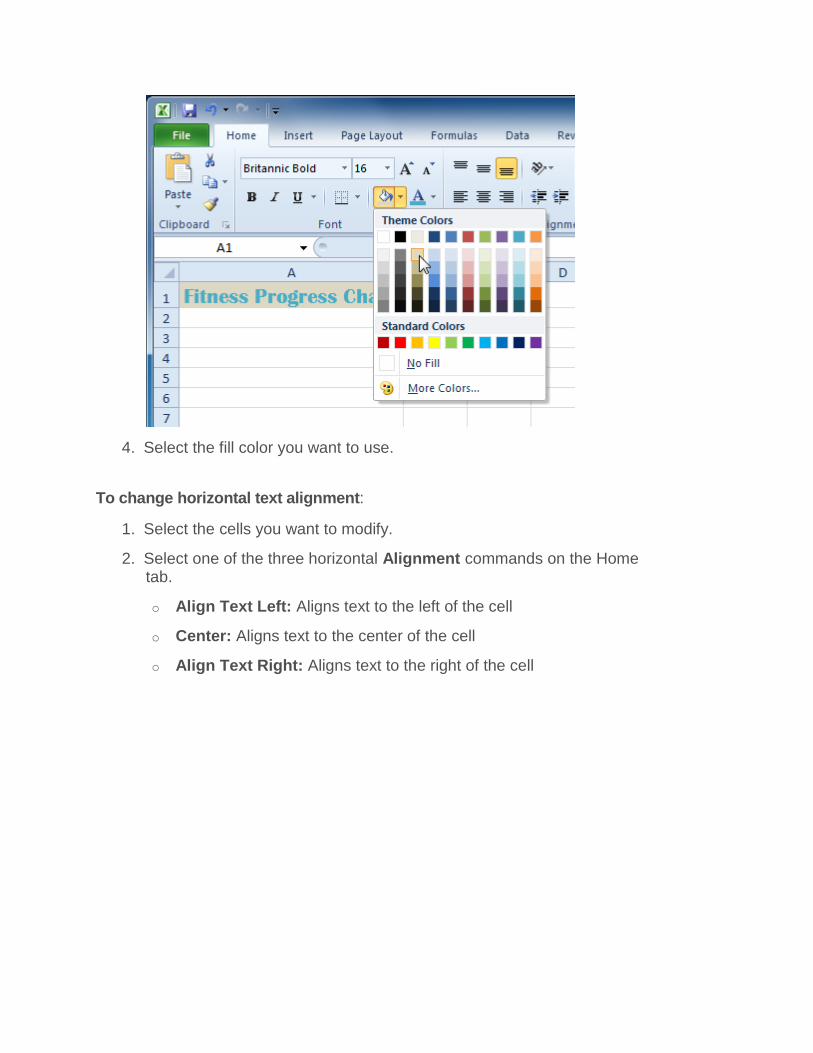
4. Select the fill color you want to use.
To change horizontal text alignment:
1. Select the cells you want to modify.
2. Select one of the three horizontal Alignment commands on the Home tab.
o Align Text Left: Aligns text to the left of the cell
o Center: Aligns text to the center of the cell
o Align Text Right: Aligns text to the right of the cell
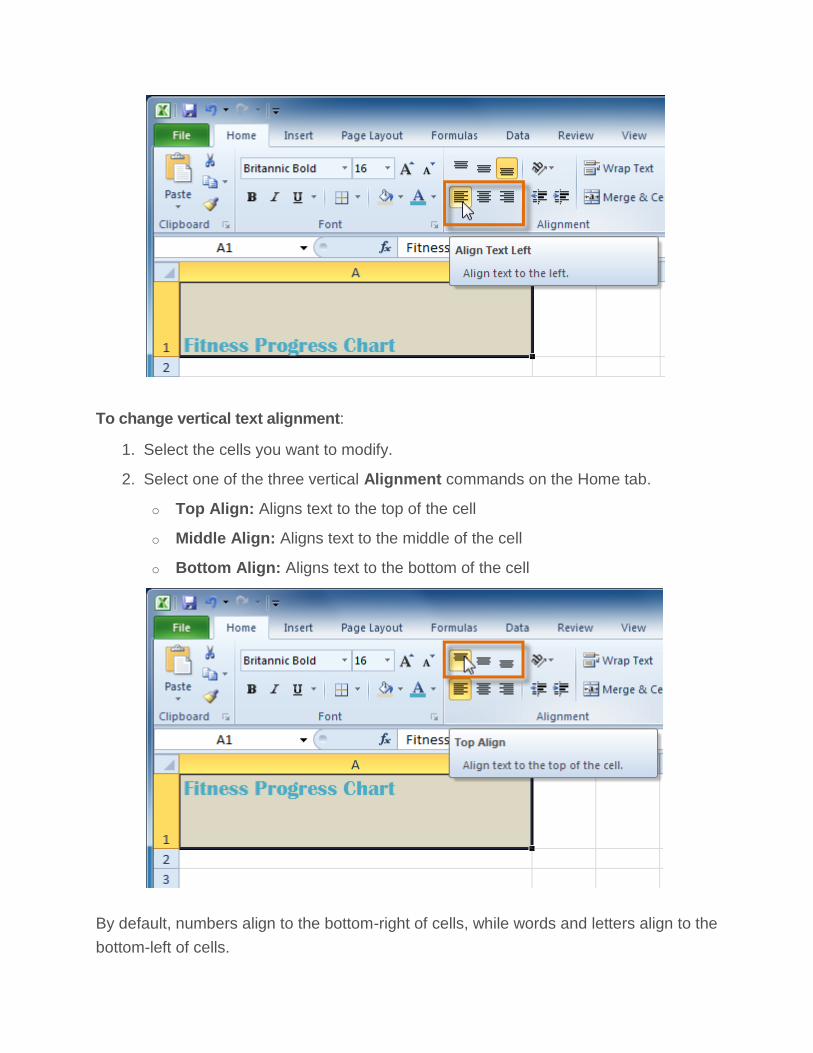
To change vertical text alignment:
1. Select the cells you want to modify.
2. Select one of the three vertical Alignment commands on the Home tab.
o Top Align: Aligns text to the top of the cell
o Middle Align: Aligns text to the middle of the cell
o Bottom Align: Aligns text to the bottom of the cell
By default, numbers align to the bottom-right of cells, while words and letters align to the
bottom-left of cells.

Using the Format Painter
If you want to copy formatting from one cell to another, you can use the Format
Painter command on the Home tab. When you click the Format Painter, it will copy all
of the formatting from the selected cell. You can then click and drag over any cells you
want to paste the formatting to.
Formatting numbers and dates
One of Excel's most useful features is its ability to format numbers and dates in a variety
of ways. For example, you might need to format numbers with decimal places, currency
symbols ($), or percent symbols (%).
To format numbers and dates:
1. Select the cells you want to modify.
2. Click the drop-down arrow next to the Number Format command on the Home tab.
3. Select the number format you want. For some number formats, you can then use the Increase Decimal and Decrease Decimal commands (below the Number Format command) to change the number of decimal places that are displayed.
Click the buttons in the interactive below to learn about the different number formats.

1. Change the fill color of a group of cells. If you are using the example, add
a fill color to row 3.
2. Try changing the vertical and horizontal text alignment for some cells.
3. Try changing the formatting of a number. If you are using the example, change the date format in column A.
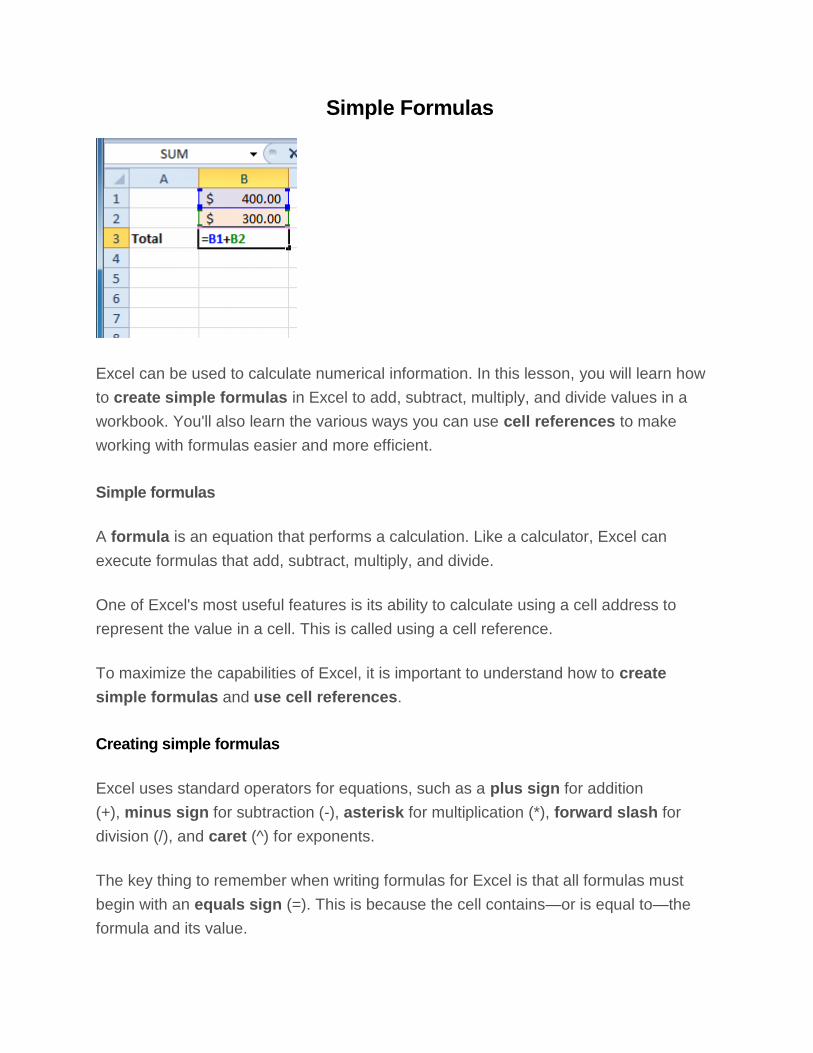
Simple Formulas
Excel can be used to calculate numerical information. In this lesson, you will learn how
to create simple formulas in Excel to add, subtract, multiply, and divide values in a
workbook. You'll also learn the various ways you can use cell references to make
working with formulas easier and more efficient.
Simple formulas
A formula is an equation that performs a calculation. Like a calculator, Excel can
execute formulas that add, subtract, multiply, and divide.
One of Excel's most useful features is its ability to calculate using a cell address to
represent the value in a cell. This is called using a cell reference.
To maximize the capabilities of Excel, it is important to understand how to create
simple formulas and use cell references.
Creating simple formulas
Excel uses standard operators for equations, such as a plus sign for addition
(+), minus sign for subtraction (-), asterisk for multiplication (*), forward slash for
division (/), and caret (^) for exponents.
The key thing to remember when writing formulas for Excel is that all formulas must
begin with an equals sign (=). This is because the cell contains—or is equal to—the
formula and its value.

To create a simple formula in Excel:
1. Select the cell where the answer will appear (B4, for example).
2. Type the equals sign (=).
3. Type in the formula you want Excel to calculate (75/250, for example).
4. Press Enter. The formula will be calculated, and the value will be displayed in the cell.

If the result of a formula is too large to be displayed in a cell, it may appear as pound
signs (#######) instead of a value. This means the column is not wide enough to
display the cell content. Simply increase the column width to show the cell content.
Creating formulas with cell references
When a formula contains a cell address, it is called a cell reference. Creating a formula
with cell references is useful because you can update data in your worksheet without
having to rewrite the values in the formula.
To create a formula using cell references:
1. Select the cell where the answer will appear (B3, for example).
2. Type the equals sign (=).
3. Type the cell address that contains the first number in the equation (B1, for example).

4. Type the operator you need for your formula. For example, type the addition sign (+).
5. Type the cell address that contains the second number in the equation (B2, for example).
6. Press Enter. The formula will be calculated, and the value will be displayed in the cell.
If you change a value in either B1 or B2, the total will automatically recalculate.
.

To create a formula using the point-and-click method:
1. Select the cell where the answer will appear (B4, for example).
2. Type the equals sign (=).
3. Click the first cell to be included in the formula (A3, for example).
4. Type the operator you need for the formula. For example, type the multiplication sign (*).
5. Click the next cell in the formula (B3, for example).
6. Press Enter. The formula will be calculated, and the value will be displayed in the cell.

To edit a formula:
1. Click the cell you want to edit.
2. Insert the cursor in the formula bar, and edit the formula as desired. You can also double-click the cell to view and edit the formula directly from the cell.
3. When you're done, press Enter or select the Enter command .
4. The new value will be displayed in the cell.

Worksheet
Introduction
Every Excel workbook contains at least one or more worksheets. If you are
working with a large amount of related data, you can use worksheets to help organize
your data and make it easier to work with.
Here, you will learn how to name and add color to worksheet tabs, as well as how
to add, delete, copy, and move worksheets. Additionally, you will learn how
to group and ungroup worksheets and freeze columns and rows in worksheets so they
remain visible even when you're scrolling.
Introduction to worksheets
When you open an Excel workbook, there are three worksheets by default. The default
names on the worksheet tabs are Sheet1, Sheet2, and Sheet3. To organize your
workbook and make it easier to navigate, you can rename and even color code the
worksheet tabs. Additionally, you can insert, delete, move, and copy worksheets.
To rename worksheets:
1. Right-click the worksheet tab you want to rename. The worksheet menu appears.
2. Select Rename.

3. The text is now highlighted by a black box. Type the name of your worksheet.
4. Click anywhere outside the tab. The worksheet is renamed.
To insert new worksheets:
Click the Insert Worksheet icon. A new worksheet will appear.
You can change the setting for the default number of worksheets that appear in Excel
workbooks. To access this setting, go into Backstage view and click Options.
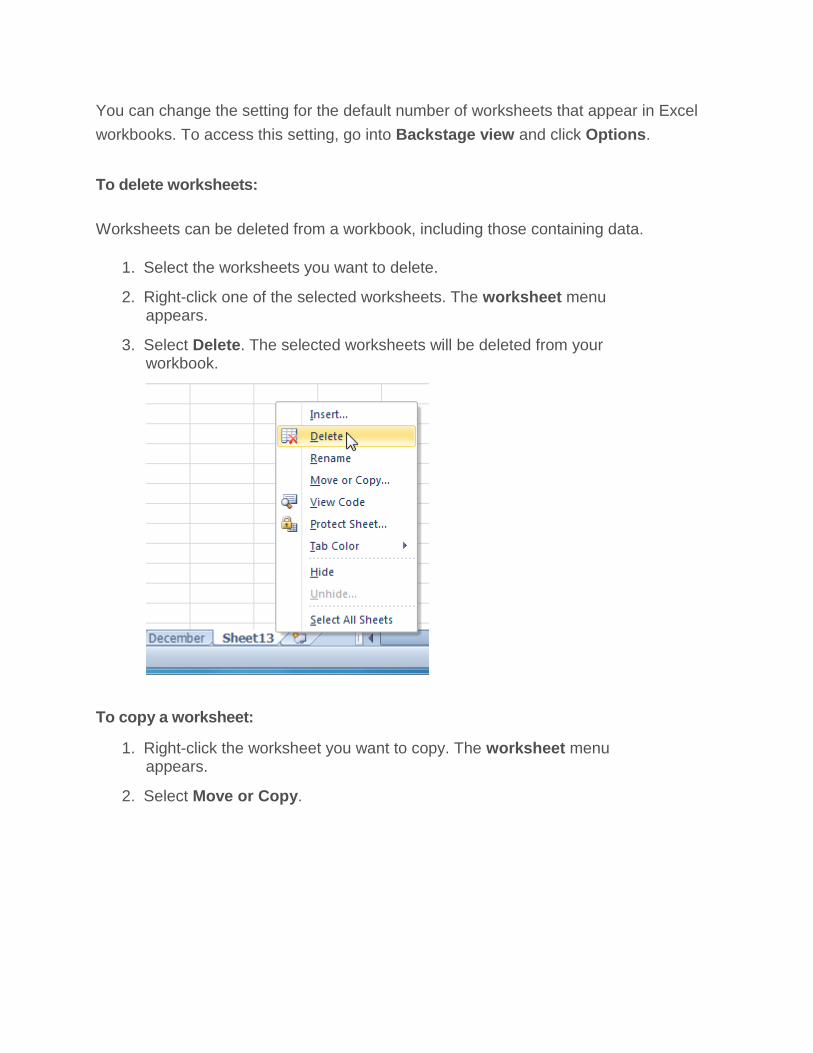
To delete worksheets:
Worksheets can be deleted from a workbook, including those containing data.
1. Select the worksheets you want to delete.
2. Right-click one of the selected worksheets. The worksheet menu appears.
3. Select Delete. The selected worksheets will be deleted from your workbook.
To copy a worksheet:
1. Right-click the worksheet you want to copy. The worksheet menu appears.
2. Select Move or Copy.

3. The Move or Copy dialog box appears. Check the Create a copy box.
4. Click OK. Your worksheet is copied. It will have the same title as your original worksheet, but the title will include a version number, such as January (2).

To move a worksheet:
1. Click the worksheet you want to move. The mouse will change to show a
small worksheet icon .
2. Drag the worksheet icon until a small black arrow appears where you want the worksheet to be moved.
3. Release your mouse, and the worksheet will be moved.
To color code worksheet tabs:
You can color worksheet tabs to help organize your worksheets and make your
workbook easier to navigate.
1. Right-click the worksheet tab you want to color. The worksheet menu appears.
2. Select Tab Color. The color menu appears.
3. Select the color you want to change your tab.

4. The tab color will change in the workbook. If your tab still appears white, it is because the worksheet is still selected. Select any other worksheet tab to see the color change.
Switching between worksheets
If you want to view a different worksheet, you can simply click the tab to switch to that
worksheet. However, with larger workbooks this can sometimes become tedious, as it
may require scrolling through all of the tabs to find the one you want. Instead, you can
simply right-click the scroll arrows in the lower-left corner, as shown below.
A dialog box will appear with a list of all of the sheets in your workbook. You can
then double-click the sheet you want to jump to.

.
To freeze rows:
1. Select the row below the rows you want frozen. For example, if you want rows 1 and 2 to always appear at the top of the worksheet even as you scroll, then select row 3.
2. Click the View tab.
3. Click the Freeze Panes command. A drop-down menu appears.
4. Select Freeze Panes.

5. A black line appears below the rows that are frozen in place. Scroll down in the worksheet to see the rows below the frozen rows.
To freeze columns:
1. Select the column to the right of the columns you want frozen. For example, if you want columns A and B to always appear to the left of the worksheet even as you scroll, select column C.
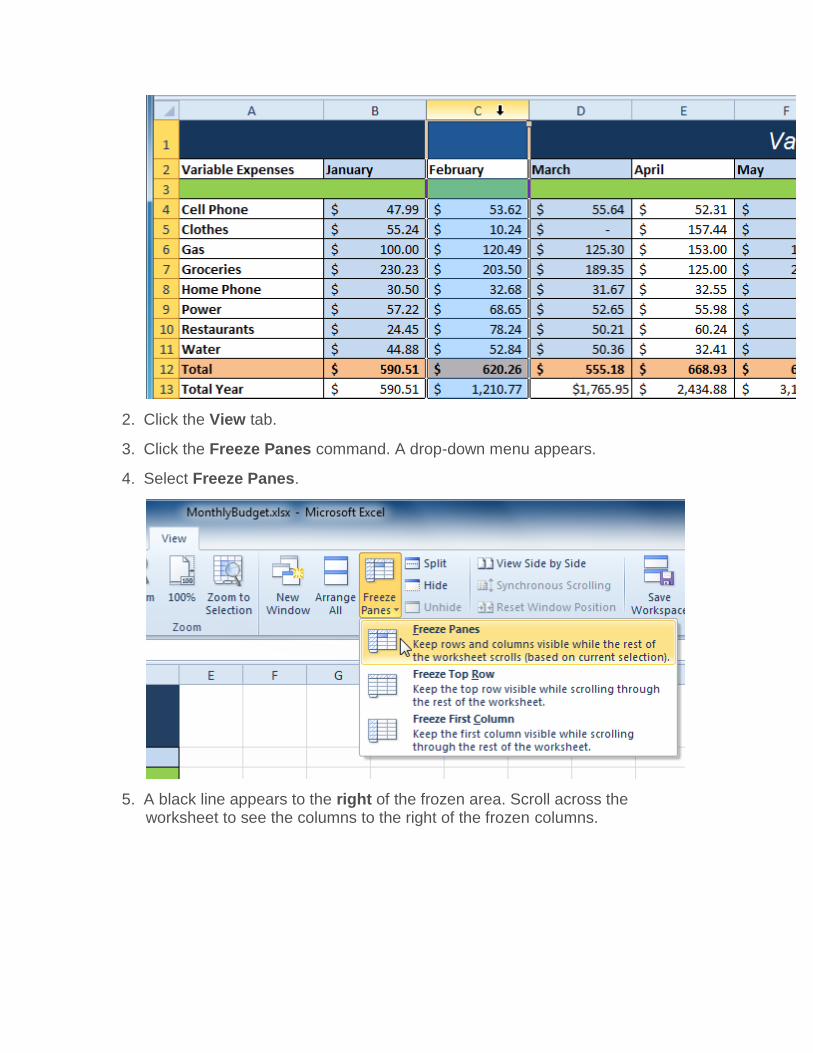
2. Click the View tab.
3. Click the Freeze Panes command. A drop-down menu appears.
4. Select Freeze Panes.
5. A black line appears to the right of the frozen area. Scroll across the worksheet to see the columns to the right of the frozen columns.

To unfreeze panes:
1. Click the View tab.
2. Click the Freeze Panes command. A drop-down menu appears.
3. Select Unfreeze Panes. The panes will be unfrozen, and the black line will disappear.

1.
COMPLEX FORMULAS
Creating complex formulas
Excel is a spreadsheet application that can help you calculate and analyze numerical
information for household budgets, company finances, inventory, and more. To do this,
you need to understand complex formulas.
In this lesson, you'll learn how to write complex formulas in Excel following the order of
operations. You will also learn about relative and absolute cell references, as well as
how to copy and fill formulas containing cell references.
Complex formulas

Simple formulas have one mathematical operation, such as 5+5. Complex
formulas have more than one mathematical operation, such as 5+5-2. When there is
more than one operation in a formula, the order of operations tells us which operation
to calculate first. To use Excel to calculate complex formulas, you'll need to understand
the order of operations.
The order of operations
Excel calculates formulas based on the following order of operations:
1. Operations enclosed in parentheses
2. Exponential calculations (to the power of)
3. Multiplication and division, whichever comes first
4. Addition and subtraction, whichever comes first
A mnemonic that can help you remember the order
is Please Excuse My Dear Aunt Sally.
Example 1
The following example demonstrates how to use the order of operations to calculate a
formula:

Example 2
In this example, we'll review how Excel will calculate a complex formula using the order
of operations. The selected cell will display the percent of total Pete Lily seeds sold that
were white.
1. First, Excel will calculate the amount sold in parentheses: (19*1.99)=37.81 White Pete Lily seeds and (33*1.99)=65.67 Total Pete Lily seeds.
2. Second, it will divide the White Pete Lily seeds amount by the Total Pete Lily seeds amount: 37.81/65.67=.5758.
3. Last, it will multiply the result by 100 to obtain the value as a percent: .5758*100=57.58.

Based on this complex formula, the result will show that 57.58% of the total Pete Lily
seeds sold were white. You can see from this example that it is important to enter
complex formulas with the correct order of operations. Otherwise, Excel will not
calculate the results accurately.
To create a complex formula using the order of operations:
In this example, we'll use cell references in addition to actual values to create a
complex formula that will add tax to the nursery order.
1. Click the cell where you want the formula result to appear (F11, for example).
2. Type the equals sign (=).
3. Type an open parenthesis, then click the cell that contains the first value you want in the formula (F4, for example).
4. Type the first mathematical operator (the addition sign, for example).
5. Click the cell that contains the second value you want in the formula (F5, for example), then type a closed parenthesis.
6. Type the next mathematical operator (the multiplication sign, for example).
7. Type the next value in the formula (0.055 for 5.5% tax, for example).
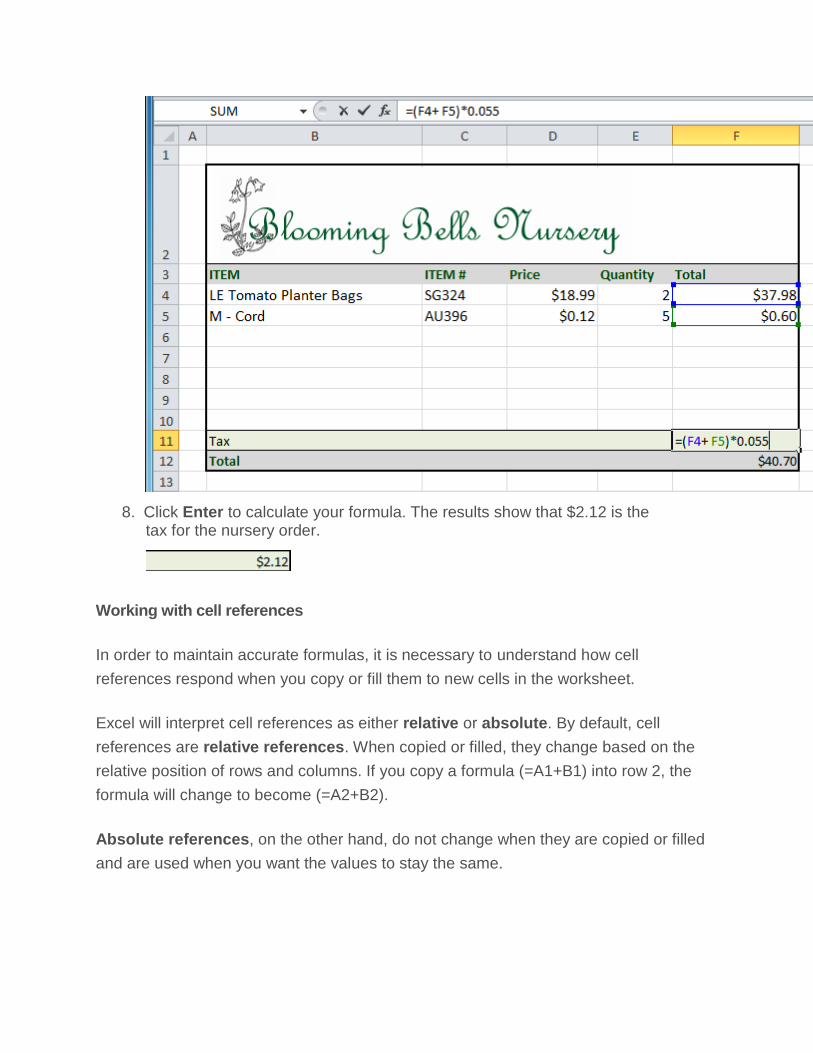
8. Click Enter to calculate your formula. The results show that $2.12 is the tax for the nursery order.
Working with cell references
In order to maintain accurate formulas, it is necessary to understand how cell
references respond when you copy or fill them to new cells in the worksheet.
Excel will interpret cell references as either relative or absolute. By default, cell
references are relative references. When copied or filled, they change based on the
relative position of rows and columns. If you copy a formula (=A1+B1) into row 2, the
formula will change to become (=A2+B2).
Absolute references, on the other hand, do not change when they are copied or filled
and are used when you want the values to stay the same.

Relative references
Relative references can save you time when you're repeating the same type of
calculation across multiple rows or columns.
In the following example, we're creating a formula with cell references in row 4 to
calculate the total cost of the electric bill and water bill for each month (B4=B2+B3). For
the upcoming months, we want to use the same formula with relative references
(C2+C3, D2+D3, E2+E3, etc.). For convenience, we can copy the formula in B4 into the
rest of row 4, and Excel will calculate the value of the bills for these months using
relative references.
To create and copy a formula using relative references:
1. Select the first cell where you want to enter the formula (B4, for example).
2. Enter the formula to calculate the value you want (B2+B3, for example).
3. Press Enter. The formula will be calculated.
4. Select the cell you want to copy (B4, for example), then click the Copy command from the Home tab.
5. Select the cells where you want to paste the formula, then click the Paste command from the Home tab. You can also drag the fill handle to fill cells.

6. Your formula is copied to the selected cells as a relative reference (C4=C2+C3, D4=D2+D3, E4=E2+E3, etc.), and the values are calculated.
Absolute references
There may be times when you do not want a cell reference to change when copying or
filling cells. You can use an absolute reference to keep a row and/or column constant
in the formula.
An absolute reference is designated in a formula by the addition of a dollar sign
($) before the column and row. If it precedes the column or row (but not both), it's known
as a mixed reference.
In the below example, we want to calculate the sales tax for a list of products with
varying prices. We'll use an absolute reference for the sales tax ($B$1) because we do
not want it to change as we are copying the formula down the column of varying prices.
To create and copy a formula using an absolute reference:
1. Select the first cell where you want to enter the formula (C4, for example).

2. Type an equals sign, and then click the cell that contains the first value you want in the formula (B4, for example).
3. Type the first mathematical operator (the multiplication sign, for example).
4. Type the dollar sign ($), then enter the column letter of the cell you are making an absolute reference to (B, for example).
5. Type the dollar sign ($), then enter the row number of the same cell you are making an absolute reference to (1, for example).
6. Press Enter to calculate the formula.

7. Select the cell you want to copy (C4, for example), then click the Copy command from the Home tab.
8. Select the cells where you want to paste the formula, then click the Paste command from the Home tab. You can also drag the fill handle to fill cells.
9. Your formula is copied to the selected cells using the absolute reference (C5=B5*$B$1, C6=B6*$B$1, etc.), and your values are calculated.
When writing a formula, you can press the F4 key on your keyboard to switch between
relative and absolute cell references, as shown in the video below. This is an easy way
to quickly insert an absolute reference.
SORTING DATA
Introduction
With more than 17 billion cells in a single worksheet, Excel 2010 gives you the ability to
work with an enormous amount of data. Arranging your data alphabetically, from
smallest to largest, or using other criteria can help you find the information you're
looking for more quickly.

Here, you will learn how to sort data to better view and organize the contents of your
spreadsheet.
Basic sorting
Sorting is a common task that allows you to change or customize the order of
your spreadsheet data. For example, you could organize an office birthday list by
employee, birthdate, or department, making it easier to find what you're looking for.
Custom sorting takes it a step further, giving you the ability to sort multiple levels—such
as department first, then birthdate—to group birthdates by department.
To sort in alphabetical order:
1. Select a cell in the column you want to sort by. In this example, we'll sort by Last Name.
2. Select the Data tab, then locate the Sort and Filter group.
3. Click the ascending command to Sort A to Z or the descending
command to Sort Z to A.
4. The data in the spreadsheet will be organized alphabetically.

Sorting options can also be found on the Home tab, condensed into the Sort &
Filter command.
To sort in numerical order:
1. Select a cell in the column you want to sort by.
2. From the Data tab, click the ascending command to Sort Smallest to
Largest or the descending command to Sort Largest to Smallest.
3. The data in the spreadsheet will be organized numerically.

To sort by date or time:
1. Select a cell in the column you want to sort by.
2. From the Data tab, click the ascending command to Sort Oldest to
Newest or the descending command to Sort Newest to Oldest.
3. The data in the spreadsheet will be organized by date or time.

To sort by cell color, font color, or cell icon:
1. From the Data tab, click the Sort command to open the Sort dialog box.
2. Identify the column you want to Sort by by clicking the drop-down arrow in the Column field.
3. Choose whether you want to sort by Cell Color, Font Color, or Cell Icon in the Sort On field. In this example, we'll sort by Font Color.

4. In the Order field, click the drop-down arrow to choose a color, then decide whether you want it ordered On Top or On Bottom.
5. Click OK. The data is now sorted by attribute rather than text.
FILTERING DATA
Introduction
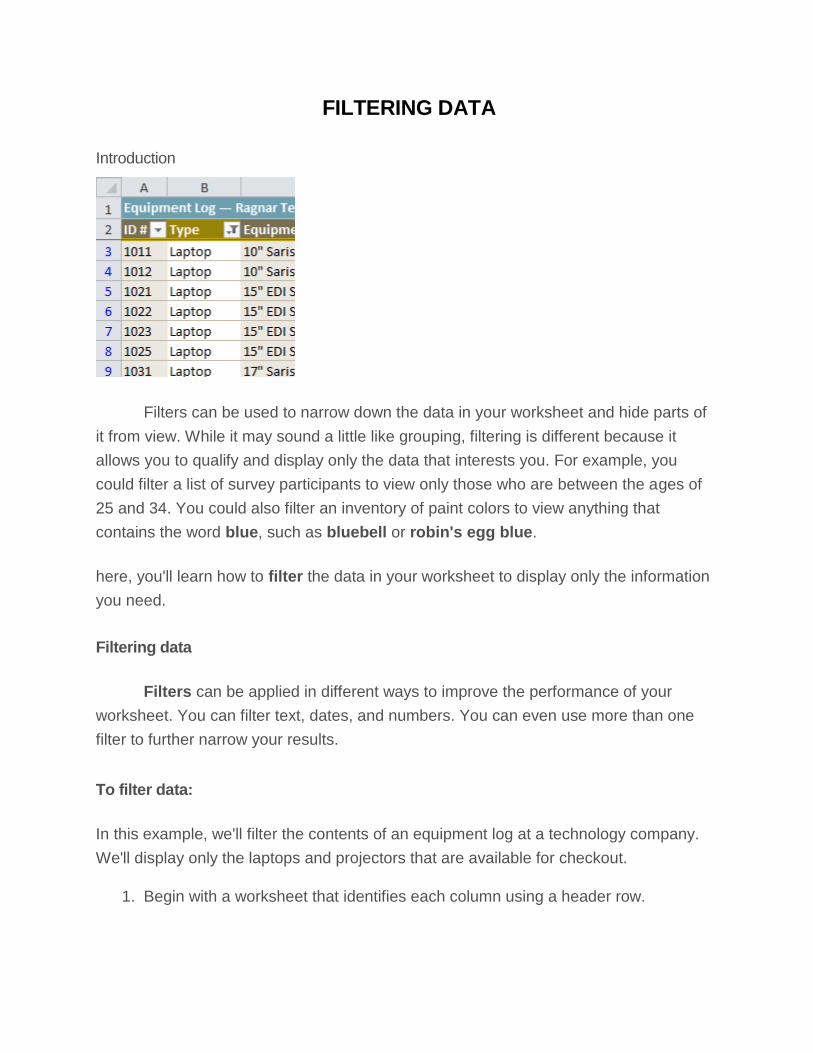
Filters can be used to narrow down the data in your worksheet and hide parts of
it from view. While it may sound a little like grouping, filtering is different because it
allows you to qualify and display only the data that interests you. For example, you
could filter a list of survey participants to view only those who are between the ages of
25 and 34. You could also filter an inventory of paint colors to view anything that
contains the word blue, such as bluebell or robin's egg blue.
here, you'll learn how to filter the data in your worksheet to display only the information
you need.
Filtering data
Filters can be applied in different ways to improve the performance of your
worksheet. You can filter text, dates, and numbers. You can even use more than one
filter to further narrow your results.
To filter data:
In this example, we'll filter the contents of an equipment log at a technology company.
We'll display only the laptops and projectors that are available for checkout.
1. Begin with a worksheet that identifies each column using a header row.

2. Select the Data tab, then locate the Sort & Filter group.
3. Click the Filter command.
4. Drop-down arrows will appear in the header of each column.
5. Click the drop-down arrow for the column you want to filter. In this example, we'll filter the Type column to view only certain types of equipment.

6. The Filter menu appears.
7. Uncheck the boxes next to the data you don't want to view, or uncheck the box next to Select All to quickly uncheck all.
8. Check the boxes next to the data you do want to view. In this example, we'll check Laptop and Projector to view only these types of equipment.
9. Click OK. All other data will be filtered, or temporarily hidden. Only laptops and projectors will be visible.

Filtering options can also be found on the Home tab, condensed into the Sort &
Filter command.
To add another filter:
Filters are additive, meaning you can use as many as you need to narrow your results.
In this example, we'll work with a spreadsheet that has already been filtered to display
only laptops and projectors. Now we'll display only laptops and projectors that were
checked out during the month of August.
1. Click the drop-down arrow where you want to add a filter. In this example, we'll add a filter to the Checked Out column to view information by date.
2. Uncheck the boxes next to the data you don't want to view. Check the boxes next to the data you do want to view. In this example, we'll check the box next to August.

3. Click OK. In addition to the original filter, the new filter will be applied. The worksheet will be narrowed down even further.
To clear a filter:
1. Click the drop-down arrow in the column from which you want to clear the filter.
2. Choose Clear Filter From.

3. The filter will be cleared from the column. The data that was previously hidden will be on display once again.
To instantly clear all filters from your worksheet, click the Filter command on the Data
tab.
FORMATTING TABLES
Introduction

Once you have entered information into a spreadsheet, you may want to format
it. Formatting your spreadsheet can not only improve the look and feel of your
spreadsheet, but it also can make it easier to use. In a previous lesson, we discussed
many manual formatting options such as bold and italics. In this lesson, you'll learn how
to format as a table to take advantage of the tools and predefined table styles available
in Excel 2010.
Formatting tables
Just like regular formatting, tables can help to organize your content and make it
easier for you locate the information you need. To use tables effectively, you'll need to
know how to format information as a table, modify tables, and apply table styles.
To format information as a table:
1. Select the cells you want to format as a table. In this example, an invoice, we'll format the cells containing the column headers and order details.
2. Click the Format as Table command in the Styles group on the Home tab.

3. A list of predefined table styles will appear. Click a table style to select it.
4. A dialog box will appear, confirming the range of cells you have selected for your table. The cells will appear selected in the spreadsheet, and the range will appear in the dialog box.
5. If necessary, change the range by selecting a new range of cells directly on your spreadsheet.
6. If your table has headers, check the box next to My table has headers.

7. Click OK. The data will be formatted as a table in the style you chose.
Tables include filtering by default. You can filter your data at any time using the drop-
down arrows in the header..
To convert a table back into normal cells, click the Convert to Range command in
the Tools group. The filters and Design tab will then disappear, but the cells will retain
their data and formatting.
Modifying tables
To add rows or columns:
1. Select any cell in your table. The Design tab will appear on the Ribbon.
2. From the Design tab, click the Resize Table command.

3. Directly on your spreadsheet, select the new range of cells you want your table to cover. You must select your original table cells as well.
4. Click OK. The new rows and/or columns will be added to your table.
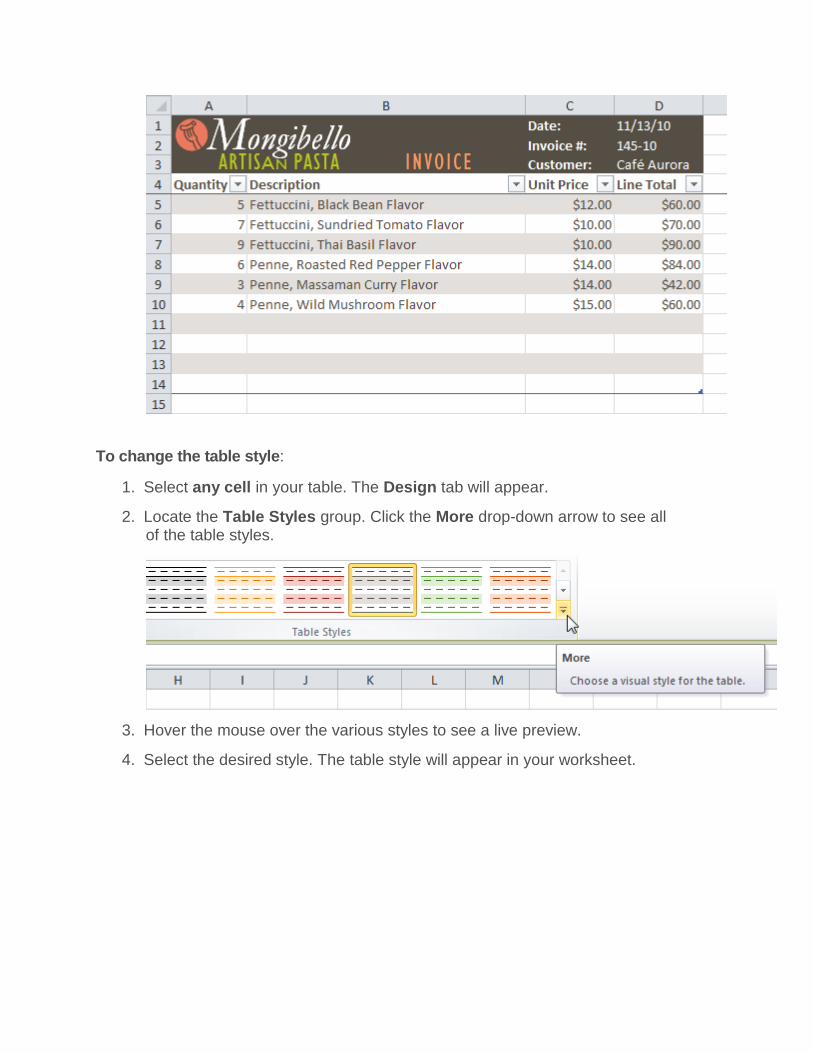
To change the table style:
1. Select any cell in your table. The Design tab will appear.
2. Locate the Table Styles group. Click the More drop-down arrow to see all of the table styles.
3. Hover the mouse over the various styles to see a live preview.
4. Select the desired style. The table style will appear in your worksheet.

To change table style options:
When using an Excel table, you can turn various options on or off to change its
appearance. There are six options: Header Row, Total Row, Banded Rows, First
Column, Last Column, and Banded Columns.
1. Select any cell in your table. The Design tab will appear.
2. From the Design tab, check or uncheck the desired options in the Table Style Options group.

Reviewing and Sharing Workbooks
Introduction
Let's say someone asked you to proofread a worksheet. If you had a hard copy, you
might use a red pen to cross out cell data, mark misspellings, or add comments in the
margins. However, you could also do all of these things in Excel using the Track
Changes and Comments features.
When you've finished reviewing the worksheet, the other person can choose to
automatically accept all of your changes, or decide whether to accept or reject each
change one by one. In this lesson, you'll learn how to track changes, add comments,
and compare two versions of a worksheet. You'll also learn how to prepare
a final version for sharing, including how to check spelling.
About Track Changes
When you turn on the Track Changes option, every change you make to the worksheet
will be highlighted with a unique border and indicator. Hovering your mouse over a
highlighted cell will display the details of the change. This allows the other person to see
what changes have been made before making them permanent.
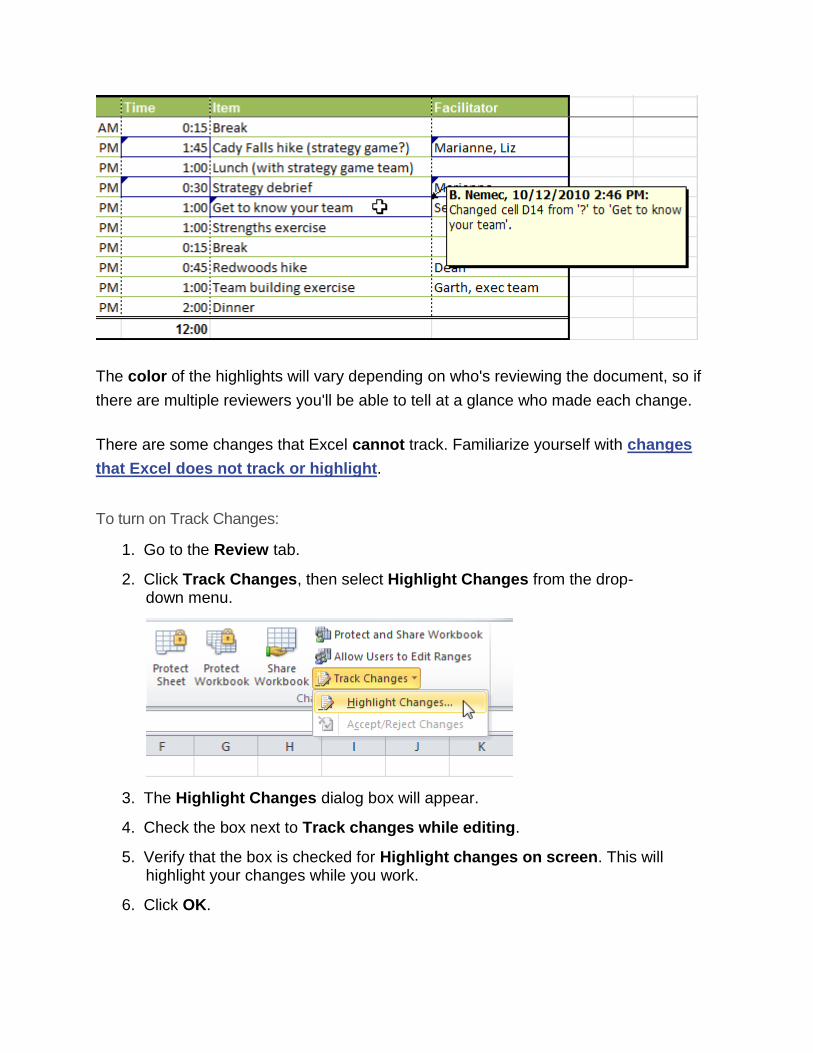
The color of the highlights will vary depending on who's reviewing the document, so if
there are multiple reviewers you'll be able to tell at a glance who made each change.
There are some changes that Excel cannot track. Familiarize yourself with changes
that Excel does not track or highlight.
To turn on Track Changes:
1. Go to the Review tab.
2. Click Track Changes, then select Highlight Changes from the drop-down menu.
3. The Highlight Changes dialog box will appear.
4. Check the box next to Track changes while editing.
5. Verify that the box is checked for Highlight changes on screen. This will highlight your changes while you work.
6. Click OK.
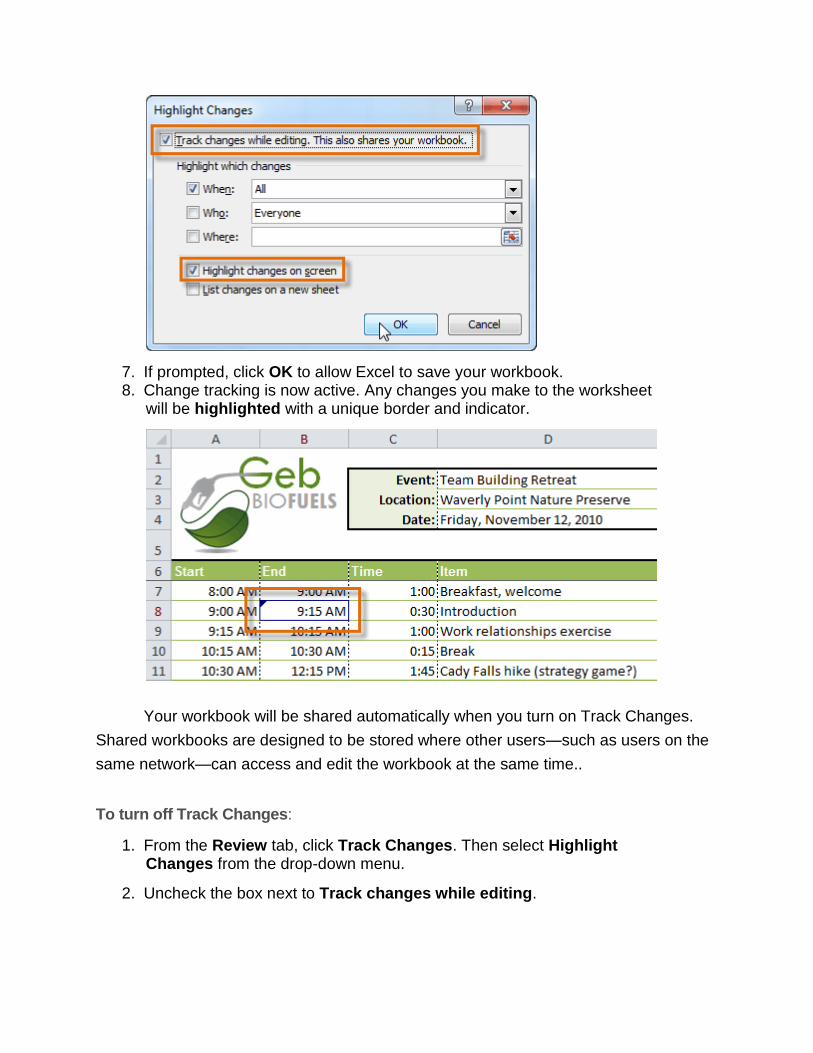
7. If prompted, click OK to allow Excel to save your workbook. 8. Change tracking is now active. Any changes you make to the worksheet
will be highlighted with a unique border and indicator.
Your workbook will be shared automatically when you turn on Track Changes.
Shared workbooks are designed to be stored where other users—such as users on the
same network—can access and edit the workbook at the same time..
To turn off Track Changes:
1. From the Review tab, click Track Changes. Then select Highlight Changes from the drop-down menu.
2. Uncheck the box next to Track changes while editing.

3. Click Yes to confirm that you want to turn off Track Changes and stop sharing your workbook.
Turning off Track Changes will delete any tracking that has taken place in your
workbook. You will not be able to view, accept, or reject changes; instead, they will be
applied to your workbook automatically. Always review the changes in your worksheet
before turning off Track Changes.
Adding and deleting comments
Sometimes you may want to add a comment to a worksheet to provide feedback for the
author instead of changing the contents. Comments are highlighted by a unique
indicator and can be read by the original author or by any other reviewers.
To add a comment:
1. Select the cell where you want the comment to appear.

2. From the Review tab, click the New Comment command.
3. Type your comment.
4. The red indicator in the upper-right corner shows that there is a comment in that cell.
5. Hover your mouse over the cell to view the comment.

To edit a comment:
1. Select the cell containing the comment you want to edit.
2. From the Review tab, click the Edit Comment command (where the New Comment command used to be).
3. Edit your comment.
To delete a comment:
1. Select the cell containing the comment you want to delete.
2. From the Review tab, click the Delete command.

3. The comment will be deleted.
Finalizing and protecting your workbook
Before you send your workbook, take a minute to prepare a final copy. Excel has
tools that might save you from sharing a workbook that contains spelling errors or
information about the workbook itself that you do not want recipients to see. Use
the Spelling command to find and edit any misspelled words; use the Document
Inspector to find and delete any hidden data or personal information that is stored in
the workbook, such as hidden comments, invisible objects, and file paths; and consider
your Protect Workbook options, which are designed to keep other users from making
unwanted changes to your workbook.
To check spelling:
1. Select the cells you want to check.
2. Click the Spelling command on the Review tab.

3. The Spelling dialog box will open. From the Spelling dialog box, you can review and edit any misspelled words.
You can also check the spelling of every cell in an active worksheet by selecting any
empty cell in the worksheet and clicking the Spelling command.
Ignoring spelling "errors"
There are times when Excel will say something is an error when it is not. This often
happens with people's names, which may not be in the dictionary. Even if Excel says
something is an error, you can choose not to change it. There are three options you can
choose from:
Ignore Once: This will skip the word without changing it.
Ignore All: This will skip the word without changing it, and it will also skip all other instances of this word in the worksheet.
Add to Dictionary: This adds the word to the dictionary so it will never come up again as an error. Make sure the word is spelled correctly before choosing this option.
Protecting your workbook
By default, anyone with access to your workbook will be able to open, copy, and
change any part of it unless you protect it. There are many ways you can protect your
workbook, depending on your needs. For example, you can mark your workbook as
final, set it up with a password, put restrictions on who can make changes, or make it so
only certain cells or features of the workbook are changeable.
To protect your workbook:
1. Click the File tab to access Backstage view.
2. From the Info pane, click the Protect Workbook command.
3. Choose the option that best suits your needs. In this example, we'll select Mark as Final. Marking your workbook as final is a way to discourage others from making changes to the workbook. It will alert whoever opens it that typing, editing, and proofreading commands are unavailable.

4. Click OK.
5. Another dialog box will appear. Click OK to confirm.

WORKING WITH CHARTS
Introduction
A chart is a tool you can use in Excel to communicate data graphically. Charts
allow your audience to see the meaning behind the numbers, and they make
showing comparisons and trends much easier. In this lesson, you'll learn how
to insert charts and modify them so they communicate information effectively.
Charts
Excel workbooks can contain a lot of data, and this data can often be difficult to
interpret. For example, where are the highest and lowest values? Are the numbers
increasing or decreasing?
The answers to questions like these can become much clearer when data is
represented as a chart. Excel has various types of charts, so you can choose one that
most effectively represents your data.
Types of charts
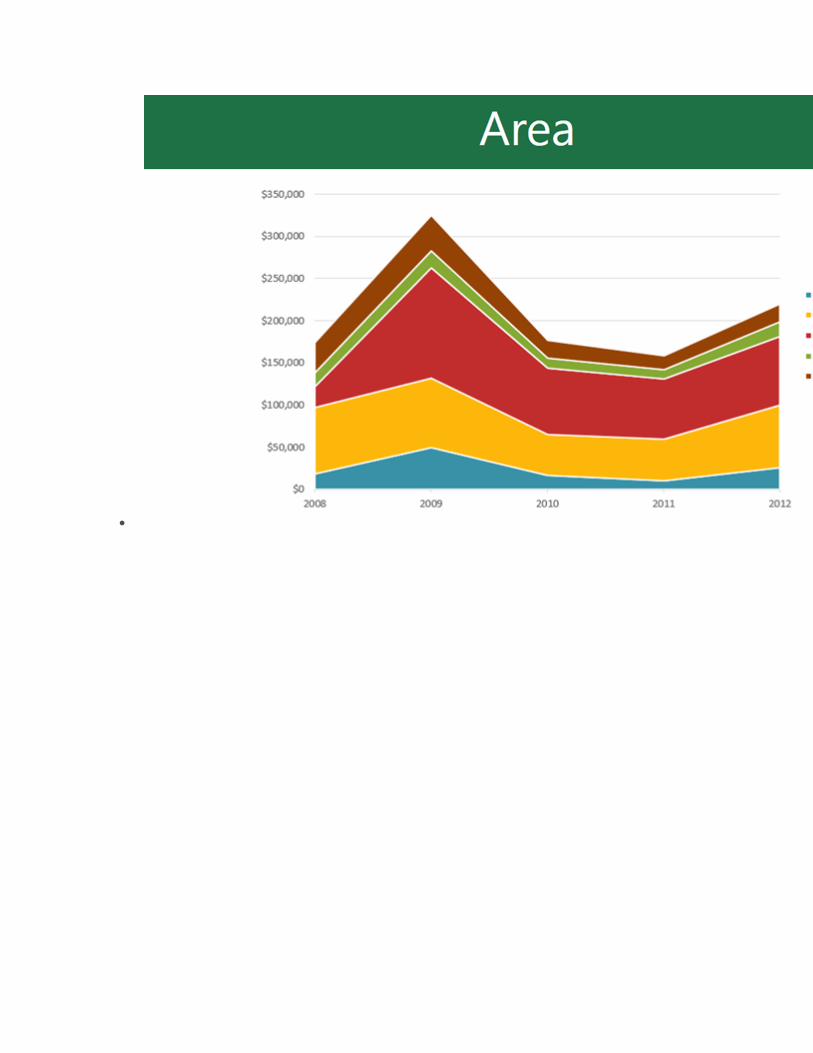
Click the arrows in the slideshow below to view examples of some of the types of charts
available in Excel.

Excel has a variety of chart types, each with its own advantages. Click the arrows
to see some of the different types of charts available in Excel.


1 2 3 4 5 6 7 8
Identifying the parts of a chart
Click the buttons in the interactive below to learn about the different parts of a chart.

To create a chart:
1. Select the cells you want to chart, including the column titles and row labels. These cells will be the source data for the chart.
2. Click the Insert tab.
3. In the Charts group, select the desired chart category (Column, for example).

4. Select the desired chart type from the drop-down menu (Clustered Column, for example).
5. The chart will appear in the worksheet.

Chart tools
Once you insert a chart, a set of chart tools arranged into three tabs will appear on the
Ribbon. These are only visible when the chart is selected. You can use these three tabs
to modify your chart.
To change chart type:
1. From the Design tab, click the Change Chart Type command. A dialog box appears.

2. Select the desired chart type, then click OK.
To switch row and column data:
Sometimes when you create a chart, the data may not be grouped the way you want. In
the clustered column chart below, the Book Sales statistics are grouped by Fiction
and Non-Fiction, with a column for each year. However, you can also switch the row
and column data so the chart will group the statistics by year, with columns for Fiction
and Non-Fiction. In both cases, the chart contains the same data—it's just organized
differently.

1. Select the chart.
2. From the Design tab, select the Switch Row/Column command.
3. The chart will readjust.
To change chart layout:
1. Select the Design tab.

2. Click the More drop-down arrow in the Chart Layouts group to see all of the available layouts.
3. Select the desired layout.
4. The chart will update to reflect the new layout.
Some layouts include chart titles, axes, or legend labels. To change them, place
the insertion point in the text and begin typing.
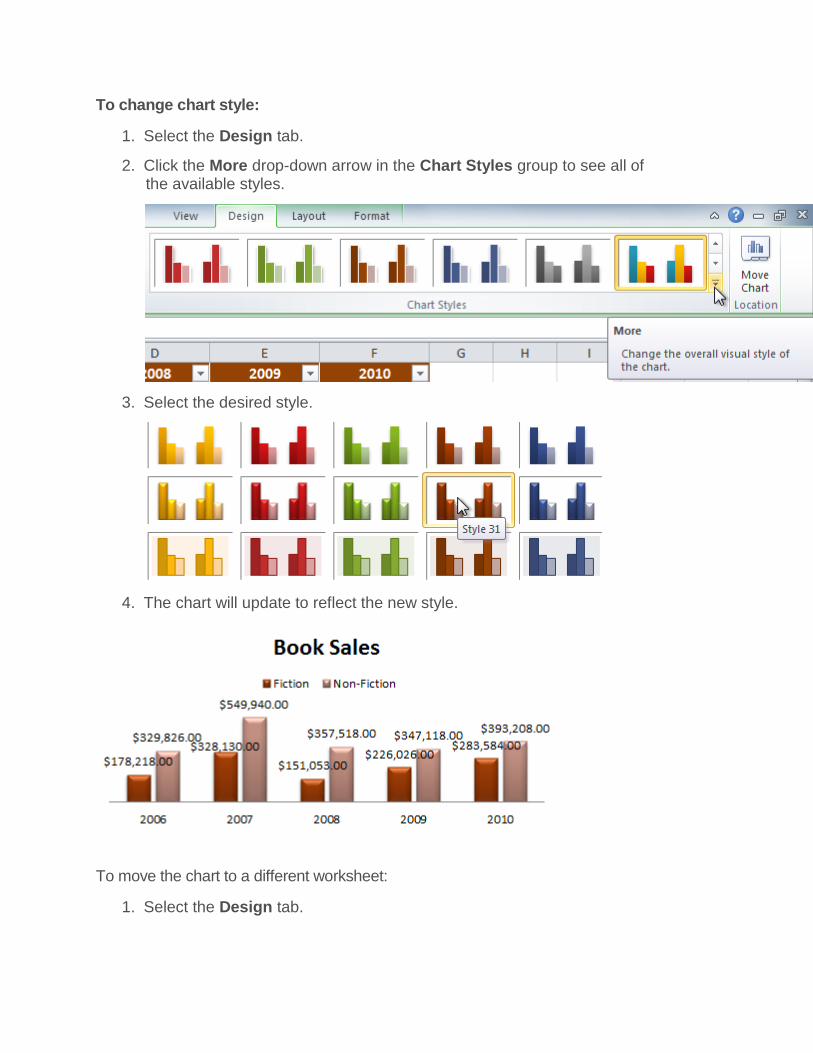
To change chart style:
1. Select the Design tab.
2. Click the More drop-down arrow in the Chart Styles group to see all of the available styles.
3. Select the desired style.
4. The chart will update to reflect the new style.
To move the chart to a different worksheet:
1. Select the Design tab.
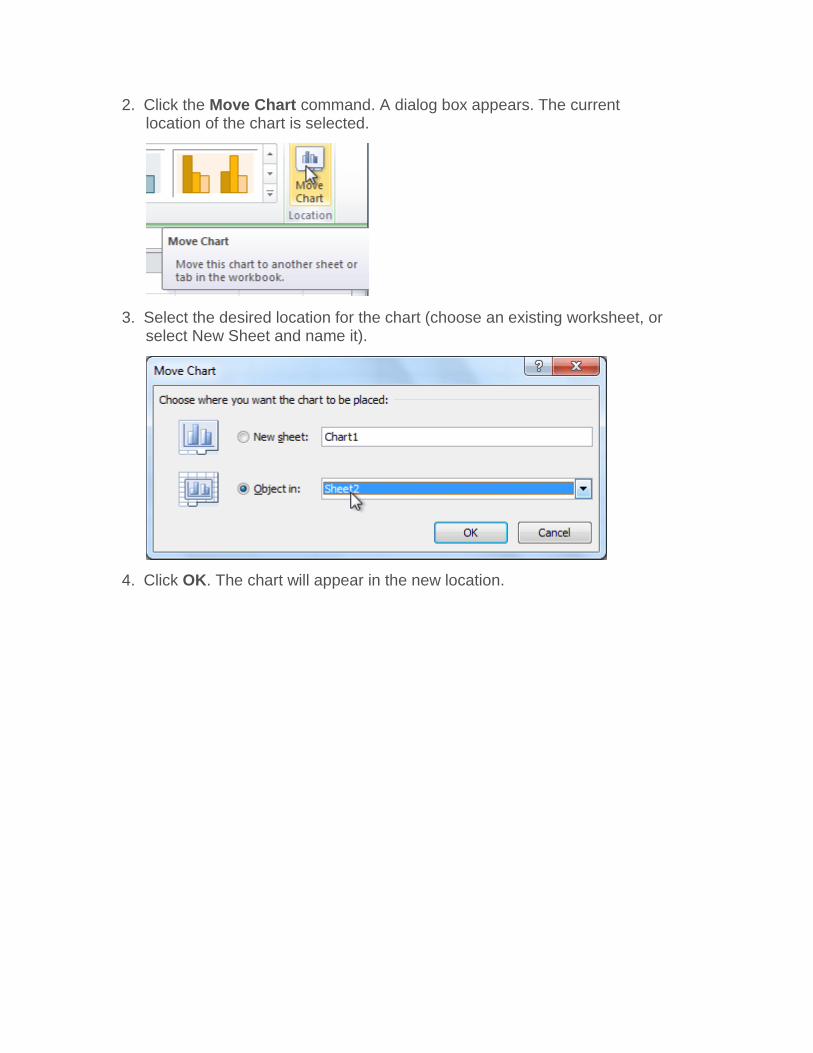
2. Click the Move Chart command. A dialog box appears. The current location of the chart is selected.
3. Select the desired location for the chart (choose an existing worksheet, or select New Sheet and name it).
4. Click OK. The chart will appear in the new location.

o HTML stands for HyperText Markup Language.
o HTML is used to create web pages and web applications.
o HTML is widely used language on the web.
o We can create a static website by HTML only.
o Technically, HTML is a Markup language rather than a programming language.
HTML Example
.
1. <!DOCTYPE>
2. <html>
3. <head>
4. <title>Web page title</title>
5. </head>
6. <body>
7. <h1>Write Your First Heading</h1>
8. <p>Write Your First Paragraph.</p>
9. </body>
10. </html>
HTML Attribute
o HTML attributes are special words which provide additional information about the
elements or attributes are the modifier of the HTML element.
o Each element or tag can have attributes, which defines the behaviour of that
element.
o Attributes should always be applied with start tag.
o The Attribute should always be applied with its name and value pair.
o The Attributes name and values are case sensitive, and it is recommended by
W3C that it should be written in Lowercase only.
o You can add multiple attributes in one HTML element, but need to give space
between two attributes.

Syntax
1. <element attribute_name="value">content</element>
Example
1. <!DOCTYPE html>
2. <html>
3. <head>
4. </head>
5. <body>
6. <h1> This is Style attribute</h1>
7. <p style="height: 50px; color: blue">It will add style property in element</p>
8. <p style="color: red">It will change the color of content</p>
9. </body>
10. </html>
Output:
Explanation of above example:
1. <p style="height: 50px; color: blue">It will add style property in element</p>

In the above statement, we have used paragraph tags in which we have applied style attribute. This attribute is used for applying CSS property on any HTML element. It provides height to paragraph element of 50px and turns it colour to blue.
1. <p style="color: red">It will change the color of content</p>
In the above statement we have again used style attribute in paragraph tag, which turns its colour red.
TITLE ATTRIBUTE
The title attribute is used as text tooltip in most of the browsers. It display its text when user move the cursor over a link or any text. You can use it with any text or link to show the description about that link or text. In our example, we are taking this with paragraph tag and heading tag.
Example
With <h1> tag:
1. <h1 title="This is heading tag">Example of title attribute</h1>
With <p> tag:
1. <p title="This is paragraph tag">Move the cursor over the heading and paragraph, and y
ou will see a description as a tooltip</p>
Code:
1. <!DOCTYPE html>
2. <html>
3. <head>
4. </head>
5. <body>
6.
7. <h1 title="This is heading tag">Example of title attribute</h1>
8. <p title="This is paragraph tag">Move the cursor over the heading and paragraph, and
you will see a description as a tooltip</p>
9.
10. </body>
11. </html>

Output:
The href attribute
Description: The href attribute is the main attribute of <a> anchor tag. This attribute gives the link address which is specified in that link. The href attribute provides the hyperlink, and if it is blank, then it will remain in same page.
Example
With link address:
1. <a href="https://www.javatpoint.com/html-anchor">This is a link</a>
Without link address:
1. <a href="">This is a link</a>

The src Attribute
The src attribute is one of the important and required attribute of <img> element. It is source for the image which is required to display on browser. This attribute can contain image in same directory or another directory. The image name or source should be correct else browser will not display the image.
Example
1. <img src="whitepeacock.jpg" height="400" width="600">
Output:


HTML ELEMENTS
An HTML file is made of elements. These elements are responsible for creating web pages and define content in that webpage. An element in
HTML usually consist of a start tag <tag name>, close tag </tag name> and content inserted between them. Technically, an element is a
collection of start tag, attributes, end tag, content between them.
Such as:
1. <p> Hello world!!! </p>
Example
1. <!DOCTYPE html>
2. <html>
3. <head>
4. <title>WebPage</title>
5. </head>
6. <body>
7. <h1>This is my first web page</h1>
8. <h2> How it looks?</h2>
9. <p>It looks Nice!!!!!</p>
10. </body>
11. </html>

Test it Now
o All the content written between body elements are visible on web page.
Void element: All the elements in HTML do not require to have start tag and end tag, some elements does not have content and end tag such
elements are known as Void elements or empty elements. These elements are also called as unpaired tag.
Some Void elements are <br> (represents a line break) , <hr>(represents a horizontal line), etc.
Nested HTML Elements: HTML can be nested, which means an element can contain another element.
Block-level and Inline HTML elements
For the default display and styling purpose in HTML, all the elements are divided into two categories:
o Block-level element
o Inline element
Block-level element:

o These are the elements, which structure main part of web page, by dividing a page into coherent blocks.
o A block-level element always start with new line and takes the full width of web page, from left to right.
o These elements can contain block-level as well as inline elements.
Following are the block-level elements in HTML.
<address>, <article>, <aside>, <blockquote>, <canvas>, <dd>, <div>, <dl>, <dt>, <fieldset>, <figcaption>, <figure>, <footer>, <form>, <h1>-
<h6>, <header>, <hr>, <li>, <main>, <nav>, <noscript>, <ol>, <output>, <p>, <pre>, <section>, <table>, <tfoot>, <ul> and <video>.
Note: All these elements are described in later chapters.
Example:
1. <!DOCTYPE html>
2. <html>
3. <head>
4. </head>
5. <body>
6. <div style="background-color: lightblue">This is first div</div>
7. <div style="background-color: lightgreen">This is second div</div>
8. <p style="background-color: pink">This is a block level element</p>
9. </body>
10. </html>
Test it Now
Output:

In the above example we have used
tag, which defines a section in a web page, and takes full width of page.
We have used style attribute which is used to styling the HTML content, and the background color are showing that it's a block level element.
Inline elements:
o Inline elements are those elements, which differentiate the part of a given text and provide it a particular function.
o These elements does not start with new line and take width as per requirement.
o The Inline elements are mostly used with other elements.
<a>, <abbr>, <acronym>, <b>, <bdo>, <big>, <br>, <button>, <cite>, <code>, <dfn>, <em>, <i>, <img>, <input>, <kbd>, <label>, <map>,
<object>, <q>, <samp>, <script>, <select>, <small>, <span>, <strong>, <sub>, <sup>, <textarea>, <time>, <tt>, <var>.
Example:
1. <!DOCTYPE html>
2. <html>
3. <head>
4. </head>
5. <body>
6. <a href="https://www.javatpoint.com/html-tutorial">Click on link</a>
7. <span style="background-color: lightblue">this is inline element</span>
8. <p>This will take width of text only</p>
9. </body>
10. </html>
Output:

HTML FORMATTING
HTML Formatting is a process of formatting text for better look and feel. HTML provides us ability to format text without using CSS. There are many formatting tags in HTML. These tags are used to make text bold, italicized, or underlined. There are almost 14 options available that how text appears in HTML and XHTML.
In HTML the formatting tags are divided into two categories:
o Physical tag: These tags are used to provide the visual appearance to the text.
Following is the list of the some main elements used in HTML:
Start tag Content End tag Description
<h1> ...... <h6> These are headings of HTML </h1>??..</h6> These elements are used to provide the headings of page.
<p> This is the paragraph </p> This element is used to display a content in form of paragraph.
<div> This is div section </div> This element is used to provide a section in web page.
<br>
This element is used to provide a line break. ( void element)
<hr>
This element is used to provide a horizontal line. (void element)
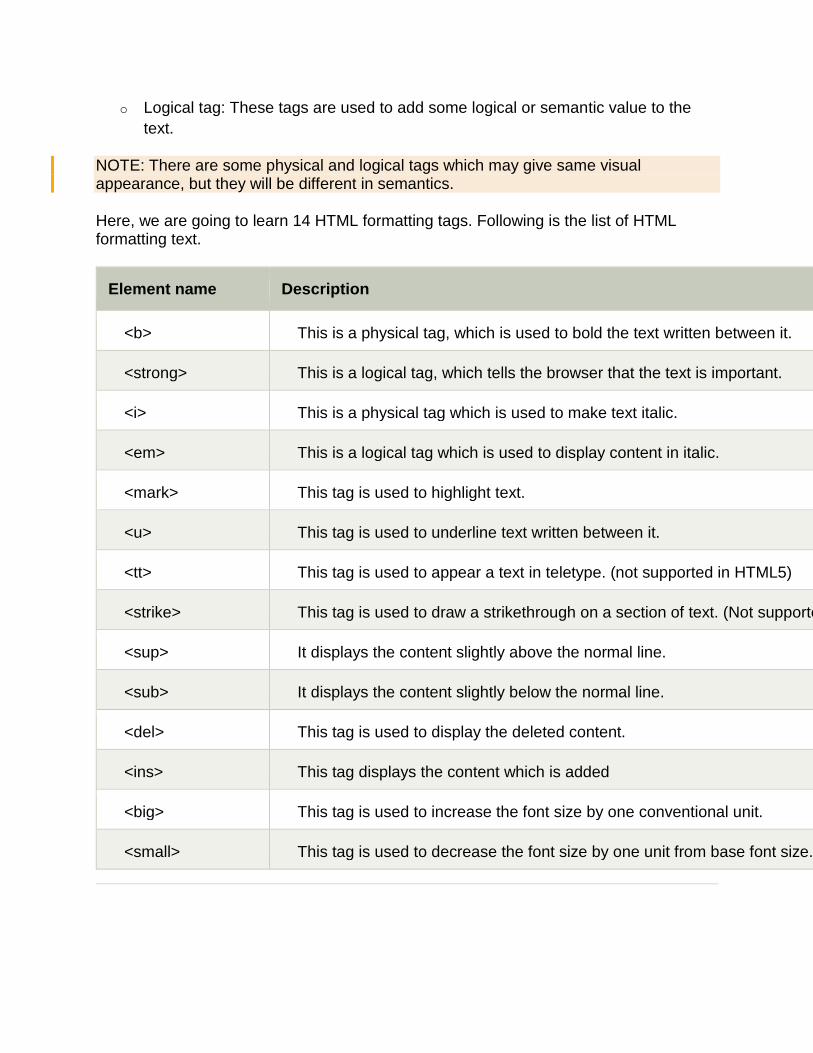
o Logical tag: These tags are used to add some logical or semantic value to the
text.
NOTE: There are some physical and logical tags which may give same visual appearance, but they will be different in semantics.
Here, we are going to learn 14 HTML formatting tags. Following is the list of HTML formatting text.
Element name Description
<b> This is a physical tag, which is used to bold the text written between it.
<strong> This is a logical tag, which tells the browser that the text is important.
<i> This is a physical tag which is used to make text italic.
<em> This is a logical tag which is used to display content in italic.
<mark> This tag is used to highlight text.
<u> This tag is used to underline text written between it.
<tt> This tag is used to appear a text in teletype. (not supported in HTML5)
<strike> This tag is used to draw a strikethrough on a section of text. (Not supported in HTML5)
<sup> It displays the content slightly above the normal line.
<sub> It displays the content slightly below the normal line.
<del> This tag is used to display the deleted content.
<ins> This tag displays the content which is added
<big> This tag is used to increase the font size by one conventional unit.
<small> This tag is used to decrease the font size by one unit from base font size.

Bold Text
HTML<b> and <strong> formatting elements
The HTML <b> element is a physical tag which display text in bold font, without any logical importance. If you write anything within <b>............</b> element, is shown in bold letters.
See this example:
1. <p> <b>Write Your First Paragraph in bold text.</b></p>
Output:
Write Your First Paragraph in bold text.
The HTML <strong> tag is a logical tag, which displays the content in bold font and informs the browser about its logical importance. If you write anything between <strong>???????. </strong>, is shown important text.
See this example:
1. <p><strong>This is an important content</strong>, and this is normal content</p>
Output:
This is an important content, and this is normal content
Example
1. <!DOCTYPE html>
2. <html>
3. <head>
4. <title>formatting elements</title>
5. </head>
6. <body>
7. <h1>Explanation of formatting element</h1>
8. <p><strong>This is an important content</strong>, and this is normal content</p>
9. </body>
10. </html>

Italic Text
HTML <i> and <em> formatting elements
The HTML <i> element is physical element, which display the enclosed content in italic font, without any added importance. If you write anything within <i>............</i> element, is shown in italic letters.
See this example:
1. <p> <i>Write Your First Paragraph in italic text.</i></p>
Output:
Write Your First Paragraph in italic text.
The HTML <em> tag is a logical element, which will display the enclosed content in italic font, with added semantics importance.
See this example:
1. <p><em>This is an important content</em>, which displayed in italic font.</p>
Output:
This is an important content, which displayed in italic font.
1. <!DOCTYPE html>
2. <html>
3. <head>
4. <title>formatting elements</title>
5. </head>
6. <body>
7. <h1>Explanation of italic formatting element</h1>
8. <p><em>This is an important content</em>, which displayed in italic font.</p>
9. </body>
10. </html>

HTML Marked formatting
If you want to mark or highlight a text, you should write the content within <mark>.........</mark>.
See this example:
1. <h2> I want to put a <mark> Mark</mark> on your face</h2>
Output:
I want to put a Mark on your face
Underlined Text
If you write anything within <u>.........</u> element, is shown in underlined text.
See this example:
1. <p> <u>Write Your First Paragraph in underlined text.</u></p>
Output:
Write Your First Paragraph in underlined text.
Strike Text
Anything written within <strike>.......................</strike> element is displayed with strikethrough. It is a thin line which cross the statement.
See this example:
1. <p> <strike>Write Your First Paragraph with strikethrough</strike>.</p>
Output:
Write Your First Paragraph with strikethrough.

Monospaced Font
If you want that each letter has the same width then you should write the content within <tt>.............</tt> element.
Note: We know that most of the fonts are known as variable-width fonts because different letters have different width. (for example: 'w' is wider than 'i'). Monospaced Font provides similar space among every letter.
See this example:
1. <p>Hello <tt>Write Your First Paragraph in monospaced font.</tt></p>
Output:
Hello Write Your First Paragraph in monospaced font.
Superscript Text
If you put the content within <sup>..............</sup> element, is shown in superscript; means it is displayed half a character's height above the other characters.
See this example:
1. <p>Hello <sup>Write Your First Paragraph in superscript.</sup></p>
Output:
Hello Write Your First Paragraph in superscript.
Subscript Text
If you put the content within <sub>..............</sub> element, is shown in subscript ; means it is displayed half a character's height below the other characters.
See this example:
1. <p>Hello <sub>Write Your First Paragraph in subscript.</sub></p>
Output:

Hello Write Your First Paragraph in subscript.
Deleted Text
Anything that puts within <del>..........</del> is displayed as deleted text.
See this example
1. <p>Hello <del>Delete your first paragraph.</del></p>
Output:
Hello
Inserted Text
Anything that puts within <ins>..........</ins> is displayed as inserted text.
See this example:
1. <p> <del>Delete your first paragraph.</del><ins>Write another paragraph.</ins></p>
Output:
Delete your first paragraph.Write another paragraph.
Larger Text
If you want to put your font size larger than the rest of the text then put the content within <big>.........</big>. It increase one font size larger than the previous one.
See this example:
1. <p>Hello <big>Write the paragraph in larger font.</big></p>
Output:
Hello Write the paragraph in larger font.
Smaller Text
If you want to put your font size smaller than the rest of the text then put the content within <small>.........</small>tag. It reduces one font size than the previous one.
See this example:
1. <p>Hello <small>Write the paragraph in smaller font.</small></p>
HTML HEADING
A HTML heading or HTML h tag can be defined as a title or a subtitle which you want to display on the webpage. When you place the text within the heading tags <h1>.........</h1>, it is displayed on the browser in the bold format and size of the text depends on the number of heading.
There are six different HTML headings which are defined with the <h1> to <h6> tags, from highest level h1 (main heading) to the least level h6 (least important heading).
h1 is the largest heading tag and h6 is the smallest one. So h1 is used for most important heading and h6 is used for least important.
Headings in HTML helps the search engine to understand and index the structure of web page.
Note: The main keyword of the whole content of a webpage should be display by h1 heading tag.
See this example:
1. <h1>Heading no. 1</h1>
2. <h2>Heading no. 2</h2>
3. <h3>Heading no. 3</h3>
4. <h4>Heading no. 4</h4>
5. <h5>Heading no. 5</h5>
6. <h6>Heading no. 6</h6>
Output:
Heading no. 1

Heading no. 2
Heading no. 3
Heading no. 4
Heading no. 5
Heading no. 6
Heading elements (h1....h6) should be used for headings only. They should not be used just to make text bold or big.
o HTML headings can also be used with nested elements. Following are
different codes to display the way to use heading elements.
Example:
1. <!DOCTYPE html>
2. <html>
3. <head>
4. <title>Heading elements</title>
5. </head>
6. <body>
7. <h1>This is main heading of page. </h1>
8. <p>h1 is the most important heading, which is used to display the keyword of page
</p>
9. <h2>This is first sub-heading</h2>
10. <p>h2 describes the first sub heading of page. </p>
11. <h3>This is Second sub-heading</h3>
12. <p>h3 describes the second sub heading of page.</p>
13. <p>We can use h1 to h6 tag to use the different sub-
heading with their paragraphs if
14. required.
15. </p>
16. </body>
17. </html>
18. Output:
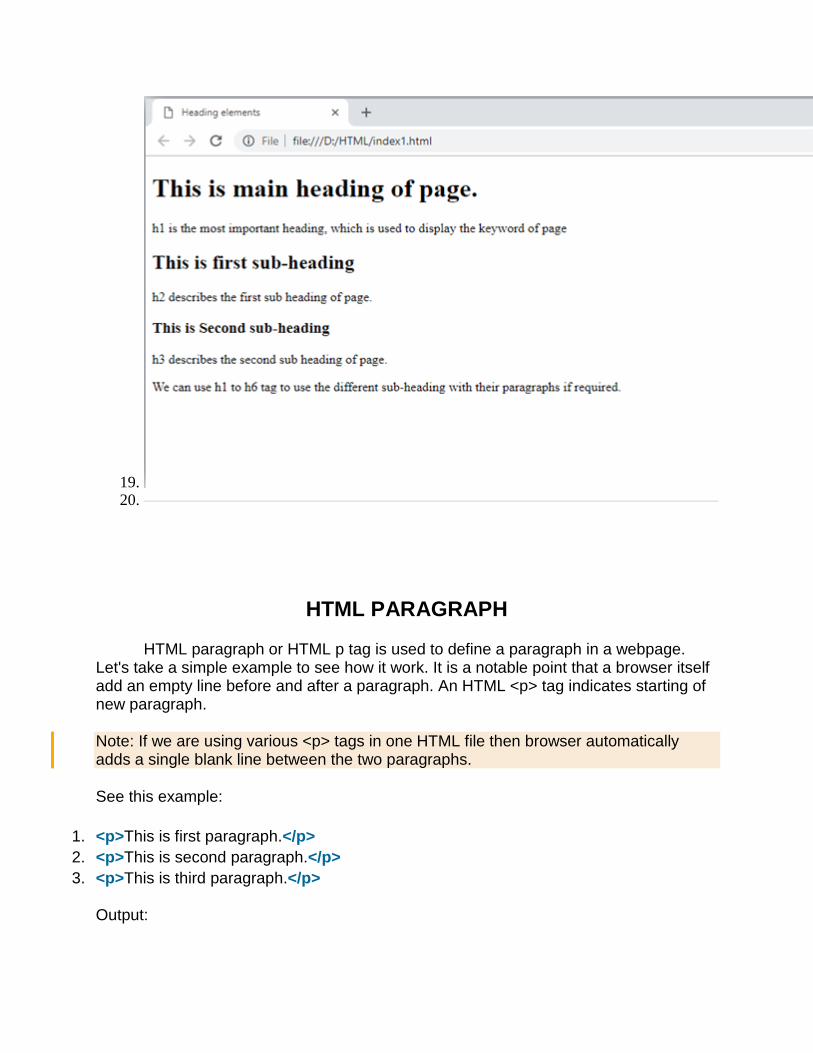
19. 20.
HTML PARAGRAPH
HTML paragraph or HTML p tag is used to define a paragraph in a webpage. Let's take a simple example to see how it work. It is a notable point that a browser itself add an empty line before and after a paragraph. An HTML <p> tag indicates starting of new paragraph.
Note: If we are using various <p> tags in one HTML file then browser automatically adds a single blank line between the two paragraphs.
See this example:
1. <p>This is first paragraph.</p>
2. <p>This is second paragraph.</p>
3. <p>This is third paragraph.</p>
Output:

This is first paragraph.
This is second paragraph.
This is third paragraph.
Space inside HTML Paragraph
If you put a lot of spaces inside the HTML p tag, browser removes extra spaces and extra line while displaying the page. The browser counts number of spaces and lines as a single one.
1. <p>
2. I am
3. going to provide
4. you a tutorial on HTML
5. and hope that it will
6. be very beneficial for you.
7. </p>
8. <p>
9. Look, I put here a lot
10. of spaces but I know, Browser will ignore it.
11. </p>
12. <p>
13. You cannot determine the display of HTML</p>
14. <p>because resized windows may create different result.
15. </p>
Output:
I am going to provide you a tutorial on HTML and hope that it will be very beneficial for you.
Look, I put here a lot of spaces but I know, Browser will ignore it.
You cannot determine the display of HTML
because resized windows may create different result.
As you can see, all the extra lines and unnecessary spaces are removed by the browser.

Use <br> and <hr> tag with paragraph
An HTML <br> tag is used for line break and it can be used with paragraph elements. Following is the example to show how to use <br> with <p> element.
Example:
1. <!DOCTYPE html>
2. <html>
3. <head>
4. </head>
5. <body>
6. <h2> Use of line break with pragraph tag</h2>
7. <p><br>Papa and mama, and baby and Dot,
8. <br>Willie and me?the whole of the lot
9. <br>Of us all went over in Bimberlie's sleigh,
10. <br>To grandmama's house on Christmas day.
11. </p>
12. </body>
13. </html>
Output:

HORIZONTAL LINE TAG
An HTML <hr> tag is used to apply a horizontal line between two statements or two paragraphs. Following is the example which is showing use of <hr> tag with paragraph.
Example:
1. <!DOCTYPE html>
2. <html>
3. <head>
4. </head>
5. <body>
6. <h2> Example to show a horizontal line with paragraphs</h2>
7. <p> An HTML hr tag draw a horizontal line and separate two paragraphs with that lin
e.<hr> it will start a new paragraph.
8. </p>
9. </body>
10. </html>
Output:

HTML ANCHOR
The HTML anchor tag defines a hyperlink that links one page to another page. It
can create hyperlink to other web page as well as files, location, or any URL. The
"href" attribute is the most important attribute of the HTML a tag. and which links to
destination page or URL.
href attribute of HTML anchor tag
The href attribute is used to define the address of the file to be linked. In other words,
it points out the destination page.
The syntax of HTML anchor tag is given below.
<a href = "..........."> Link Text </a>
Let's see an example of HTML anchor tag.
1. <a href="second.html">Click for Second Page</a>
Specify a location for Link using target attribute
If we want to open that link to another page then we can use target attribute of <a>
tag. With the help of this link will be open in next page.
Example:
1. <!DOCTYPE html>
2. <html>
3. <head>
4. <title></title>
5. </head>
6. <body>
7. <p>Click on <a href="https://www.javatpoint.com/" target="_blank"> this-
link </a>to go on home page of JavaTpoint.</p>
8. </body>
9. </html>
Output:

Appearance of HTML anchor tag
An unvisited link is displayed underlined and blue.
A visited link displayed underlined and purple.
An active link is underlined and red.
Attributes of HTML img tag
The src and alt are important attributes of HTML img tag. All attributes of HTML image tag are given below.
1) src
It is a necessary attribute that describes the source or path of the image. It instructs the browser where to look for the image on the server.
The location of image may be on the same directory or another server.
2) alt

The alt attribute defines an alternate text for the image, if it can't be displayed. The value of the alt attribute describe the image in words. The alt attribute is considered good for SEO prospective.
3) width
It is an optional attribute which is used to specify the width to display the image. It is not recommended now. You should apply CSS in place of width attribute.
4) height
It h3 the height of the image. The HTML height attribute also supports iframe, image and object elements. It is not recommended now. You should apply CSS in place of height attribute.
Use of height and width attribute with img tag
You have learnt about how to insert an image in your web page, now if we want to give some height and width to display image according to our requirement, then we can set it with height and width attributes of image.
Example:
1. <img src="animal.jpg" height="180" width="300" alt="animal image">
Output:

HTML TABLE
HTML table tag is used to display data in tabular form (row * column). There can be many columns in a row.
We can create a table to display data in tabular form, using <table> element, with the help of <tr> , <td>, and <th> elements.
In Each table, table row is defined by <tr> tag, table header is defined by <th>, and table data is defined by <td> tags.
HTML tables are used to manage the layout of the page e.g. header section, navigation bar, body content, footer section etc. But it is recommended to use div tag over table to manage the layout of the page .
HTML Table Tags
Tag Description
<table> It defines a table.
<tr> It defines a row in a table.
<th> It defines a header cell in a table.
<td> It defines a cell in a table.
<caption> It defines the table caption.
<colgroup> It specifies a group of one or more columns in a table for formatting.
<col> It is used with <colgroup> element to specify column properties for each column.
<tbody> It is used to group the body content in a table.
<thead> It is used to group the header content in a table.
<tfooter> It is used to group the footer content in a table.
HTML Table Example

Let's see the example of HTML table tag. It output is shown above.
1. <table>
2. <tr><th>First_Name</th><th>Last_Name</th><th>Marks</th></tr>
3. <tr><td>Sonoo</td><td>Jaiswal</td><td>60</td></tr>
4. <tr><td>James</td><td>William</td><td>80</td></tr>
5. <tr><td>Swati</td><td>Sironi</td><td>82</td></tr>
6. <tr><td>Chetna</td><td>Singh</td><td>72</td></tr>
7. </table>
Output:
First_Name Last_Name Marks
Sonoo Jaiswal 60
James William 80
Swati Sironi 82
Chetna Singh 72
In the above html table, there are 5 rows and 3 columns = 5 * 3 = 15 values.
HTML Table with Border
There are two ways to specify border for HTML tables.
1. By border attribute of table in HTML
2. By border property in CSS
1) HTML Border attribute
You can use border attribute of table tag in HTML to specify border. But it is not recommended now.
1. <table border="1">
2. <tr><th>First_Name</th><th>Last_Name</th><th>Marks</th></tr>
3. <tr><td>Sonoo</td><td>Jaiswal</td><td>60</td></tr>
4. <tr><td>James</td><td>William</td><td>80</td></tr>
5. <tr><td>Swati</td><td>Sironi</td><td>82</td></tr>

6. <tr><td>Chetna</td><td>Singh</td><td>72</td></tr>
7. </table>
Test it Now
Output:
First_Name Last_Name Marks
Sonoo Jaiswal 60
James William 80
Swati Sironi 82
Chetna Singh 72
HTML Table width:
We can specify the HTML table width using the CSS width property. It can be specify in pixels or percentage.
We can adjust our table width as per our requirement. Following is the example to display table with width.
1. table{
2. width: 100%;
3. }
Example:
1. <!DOCTYPE html>
2. <html>
3. <head>
4. <title>table</title>
5. <style>
6. table{
7. border-collapse: collapse;
8. width: 100%;
9. }
10. th,td{
11. border: 2px solid green;

12. padding: 15px;
13. }
14.
15. </style>
16. </head>
17. <body>
18. <table>
19. <tr>
20. <th>1 header</th>
21. <th>1 header</th>
22. <th>1 header</th>
23. </tr>
24. <tr>
25. <td>1data</td>
26. <td>1data</td>
27. <td>1data</td>
28. </tr>
29. <tr>
30. <td>2 data</td>
31. <td>2 data</td>
32. <td>2 data</td>
33. </tr>
34. <tr>
35. <td>3 data</td>
36. <td>3 data</td>
37. <td>3 data</td>
38. </tr>
39. </table>
40. </body>
41. </html>

HTML Table with colspan
If you want to make a cell span more than one column, you can use the colspan attribute.
It will divide one cell/row into multiple columns, and the number of columns depend on the value of colspan attribute.
Let's see the example that span two columns.
HTML code:
1. <table style="width:100%">
2. <tr>
3. <th>Name</th>
4. <th colspan="2">Mobile No.</th>
5. </tr>
6. <tr>
7. <td>Ajeet Maurya</td>
8. <td>7503520801</td>

9. <td>9555879135</td>
10. </tr>
11. </table>
Output:
Name Mobile No.
Ajeet Maurya 7503520801 9555879135
HTML Table with rowspan
If you want to make a cell span more than one row, you can use the rowspan attribute.
It will divide a cell into multiple rows. The number of divided rows will depend on rowspan values.
Let's see the example that span two rows.
HTML code:
1. <table>
2. <tr><th>Name</th><td>Ajeet Maurya</td></tr>
3. <tr><th rowspan="2">Mobile No.</th><td>7503520801</td></tr>
4. <tr><td>9555879135</td></tr>
5. </table>
Output:
Name Ajeet Maurya
Mobile No.
7503520801
9555879135
HTML table with caption

HTML caption is diplayed above the table. It must be used after table tag only.
1. <table>
2. <caption>Student Records</caption>
3. <tr><th>First_Name</th><th>Last_Name</th><th>Marks</th></tr>
4. <tr><td>Vimal</td><td>Jaiswal</td><td>70</td></tr>
5. <tr><td>Mike</td><td>Warn</td><td>60</td></tr>
6. <tr><td>Shane</td><td>Warn</td><td>42</td></tr>
7. <tr><td>Jai</td><td>Malhotra</td><td>62</td></tr>
8. </table>
HTML LISTS
HTML Lists are used to specify lists of information. All lists may contain one or more list elements. There are three different types of HTML lists:
1. Ordered List or Numbered List (ol)
2. Unordered List or Bulleted List (ul)
3. Description List or Definition List (dl)
Note: We can create a list inside another list, which will be termed as nested List.

HTML Ordered List or Numbered List
In the ordered HTML lists, all the list items are marked with numbers by default. It is known as numbered list also. The ordered list starts with <ol> tag and the list items start with <li> tag.
1. <ol>
2. <li>Aries</li>
3. <li>Bingo</li>
4. <li>Leo</li>
5. <li>Oracle</li>
6. </ol>
Output:
1. Aries
2. Bingo
3. Leo
4. Oracle
HTML Unordered List or Bulleted List
In HTML Unordered list, all the list items are marked with bullets. It is also known as bulleted list also. The Unordered list starts with <ul> tag and list items start with the <li> tag.
1. <ul>
2. <li>Aries</li>
3. <li>Bingo</li>
4. <li>Leo</li>
5. <li>Oracle</li>
6. </ul>
Output:
o Aries
o Bingo
o Leo
o Oracle
HTML Description List or Definition List
HTML Description list is also a list style which is supported by HTML and XHTML. It is also known as definition list where entries are listed like a dictionary or encyclopedia.
The definition list is very appropriate when you want to present glossary, list of terms or other name-value list.
The HTML definition list contains following three tags:
1. <dl> tag defines the start of the list.
2. <dt> tag defines a term.
3. <dd> tag defines the term definition (description).
1. <dl>
2. <dt>Aries</dt>
3. <dd>-One of the 12 horoscope sign.</dd>
4. <dt>Bingo</dt>
5. <dd>-One of my evening snacks</dd>
6. <dt>Leo</dt>
7. <dd>-It is also an one of the 12 horoscope sign.</dd>
8. <dt>Oracle</dt>
9. <dd>-It is a multinational technology corporation.</dd>
10. </dl>
Output:
Aries -One of the 12 horoscope sign.
Bingo -One of my evening snacks
Leo -It is also an one of the 12 horoscope sign.
Oracle -It is a multinational technology corporation.

HTML Nested List
A list within another list is termed as nested list. If you want a bullet list inside a numbered list then such type of list will called as nested list.
Code:
1. <!DOCTYPE html>
2. <html>
3. <head>
4. <title>Nested list</title>
5. </head>
6. <body>
7. <p>List of Indian States with thier capital</p>
8. <ol>
9. <li>Delhi
10. <ul>
11. <li>NewDelhi</li>
12. </ul>
13. </li>
14. <li>Haryana
15. <ul>
16. <li>Chandigarh</li>
17. </ul>
18. </li>
19. <li>Gujarat
20. <ul>
21. <li>Gandhinagar</li>
22. </ul>
23. </li>
24. <li>Rajasthan
25. <ul>
26. <li>Jaipur</li>
27. </ul>
28. </li>
29. <li>Maharashtra
30. <ul>
31. <li>Mumbai</li>
32. </ul>
33. </li>
34. <li>Uttarpradesh

35. <ul>
36. <li>Lucknow</li></ul>
37. </li>
38. </ol>
39. </body>
40. </html>
Output:
HTML Ordered List | HTML Numbered List
HTML Ordered List or Numbered List displays elements in numbered format. The HTML ol tag is used for ordered list. We can use ordered list to represent items either in numerical order format or alphabetical order format, or any format where an order is emphasized. There can be different types of numbered list:
o Numeric Number (1, 2, 3)
o Capital Roman Number (I II III)
o Small Romal Number (i ii iii)

o Capital Alphabet (A B C)
o Small Alphabet (a b c)
To represent different ordered lists, there are 5 types of attributes in <ol> tag.
Type Description
Type "1" This is the default type. In this type, the list items are numbered with numbers.
Type "I" In this type, the list items are numbered with upper case roman numbers.
Type "i" In this type, the list items are numbered with lower case roman numbers.
Type "A" In this type, the list items are numbered with upper case letters.
Type "a" In this type, the list items are numbered with lower case letters.
HTML Ordered List Example
Let's see the example of HTML ordered list that displays 4 topics in numbered list. Here we are not defining type="1" because it is the default type.
1. <ol>
2. <li>HTML</li>
3. <li>Java</li>
4. <li>JavaScript</li>
5. <li>SQL</li>
6. </ol>
Output:
1. HTML
2. Java
3. JavaScript
4. SQL

ol type="I"
Let's see the example to display list in roman number uppercase.
1. <ol type="I">
2. <li>HTML</li>
3. <li>Java</li>
4. <li>JavaScript</li>
5. <li>SQL</li>
6. </ol>
Output:
I. HTML
II. Java
III. JavaScript
IV. SQL
ol type="i"
Let's see the example to display list in roman number lowercase.
1. <ol type="i">
2. <li>HTML</li>
3. <li>Java</li>
4. <li>JavaScript</li>
5. <li>SQL</li>
6. </ol>
Output:
i. HTML
ii. Java
iii. JavaScript
iv. SQL

ol type="A"
Let's see the example to display list in alphabet uppercase.
1. <ol type="A">
2. <li>HTML</li>
3. <li>Java</li>
4. <li>JavaScript</li>
5. <li>SQL</li>
6. </ol>
Output:
A. HTML
B. Java
C. JavaScript
D. SQL
ol type="a"
Let's see the example to display list in alphabet lowercase.
1. <ol type="a">
2. <li>HTML</li>
3. <li>Java</li>
4. <li>JavaScript</li>
5. <li>SQL</li>
6. </ol>
Output:
a. HTML
b. Java
c. JavaScript
d. SQL
start attribute
The start attribute is used with ol tag to specify from where to start the list items.
<ol type="1" start="5"> : It will show numeric values starting with "5".
<ol type="A" start="5"> : It will show capital alphabets starting with "E".
<ol type="a" start="5"> : It will show lower case alphabets starting with "e".
<ol type="I" start="5"> : It will show Roman upper case value starting with "V".
<ol type="i" start="5"> : It will show Roman lower case value starting with "v".
1. <ol type="i" start="5">
2. <li>HTML</li>
3. <li>Java</li>
4. <li>JavaScript</li>
5. <li>SQL</li>
6. </ol>
Output:
v. HTML
vi. Java
vii. JavaScript
viii. SQL
HTML Unordered List | HTML Bulleted List
HTML Unordered List or Bulleted List displays elements in bulleted format . We can use unordered list where we do not need to display items in any particular order. The HTML ul tag is used for the unordered list. There can be 4 types of bulleted list:
o disc
o circle
o square
o none
To represent different ordered lists, there are 4 types of attributes in <ul> tag.

Type Description
Type "disc" This is the default style. In this style, the list items are marked with bullets.
Type "circle" In this style, the list items are marked with circles.
Type "square" In this style, the list items are marked with squares.
Type "none" In this style, the list items are not marked .
HTML Unordered List Example
1. <ul>
2. <li>HTML</li>
3. <li>Java</li>
4. <li>JavaScript</li>
5. <li>SQL</li>
6. </ul>
Output:
o HTML
o Java
o JavaScript
o SQL
ul type="circle"
1. <ul type="circle">
2. <li>HTML</li>
3. <li>Java</li>
4. <li>JavaScript</li>
5. <li>SQL</li>
6. </ul>
Output:
o HTML

o Java
o JavaScript
o SQL
ul type="square"
1. <ul type="square">
2. <li>HTML</li>
3. <li>Java</li>
4. <li>JavaScript</li>
5. <li>SQL</li>
6. </ul>
Output:
o HTML
o Java
o JavaScript
o SQL
ul type="none"
1. <ul type="none">
2. <li>HTML</li>
3. <li>Java</li>
4. <li>JavaScript</li>
5. <li>SQL</li>
6. </ul>
Output:
o HTML
o Java
o JavaScript
o SQL
o
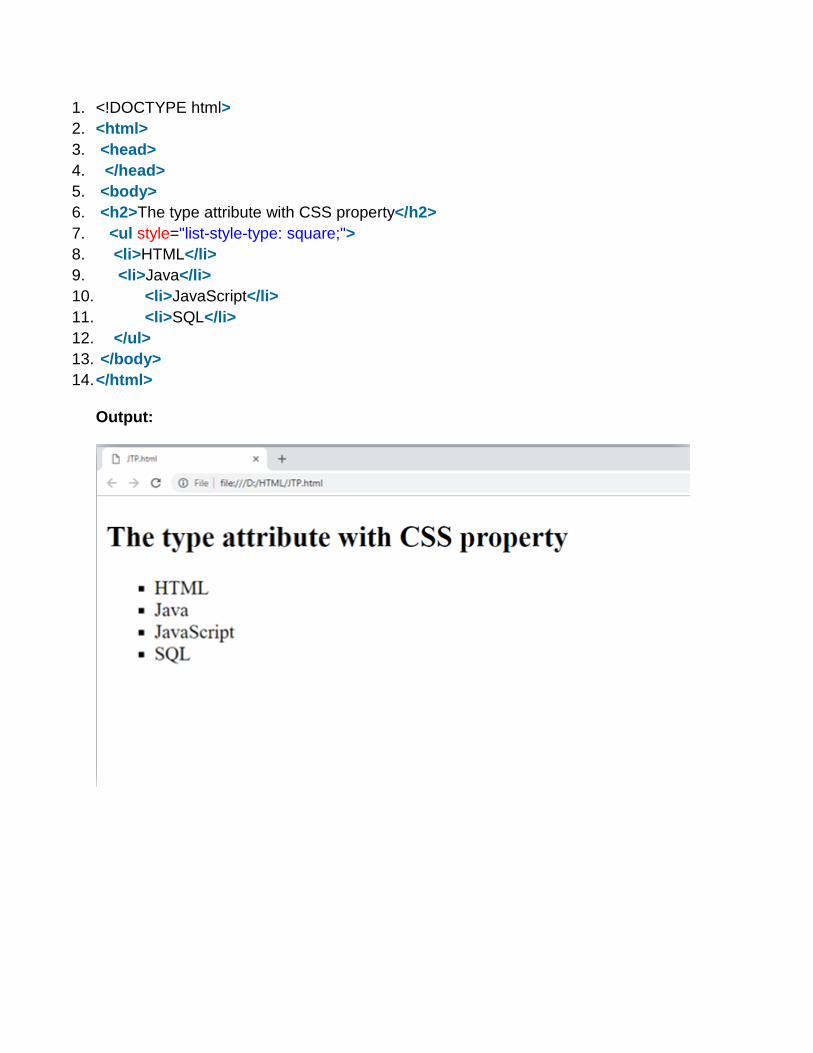
1. <!DOCTYPE html>
2. <html>
3. <head>
4. </head>
5. <body>
6. <h2>The type attribute with CSS property</h2>
7. <ul style="list-style-type: square;">
8. <li>HTML</li>
9. <li>Java</li>
10. <li>JavaScript</li>
11. <li>SQL</li>
12. </ul>
13. </body>
14. </html>
Output:

Tag Description In HTML5?
<!--...--> Describe a comment text in the source code
<!doctype> Defines a document type
<a> Specific a anchor (Hyperlink) Use for link in internal/external web documents.
<abbr> Describes an abbreviation (acronyms)
<acronym> Describes an acronyms REMOVE
<address> Describes an address information
<applet> Embedding an applet in HTML document REMOVE
<area> Defines an area in an image map
<article> Defines an article NEW
<aside> Describes contain set(or write) on aside place in page contain NEW
<audio> Specific audio content NEW
<b> Specific text weight bold
<base> Define a base URL for all the links with in a web page
<basefont> Describes a default font color, size, face in a document REMOVE
<bb> Define browser command, that command invoke as per client action NEW/ REMOVE
<bdo> Specific direction of text display
<big> Defines a big text REMOVE
<blockquote> Specifies a long quotation
<body> Defines a main section(body) part in HTML document
<br /> Specific a single line break
<button> Specifies a press/push button
<canvas> Specifies the display graphics on HTML web documment NEW

<caption> Define a table caption
<center> Specifies a text is display in center align REMOVE
<cite> Specifies a text citation
<code> Specifies computer code text
<col> Specifies a each column within a <colgroup> element in table
<colgroup> Defines a group of one or more columns inside table
<command> Define a command button, invoke as per user action NEW
<datagrid> Define a represent data in datagrid either list wise or tree wise NEW/ REMOVE
<datalist> Define a list of pre-defined options surrounding <input> tag NEW
<dd> Defines a definition description in a definition list
<del> Specific text deleted in web document
<details> Define a additional details hide or show as per user action NEW
<dfn> Define a definition team
<dialog> Define a chat conversation between one or more person NEW/ REMOVE
<dir> Define a directory list REMOVE
<div> Define a division part
<dl> Define a definition list
<dt> Define a definition team
<em> Define a text is emphasize format
<embed> Define a embedding external application using a relative plug-in NEW
<eventsource> Defines a source of event generates to remote server NEW/ REMOVE
<fieldset> Defines a grouping of related form elements
<figcaption> Represents a caption text corresponding with a figure element NEW
<figure> Represents self-contained content corresponding with a <figcaption> element NEW

<font> Defines a font size, font face and font color for its text REMOVE
<footer> Defines a footer section containing details about the author, copyright, contact us, sitemap, or links to related documents.
NEW
<form> Defines a form section that having interactive input controls to submit form information to a server.
<frame> Defines frame window. REMOVE
<frameset> Used to holds one or more <frame> elements. REMOVE
<h1> to <h6> Defines a Headings level from 1 to 6 different sizes.
<head> Defines header section of HTML document.
<header> Defines as a container that hold introductory content or navigation links. NEW
<hgroup> Defines the heading of a section that hold the h1 to h6 tags. NEW/ REMOVE
<hr /> Represent a thematic break between paragraph-level tags. It is typically draw horizontal line.
<html> Define a document is a HTML markup language
<i> Defines a italic format text
<iframe> Defines a inline frame that embedded external content into current web document.
<img> Used to insert image into a web document.
<input> Define a get information in selected input
<ins> Used to indicate text that is inserted into a page and indicates changes to a document.
<isindex> Used to create a single line search prompt for querying the contents of the document. REMOVE
<kbd> Used to identify text that are represents keyboard input.
<keygen> Used to generate signed certificate, which is used to authenticate to services. NEW/ REMOVE
<label> Used to caption a text label with a form <input> element.
<legend> Used to add a caption (title) to a group of related form elements that are grouped together into the <fieldset> tag.
<li> Define a list item either ordered list or unordered list.

<link> Used to load an external stylesheets into HTML document.
<map> Defines an clickable image map.
<mark> Used to highlighted (marked) specific text. NEW
<menu> Used to display a unordered list of items/menu of commands.
<meta> Used to provide structured metadata about a web page.
<meter> Used to measure data within a given range. NEW
<nav> Used to defines group of navigation links. NEW
<noframes> Used to provide a fallback content to the browser that does not support the <frame> element.
REMOVE
<noscript> Used to provide an fall-back content to the browser that does not support the JavaScript.
<object> Used to embedded objects such as images, audio, videos, Java applets, and Flash animations.
<ol> Defines an ordered list of items.
<optgroup> Used to create a grouping of options, the related options are grouped under specific headings.
<option> Represents option items within a <select>, <optgroup> or <datalist> element.
<output> Used for representing the result of a calculation. NEW
<p> Used to represents a paragraph text.
<param> Provides parameters for embedded object element.
<pre> Used to represents preformatted text.
<progress> Represents the progress of a task. NEW
<q> Represents the short quotation.
<rp> Used to provide parentheses around fall-back content to the browser that does not support the ruby annotations.
NEW
<rt> Specifies the ruby text of ruby annotation. NEW
<ruby> Used to represents a ruby annotation. NEW

<s> Text display in strikethrough style.
<samp> Represents text that should be interpreted as sample output from a computer program.
<script> Defines client-side JavaScript.
<section> Used to divide a document into number of different generic section. NEW
<select> Used to create a drop-down list.
<small> Used to makes the text one size smaller.
<source> Used to specifies multiple media resources. NEW
<span> Used to grouping and applying styles to inline elements.
<strike> Represents strikethrough text. REMOVE
<strong> Represents strong emphasis greater important text.
<style> Used to add CSS style to an HTML document.
<sub> Represents inline subscript text.
<sup> Represents inline superscript text.
<table> Used to defines a table in an HTML document.
<tbody> Used for grouping table rows.
<td> Used for creates standard data cell in HTML table.
<textarea> Create multi-line text input.
<tfoot> Used to adding a footer to a table that containing summary of the table data.
<th> Used for creates header of a group of cell in HTML table.
<thead> Used to adding a header to a table that containing header information of the table.
<time> Represents the date and/or time in an HTML document. NEW
<title> Represents title to an HTML document.
<tr> Defines a row of cells in a table.
<track> Represents text tracks for both the <audio> and <video> tags. NEW

<tt> Represents teletype text. REMOVE
<u> Represents underlined text.
<ul> Defines an unordered list of items.
<var> Represents a variable in a computer program or mathematical equation.
<video> Used to embed video content. NEW
<wbr> Defines a word break opportunity in a long string of text. NEW
Top Related