


Languages
Pages
Legal


April, 2009
Buy
Oman Cement Company
Oman Cement Company 1
Global Research - Oman
Om
an
Faisal Hasan, CFAHead of [email protected] No:(965) 22951270
Hettish KumarFinancial [email protected] No:(965) 22951281
Tickers:OCCO.OM (Reuters)OCOI OM (Bloomberg)
Listing:Muscat Securities Market
Current Price:RO0.372 (As on April 13th, 2009)
Investment Update
Investment Summary
• Oman Cement Company (OCC) posted revenue of RO63.5mn which was higher by 9% as per our estimates of RO58.3mn for 2008. Difference in the forecasted and actual revenue was because of the increase in the price cap during the year as well as import of higher amount of clinker and cement. Company sales volume increased by 14.6% to 2.1mn tons as compared to 1.87mn tons in 2007. On the other hand local sales price increased by 12.2% to RO29.7/ton whereas the export price rose by 11.6% to RO36.5/ton.
• OCC’s cost of sales increased by 69% to RO49.65mn in 2008. The increase in cost was due to high purchase cost of cement and clinker imported under instructions from the government in order to meet the local demand. The company imported 0.92mn tons of clinker during the year to meet the demand, which is 42% higher as against 0.53mn tons during the previous year.
• OCC’s other income increased by 68% to RO3.2mn in 2008 as against RO1.91mn in 2007. This other income portion has over the years added significant amount to the bottom line.
• OCC reported profit before tax of RO14.1mn in 2008 which was subject to 12% income tax resulting in a profit after tax of RO12.5mn as compared to RO17.6mn in 2007. In 2008, the company managed to report net margins of 19.74% as against 35.3% in 2007.
• In terms of quarterly performance of 2008, 1Q-2008 was the most favorable quarter as the company report profit after tax of RO3.9mn and net margins of 34%. Although in the last quarter the company report highest ever revenue but was not able to full transfer it to the bottom line as the net margins were merely 9% in 4Q-2008.
• OCC’s assets declined marginally to RO133mn in 2008 as compared to RO134.3mn in 2007. The major reason for the fall in assets in 2008 was because of decline in the investment available for sale. Investment available for sale dropped to RO15.2mn as compared to RO21.0mn in 2007.
• OCC announced an expansion of 1.2mn tons in clinker capacity for which a contract has been signed. The duration for construction and erection of the project is 25 months as per the contract and the project is expected to be completed in December 2009- 1st Quarter

Global Research - Oman Global Investment House
� Oman Cement Company
of 2010. In order to finance the project, OCC will be partly utilizing loan funds. The total contract value for the Expansion Project is RO62.7mn (US$162mn) and RO20mn of the project cost is to be met from loans.
• Sohar Praton Concrete Products Company SAOC, a 58.4% subsidiary of OCC went into liquidation and consequently, the parent company’s control of the subsidiary passed to the liquidator. Accordingly, the subsidiary is deconsolidated with effect from 12 March 2008. On the other hand, Oman Mondi Shuaiba Packaging (OMSP) reported an improved performance during the year 2008. Revenue earned by OMSP increased from RO3.5mn to RO6.5mn in 2008.
• As per MEED, over US$105bn worth of projects have been announced by Oman. Keeping in view the liquidity crunch and the cash constraints, even if we discount the projects by more than a half, still there would be ample demand which would be catering to sales growth of the cement companies in Oman. According to OCC, the expected demand for cement in Oman is estimated at 4.63mtpa during 2009.
• The value of OCC’s shares derived from the weighted average of the DCF and relative valuation methods is RO0.676 per share. The stock closed at RO0.372 on the Muscat Securities Market at the end of trading on 13th April 2009, which implies that the weighted average value of OCC’s shares is at a premium of 82% to the share’s current market price. At their current price, OCC’s shares have a P/E multiple of 10.6x and 7.2x for 2009 and 2010 respectively. We therefore reiterate our BUY recommendation on the scrip.
Table 01: Investment Indicators CMP (13th April 2009) Shares in Issue (mn) M-Cap (RO mn) 52-Week Hi/Lo (RO)
RO0.372 330.9 123.1 1.025 / 0.232
Year
Gross Profit
(RO mn)
Net Profit
(RO mn)
EPS
(RO)
BVPS
(RO)
ROAE
(%)
P/E
(x)
P/BV
(x) 2010 F 19.8 17.0 0.05 0.36 14.79 7.2 1.0 2009 F 13.4 11.6 0.04 0.34 10.42 10.6 1.1 2008 A 13.9 12.5 0.04 0.33 11.32 7.9 0.9 2007 A 20.5 17.6 0.05 0.33 17.07 12.5 2.0
Source : Company’s Annual Reports, Reuters & ’Global’ Research.Historical P/E & P/BV multiples based on respective year-end prices, while those for future years are based on current market price in the Muscat Securities Market as on April 13, 2009.
Chart 01: Share Price Performance Chart
Source: Zawya
-
2,000
4,000
6,000
8,000
10,000
12,000
14,000
13-A
pr-0
8
13-M
ay-0
8
13-J
un-0
8
13-J
ul-0
8
13-A
ug-0
8
13-S
ep-0
8
13-O
ct-0
8
13-N
ov-0
8
13-D
ec-0
8
13-J
an-0
9
13-F
eb-0
9
13-M
ar-0
9
13-A
pr-0
9
0.00
0.20
0.40
0.60
0.80
1.00
1.20
(RO
)
Index - LHS OCC - RHS

Global Research - Oman Global Investment House
Oman Cement Company �
Oman Cement Sector
The cement industry in Oman dates back to 1977, when Oman Cement Company (OCC) was set up, followed by Raysut Cement Company (RCC), which started in 1981. OCC is situated in the Muscat Governorate in Northern Oman, while RCC’s plant is located in the Dhofar Governorate in Southern Oman. Most of the consumption is concentrated in the northern part of the country as the southern part is less developed and demand for cement is lower. As a consequence of that RCC has established a cement receiving facility at Port Sultan Qaboos in Muscat with a capacity of 15,000 tons cement to cater to the Northern part of the Country. RCC being present in the southern part of the country serves the deficit markets of Yemen and East Africa for which it has established cement receiving facilities at the Ports of Mukalla and Aden.
In Oman, construction activity has been in heightened mode since 2003, with cement demand surpassing supply, resulting in cement shortages and price hikes. Consequently, the Omani government decided to impose a ban on cement exports in mid 2004, a move that forced local producers to focus on opportunities at home. Since then the country’s cement deficit declined as the demand supply gap reversed into surplus. In nominal terms Oman’s building and construction sector value has increased from RO159mn in 2000 to RO762mn at the end of 2007, growing at a CAGR of 25%. Which is further expected to rise to RO838mn in 2008. The building and construction sector contribution to the nominal GDP of the country is 4.8% as of 2007 which is expected to touch 5% at the end of 2008. Oman ranks below in terms of country’s building and construction sector contribution to the GDP when compared with its regional players. UAE ranks at the top at 8% followed by Qatar and Bahrain at 5.7% and 5% respectively.
Chart 02: Building & Construction Sector (BCS) as % GDP
Source: Ministry of National Economy, Oman
On the other hand in real terms, country building and construction material sector contribution to the GDP has increased from 2.1% in 2000 to 6.7% in 2007. The difference between the nominal and real terms is because of the decline in the oil production from 299mn barrels in 2003 to 259mn barrels in 2007. Nevertheless in the same period nominal GDP continued to increase as the oil price surged from US$27.8/barrel in 2003 to US$65.2/barrel in 2007. Going forward we believe that building and construction material contribution to GDP will continue to increased (1) ongoing construction and expansion activities in the real estate and construction sector and (2) decline in the oil production in the country because of depleting reserves.
1.0%
2.0%
3.0%
4.0%
5.0%
6.0%
7.0%
8.0%
2000 2001 2002 2003 2004 2005 2006 2007 2008BCS as % of Nominal GDP BCS as % of Real GDP
The increasing difference is because of lower production of oil as
compared to BCS sector.

Global Research - Oman Global Investment House
� Oman Cement Company
Oman’s Cement Capacity Enhancements to Continue
Over the years with the increasing oil prices and higher budgetary revenues, the country continued to focus on the diversification and developmental activities which in turn required contribution from the cement sector as well for the construction activities. In view of that, both the cement companies has continued to increase their cement capacities which at the end of 2008 are 4.6mtpa as compared to 2.2mtpa in 2003.
Chart 03: Oman Cement Sector Capacity
Source: Oman & Raysut Cement
Oman Cement increased its capacity from 1.26mtpa in 2003 to 1.87mtpa in 2008. The heightened demand prompted OCC to announce a further expansion which will double its clinker capacity to 2.4mtpa. This expanded capacity would help in achieving high local market share and to reduce the company’s reliance on imported clinker which incurs lots of cost and reduces the margins. OCC is planning to bring the additional capacity on-stream in 2010.
On the other hand Raysut Cement also followed the footsteps of Oman Cement. It increased its cement capacity from 0.98mtpa in 2003 to 2.75mtpa in 2008. In the meanwhile it has surpassed the capacity of OCC, but with the expansion of OCC both would be able to produce almost equal amounts of cement.
Cement capacity of Oman has continued and have tracked the pace of capacity enhancements in the region. Overall in GCC, the cement capacity is expected to increase from 43mtpa in 2003 to 85.9mtpa and 116.3mtpa in 2008 and 2012 respectively. Hence, Oman’s contribution to the overall cement capacity of GCC is to decline from the current levels of 5.4% in 2008 to 4.6% in 2012.
Demand Supply Scenario
Country’s demand and supply situation has in 2008 almost broke even as the total supply of cement was 4.12mn tons while consumption in the country rose from 3.07mn tons to 4.06mn tons. Cement demand in the country is driven by:
• Tourism: In 2006, tourism accounted for 0.75% of the GDP with a value of RO103mn, but the government hopes this figure can be increased to 1.4%of GDP in 2010 and 3% by 2020. Hence more of the focus would be on developing the infrastructure which in turn would result in favorable situation for the cement industry. Many tourism related projects are expected to come online in the coming 3-4 years.
2.2 2.2 2.2 3.2 4.2 4.6 4.6 5.4 5.4 5.4
42.9 47.7 53.058.8
68.7
85.9
107.4 112.9 116.3
91.2
-
20
40
60
80
100
120
140
2003 2004 2005 2006 2007 2008 2009F 2010F 2011F 2012F
(mn
Tons
)
0.0%
1.0%
2.0%
3.0%
4.0%
5.0%
6.0%
7.0%
Oman Capacity GCC Capacity Oman as % of GCC

Global Research - Oman Global Investment House
Oman Cement Company �
Table 02: Tourism Projects in Oman Project Name Value (US$mn) Project End
Majan Gulf Properties - Khasab Resort 780 Q1 2012
Yenkit Tourism Devp - Integrated Tourism Complex 2,000 Q4 2011
Muriya - Resorts 850 Q4 2012
Alfa - Journey of Light Beach Resort 950 Q2 2011
Ministry of Tourism - Seeb Complex 100 Q3 2009
Omran - Asian Beach Games Project 180 Q2 2010
Omran - Duqm Hotel 80 Q1 2010
Omran - Fort Hotel Resort 300 Q4 2010
Omran - Jabal Al Akhdar Resort Hotel 150 Q2 2011
Omran - Oman Convention and Exhibition Centre 400 Q2 2011
Omran - Ras Al Hamra Resort & Retreat 700 Q1 2011
Omran / Qatari Diar Real Estate Inv. Co - Ras Al-Hadd Resort 220 Q2 2012
Sama Dubai - Yiti Resort & Spa (Yiti) 1,400 Q4 2010
Swiss-Belhotel International / HBG Holdings Ltd 200 Q4 2010
The Wave Tourism Development 2,000 Q1 2015
World In / Bolici Group - Hayoot Beach Resort 350 Q4 2010
10,660
Source: MEED
The total cost of these tourism related projects only is worth US$11bn which when translated into cement demand would result in cement demand of 6.5mn tons in the four year period. Overall, the outlook for tourism sector is very bright in the coming years and the Sultanate is leaving no stones unturned to realize exponential growth in this sector.
• Foreign Freehold Ownership: Earlier, only GCC nationals were the only foreigners allowed to buy land in Oman which extend land ownership rights to GCC national and GCC corporate entities. However, the Royal decree 12/2006, expands foreign ownership rights to include non-GCC nationals as well.
• Real Estate Investments: Despite the upsurge in property prices till September 2008 the Omani market remained competitive in terms of prices as compared to other GCC countries. Omani land is cheaper than the other GCC countries. This gives the country an advantage in attracting investments from other prosperous GCC countries.
As per MEED, at the end of 2008 US$105bn worth of projects has been announced by Oman. On a conservative note even if 50% of the projects go as per schedule atleast US$52.5bn worth of projects would continue as per schedule.
Table 03: Oman Cement Demand Expectations
Overall Project Announcements in Oman (2008-2015) (US$mn) 105,000.0
Assumed Actual Implementation 50% 52,500.0
Expected Building & Construction Related Projects 40% 21,000.0
Cement Revenue as % of Build & Cons Sector in GCC 12% 2,520.0
Cement Price per Ton as of 2008 in Oman (US$/Ton) 81.5
Resulting Cement Demand (2008-2015) (mn Tons) 30.9
Annual Cement Demand (mn Tons) 4.4
Source: MEED & Global Research

Global Research - Oman Global Investment House
� Oman Cement Company
These projects include various civil, industrial, infrastructure, real estate and construction related projects. Hence of the total if we assume 40% are related to infrastructure, building and real estate related construction projects the total amount of the project would be US$21bn. In the past, cement sector revenues of the GCC have averaged around 12% of the total building and construction sector contribution in the nominal GDP. Hence by calculating the total value of cement in the coming 7 years till 2015, it reveals that Oman would have a minimum cement demand of atleast 4.4mn tons per annum.
Cement production of Oman has increased from 2.51mn tons in 2003 to 4.12mn tons in 2008. On the other hand cement sold by Omani companies in the country was 4.05mn tons in 2008, which means that the demand and supply situation is running neck to neck.
Chart 04: Oman Demand Supply Scenario (mn tons)
Source: Global Research
Going forward, with the economic slowdown and lower oil prices we expect Oman cement sector to continue this stiff competition between supply and demand and later on would turn in to a surplus as one of the cement players capacity is expected to come online in 2010.
Per Capita Cement Consumption in Oman
The cement consumption in Oman is directly linked to the scope of infrastructure developments undertaken by the government in recent years. Cement consumption and prices have therefore been highly sensitive to the volume of government-backed construction work in the Sultanate, as supply constraints on locally produced clinker has persisted throughout the past few years. Omani per capita cement consumption is relatively lower than its regional players. UAE takes the lead with per capita cement consumption of more than 3,800kg. Qatar ranks 2nd with per capita cement consumption of more than 2,200kg.
In 2006, per capita consumption of Oman surpassed 1000kg mark and is currently standing at 1,499kg at the end of 2008. Looking at the pace of development in the country and expected future demand, it is expected that per capita consumption would reach 1,662kg by 2012.
-
1.0
2.0
3.0
4.0
5.0
6.0
2005 2006 2007 2008 2009F 2010F 2011F-0.2
0.0
0.2
0.4
0.6
0.8
1.0
1.2
Supply Demand Surplus / (Gap)

Global Research - Oman Global Investment House
Oman Cement Company �
Chart 05: Per Capita Cement Consumption & Growth per Capita
Source: Company Reports & Global Research
Majority of the export share has been taken up by Raysut Cement. Oman Cement exports has increased from mere 641ktons in 2003 to as high as 1.2mn tons in 2006 and back to 807ktons in 2008.
Local and Export Cement Prices
Cement prices in Oman continued to increase despite government intervention over the prices. Average realizations for both the companies rose during 2008. On an average (local and export price) cement prices for Oman rose from US$71.5/ton to US$81.5/ton. Local cement price on average rose from RO27.5/ton in 2007 to RO31.5/ton in 2008.
Chart 06: Local & Export Prices (RO/Ton)
Source: Company Reports & Global Research * Amount of export revenue not available before 2006 for OCC
RCC which exports majority of its produce realized higher local prices of RO33/ton as compared to that of OCC at 29.7/ton. On the other hand average export rose from RO30.5/ton in to RO34.5/ton in 2008. RCC which exports majority of its produce realized lower export prices of RO32.3/ton as compared to that of OCC at 36.5/ton.
Local and export cement prices has reported a CAGR of 6.8% and 7.3% respectively during 2003-08. Government has put certain restrictions on the selling prices of cement. However, the rising cost of inputs in the form of clinker and other important inputs such as services and manpower, may have adverse impact on the future performance of the cement industry in general and OCC in particular. Going forward in 2009 alone we expect the cement price to remain relatively lesser as compared to that of 2008 mainly because of economic slowdown. In the medium to long term we expect prices to recover 2010 onwards.
-
200
400
600
800
1,000
1,200
1,400
1,600
2003 2004 2005 2006 2007 2008-10%
-5%
0%
5%
10%
15%
20%
25%
30%
35%
Per Capita Cement Consumption Growth
10
16
22
28
34
40
2003 2004 2005 2006 2007 2008 2003 2004 2005 2006 2007 2008
OCC - Local Price RCC - Local PriceOCC - Export Price RCC - Export Price
Global Research - Oman Global Investment House
� Oman Cement Company
Financial Performance of the Sector
Financial performance of the Omani cement sector has remained satisfactory. Combined revenues of the two listed companies increased at a CAGR of 28% during 2003-08. During 2008 alone, the revenue increased by 35% to RO152.6mn as compared to RO112.9mn in 2007. Surge in revenue was because of the increase in average realization prices from US$71.5/ton to US$81.5/ton in 2008 and also because of rise in selling volumes from 4.1mn tons to 4.86mn ton in 2008. Cost of sales on the other hand doubled to RO107mn from RO52.7mn in 2007. Increase in cost was because of increase in the usage and price of imported clinker and high cost of imported cement. As a result of this gross profit declined by 24% to RO45.5mn (Gross Margins: 30%) as compared to RO60.2mn (Gross Margins: 53%) at the end of 2007.
Table 04: Oman Cement Sector
(RO’ 000) 2003 2004 2005 2006 2007 2008 Sales Revenue 43,721 55,403 71,962 97,685 112,925 152,603 Cost of Sales 24,578 27,667 36,148 44,604 52,741 107,142 Gross Profit 19,142 27,736 35,814 53,081 60,184 45,461 Non Core Income 2,395 2,363 4,011 5,211 9,917 3,178 Operating Expense 4,895 5,952 7,163 10,896 13,576 19,108 Operating Profit 13,859 21,236 27,950 41,264 45,455 42,017 Financial Charges 1,020 556 324 202 101 74 Net Profit 13,752 20,208 28,179 41,214 47,739 39,648 Assets 127,992 141,068 189,451 218,926 247,294 250,631 Equity 89,107 103,081 139,210 166,437 210,711 215,985 Debt 18,030 15,050 22,603 17,652 9,796 5,696 Liabilities 38,886 37,987 50,240 52,490 45,516 34,646
Source: Company Reports & Global Research
Operating expenses increased by 31% to RO19.1mn as compared to RO13.5mn in 2007. Increase in operating expense was due to the higher man power cost and also due to higher land lease rentals. With such high operating expense, operating profit reportedly dropped to RO42mn (Operating Margins: 28%) in 2008 as compared to RO45.5mn (Operating Margins: 40%) in 2007.
The sector is less leveraged and equity amount to 86% of the total assets. Because of less reliance on debt, the financial charges of the sector has dropped to RO0.074mn as compared to RO.101mn in 2007. On the other side, other income of the sector which is earned through return on cash balances, foreign exchange transactions, dividend income and result from associates dropped to RO3.1mn as compared to RO9.9mn at the end of 2007. On the whole cement sector earnings of Oman reported a CAGR 23.6% during 2003-08. In 2008, net earnings of the sector were RO39.6mn as compared to RO47.7mn in 2007, a drop of 17%. The sector was able to post net margins of 26% in 2008 as compared to 42% recorded in the previous year.
The sector posted a revenue growth of 35% whereas cost of sales on the other hand escalated to 103%, a number never touched before and expected not to do so in the years to come.

Global Research - Oman Global Investment House
Oman Cement Company �
Table 05: Oman Cement Sector Ratios2003 2004 2005 2006 2007 2008
Revenue Growth (%) N/A 27% 30% 36% 16% 35%
Cost Growth (%) N/A 13% 31% 23% 18% 103%
Asset Growth (%) N/A 10% 34% 16% 13% 1%
Gross Margins (%) 44% 50% 50% 54% 53% 30%
Non Core Income as % of PAT 17% 12% 14% 13% 21% 8%
Operating Margins (%) 32% 38% 39% 42% 40% 28%
Net Margins (%) 31% 36% 39% 42% 42% 26%
Debt as % of Assets (%) 14% 11% 12% 8% 4% 2%
Liabilities as % of Assets (%) 30% 27% 27% 24% 18% 14%
Equity as % of Assets (%) 70% 73% 73% 76% 85% 86%
Return on Equity (%) 15% 20% 20% 25% 23% 18%
Return on Assets (%) 11% 14% 15% 19% 19% 16%
Source: Company Reports & Global Research
Other income earned by the sector contributed 8% to the overall profits of the sector in 2008 as compared to 21% in 2007. Drop in the contribution was because of lesser amounts earned through investment portfolio and share of profit from associates. With assets and equity of RO250.5mn and RO216mn, the sector with net income of RO39.6mn was able to give return on assets and return on equity of 16% and 18% respectively.
Table 06: Oman Cement Sector Statistics2003 2004 2005 2006 2007 2008
Cement Produced in Oman (000 Tons) 2,515 2,621 2,686 3,609 3,875 4,121
Cement Sold in Oman (000 Tons) 1,889 1,847 2,173 2,589 3,072 4,057
Cement Exports from Oman (000 Tons) 641 824 821 1,210 1,032 807
Price per Ton in Oman (US$) 44.9 53.9 62.4 66.8 71.5 81.5
Cost per Ton in Oman (US$) 25.2 26.9 31.4 30.5 33.4 57.2
EV/Ton (US$) 169.5 249.9 468.8 356.9 373.6 169.8
Per Capita Cement Consumption (Kg) 807 765 866 1,005 1,157 1,499
Source: Company Reports & Industry Sources
Enterprise value per ton of the companies rose at a CAGR of 21.8% during 2003-07. However with the decline in the equity markets, the enterprise values declined for both the companies by over 50%. Enterprise value per ton of Oman Cement dropped to US$133 in 2008 as compared to US$305 in 2007. While the same for Raysut Cement dropped to US$207 in 2008 as compared to US$442 in 2007.

Global Research - Oman Global Investment House
10 Oman Cement Company
Oman Cement Sector in Charts
Source: Company Reports & Global Research
25%
31%
37%
43%
49%
55%
61%
2003 2004 2005 2006 2007 2008
Gross Margins (%)
5%
9%
13%
17%
21%
25%
2003 2004 2005 2006 2007 2008
Non Core Income as % of PAT
20%
25%
30%
35%
40%
45%
2003 2004 2005 2006 2007 2008
Operating Margins (%)
20%
25%
30%
35%
40%
45%
2003 2004 2005 2006 2007 2008
Net Margins (%)
0%
1%
2%
3%
4%
5%
6%
2003 2004 2005 2006 2007 2008
Financial Charges as % of Loan
0%
3%
6%
9%
12%
15%
2003 2004 2005 2006 2007 2008
Debt as % of Assets
-
100
200
300
400
500
2003 2004 2005 2006 2007 2008
EV/Ton (US$)
66%
70%
74%
78%
82%
86%
90%
2003 2004 2005 2006 2007 2008
Equity as % of Assets
15%
17%
19%
21%
23%
25%
2003 2004 2005 2006 2007 2008
Return on Equity (%)
10%
12%
14%
16%
18%
20%
2003 2004 2005 2006 2007 2008
Return on Assets (%)

Global Research - Oman Global Investment House
Oman Cement Company 11
Sector Outlook
Oman’s 2008 budget surplus soared to RO1.58bn (US$4.1bn) in 2008 compared to RO40.2mn a year earlier as the country’s oil revenues jumped up on record-high oil prices. Total state 2008 revenues stood at RO7.9bn compared to RO5.9bn a year earlier while expenditure rose to RO6.4bn in 2008 compared to RO5.9bn a year earlier, according to Ministry of National Economy. Such high revenues would give room to the country for further development and project announcements.
Domestic cement demand is expected to remain robust during 2009, fuelled in large part by planned investments in major infrastructure projects, integrated tourism and residential complexes, and general housing growth. The project line-up included the six domestic airports at Sohar, Ras al Hadd, Duqm, Shaleem, Adam and Haima; port developments at Sohar and Duqm; the tourism and residential developments in Ras al Hadd, Sifah, Yiti and Taqah; and the Batinah coastal road rehabilitation program. In fact, up to 10% of the estimated RO800mn in allocations towards infrastructure projects, announced by the government in its 2009 budget, would go towards cement purchases alone.
Significant cement demand will also be generated when many Omanis, keen to have their own homes, embark on the development of their government-allotted residential plots. Around 196,000 plots were distributed during the 2003-2007 period, against which only around 37,000 building permits have been issued so far. This leaves some 160,000 plots awaiting potential development, not counting the scores of allotments that authorities have began to make to a broader segment of Omani women.
Nevertheless, supply would outstrip demand and would create a surplus situation which would put pressure on the cement companies in the country. This surplus would increase the cement players reliance on exports which would be flooded with excess capacity from Pakistan, India and Saudi Arabia. India and Pakistan have relatively lesser room for cutting their prices which in turn can be taken up Omani companies as their gross margins are higher than those of Pakistani and Indian cement companies. Along with that, after the clinker expansion are carried out the cost would give more room for the Omani companies to breach the export market share of other cement companies.

Global Research - Oman Global Investment House
1� Oman Cement Company
Oman Cement Company
Revenue to Grow Post Expansion
In 2008, the revenue increased to RO63.5mn as compared to RO49.9mn at the end of 2007. Such a growth was possible because of higher production and sales volume as well as better realization prices.
The clinker produced during the year 2008 was 1.18mn tons as against 1.15mn tons produced during the corresponding period of 2007. This represents 98.5% (2007-96.17%) capacity utilization. While the cement produced during the year 2008 was 2.003mn tons which is 7.4% higher than 1.87mn tons produced during the previous year 2007. During the year 264,728ktons of cement was procured as per the instructions of Ministry of Commerce & Industry to meet the local market demand.
OCC sales volume increased by 14.6% to 2.1mn tons as compared to 1.87mn tons in 2007. Out of the total 2.1mn, local sales volume were 2.07mn tons whereas the exports were down from previous levels of 2007 at 91,251tons to 81,285tons. On the other hand local sales price increased by 12.2% to RO29.7/ton whereas the export price increased by 11.6% to RO36.5/ton.
Chart 07: Sales Revenue
Source: Company Reports & Global Research
In 2009, we expect the economic slowdown locally as well as regionally to impact the company which will result in lower sales revenue for the year. We expect a nominal drop in volumes with a 2-3% drop in the local as well as export price. Going forward, we expect OCC to report a CAGR growth of 7.2% during 2008-12. After 2009, we expect the things to come back on track and expect an increase in volume as well as price mainly because of expected economic recovery globally as well as regionally and initiation of delayed and halted projects. Along with that the company would have higher clinker and cement capacity which would enable it to roll out more volumes of cement.
Cost Pressure to Ease
Cost of the sales increased at a CAGR of 25.3% during 2003-08. In 2008, cost of sales increased by 69% to RO49.65mn. The increase in cost was due to high purchase cost of cement and clinker imported under instructions from the government in order to meet the local demand. The company imported 0.92mn tons of clinker during the year to meet the
-10.0
20.030.040.0
50.060.070.0
80.090.0
2003 2004 2005 2006 2007 2008 2009 (F) 2010 (F) 2011 (F) 2012 (F)-5%
0%
5%
10%
15%
20%
25%
30%
35%
Revenue (RO mn) Growth

Global Research - Oman Global Investment House
Oman Cement Company 1�
demand, which is 42% higher as against 0.53mn tons during the previous year. On the other hand in 2008 the company also imported 174k tons of cement to meet the shortfall locally.
Chart 08: Gross Profit & Margins
Source: Company Reports & Global Research
In 2009, we expect the company would follow the same trend and would continue to import significant amount of clinker at 0.6mn tons and 0.15mn tons of cement to meet their local requirements. Later on we expect the company cost pressure to ease off and anticipate it to increase at a CAGR of 5.4% during 2008-12. Lesser growth in the cost would be due to availability of new clinker capacity which would halt the import of high cost clinker.
As a result of availability of additional clinker capacity after 2009 we expect the company’s gross profit to increase at a CAGR of 12.9% during 2008-12 as compared to a CAGR growth of 5.8% during 2003-08. OCC enjoyed higher gross margins during 2003-07 averaging around 43%. Such margins would be harder to achieve in the coming years as the but nevertheless OCC’s margins would be significantly better than what were reported in 2008.
Loans & Financial Charges
In 2008, OCC financial charges increased to RO66.5k as compared to RO23.0k in 2007. While the loan balance declined to RO0.9mn in 2008 from RO2.2mn recorded in the previous year. With the announcement of the expansion by OCC and the need of financing the Company will be partly utilizing loan funds. The total contract value for the Expansion Project is RO62.7mn (US$162mn) out of which RO20mn of the project cost is to be met from loans.
Chart 09: Loans & Financial Charges (RO mn)
Source: Company Reports & Global Research
-
5.0
10.0
15.0
20.0
25.0
2003 2004 2005 2006 2007 2008 2009 (F) 2010 (F) 2011 (F) 2012 (F)18.0%
23.0%
28.0%
33.0%
38.0%
43.0%
48.0%
53.0%
Gross Profit (RO mn) Gross Margins
-
0.1
0.1
0.2
0.2
0.3
0.3
2003 2004 2005 2006 2007 2008 2009 (F) 2010 (F) 2011 (F) 2012 (F)0.18
1.18
2.18
3.18
4.18
5.18
6.18
7.18
Loans - RHS Financial Charges - LHS

Global Research - Oman Global Investment House
1� Oman Cement Company
Previously the company has acquired three loan facilities of which the first one from Government of the Sultanate of Oman is interest free and amounts to RO0.9mn. The loan is secured by a first mortgage over the assets of the parent company and the assignment of the insurance policy over plant and machinery as a first beneficiary and is being repaid in annual installments of RO 300,000 which commenced in December 2002.
Non-Core Income
In 2008, OCC non-core income increased by 68% to RO3.2mn as against RO1.91mn in 2007. This non-core income portion has over the years added significant amount to the bottom line. In 2008, non-core income as percentage of profit after tax was 26% as compared to 11% in 2007.
Chart 10: Non-Core Income
Source: Company Reports & Global Research
Going forward, we expect the non-core income portion to continue to cushion the bottom line of the Company and grow at a CAGR of 14.7% during 2008-12. OCC’s subsidiary Oman Mondi Shuaiba Packaging has also turned profitable in 2008 and would be adding good amounts to the total.
Net Profit
In 2008, OCC reported profit before tax of RO14.1mn which was subject to 12% income tax resulting in a profit after tax of RO12.5mn as compared to RO17.6mn in 2007. In 2008, the company managed to report net margins of 19.74% as against 35.3% recorded in the previous year. In terms of quarterly performance of 2008, 1Q-2008 was the most favorable quarter as the company report profit after tax of RO3.9mn and net margins of 34%. Although in the last quarter the company report highest ever revenue but was not able to full transfer it to the bottom line as the net margins were merely 9% in 4Q-2008.
-
1.00
2.00
3.00
4.00
5.00
6.00
2003 2004 2005 2006 2007 2008 2009 (F)2010 (F)2011 (F)2012 (F)5%
10%
15%
20%
25%
30%
Non-Core Income (RO mn) Non-Core Income as % of PAT
Global Research - Oman Global Investment House
Oman Cement Company 1�
Chart 11: Net Profit
Source: Company Reports & Global Research
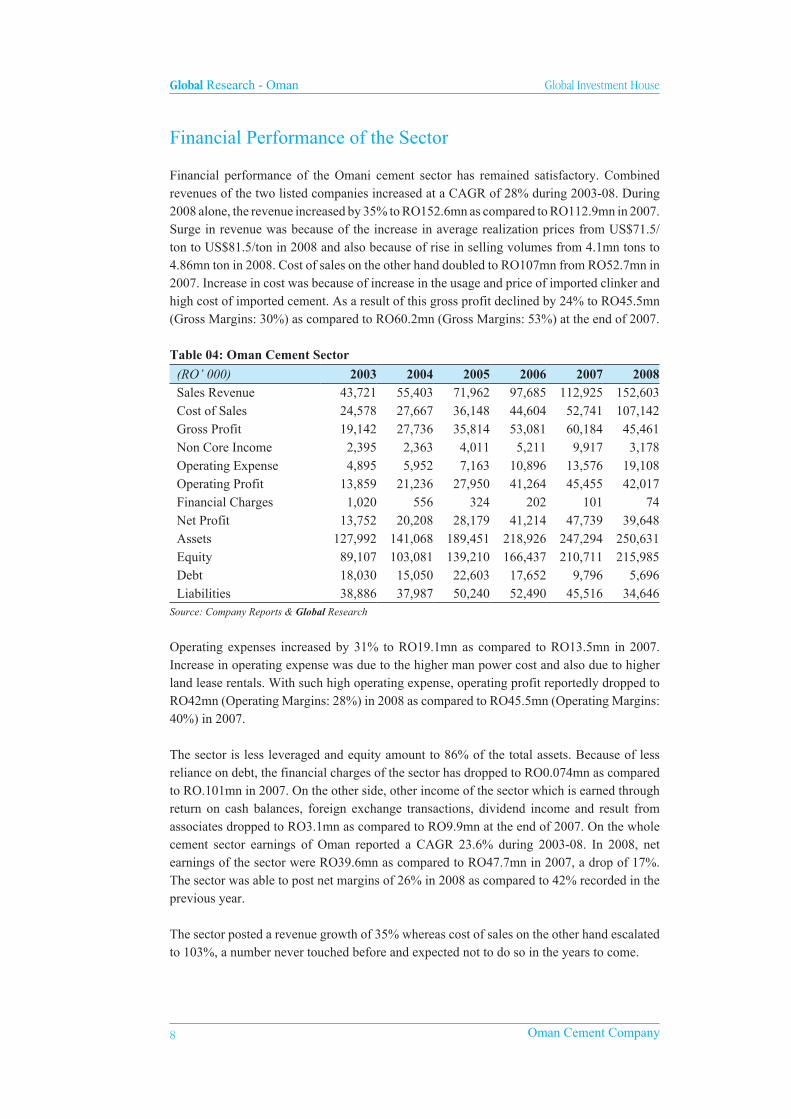
Going forward, we expect OCC to report net profit CAGR of 15.1% during 2008-12. Increase in net profit in the coming years would be on account of increase in the revenue because of the availability of additional clinker capacity and rolling out of higher sales volume.
Asset growth to continue
In 2008, the asset declined marginally to RO133mn as compared to RO134.3mn in 2007. The major reason for the fall in assets in 2008 was because of decline in the investment available for sale. Investment available for sale dropped to RO15.2mn as compared to RO21.0mn in 2007. Nevertheless the cost of available for sale investments is merely RO8.0mn which portrays that the Company is still profitable on its investments.
Company’s shareholders’ equity decreased a marginal 1.5% to RO117.9mn. The decrease was due to 44.5% decline in fair value reserves to RO7.2mn compared to RO13.07mn in 2007. The adjusted book value per share (BVPS) marginally fell to 0.356 compared to 0.362 in 2007. The company’s current liabilities increased by 21% to RO9.32mn with its share in total assets rising from 5.8% in 2007 to 7.0% in 2008. This was led by a 66.3% rise in trade and other payables to RO7.1mn in 2008. During the same period, non-current liabilities decreased 15.2% to RO5.7mn with its share in total assets falling to 4.3% in 2008.
Chart 12: Asset
Source: Company Reports
The share of current assets in the total assets increased to 31.6% in 2008 compared to 23.7% in the previous year. Inventories, contributing 11.5% to the total assets, rose to RO15.2mn in 2008 as imported clinker and finished cement mounted.
-
5.00
10.00
15.00
20.00
25.00
2003 2004 2005 2006 2007 2008 2009 (F)2010 (F) 2011 (F) 2012 (F)5%
10%
15%
20%
25%
30%
35%
40%
45%
Net Profit (RO mn) Net Margins (%)
-20.040.060.080.0
100.0120.0140.0160.0180.0
2003 2004 2005 2006 2007 2008 2009 (F) 2010 (F) 2011 (F) 2012 (F)0%10%20%30%40%50%60%70%80%90%
Assets (RO mn) Equity as % of Assets Liability as % of Assets
Global Research - Oman Global Investment House
1� Oman Cement Company
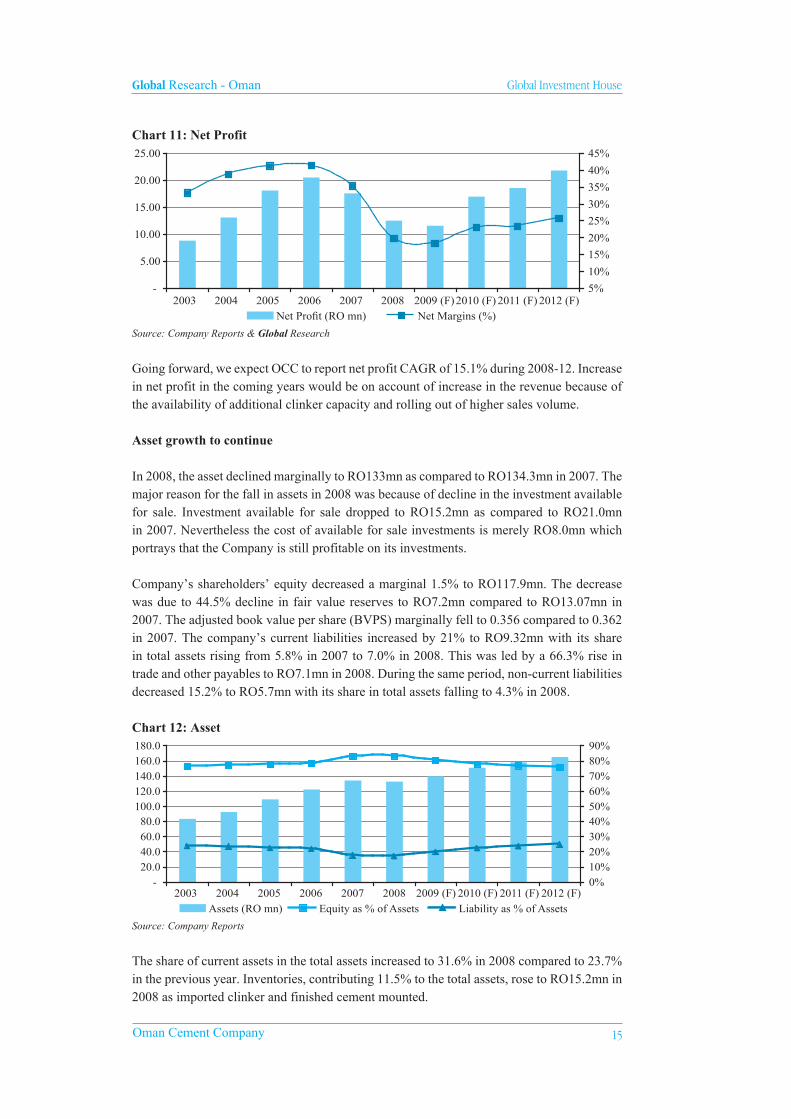
Going forward, we expect OCC to report a CAGR of 5.3% during 2008-12. The liabilities of the company are going to rise on account of requirement of loan for funding the expansion. We expect current ratio of debt as a % of assets to increase from 1% in 2008 to 5% in 2009.
Performance of the Subsidiaries
The company has two subsidiaries which are: Oman Mondi Shuaiba Packaging and Sohar Praton and Concrete Products (SPCP). In 2008, The company divested its investments in the associate, M/s. Al Batna Quarries Co. LLC and sold all its 50,000 shares bought at a price of RO50,000 (20% stake) at a premium price of RO80,000.
On the other hand, Oman Mondi Shuaiba Packaging reported an improved performance during the year 2008. Revenue earned by the company increased from RO3.5mn to RO6.5mn in 2008. Such performance resulted in a profit after tax of RO156,678 in 2008 as against a loss of RO59,414 in 2007.
Chart 13: Oman Mondi Shuaiba Packaging
Source: Company Reports
Sohar Praton Concrete Products Company SAOC (the subsidiary), a 58.4% subsidiary, is a closely held joint stock Company registered in the Sultanate of Oman and is engaged in manufacturing and marketing pre-cast ready mixed concrete products. On 12th March 2008, Sohar Praton Concrete Products Company went into liquidation and consequently, the parent company’s control of the subsidiary passed to the liquidator. Accordingly, the subsidiary is deconsolidated with effect from 12 March 2008.
Capacity Expansion
OCC announced further expansion of 1.2mn tons in clinker capacity for which a contract has been signed with M/s. China National Building Material Equipment Corporation Ltd., China (CNBMEC). The duration for construction and erection of the project is 25 months as per the contract and the project is expected to be completed in December 2009/1st Quarter of 2010.
In order to finance the Expansion Project, OCC will be partly utilizing loan funds. The total contract value for the expansion project is RO62.7mn (US$162mn) and RO20mn of the project cost is to be met from loans. This expanded capacity is expected to help in achieving high local market share and to target export markets for both grey Portland cement and the specialized Oil-Well Cement.
0.0
1.0
2.0
3.0
4.0
5.0
6.0
7.0
2005 2006 2007 2008
(RO
mn)
(150)
(100)
(50)
-
50
100
150
200
(RO
000
)
Revenue (LHS) Profit (RHS)

Global Research - Oman Global Investment House
Oman Cement Company 1�
Chart 14: Clinker Capacity Enhancement
Source: Company Reports
The company also signed contract for execution of civil works of the project for up gradation and modernization of Packing Plant has been signed with M/s. China National Building Material Equipment Corporation Ltd., China (CNBMEC) and the project is anticipated to be completed in the 2nd quarter of 2009.
-
0.5
1.0
1.5
2.0
2.5
3.0
1983 1998 2010

Global Research - Oman Global Investment House
1� Oman Cement Company
Chart Gallery - Oman Cement Company
Source: Company Reports
Gross Margins (%)
15%
20%
25%
30%
35%
40%
45%
2007 2008 2009F 2010F 2011F 2012F
EV/EBITDA (x)
0.0
2.0
4.0
6.0
8.0
10.0
2007 2008 2009F 2010F 2011F 2012F
Net Margins (%)
15%
20%
25%
30%
35%
40%
2007 2008 2009F 2010F 2011F 2012F
EV/Revenues (x)
0.00
1.00
2.00
3.00
4.00
5.00
2007 2008 2009F 2010F 2011F 2012F
Return on Average Assets (%)
6%
8%
10%
12%
14%
16%
2007 2008 2009F 2010F 2011F 2012F
Return on Average Equity (%)
10%
12%
14%
16%
18%
20%
2007 2008 2009F 2010F 2011F 2012F
Non Core Income as % of PAT (%)
10%
14%
18%
22%
26%
30%
2007 2008 2009F 2010F 2011F 2012F
P/Bv Ratio (x)
0.5
0.8
1.1
1.4
1.7
2.0
2007 2008 2009F 2010F 2011F 2012F
P/E Ratio (x)
4.0
6.0
8.0
10.0
12.0
14.0
2007 2008 2009F 2010F 2011F 2012F
Debt as % of Assets (%)
0%
1%
2%
3%
4%
5%
2007 2008 2009F 2010F 2011F 2012F

Global Research - Oman Global Investment House
Oman Cement Company 1�
Outlook
In 2008 OCC imported clinker and cement to meet local demand under directions of the government, a claim for reimbursement of shortfall in profits below a base level of RO16.1mn after tax will be made during 2009 with the government. OCC has also entered into discretionary portfolio management agreements with two companies appointing them as portfolio managers to handle part of its investments in shares which as of 2008 amount to RO19.5mn.
Chart 15: OCC’s - FCF (RO mn) & FCF to Sales (%)
Source : Company Reports & ’Global’ Research
The company expanded its share of the Oil Well Cement market in the MENA region in 2008 as more and more drilling companies preferred to standardize on the company’s products because of high quality and consistent performance in cementing operations of oil wells. Considering the market demand of new types of cement, OCC has planned to introduce three new products in the year 2009.
According to OCC, the expected demand for cement in Oman is estimated at 4.63mtpa during 2009. In order maintain its market share, OCC installed an additional cement mill of 3,000tpd and is in the process of further expansion by installing new production line of 4,000tpd clinker capacity to meet the competition. With the neck to neck demand supply situation the expansion would pave the way towards a profitable future.
(20.0)
(15.0)
(10.0)
(5.0)
-
5.0
10.0
15.0
20.0
25.0
2003 2004 2005 2006 2007 2008 2009 (F) 2010 (F) 2011 (F) 2012 (F)-30%
-20%
-10%
0%
10%
20%
30%
40%
50%
FCF FCF/Sales

Global Research - Oman Global Investment House
�0 Oman Cement Company
Valuation & Recommendation
DCF Method
In order to compute the cost of equity for the Discounted Cash Flow (DCF) method, we have used the Capital Asset Pricing Model (CAPM).
The following assumptions have been made in order to arrive at the DCF value of Oman Cement Company.
• A risk-free rate of 4.50% has been assumed.
• A market risk premium of 6.0% has been assumed.
• The beta of the company was quite low when computed on the basis of monthly returns over 5 years to end-March 2009, hence we have taken beta of 1.
• The cost of equity derived from the above assumptions using the Capital Asset Pricing Model (CAPM) is 10.51%.
• The cost of debt taken is 6%.
• Based on the above assumptions, the Weighted Average Cost of Capital (WACC) works out to be 9.61%.
• Terminal growth rate of 3.0% has been assumed.
Based on our future earnings projections and the above assumptions for DCF computations, the DCF value of Oman Cement is RO0.769 per share.
Table 07: Oman Cement - Equity Valuation by DCF (RO mn) 2009 (F) 2010 (F) 2011 (F) 2012 (F)
Free Cash Flow (3.61) 8.53 14.46 16.04
Discounted Cash Flow (3.38) 7.28 11.27 11.40
Terminal Value 249.9
WACC 9.6%
Terminal Growth Rate 3.00%
Primary Value 26.6
Discounted Terminal Value 177.6
Value of Investments 46.5 (As at December 2008)
Cash 4.7 (As at December 2008)
Debt 0.9 (As at December 2008)
Equity Value 254.5
No. of Equity Shares Outstanding (mn) 330.9
Per Share Value (RO) 0.769
Source : Global Research

Global Research - Oman Global Investment House
Oman Cement Company �1
Sensitivity Analysis
A sensitivity analysis for different estimated long-run future growth rates and weighted cost of capital (and, thereby, the underlying betas) is shown in table below. The table provides estimated fair values for OCC’s shares based on a range of varying inputs. The shaded area at the center shows the most probable range of alternatives.
Table 08 : Oman Cement - Sensitivity Analysis Terminal Growth Rate
WACC
1.0% 2.0% 3.0% 4.0% 5.0%7.6% 0.801 0.908 1.062 1.300 1.722 8.6% 0.708 0.785 0.889 1.039 1.272 9.6% 0.636 0.694 0.769 0.871 1.017
10.6% 0.580 0.625 0.681 0.754 0.854 11.6% 0.535 0.570 0.613 0.668 0.740
Source: Global Research
Relative Valuation Method
The peer group valuation is performed to compare the intrinsic value of Oman Cement arrived at using the DCF calculation. In order to value Oman Cement using this method, we have used the weighted average price-to-earnings (P/E) multiple for the Oman cement industry, comprising Oman Cement Company and Raysut Cement Company. The price-earnings multiple of a stock is a reflection of various factors, such as the expected profitability of the company, its growth potential as perceived by the market, predictability and sustainability of its revenues, the quality of its earnings and the quality of its management, among others.
To arrive at the peer-set P/E multiple, we have computed the average industry P/E of the two listed cement companies in Oman, based on their current market prices and projected earnings for 2008. The weighted average P/E for the GCC cement industry, thus arrived at, is 8x.
On the basis of the weighted average P/E for the industry and Oman Cement’s projected 2008 earnings, the company’s stock valuation comes to RO0.303per share. However, as the price-earnings multiple varies with time and is dependent on several factors, such as market sentiment and other qualitative factors, we have provided a lower weightage of 20% to the peer valuation method, and 80% weightage to the value arrived at using the DCF method.
Valuations
The value of OCC’s shares derived from the weighted average of the DCF and relative valuation methods is RO0.676 per share. The stock closed at RO0.372 on the Muscat Securities Market at the end of trading on 13th April 2009, which implies that the weighted average value of OCC’s shares is at a premium of 82% to the share’s current market price.
Table 09 : Weighted Average Share Value of Oman Cement (RO) Weightage Fair Value As per DCF Method 80% 0.769 As per Relative Valuation 20% 0.303 Weighted Average Share Value 0.676
Source: Global Research
At their current price, OCC’s shares have a P/E multiple of 10.6x and 7.2x for 2009 and 2010 respectively. We therefore reiterate our BUY recommendation on the scrip.

Global Research - Oman Global Investment House
�� Oman Cement Company
BA
LA
NC
E S
HE
ET
Om
an C
emen
t C
ompa
ny (
RO
) 20
0620
0720
0820
09 (
F)
2010
(F
)20
11 (
F)
2012
(F
) C
ash
& C
ash
Equ
ival
ents
1
,062
,128
2
,214
,961
4
,609
,866
4
,254
,620
5
,840
,876
6
,246
,713
6
,747
,207
B
ank
Bal
ance
s 7
7,57
9 7
7,57
9 1
01,1
73
101
,173
1
01,1
73
101
,173
1
01,1
73
Tra
de R
ecei
vabl
es
4,9
38,4
47
4,7
69,3
08
5,5
68,3
67
5,1
97,2
90
6,5
11,5
01
7,6
39,4
88
9,2
69,9
55
Oth
er R
ecei
vabl
es
1,6
81,0
87
1,3
11,8
76
1,5
41,0
38
1,7
32,4
30
2,0
34,8
44
2,4
00,9
82
3,2
44,4
84
Inv
ento
ries
5
,159
,343
4
,327
,600
1
5,24
3,49
8 1
3,64
3,83
6 1
1,93
8,05
3 1
4,32
7,32
5 1
6,77
7,50
5 S
hort
-ter
m D
epos
its
6,6
20,0
00
18,
085,
650
14,
570,
000
13,
113,
000
11,
801,
700
12,
745,
836
13,
765,
503
Hel
d to
Mat
urity
Inv
estm
ents
1
,131
,965
1
,050
,000
4
22,7
84
380
,506
4
18,5
56
460
,412
5
06,4
53
Tot
al C
urre
nt A
sset
s 2
0,67
0,54
9 3
1,83
6,97
4 4
2,05
6,72
6 3
8,42
2,85
5 3
8,64
6,70
4 43
,921
,929
50
,412
,281
H
eld
to M
atur
ity I
nves
tmen
ts
4,6
54,9
36
3,6
07,8
19
3,1
90,4
94
2,8
71,4
45
3,1
58,5
89
3,4
74,4
48
3,8
21,8
93
Lon
g-te
rm D
epos
its
34,
199,
661
19,
045,
080
12,
390,
075
11,
151,
068
12,
266,
174
13,
492,
792
14,
842,
071
Em
ploy
ee L
oans
5
4,01
2 1
3,46
4,54
3 -
-
-
-
-
I
nves
tmen
ts in
Ass
ocia
tes
283
,953
6
11,0
65
621
,272
6
52,3
36
717
,569
7
89,3
26
868
,259
I
nves
tmen
ts A
vaila
ble-
for-
Sale
1
3,43
4,08
9 2
1,06
6,19
2 1
5,28
6,51
4 1
3,75
7,86
3 1
5,13
3,64
9 1
6,64
7,01
4 1
8,31
1,71
5 G
ross
Fix
ed A
asse
ts
106
,606
,515
1
05,7
17,9
80
123
,942
,149
1
41,9
47,1
49
154
,947
,149
1
58,9
47,1
49
161
,947
,149
L
ess:
Acc
umul
ated
Dep
reci
atio
n 5
7,57
3,78
8 6
1,08
4,96
9 6
4,51
2,24
6 6
8,85
0,22
1 7
3,81
8,37
1 7
9,24
1,52
2 8
4,80
4,67
2 N
et F
ixed
Ass
ets
49,
032,
727
44,
633,
011
59,
429,
903
73,
096,
928
81,
128,
778
79,7
05,6
27
77,1
42,4
77
Tot
al A
sset
s 1
22,3
29,9
27
134
,264
,684
1
32,9
87,0
25
139
,952
,493
1
51,0
51,4
63
158,
031,
136
165,
398,
696
Lia
bilit
ies
Sho
rt-t
erm
Loa
n 4
77,4
29
698
,372
3
00,0
00
3,8
00,0
00
3,4
20,0
00
3,0
78,0
00
2,7
70,2
00
Ban
k B
orro
win
gs
77,
579
135
,330
-
-
-
-
-
T
rade
Pay
able
1
,836
,064
1
,776
,584
2
,592
,012
2
,728
,767
2
,984
,513
3
,183
,850
3
,355
,501
O
ther
Pay
able
s 1
,990
,150
2
,506
,350
4
,531
,318
4
,775
,342
5
,222
,898
5
,571
,738
5
,872
,127
P
rovi
sion
for
Tax
atio
n 3
,092
,798
2
,617
,511
1
,896
,380
1
,706
,742
1
,536
,068
1
,382
,461
1
,244
,215
T
otal
Cur
rent
Lia
bilit
ies
7,4
74,0
20
7,7
34,1
47
9,3
19,7
10
13,
010,
852
13,
163,
479
13,
216,
049
13,
242,
043
Def
erre
d T
axat
ion
4,3
95,2
96
4,2
02,6
84
3,8
73,7
40
2,3
51,1
69
3,4
47,6
78
3,7
68,5
03
4,4
26,5
35
Med
ium
-Ter
m L
oan
2,0
43,3
12
1,5
22,3
69
600
,000
2
,600
,000
2
,340
,000
2
,083
,735
1
,827
,470
E
mpl
oyee
Ind
emni
ty P
rovi
sion
8
78,2
86
1,0
40,4
94
1,2
62,3
27
1,3
12,8
20
1,4
04,7
17
1,5
03,0
48
1,6
08,2
61
Pro
pose
d D
ivid
end
1
1,58
0,54
5 8
,933
,563
7
,279
,200
8
,271
,818
1
3,23
4,90
8 1
6,54
3,63
6 1
9,85
2,36
3 P
aid-
up C
apita
l 3
3,08
7,27
1 3
3,08
7,27
1 3
3,08
7,27
1 3
3,08
7,27
1 3
3,08
7,27
1 3
3,08
7,27
1 3
3,08
7,27
1 S
hare
Pre
miu
m
6,7
24,1
45
6,7
24,1
45
6,7
24,1
45
6,7
24,1
45
6,7
24,1
45
6,7
24,1
45
6,7
24,1
45
Sta
tuto
ry R
eser
ve
11,
029,
090
11,
029,
090
11,
029,
090
11,
029,
090
11,
029,
090
11,
029,
090
11,
029,
090
Vol
unta
ry R
eser
ve
13,
633,
203
15,
434,
896
16,
543,
635
17,
705,
592
19,
406,
565
21,
265,
609
23,
449,
257
Fai
r V
alue
Res
erve
6
,528
,991
1
3,06
5,09
9 7
,250
,172
5
,721
,521
7
,097
,307
8
,610
,672
1
0,27
5,37
3 R
etai
ned
Ear
ning
s 2
4,55
3,58
0 3
1,43
7,04
6 3
5,98
5,91
5 3
8,17
1,70
7 4
0,24
5,56
0 4
0,43
3,31
9 4
0,23
3,78
8 R
eval
uatio
n Su
rplu
s 5
3,88
0 5
3,88
0 3
1,82
0 3
1,82
0 3
1,82
0 3
1,82
0 3
1,82
0 T
otal
Sha
reho
lder
’s E
quity
9
5,61
0,15
9 1
10,8
31,4
27
110
,652
,048
1
12,4
71,1
46
117
,621
,758
12
1,18
1,92
5 12
4,83
0,74
4 T
otal
Lia
bilit
ies
& E
quit
y 1
22,3
29,9
27
134
,264
,684
1
32,9
87,0
25
139
,952
,493
1
51,0
51,4
63
158,
031,
136
165,
398,
696
Sour
ce:
Com
pany
Rep
orts
& G
loba
l Res
earc
h

Global Research - Oman Global Investment House
Oman Cement Company ��
INC
OM
E S
TA
TE
ME
NT
Om
an C
emen
t C
ompa
ny
(R
O)
2006
2007
2008
2009
(F
)20
10 (
F)
2011
(F
)20
12 (
F)
Sal
es R
even
ue
49,
710,
230
49,
911,
507
63,
522,
594
63,
233,
698
74,
271,
809
79,
668,
943
84,
588,
343
Cos
t of
Sale
s (
26,7
57,3
79)
(29
,460
,849
) (
49,6
52,6
65)
(49
,800
,000
) (
54,4
67,3
68)
(58
,105
,263
) (
61,2
37,8
95)
Gro
ss P
rofi
t 2
2,95
2,85
1 2
0,45
0,65
8 1
3,86
9,92
9 1
3,43
3,69
8 1
9,80
4,44
1 2
1,56
3,68
0 2
3,35
0,44
9
Gen
eral
& A
dmin
istr
ativ
e E
xpen
ses
(2,
020,
866)
(2,
638,
844)
(2,
898,
425)
(2,
845,
516)
(3,
342,
231)
(3,
585,
102)
(3,
806,
475)
Ope
rati
ng P
rofi
t 2
0,93
1,98
5 1
7,81
1,81
4 1
0,97
1,50
4 1
0,58
8,18
2 1
6,46
2,21
0 1
7,97
8,57
8 1
9,54
3,97
3
Fin
ance
Cha
rges
(
74,7
78)
(23
,022
) (
66,5
17)
(23
3,50
1) (
230,
251)
(26
2,09
8) (
263,
684)
Oth
er I
ncom
e
38,
067
189
,691
5
81,4
44
523
,300
5
86,0
96
644
,705
7
09,1
76
Int
eres
t Inc
ome
1,6
82,9
53
2,2
59,0
10
1,6
26,1
76
1,4
63,5
58
1,6
09,9
14
1,7
70,9
06
3,7
18,9
02
Div
iden
d In
com
e 6
24,4
06
694
,764
9
48,4
24
726
,109
7
22,2
88
794
,517
8
73,9
68
Sha
re o
f R
esul
t of
Ass
ocia
tes
(27
,782
) (
16,6
16)
47,
003
54,
053
62,
161
71,
486
82,
209
Im
pair
men
t Los
s in
an
Ass
ocia
te/A
sset
-
(
1,21
9,29
9) -
-
-
-
-
Pro
fit
Bef
ore
Tax
atio
n 2
3,17
4,85
1 1
9,69
6,34
2 1
4,10
8,03
4 1
3,12
1,70
2 1
9,21
2,41
8 2
0,99
8,09
3 2
4,66
4,54
4
Tax
atio
n (
2,74
2,76
3) (
2,42
5,92
8) (
1,56
7,43
5) (
1,56
7,44
6) (
2,29
8,45
2) (
2,51
2,33
6) (
2,95
1,02
3)
Min
ority
Int
eres
t 1
23,8
32
348
,309
-
6
5,31
0 9
5,76
9 1
04,6
81
122
,959
Net
Pro
fit
20,
555,
920
17,
618,
723
12,
540,
599
11,
619,
566
17,
009,
735
18,
590,
438
21,
836,
480
P&
L A
ppro
pria
tion
Acc
ount
:
Op
Bal
ance
of
Ret
aine
d E
arni
ngs
17,
633,
797
24,
553,
580
31,
437,
046
35,
985,
915
38,
171,
707
40,
245,
560
40,
433,
319
Adj
ustm
ents
-
-
3
96,2
09
-
-
-
-
Net
Pro
fit f
or th
e ye
ar
20,
555,
920
17,
618,
723
12,
540,
599
11,
619,
566
17,
009,
735
18,
590,
438
21,
836,
480
Tra
nsfe
r to
Vol
unta
ry R
eser
ve
2,0
55,5
92
1,8
01,6
93
1,1
08,7
39
1,1
61,9
57
1,7
00,9
73
1,8
59,0
44
2,1
83,6
48
Pro
pose
d D
ivid
end
1
1,58
0,54
5 8
,933
,563
7
,279
,200
8
,271
,818
1
3,23
4,90
8 1
6,54
3,63
6 1
9,85
2,36
3
Clo
sing
Bal
ance
of
Ret
aine
d E
arni
ngs
24,
553,
580
31,
437,
046
35,
985,
915
38,
171,
707
40,
245,
560
40,
433,
319
40,
233,
788
Sour
ce:
Com
pany
Rep
orts
& G
loba
l Res
earc
h

Global Research - Oman Global Investment House
�� Oman Cement Company
CA
SH F
LO
W S
TA
TE
ME
NT
Om
an C
emen
t C
ompa
ny (
RO
) 20
0620
0720
0820
09 (
F)
2010
(F
)20
11 (
F)
2012
(F
) O
pera
ting
O
pera
ting
Act
iviti
es
25,
280,
514
21,
959,
295
16,
380,
673
12,
220,
294
20,
735,
736
21,
799,
646
23,
490,
274
Net
Pro
fit
20,
555,
920
17,
618,
723
12,
540,
599
11,
619,
566
17,
009,
735
18,
590,
438
21,
836,
480
Def
erre
d T
ax L
iabi
lity
2,7
42,7
63
2,4
25,9
28
-
(1,
522,
571)
1,0
96,5
10
320
,825
6
58,0
31
Tax
Pai
d -
-
1
,567
,435
(
189,
638)
(17
0,67
4) (
153,
607)
(13
8,24
6) D
epre
ciat
ion
3,6
89,0
29
3,8
62,7
87
3,9
50,0
36
4,3
37,9
75
4,9
68,1
50
5,4
23,1
50
5,5
63,1
50
Im
pair
men
t of
Ass
ets
-
784
,506
-
-
-
-
-
I
nter
est I
ncom
e (
1,68
2,95
3) (
2,44
8,70
1) (
2,15
3,15
1) (
1,46
3,55
8) (
1,60
9,91
4) (
1,77
0,90
6) (
3,71
8,90
2) D
ivid
end
Inco
me
(62
4,40
6) (
694,
764)
(94
8,42
4) (
726,
109)
(72
2,28
8) (
794,
517)
(87
3,96
8) F
inan
ce C
harg
es
12,
271
80,
825
66,
517
233
,501
2
30,2
51
262
,098
2
63,6
84
Pro
pose
d R
emun
erat
ion
to D
irec
tors
1
10,0
00
-
-
-
-
-
-
Am
ortiz
atio
n of
Bon
d Pr
emiu
m
(2,
090)
(2,
884)
(5,
457)
-
-
-
-
Oth
er A
mor
tizat
ions
-
2
70,8
19
-
-
-
-
-
Sha
re o
f R
esul
ts o
f A
ssoc
iate
Cos
. 2
7,78
2 1
6,61
6 (
47,0
03)
(54
,053
) (
62,1
61)
(71
,486
) (
82,2
09)
Gai
n on
Sal
e of
Pro
pert
y, P
lant
and
Equ
ip
-
-
(3,
820)
-
-
-
-
Gai
n fr
om S
ale
of I
nves
tmen
ts
-
-
(50
,649
) -
-
-
-
P
rovi
sion
s fo
r St
ores
, etc
. 4
86,3
89
171
,574
1
,204
,551
-
-
-
-
M
inor
ity I
nter
est
(12
3,83
2) (
348,
309)
-
(65
,310
) (
95,7
69)
(10
4,68
1) (
122,
959)
Ind
emni
ty
89,
641
222
,175
2
60,0
39
50,
493
91,
897
98,
330
105
,213
W
orki
ng C
apita
l 5
37,1
22
1,3
86,8
46
(10
,149
,386
) 2
,160
,127
7
92,4
59
(3,
335,
220)
(4,
452,
110)
Dec
/(in
c.)
in R
ecei
vabl
es
640
,132
-
(
1,11
9,47
9) 1
79,6
85
(1,
616,
625)
(1,
494,
124)
(2,
473,
970)
Dec
/ (i
nc)
in I
nven
tori
es
658
,969
6
60,1
69
(12
,120
,449
) 1
,599
,662
1
,705
,782
(
2,38
9,27
2) (
2,45
0,18
0) I
nc/(
dec)
in A
ccou
nts
Paya
ble
(1,
153,
875)
456
,720
3
,114
,136
1
36,7
55
255
,746
1
99,3
37
171
,651
I
nc/(
dec)
Oth
er C
urre
nt L
iabi
litie
s 3
91,8
96
-
-
244
,024
4
47,5
56
348
,839
3
00,3
89
Inc
/(de
c) O
ther
Cur
rent
Ass
ets
-
269
,957
(
23,5
94)
-
-
-
-
Inc
ome
Tax
Pai
d (
2,74
5,84
5) (
3,09
3,82
7) (
2,61
7,51
1) -
-
-
-
F
inan
cial
Cha
rges
Pai
d (
88,0
00)
(80
,825
) (
66,5
17)
-
-
-
-
Em
ploy
ee B
enef
its P
aid
(67
,990
) (
59,9
67)
(32
,803
) -
-
-
-
T
otal
Ope
rati
ng
22,
915,
801
20,
111,
522
3,5
14,4
56
14,
380,
421
21,
528,
195
18,
464,
426
19,
038,
164
Inv
esti
ng
Cap
ex
(23
6,10
5) (
518,
396)
(19
,807
,857
) (
18,0
05,0
00)
(13
,000
,000
) (
4,00
0,00
0) (
3,00
0,00
0) A
dvan
ce f
or P
urch
ase
of P
PE
(7,
078,
035)
-
-
12,
041
-
-
-
Div
iden
d In
com
e 1
,405
,834
-
-
7
26,1
09
722
,288
7
94,5
17
873
,968
M
atur
ity o
f L
ong-
Ter
m L
oans
4
,664
,981
1
,131
,966
1
,050
,000
-
-
-
-
I
nter
est I
ncom
e -
2
,714
,280
2
,215
,150
1
,463
,558
1
,609
,914
1
,770
,906
3
,718
,902
D
ivid
end
Rec
eive
d 6
22,3
06
694
,764
9
48,4
24
-
-
-
-
Loa
ns
-
-
-
361
,328
(
325,
195)
(35
7,71
5) (
393,
486)
Rec
all o
f Sh
ort-
term
Dep
osits
1
7,19
6,50
0 -
-
-
-
-
-
L
ong-
term
Dep
osits
(
9,61
7,32
0) 3
,688
,931
1
0,17
0,65
5 1
,239
,008
(
1,11
5,10
7) (
1,22
6,61
7) (
1,34
9,27
9) P
roce
eds
from
Dis
posa
l of
Prop
erty
-
-
3
,820
-
-
-
-
S
hort
-ter
m D
epos
its
(20
,815
,000
) (
13,4
07,7
17)
13,
489,
140
1,4
57,0
00
1,3
11,3
00
(94
4,13
6) (
1,01
9,66
7) I
nves
tmen
ts in
Ass
ocia
tes/
Subs
idia
ries
(
115,
624)
(34
3,72
8) 8
0,00
0 2
2,99
0 (
3,07
2) (
271)
3,2
76
Inv
estm
ents
Ava
ilabl
e fo
r Sa
le
-
(1,
095,
995)
(35
,249
) -
-
-
-
I
POs
& R
ight
s Is
sue
Subs
crip
tions
(
523,
007)
-
-
-
-
-
-
Cap
ital R
educ
tion
in A
FS I
nves
tmen
ts
2,0
00
-
-
-
-
-
-
Tot
al I
nves
ting
(
14,4
93,4
70)
(7,
135,
895)
8,1
14,0
83
(12
,722
,966
) (
10,7
99,8
72)
(3,
963,
317)
(1,
166,
286)
Fin
anci
ng
Cas
h Fl
ow f
rom
Dis
cont
inue
d O
pera
tions
-
5
7,75
1 -
-
-
-
-
R
ight
s Is
sue
of S
hare
s 1
81,2
50
-
-
-
-
-
-
Div
iden
d (
8,27
1,81
8) (
11,5
80,5
45)
(8,
933,
563)
(7,
279,
200)
(8,
271,
818)
(13
,234
,908
) (
16,5
43,6
36)
Ter
m-l
oan
Rep
aym
ents
(
259,
550)
(30
0,00
0) (
300,
000)
5,5
00,0
00
(64
0,00
0) (
598,
265)
(56
4,06
5) F
inan
ce C
harg
es
(12
,271
) -
-
(
233,
501)
(23
0,25
1) (
262,
098)
(26
3,68
4) T
otal
Fin
anci
ng
(8,
362,
389)
(11
,822
,794
) (
9,23
3,56
3) (
2,01
2,70
0) (
9,14
2,06
8) (
14,0
95,2
71)
(17
,371
,384
) N
et C
hang
e in
Cas
h 5
9,94
2 1
,152
,833
2
,394
,975
(
355,
245)
1,5
86,2
55
405
,837
5
00,4
94
Net
Cas
h at
Beg
inni
ng
1,0
02,1
86
1,0
62,1
28
2,2
14,9
61
4,6
09,8
66
4,2
54,6
20
5,8
40,8
76
6,2
46,7
13
Dis
cont
inue
d O
pera
tions
-
-
(
71)
-
-
-
-
Net
Cas
h at
End
1
,062
,128
2
,214
,961
4
,609
,866
4
,254
,620
5
,840
,876
6
,246
,713
6
,747
,207
So
urce
: C
ompa
ny R
epor
ts &
Glo
bal R
esea
rch

Global Research - Oman Global Investment House
Oman Cement Company ��
FACT SHEETOman Cement Company
2006 2007 2008 2009 (F) 2010 (F) 2011 (F) 2012 (F)
Liquidity Ratios
Current Ratio (x) 2.8 4.1 4.5 3.0 2.9 3.3 3.8
Quick Ratio (x) 2.1 3.6 2.9 1.9 2.0 2.2 2.5
Inventory Stock (Days) 78 59 72 106 86 82 93
Receivables Outstanding (Days) 33 35 30 31 29 32 36
Length of Operating Cycle (Days) 111 94 102 137 114 115 129
Payables Outstanding (Days) 32 22 16 19 19 19 19
Length of Cash Cycle (Days) 78 72 86 117 95 96 110
Profitability Ratios
Total Asset Turnover (x) 0.4 0.4 0.5 0.5 0.5 0.5 0.5
Total Net Fixed Asset Turnover (x) 1.0 1.1 1.1 0.9 0.9 1.0 1.1
Equity Turnover (x) 0.6 0.5 0.6 0.6 0.6 0.7 0.7
Gross Profit Margin (%) 46.2 41.0 21.8 21.2 26.7 27.1 27.6
Operating Margin (%) 42.1 35.7 17.3 16.7 22.2 22.6 23.1
Net Profit Margin (%) 41.4 35.3 19.7 18.4 22.9 23.3 25.8
Return on Average Assets (%) 17.8 13.7 9.4 8.5 11.7 12.0 13.5
Return on Average Equity (%) 22.8 17.1 11.3 10.4 14.8 15.6 17.8
Activity Ratios
Inventory Turnover Ratio (x) 4.7 6.2 5.1 3.4 4.3 4.4 3.9
Debtor Turnover Ratio (x) 11.2 10.3 12.3 11.7 12.7 11.3 10.0
Creditors Turnover Ratio (x) 11.2 16.3 22.7 18.7 19.1 18.8 18.7
Leverage Ratios
Debt / Equity (x) 0.03 0.02 0.01 0.06 0.05 0.04 0.04
Current Liabilities / Equity (x) 0.08 0.07 0.08 0.12 0.11 0.11 0.11
Liabilities / Total Assets (x) 0.22 0.17 0.17 0.20 0.22 0.23 0.25
Ratios Used for Valuation
EPS (RO) 0.06 0.05 0.04 0.04 0.05 0.06 0.07
Book Value Per Share (RO) 0.29 0.33 0.33 0.34 0.36 0.37 0.38
EV/Revenues (x) 3.9 4.4 1.5 2.0 1.7 1.5 1.4
Market Price (RO) * 0.58 0.66 0.30 0.37 0.37 0.37 0.37
Market Capitalization (RO mn) 191.9 219.7 99.6 123.1 123.1 123.1 123.1
EV/Ton (RO) 153.5 117.6 51.3 67.0 47.3 46.9 46.5
EV/EBITDA (x) 7.2 9.3 5.3 7.1 5.0 4.6 4.0
Dividend Yield (%) 6.0% 4.1% 7.3% 6.7% 10.8% 13.4% 16.1%
P/E Ratio (x) 9.3 12.5 7.9 10.6 7.2 6.6 5.6
P/BV Ratio (x) 2.0 2.0 0.9 1.1 1.0 1.0 1.0
Source: Company Reports & Global Research * Market price for 2009 and subsequent years as per closing price on MSM on April 13, 2009.

Global Research - Oman Global Investment House
�� Oman Cement Company
This Page is Intentionally Left Blank

Global Research - Oman Global Investment House
Oman Cement Company ��
This Page is Intentionally Left Blank
Global Research - Oman Global Investment House
�� Oman Cement Company
The following is a comprehensive list of disclosures which may or may not apply to all our researches. Only the relevant disclosures which apply to this particular research has been mentioned in the table below under the heading of disclosure.
1. Global Investment House did not receive and will not receive any compensation from the company or anyone else for the preparation of this report.
2. The company being researched holds more than 5% stake in Global Investment House.3. Global Investment House makes a market in securities issued by this company.4. Global Investment House acts as a corporate broker or sponsor to this company.5. The author of or an individual who assisted in the preparation of this report (or a member of his/her
household) has a direct ownership position in securities issued by this company.6. An employee of Global Investment House serves on the board of directors of this company.7. Within the past year , Global Investment House has managed or co-managed a public offering for
this company, for which it received fees.8. Global Investment House has received compensation from this company for the provision of
investment banking or financial advisory services within the past year.9. Global Investment House expects to receive or intends to seek compensation for investment banking
services from this company in the next three month.10. Please see special footnote below for other relevant disclosures.
This material was produced by Global Investment House KSCC (‘Global’),a firm regulated by the Central Bank of Kuwait. This document is not to be used or considered as an offer to sell or a solicitation of an offer to buy any securities. Global may, from time to time,to the extent permitted by law, participate or invest in other financing transactions with the issuers of the securities (‘securities’), perform services for or solicit business from such issuer, and/or have a position or effect transactions in the securities or options thereof. Global may, to the extent permitted by applicable Kuwaiti law or other applicable laws or regulations, effect transactions in the securities before this material is published to recipients.Information and opinions contained herein have been compiled or arrived by Global from sources believed to be reliable, but Global has not independently verified the contents of this document. Accordingly, no representation or warranty, express or implied, is made as to and no reliance should be placed on the fairness, accuracy, completeness or correctness of the information and opinions contained in this document. Global accepts no liability for any loss arising from the use of this document or its contents or otherwise arising in connection therewith. This document is not to be relied upon or used in substitution for the exercise of independent judgement. Global shall have no responsibility or liability whatsoever in respect of any inaccuracy in or ommission from this or any other document prepared by Global for, or sent by Global to any person and any such person shall be responsible for conducting his own investigation and analysis of the information contained or referred to in this document and of evaluating the merits and risks involved in the securities forming the subject matter of this or other such document.Opinions and estimates constitute our judgment and are subject to change without prior notice.Past performance is not indicative of future results. This document does not constitute an offer or invitation to subscribe for or purchase any securities, and neither this document nor anything contained herein shall form the basis of any contract or commitment whatsoever. It is being furnished to you solely for your information and may not be reproduced or redistributed to any other person.Neither this report nor any copy hereof may be distributed in any jurisdiction outside Kuwait where its distribution may be restricted by law. Persons who receive this report should make themselves aware of and adhere to any such restrictions. By accepting this report you agree to be bound by the foregoing limitations.
Disclosure Checklist
Oman Cement Company
Company Recommendation
Buy
Ticker
OCCO.OM (Reuters)OCOI OM (Bloomberg)
Price Disclosure
1, 10RO0.372
Global Research: Equity Ratings Definitions
Buy
Hold
Reduce
Sell
Global Rating Definition
Fair value of the stock is >10% from the current market price
Fair value of the stock is between +10% and -10% from the current market price
Fair value of the stock is between -10% and -20% from the current market price
Fair value of the stock is < -20% from the current market price
Top Related