


Languages
Pages
Legal


OLD MUTUAL GLOBAL EMERGING MARKETSFEROZ BASA

o Introductiono Global Emerging Markets
o Old Mutual Global Emerging Marketso Teamo Philosophyo Processo Investment Research Processo Portfolio Constructiono Performance
o Conclusion
AGENDA
2|

WHY GLOBAL EMERGING MARKETS
Source: Economist Intelligence Unit; Consensus Economics, as of September 30, 215
World Land Mass74%
World Population81%
World GDP37%
World Market Capitalization31%
Emerging MarketsRest of the World
EMERGING MARKETS VS REST OF THE WORLD

4
Young
Active
Retired
Population pyramids- Developed regions-2015Population pyramids- Emerging regions-2015
CONTRACTING POPULATION RAPIDLY EXPANDING POPULATION
Emerging markets structurally superior population dynamicsPOPULATION DYNAMICS- DEVELOPED MARKETS VS EMERGING MARKETS
Developed markets face shrinkingworkforce & consumer population
Emerging markets face expanding workforce & consumer population

5
CONSUMPTION SHIFTS TO EMERGING MARKETS
Source: Angus Maddison, founder of Groningen Growth & Development Centre, University of Groningen; Homi Kharas, senior fellow at Wolfensohn Center for Development at Brookings Institution; McKinsey Global Institute analysis
WORLD CONSUMPTION, $ TRILLION
2010 20250
20
40
60
80
100
26 34
12
30
Emerging MarketsDeveloped Markets
38
64
250% Growth
30% Growth

• Trading on depressed earnings
• With low valuation multiples
• And historically undervalued currencies
WHY GLOBAL EMERGING MARKETS

EMERGING MARKET PROFIT MARGINS AT 20 YEAR LOWS
7|
Source: BCA Research Inc.

EMERGING MARKET SHILLER PE’S AT 10 YEAR LOWS
8|
Source: BCA Research Inc.

EMERGING MARKET CURRENCIES LOOK RELATIVELY UNDERVALUED
*Equity market-cap weighted aggregate of 18 emerging economies2006 2008 2010 2012 2016201420042002200019981996
121.5
109.9
99.5
90.0
81.5
73.7
66.7
148.4
134.3
121.5
109.9
99.5
90.0
66.7
81.5
73.7
Source: BCA Research Inc.6|

SA NOW TRADING ON A 25% PREMIUM TO EMERGING MARKETS
96 98 00 02 04 06 08 10 12 14 165
7
9
11
13
15
17
19
21
South AfricaEmerging Markets
SOUTH AFRICA VS EM 12M FWD PE
Source: Citi Research, MSCI, Datastream10|

EMERGING MARKETS VS. DEVELOPED MARKETS VALUATIONS
Source: Citi Research, MSCI, Datastream
EM VS DM PRICE TO BOOK RELATIVE
02 03 04 06 07 08 10 11 12 14 15 160.50
0.75
1.00
1.25
Average
EM VS DM 12M FORWARD P/E RELATIVE
02 03 04 06 07 08 10 11 12 14 15 160.50
0.75
1.00
1.25
Average
8|
WHY THE OLD MUTUALGEM FUND
A consistent philosophyand a disciplinedresearch process
has deliveredtop quartile performance
over all periods.

o Emerging Markets team based in an Emerging Marketo Experienced in investing in transforming economies, politically volatile countries & currencies.o Experienced in seeing companies evolve from start-ups to highly profitable entities.
o Disciplinedo Performance consistent with philosophyo Bottom up valuation focused manager
o Focuso Concentrated portfolio with multiple risk management overlays
o Performance driven culture and peopleo Performance aligned incentiveso Extreme focus on idea generation
WHY OLD MUTUAL GLOBAL EMERGING MARKETS FUND
13|
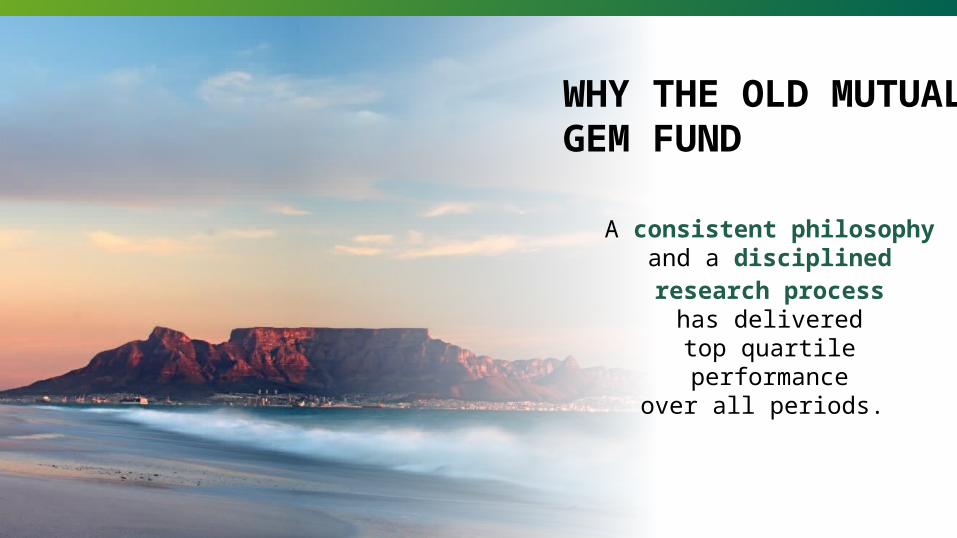
OLD MUTUAL GLOBAL EMERGING MARKETS TEAM
Tinyiko Ngwenya Rian le Roux Johann Els
Siboniso Nxumalo (B.Com (Hons), MBA 9 yrs) Feroz Basa (B.Com (Hons) 13 yrs) Wium Malan (B.Acc (Hons), CA(SA), CFA 8 yrs) Sharief Pansarey (B.Com 8 yrs) Izak Swanepoel (B.Com CA(SA), CFA 15 yrs) Lynn Klaase (BBusSc, PGDA 1 year)
Equity Trading Compliance Legal Advanced IT Risk Management Investment Administration
TEAM CREDENTIALSOMIG’S ECONOMICRESEARCH TEAM
OMIG’SINFRASTRUCTURAL PLATFORM
IZAK SWANEPO
EL
WIUM MALAN
SIBONISO
NXUMALO
SHARIEF PANSARE
Y
FEROZ BASA
LYNNKLAAS
E
14|
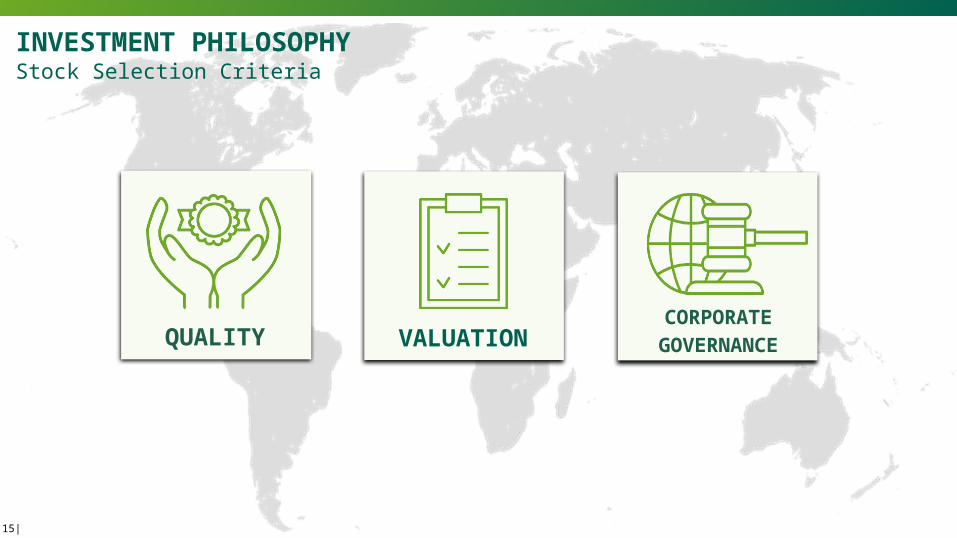
Stock Selection CriteriaINVESTMENT PHILOSOPHY
15|
QUALITY
VALUATION
CORPORATEGOVERNANCE
INVESTMENT PHILOSOPHY
16|
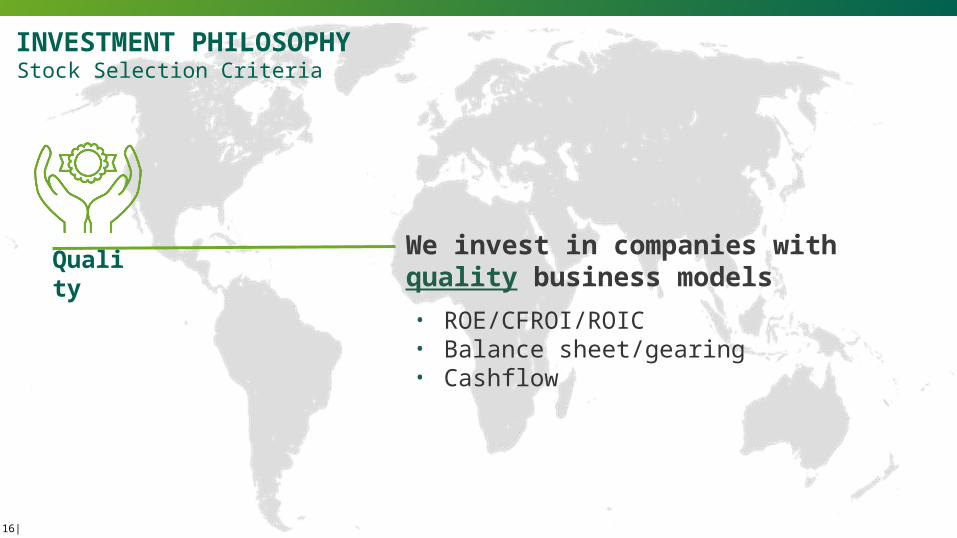
Stock Selection Criteria
Quality
We invest in companies with quality business models• ROE/CFROI/ROIC• Balance sheet/gearing• Cashflow
INVESTMENT PHILOSOPHY
17|
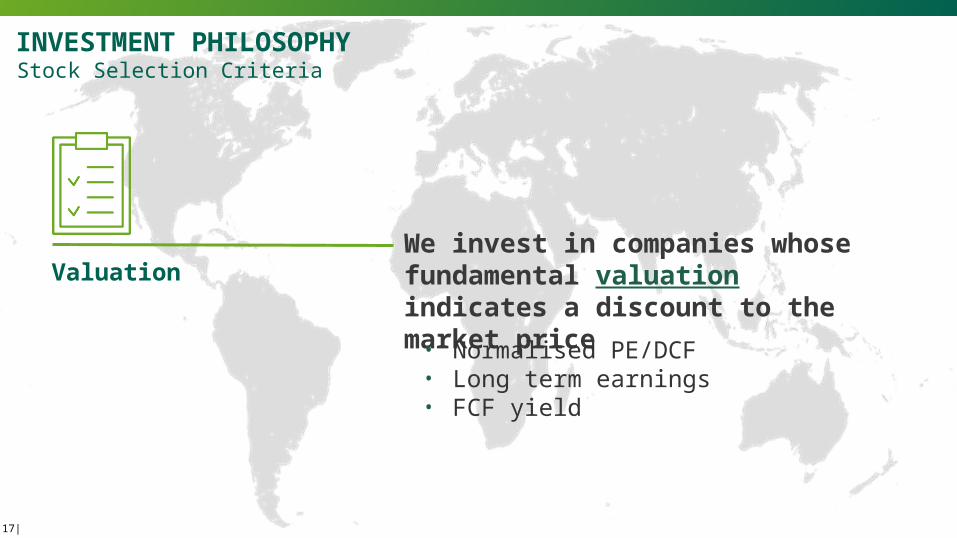
Stock Selection Criteria
ValuationWe invest in companies whose fundamental valuation indicates a discount to the market price• Normalised PE/DCF• Long term earnings• FCF yield
INVESTMENT PHILOSOPHY
18|
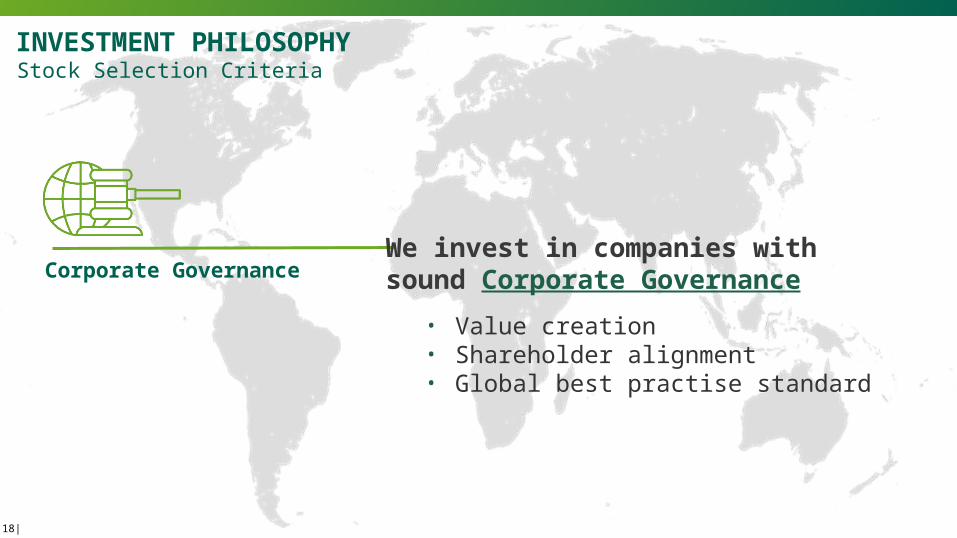
Stock Selection Criteria
Corporate GovernanceWe invest in companies withsound Corporate Governance
• Value creation• Shareholder alignment• Global best practise standard

INVESTMENT PROCESS
DEFINE THE INVESTMENT UNIVERSE = > 6000 SHARES
INITIAL FILTER FOR DATA QUALITY/AVAILABILITY
= 2000 SHARESMULTI FACTOR QUANT SCREEN
(60% QUALITY & 40% VALUATION)= 200 SHARES
FUNDAMENTAL ANALYSIS
**MSCI DM: Fund invests in stocks listed in DM who >50% of its revenue, profits or equity is generated in Emerging Markets
1
2
3
4
5
Analysts assigned to companies.Start with Corporate Governance assessments then fundamental research (company/competitor visits),valuation work.
Analyst presents their research to the team. Rigorous debate, sensitivities, scenarios & investment decision
PORTFOLIO40-60
BEST IDEAS
19|
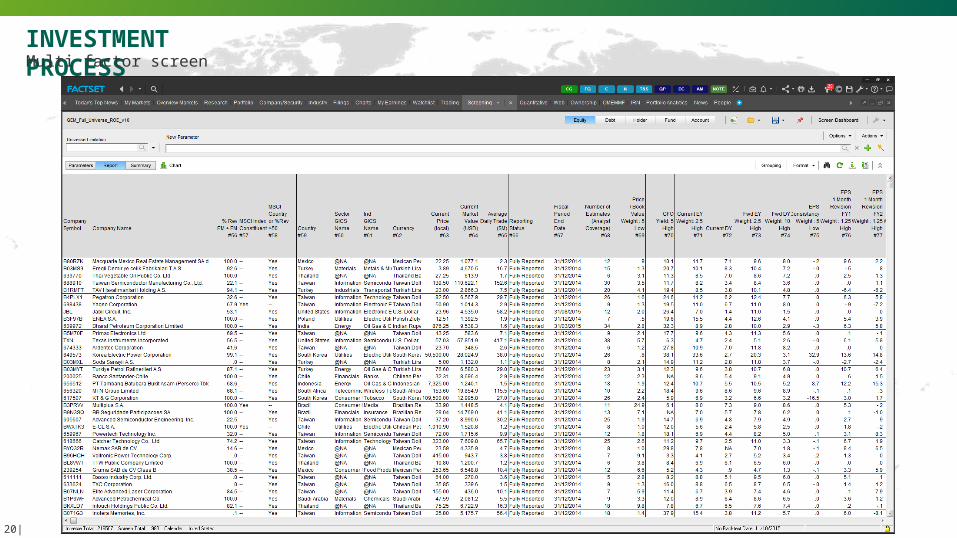
INVESTMENT PROCESSMulti factor screen
20|
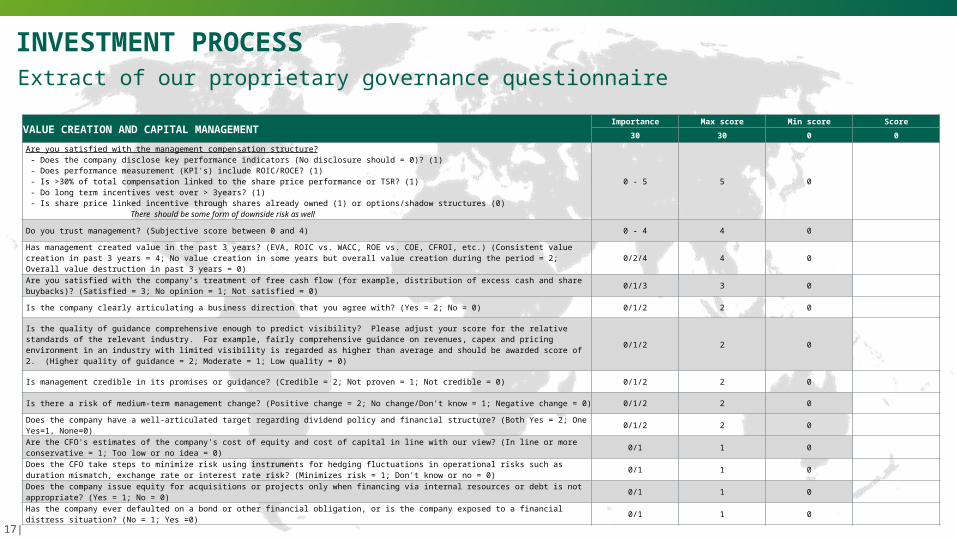
Extract of our proprietary governance questionnaireINVESTMENT PROCESS
VALUE CREATION AND CAPITAL MANAGEMENT Importance Max score Min score Score30 30 0 0
Are you satisfied with the management compensation structure? - Does the company disclose key performance indicators (No disclosure should = 0)? (1) - Does performance measurement (KPI's) include ROIC/ROCE? (1) - Is >30% of total compensation linked to the share price performance or TSR? (1) - Do long term incentives vest over > 3years? (1) - Is share price linked incentive through shares already owned (1) or options/shadow structures (0) There should be some form of downside risk as well
0 - 5 5 0
Do you trust management? (Subjective score between 0 and 4) 0 - 4 4 0
Has management created value in the past 3 years? (EVA, ROIC vs. WACC, ROE vs. COE, CFROI, etc.) (Consistent value creation in past 3 years = 4; No value creation in some years but overall value creation during the period = 2; Overall value destruction in past 3 years = 0) 0/2/4 4 0
Are you satisfied with the company’s treatment of free cash flow (for example, distribution of excess cash and share buybacks)? (Satisfied = 3; No opinion = 1; Not satisfied = 0) 0/1/3 3 0
Is the company clearly articulating a business direction that you agree with? (Yes = 2; No = 0) 0/1/2 2 0
Is the quality of guidance comprehensive enough to predict visibility? Please adjust your score for the relative standards of the relevant industry. For example, fairly comprehensive guidance on revenues, capex and pricing environment in an industry with limited visibility is regarded as higher than average and should be awarded score of 2. (Higher quality of guidance = 2; Moderate = 1; Low quality = 0)
0/1/2 2 0
Is management credible in its promises or guidance? (Credible = 2; Not proven = 1; Not credible = 0) 0/1/2 2 0
Is there a risk of medium-term management change? (Positive change = 2; No change/Don't know = 1; Negative change = 0) 0/1/2 2 0
Does the company have a well-articulated target regarding dividend policy and financial structure? (Both Yes = 2; One Yes=1, None=0) 0/1/2 2 0 Are the CFO's estimates of the company's cost of equity and cost of capital in line with our view? (In line or more conservative = 1; Too low or no idea = 0) 0/1 1 0
Does the CFO take steps to minimize risk using instruments for hedging fluctuations in operational risks such as duration mismatch, exchange rate or interest rate risk? (Minimizes risk = 1; Don't know or no = 0) 0/1 1 0
Does the company issue equity for acquisitions or projects only when financing via internal resources or debt is not appropriate? (Yes = 1; No = 0) 0/1 1 0 Has the company ever defaulted on a bond or other financial obligation, or is the company exposed to a financial distress situation? (No = 1; Yes =0) 0/1 1 0
17|
INVESTMENT PROCESS
**MSCI DM: Fund invests in stocks listed in DM who >50% of its revenue, profits or equity is generated in Emerging Markets
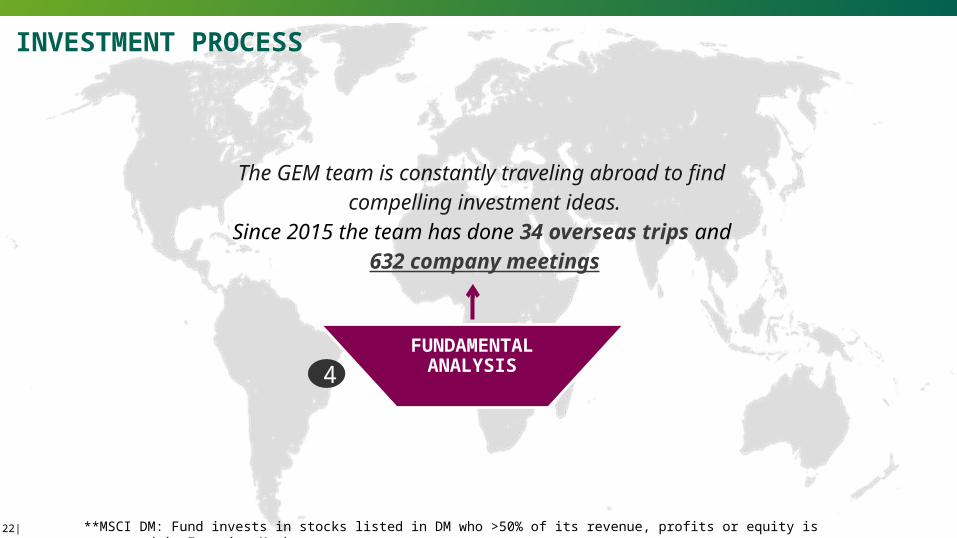
4FUNDAMENTAL
ANALYSIS
The GEM team is constantly traveling abroad to find compelling investment ideas.
Since 2015 the team has done 34 overseas trips and 632 company meetings
22|

Lenovo initiation INVESTMENT RESEARCH PROCESS
23|

INVESTMENT PROCESS
DEFINE THE INVESTMENT UNIVERSE = > 6000 SHARES
INITIAL FILTER FOR DATA QUALITY/AVAILABILITY
= 2000 SHARESMULTI FACTOR QUANT SCREEN
(60% QUALITY & 40% VALUATION)= 200 SHARES
FUNDAMENTAL ANALYSIS
**MSCI DM: Fund invests in stocks listed in DM who >50% of its revenue, profits or equity is generated in Emerging Markets
1
2
3
4
5
Analysts assigned to companies.Start with Corporate Governance assessments then fundamental research (company/competitor visits),valuation work.
Analyst presents their research to the team. Rigorous debate, sensitivities, scenarios & investment decision
PORTFOLIO40-80
BEST IDEAS
24|

INVESTMENT PROCESS-PORTFOLIO CONSTRUCTION
**MSCI DM: Fund invests in stocks listed in DM who >50% of its revenue, profits or equity is generated in Emerging Markets
5 Analyst presents their research to the team. Rigorous debate, sensitivities, scenarios & investment decision
PORTFOLIO40-80
BEST IDEAS
PORTFOLIO40-80
BEST IDEAS
Risk Controls
≤ 5% Single Position at cost≤ 6% Active bet± 8% Country tilt ± 6%-9% Tracking error
25|

o X Axis: Countries ranked by historical volatilityo Y Axis: Earnings ranked by cyclicality/betao Country correlation consideredo Position size considered within risk metrics
Matrix approach to diversification & risk management PORTFOLIO CONSTRUCTION
Source: Old Mutual Investment Group & MSCI * Over/underweight % relative to MSCI GEM index
Countries ranked by volatility/stability
Earnings ranked by
volatility/stability
Country A(most stable)
Country B Country C(most volatile)
Earnings A(most stable) “Safe area”
Earnings B
Earnings C(most
volatile)“Risky area”
28|

o Fund targets holding 40 – 80 shares
o Average share weight thus ± 2%
o Share weights adjusted for various risk and return factors (see example to right)
o Maximum weight ± 5% - 6%
o Risk parameters
≤ 5% Single Position at cost≤ 6% Active bet± 8% Country tilt
Individual stock weighting criteriaPORTFOLIO CONSTRUCTION PROCESS
Lenovo(China)
BB Seguridade
(Brazil)Average Weight - meets OMIG investment philosophy (high Quality, attractive Valuation and good Governance)
2% 2%
EXAMPLE OF CRITERIA THAT REDUCE POTENTIAL WEIGHTINGGovernment owned, highly regulated or potentially regulated industry -1%
Average governance/alignment with minority shareholders Single product, small cap, limited history High exposure to operational risk (labour unrest, disease, volatile commodity prices)Financial risk (excessive gearing, complicated derivatives)
EXAMPLE OF CRITERIA THAT INCREASE POTENTIAL WEIGHTINGHigh conviction and large margin of safety in fundamental valuation +1%
Diversified via multi-region/country revenue streams +1%Diversified via multi-product revenue streams +1%Large competitive advantage – pricing power, barriers to entry, strong brand positioning +1%
Global/regional leader +1% +0.5%Very high growth potential (not priced into stock) +0.5%
Maximum Weight (capped at ± 5% - 6%) 6% 3%29|
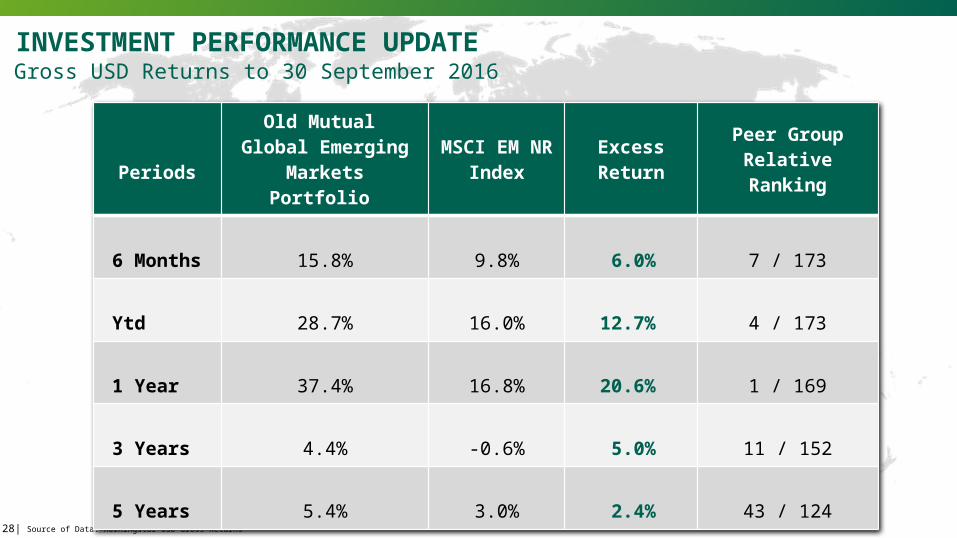
Gross USD Returns to 30 September 2016INVESTMENT PERFORMANCE UPDATE
28| Source of Data: Morningstar USD Gross Returns
PeriodsOld Mutual
Global Emerging Markets Portfolio
MSCI EM NR Index
Excess Return
Peer Group Relative Ranking
6 Months 15.8% 9.8% 6.0% 7 / 173
Ytd 28.7% 16.0% 12.7% 4 / 173
1 Year 37.4% 16.8% 20.6% 1 / 169
3 Years 4.4% -0.6% 5.0% 11 / 152
5 Years 5.4% 3.0% 2.4% 43 / 124

Latest Top 10 holdingsOLD MUTUAL GLOBAL EMERGING MARKETS
HOLDING COMPANY WEIGHTING
1 Taiwan Semiconductor Manufacturing 4.22 Samsung Electronics 3.93 Sino Biopharmaceutical 3.24 Tata Motors Limited Sponsored 3.15 Hyundai Motor Co 3.06 Magnit 2.97 Kroton Educacional S.A. 2.88 JD.Com 2.79 X5 Retail Group 2.610 Lenovo Group Limited 2.4
29|

CONCLUSIONo Why GEM now?
• Depressed earnings
• Low valuation multiples
• Historically undervalued currencies
o GEM is attractively valued relative to Developed Marketso Old Mutual Global Emerging Markets Fund provides investors access
• To world class companies• In the fastest growing economies • At attractive valuations
30|
REGULATORY INFORMATIONOld Mutual Investment Group (Pty) Limited
Physical Address: Mutualpark, Jan Smuts Drive, Pinelands, 7405
Telephone number: +27 21 509 5022Old Mutual Investment Group (Pty) Limited (Reg No 1993/003023/07) is a licensed financial services provider, FSP 604, approved by the Registrar of Financial Services Providers (www.fsb.co.za) to provide intermediary services and advice in terms of the Financial Advisory and Intermediary Services Act 37 of 2002.
Market fluctuations and changes in rates of exchange or taxation may have an effect on the value, price or income of investments. Since the performance of financial markets fluctuates, an investor may not get back the full amount invested. Past performance is not necessarily a guide to future investment performance. The investment portfolios may be market-linked or policy based. Investors’ rights and obligations are set out in the relevant contracts. In respect of pooled, life wrapped products, the underlying assets are owned by Old Mutual Life Assurance Company (South Africa) Limited who may elect to exercise any votes on these underlying assets independently of Old Mutual Investment Group. In respect of these products, no fees or charges will be deducted if the policy is terminated within the first 30 days. Returns on these products depend on the performance of the underlying assets.
Disclosures: Personal trading by staff is restricted to ensure that there is no conflict of interest. All directors and those staff who are likely to have access to price sensitive and unpublished information in relation to the Old Mutual Group are further restricted in their dealings in Old Mutual shares. All employees of the Old Mutual Investment Group are remunerated with salaries and standard incentives. Unless disclosed to the client, no commission or incentives are paid by the Old Mutual Investment Group to any persons other than its representatives. All inter-group transactions are done on an arms length basis. We outsource investment administration of our local funds to Curo Fund Services (Pty) Ltd, 50% of which is owned by the Old Mutual Investment Group.
Disclaimer: The contents of this document and, to the extent applicable, the comments by presenters do not constitute advice as defined in FAIS. Although due care has been taken in compiling this document, Old Mutual Investment Group does not warrant the accuracy of the information contained herein and therefore does not accept any liability in respect of any loss you may suffer as a result of your reliance thereon. The processes, policies and business practices described may change from time to time and Old Mutual Investment Group specifically excludes any obligation to communicate such changes to the recipient of this document.
This document is not an advertisement and it is not intended for general public distribution. The recipient is advised to assess the information with the assistance of an advisor if necessary, with regard to its compatibility with his/her own circumstances in view of any legal, regulatory, tax and other implications. The information herein does not constitute an offer to sell or a solicitation of an offer to buy any securities. This document is expressly not intended for persons who, due to their nationality or place of residence, are not permitted access to such information under applicable law.
Old Mutual Investment Group has comprehensive crime and professional indemnity insurance. For more detail, as well as for information on how to contact us and on how to access information please visit www.oldmutualinvest.com.
31|
Top Related