


Languages
Pages
Legal


1of58
January2016ShevyAkason877-409-8515
2..…MeettheEverydayLuxuryRealEstateGroupatEvergreenRealty3..…LosAngelesCountyHousingMarketOverview4..…LosAngelesCountyMedianHomePriceandRents5..…LosAngelesCountyResaleandrental$/SFYear-over-YearPercentageChange6..…LosAngelesCountyHistoricValuationandMarketTimingRating7..…LosAngelesCountyInvestorReturns8..…EastLosAngelesMarketPerformanceandTrends:VenturaCounty,MajorCities,andZips11..…EastLosAngelesMarketTimingRatingandValuations:VenturaCounty,MajorCities,andZips14..…WestLosAngelesMarketPerformanceandTrends:VenturaCounty,MajorCities,andZips18..…WestLosAngelesMarketTimingRatingandValuations:VenturaCounty,MajorCities,andZips
22..…OrangeCountyHousingMarketOverview23..…OrangeCountyMedianHomePriceandRents24..…OrangeCountyResaleandrental$/SFYear-over-YearPercentageChange25..…OrangeCountyHistoricValuationandMarketTimingRating26..…OrangeCountyInvestorReturns27..…OrangeCountyMarketPerformanceandTrends:VenturaCounty,MajorCities,andZips29..…OrangeCountyMarketTimingRatingandValuations:VenturaCounty,MajorCities,andZips
31..…RiversideCountyHousingMarketOverview32..…RiversideCountyMedianHomePriceandRents33..…RiversideCountyResaleandrental$/SFYear-over-YearPercentageChange34..…RiversideCountyHistoricValuationandMarketTimingRating35..…RiversideCountyInvestorReturns36..…RiversideCountyMarketPerformanceandTrends:VenturaCounty,MajorCities,andZips38..…RiversideCountyMarketTimingRatingandValuations:VenturaCounty,MajorCities,andZips
40..…SanBernardinoCountyHousingMarketOverview 41..…SanBernardinoCountyMedianHomePriceandRents42..…SanBernardinoCountyResaleandrental$/SFYear-over-YearPercentageChange43..…SanBernardinoCountyHistoricValuationandMarketTimingRating44..…SanBernardinoCountyInvestorReturns45..…SanBernardinoCountyMarketPerformanceandTrends:VenturaCounty,MajorCities,andZips47..…SanBernardinoCountyMarketTimingRatingandValues:VenturaCounty,MajorCities,andZips
49..…VenturaCountyHousingMarketOverview50..…VenturaCountyMedianHomePriceandRents51..…VenturaCountyResaleandrental$/SFYear-over-YearPercentageChange52..…VenturaCountyHistoricValuationandMarketTimingRating53..…VenturaCountyInvestorReturns54..…VenturaCountyMarketPerformanceandTrends:VenturaCounty,MajorCities,andZips55..…VenturaCountyMarketTimingRatingandValuations:VenturaCounty,MajorCities,andZips
SouthernCaliforniaHousingReport
TableofContents

3of58
January2016ShevyAkason877-409-8515
Historically,propertiesinthismarketsellata9.5%discount.Today'sdiscountis14.2%.Thismarketis4.7%undervalued.Medianhomepriceis$507,300witharentalparityvalueof$589,300.Thismarket'sdiscountis$82,000.Monthlypaymentaffordabilityhasbeenimprovingoverthelast3month(s).Momentumsuggestsimprovingaffordability.Resalepricesona$/SFbasisincreasedfrom$407/SFto$409/SF.Resalepriceshavebeenrisingfor10month(s).Overthelast12months,resalepricesrose5.4%indicatingalongertermupwardpricetrend.Medianrentalratesincreased$8lastmonthfrom$2,633to$2,641.Thecurrentcapitalizationrate(rent/price)is5.0%.Rentshavebeenrisingfor12month(s).Pricemomentumsignalsrisingrentsoverthenextthreemonths.Marketrating=7
MedianHomePriceandRentalParitytrailingtwelvemonthsDate Rating Median RentalParity HistoricValue1/2015 7 469,300$ 569,000$ 514,855$2/2015 7 467,600$ 570,000$ 515,759$3/2015 8 470,100$ 567,700$ 513,678$4/2015 8 475,100$ 578,200$ 523,179$5/2015 7 484,300$ 571,900$ 517,479$6/2015 7 492,600$ 566,200$ 512,321$7/2015 8 501,000$ 567,000$ 513,045$8/2015 8 505,100$ 581,300$ 525,984$9/2015 8 508,100$ 588,300$ 532,318$10/2015 7 508,000$ 599,000$ 542,000$11/2015 7 508,800$ 588,900$ 532,861$12/2015 7 507,300$ 589,300$ 533,223$
Resale$/SFandyear-over-yearpercentagechangetrailingtwelvemonthsDate ±Typ.Value $/SF %Change1/2015 -6.2% 388$ 8.7%2/2015 -7.5% 382$ 7.1%3/2015 -8.0% 383$ 7.1%4/2015 -8.1% 387$ 7.6%5/2015 -7.3% 391$ 7.6%6/2015 -5.9% 395$ 7.6%7/2015 -3.8% 398$ 6.6%8/2015 -3.1% 400$ 4.8%9/2015 -3.3% 403$ 4.4%10/2015 -4.5% 406$ 4.8%11/2015 -4.6% 407$ 4.9%12/2015 -4.7% 409$ 5.4% -0.0951588
Rentalrateandyear-over-yearpercentagechangetrailingtwelvemonthsDate %Change Rent Own HistoricCosttoOwnRelativetoRent1/2015 5.3% 2,474$ 2,087$ 2,239$2/2015 5.5% 2,478$ 2,054$ 2,242$3/2015 6.0% 2,487$ 2,044$ 2,250$4/2015 6.2% 2,502$ 2,049$ 2,264$5/2015 6.7% 2,527$ 2,085$ 2,286$6/2015 6.8% 2,544$ 2,136$ 2,302$7/2015 6.9% 2,569$ 2,208$ 2,325$8/2015 6.9% 2,590$ 2,245$ 2,344$9/2015 6.9% 2,615$ 2,260$ 2,366$10/2015 7.0% 2,633$ 2,247$ 2,383$11/2015 7.2% 2,633$ 2,255$ 2,383$12/2015 7.4% 2,642$ 2,261$ 2,390$
LosAngelesCountyHousingMarketNews
$-
$200,000
$400,000
$600,000
$800,000
1/2015
2/2015
3/2015
4/2015
5/2015
6/2015
7/2015
8/2015
9/2015
10/2015
11/2015
12/2015
Median RentalParity HistoricValue
$388$382$383
$387$391
$395$398
$400$403$406$407
$409
$370$375$380$385$390$395$400$405$410$415
1/2015
2/2015
3/2015
4/2015
5/2015
6/2015
7/2015
8/2015
9/2015
10/2015
11/2015
12/2015
$2,474
$2,478
$2,487
$2,502
$2,527
$2,544
$2,569
$2,590
$2,615
$2,633
$2,633
$2,642
$1,800
$2,000
$2,200
$2,400
$2,600
$2,800
1/2015
2/2015
3/2015
4/2015
5/2015
6/2015
7/2015
8/2015
9/2015
10/2015
11/2015
12/2015
Rent Own HistoricCosttoOwnRelagvetoRent

4of58
January2016ShevyAkason877-409-8515
LosAngelesCountymedianhomepricesinceJanuary1988
LosAngelesCountymedianrentandmonthlycostofownershipsinceJanuary1988
$0
$100,000
$200,000
$300,000
$400,000
$500,000
$600,000
$700,000
1/1988
1/1989
1/1990
1/1991
1/1992
1/1993
1/1994
1/1995
1/1996
1/1997
1/1998
1/1999
1/2000
1/2001
1/2002
1/2003
1/2004
1/2005
1/2006
1/2007
1/2008
1/2009
1/2010
1/2011
1/2012
1/2013
1/2014
1/2015
1/2016
1/2017
MedianResale RentalParity HistoricValue Projecgon
$0
$500
$1,000
$1,500
$2,000
$2,500
$3,000
$3,500
1/1988
1/1989
1/1990
1/1991
1/1992
1/1993
1/1994
1/1995
1/1996
1/1997
1/1998
1/1999
1/2000
1/2001
1/2002
1/2003
1/2004
1/2005
1/2006
1/2007
1/2008
1/2009
1/2010
1/2011
1/2012
1/2013
1/2014
1/2015
1/2016
1/2017
MedianRent CosttoOwn HistoricCosttoOwnRelagvetoRent

5of58
January2016ShevyAkason877-409-8515
Resale$/SFYear-over-YearPercentageChange:LosAngelesCountysinceJanuary1989
Rental$/SFYear-over-YearPercentageChange:LosAngelesCountysinceJanuary1989
-8%
-6%
-4%
-2%
0%
2%
4%
6%
8%
10%
12%
14%
16%
18%
1/1989
1/1990
1/1991
1/1992
1/1993
1/1994
1/1995
1/1996
1/1997
1/1998
1/1999
1/2000
1/2001
1/2002
1/2003
1/2004
1/2005
1/2006
1/2007
1/2008
1/2009
1/2010
1/2011
1/2012
1/2013
1/2014
1/2015
1/2016
1/2017
Normalandsustainable
Rentalratesinexcessof7%arenotsustainable.Longperiodsofexcessiveappreciagonleadtoacrash.
Falling/Correcgng
Weak
-50%-45%-40%-35%-30%-25%-20%-15%-10%-5%0%5%
10%15%20%25%30%35%40%45%50%
1/1989
1/1990
1/1991
1/1992
1/1993
1/1994
1/1995
1/1996
1/1997
1/1998
1/1999
1/2000
1/2001
1/2002
1/2003
1/2004
1/2005
1/2006
1/2007
1/2008
1/2009
1/2010
1/2011
1/2012
1/2013
1/2014
1/2015
1/2016
1/2017
Normalandsustainable
Appreciagonratesinexcessof7%arenotsustainable.Longperiodsofexcessiveappreciagonleadtoacrash.
Falling/Correcgng

6of58
January2016ShevyAkason877-409-8515
HistoricMedianHomePriceRelativetoRentalParity:LosAngelesCountysinceJanuary1988
OCHNMarketTimingSystemRating:LosAngelesCountysinceJanuary1988
-49.0%-42.0%-35.0%-28.0%-21.0%-14.0%-7.0%0.0%7.0%14.0%21.0%28.0%35.0%42.0%49.0%56.0%63.0%70.0%77.0%84.0%91.0%
1/1988
1/1989
1/1990
1/1991
1/1992
1/1993
1/1994
1/1995
1/1996
1/1997
1/1998
1/1999
1/2000
1/2001
1/2002
1/2003
1/2004
1/2005
1/2006
1/2007
1/2008
1/2009
1/2010
1/2011
1/2012
1/2013
1/2014
1/2015
1/2016
1/2017
Discou
ntorP
remium
ValueRelagvetoRentalParity HistoricNorm
Stableperiodbetweenhousingbubblesfrom1993-1999establisheshistoricnorm.
0
1
2
3
4
5
6
7
8
9
10
1/1988
1/1989
1/1990
1/1991
1/1992
1/1993
1/1994
1/1995
1/1996
1/1997
1/1998
1/1999
1/2000
1/2001
1/2002
1/2003
1/2004
1/2005
1/2006
1/2007
1/2008
1/2009
1/2010
1/2011
1/2012
1/2013
1/2014
1/2015
1/2016
1/2017
Values7-10:UndervaluedMarket:StrongBuyRecommendagon
Values4-6:NeutralMarket,WeakBuyRecommendagon
Values1-3:InflatedorWeakMarket:ConsiderSelling.DonotBuy.

7of58
January2016ShevyAkason877-409-8515
CashInvestorCapitalizationRate:LosAngelesCountysinceJanuary1988
FinancedInvestorCash-on-CashReturn:LosAngelesCountysinceJanuary1988
0.0%
2.0%
4.0%
6.0%
8.0%
10.0%
12.0%
1/1988
1/1989
1/1990
1/1991
1/1992
1/1993
1/1994
1/1995
1/1996
1/1997
1/1998
1/1999
1/2000
1/2001
1/2002
1/2003
1/2004
1/2005
1/2006
1/2007
1/2008
1/2009
1/2010
1/2011
1/2012
1/2013
1/2014
1/2015
1/2016
1/2017
CapitalizagonRate MortgageInterestRate
-30.0%
-25.0%
-20.0%
-15.0%
-10.0%
-5.0%
0.0%
5.0%
10.0%
15.0%
20.0%
25.0%
1/1988
1/1989
1/1990
1/1991
1/1992
1/1993
1/1994
1/1995
1/1996
1/1997
1/1998
1/1999
1/2000
1/2001
1/2002
1/2003
1/2004
1/2005
1/2006
1/2007
1/2008
1/2009
1/2010
1/2011
1/2012
1/2013
1/2014
1/2015
1/2016
1/2017

8of58
January2016ShevyAkason877-409-8515
Median Resale% Rent% Median Costof Ownership
City Resale$ ChangeYoY Resale$/SF ChangeYoY Rent$ Ownership Prem./Disc. CapRate
Alhambra 533,600$ 3.7% 392$ 10.8% 2,098$ 2,372$ 274$ 3.8%
Arcadia 941,700$ -14.5% 507$ 4.3% 2,803$ 4,204$ 1,401$ 2.9%
Artesia 392,400$ 15.3% 377$ 0.6% 1,717$ 1,757$ 40$ 4.2%
Azusa 372,700$ 1.7% 286$ 3.0% 1,887$ 1,644$ (243)$ 4.9%
BaldwinPark 347,500$ 8.5% 300$ 10.3% 1,746$ 1,553$ (193)$ 4.8%
Bellflower 420,500$ 14.5% 326$ 3.9% 1,925$ 1,840$ (85)$ 4.4%
CanyonCountry 419,800$ 10.1% 255$ 7.9% 2,174$ 1,863$ (311)$ 5.0%
Cerritos 629,800$ 8.1% 375$ 5.9% 2,564$ 2,799$ 235$ 3.9%
Claremont 579,100$ 0.7% 307$ 4.4% 2,225$ 2,595$ 370$ 3.7%
Covina 430,100$ 8.2% 302$ 8.8% 2,001$ 1,906$ (95)$ 4.5%
DiamondBar 533,400$ 3.2% 336$ 4.2% 2,403$ 2,378$ (24)$ 4.3%
Downey 472,500$ 14.3% 347$ 12.0% 1,921$ 2,117$ 196$ 3.9%
Duarte 413,900$ 9.6% 343$ 9.0% 1,994$ 1,802$ (192)$ 4.6%
ElMonte 412,400$ 2.6% 304$ 17.0% 1,811$ 1,842$ 31$ 4.2%
Glendora 528,100$ 5.0% 341$ 5.6% 2,275$ 2,341$ 66$ 4.1%
HaciendaHeights 545,000$ 2.7% 312$ 1.4% 2,272$ 2,417$ 145$ 4.0%
LaMirada 488,500$ 4.8% 328$ 4.5% 2,442$ 2,163$ (279)$ 4.8%
LaPuente 380,100$ 9.9% 307$ 5.8% 1,933$ 1,681$ (252)$ 4.9%
LaVerne 561,900$ 6.7% 327$ 3.1% 2,326$ 2,565$ 239$ 4.0%
Lakewood 491,300$ 8.4% 379$ 4.6% 2,249$ 2,177$ (72)$ 4.4%
Lancaster 208,200$ 11.0% 122$ 0.0% 1,474$ 909$ (565)$ 6.8%
Monrovia 548,000$ 1.1% 399$ 5.8% 2,306$ 2,451$ 146$ 4.0%
MontereyPark 539,800$ 4.0% 368$ 5.3% 2,257$ 2,356$ 98$ 4.0%
Newhall 354,300$ 7.4% 254$ 8.6% 1,683$ 1,591$ (91)$ 4.6%
Norwalk 391,500$ 14.1% 343$ 4.5% 1,965$ 1,741$ (224)$ 4.8%
Palmdale 249,700$ 14.8% 140$ 8.7% 1,535$ 1,100$ (435)$ 5.9%
Pasadena 668,700$ -0.7% 484$ 3.4% 2,389$ 2,968$ 579$ 3.4%
Pomona 327,200$ 7.6% 250$ 3.4% 1,644$ 1,452$ (192)$ 4.8%
RowlandHeights 565,100$ 4.3% 342$ 2.5% 2,259$ 2,522$ 263$ 3.8%
SanDimas 500,200$ 7.4% 318$ 6.6% 2,000$ 2,175$ 175$ 3.8%
SanGabriel 660,200$ -2.1% 419$ 0.0% 2,322$ 2,939$ 616$ 3.4%
SanMarino 2,223,800$ -12.0% 820$ 1.9% 3,572$ 9,915$ 6,342$ 1.5%
SierraMadre 836,400$ 3.8% 489$ -6.5% 2,364$ 3,718$ 1,354$ 2.7%
SouthPasadena 1,045,700$ -2.5% 553$ 5.2% 2,607$ 4,614$ 2,007$ 2.4%
StevensonRanch 623,000$ 2.5% 265$ -5.8% 2,326$ 2,746$ 419$ 3.6%
Sunland 441,900$ 13.1% 342$ 32.1% 1,965$ 1,988$ 22$ 4.3%
MarketPerformanceandTrends:EastLosAngelesCounty,MajorCities,andZips

9of58
January2016ShevyAkason877-409-8515
Median Resale% Rent% Median Costof Ownership
City Resale$ ChangeYoY Resale$/SF ChangeYoY Rent$ Ownership Prem./Disc. CapRate
TempleCity 653,700$ -3.4% 430$ 6.4% 2,139$ 2,950$ 811$ 3.1%
Tujunga 468,600$ 20.6% 368$ -1.3% 2,127$ 2,075$ (51)$ 4.4%
VanNuys 439,200$ 5.5% 303$ 8.5% 1,966$ 1,934$ (32)$ 4.3%
WestCovina 460,600$ 6.9% 311$ 2.6% 2,042$ 2,038$ (3)$ 4.3%
Whittier 448,200$ 7.8% 329$ 1.9% 2,008$ 1,990$ (18)$ 4.3%
WoodlandHills 652,500$ 4.6% 360$ 6.3% 2,554$ 2,892$ 338$ 3.8%
Alhambra91801 531,300$ 4.7% 399$ 12.2% 1,962$ 2,361$ 399$ 3.5%
Alhambra91803 535,200$ 4.8% 389$ 5.7% 1,885$ 2,387$ 502$ 3.4%
Arcadia91006 928,000$ -7.5% 518$ 4.0% 2,817$ 4,134$ 1,317$ 2.9%
Azusa91702 372,700$ 1.7% 286$ 3.0% 1,887$ 1,644$ (243)$ 4.9%
CanyonCountry91351 395,400$ 9.2% 258$ 8.9% 1,744$ 1,756$ 13$ 4.2%
CanyonCountry91387 461,100$ 9.1% 250$ 3.5% 2,437$ 2,016$ (420)$ 5.1%
Covina91722 399,700$ 5.8% 306$ 0.4% 2,121$ 1,778$ (343)$ 5.1%
Covina91723 425,500$ 9.9% 309$ 18.1% 1,729$ 1,884$ 155$ 3.9%
DiamondBar91765 540,500$ 2.5% 331$ 5.0% 2,411$ 2,394$ (17)$ 4.3%
Duarte91010 413,900$ 9.9% 344$ 8.5% 1,994$ 1,798$ (197)$ 4.6%
ElMonte91732 392,800$ 5.7% 302$ 8.5% 1,742$ 1,779$ 37$ 4.3%
Glendora91740 454,700$ 6.0% 331$ 6.9% 2,325$ 2,022$ (303)$ 4.9%
Glendora91741 635,400$ 4.7% 352$ 4.6% 2,367$ 2,831$ 463$ 3.6%
HaciendaHts91745 552,500$ 2.9% 313$ -0.7% 2,322$ 2,455$ 133$ 4.0%
LaPuente91744 377,300$ 10.6% 307$ 5.2% 1,864$ 1,669$ (195)$ 4.7%
LaVerne91750 567,500$ 5.7% 324$ 3.1% 2,326$ 2,585$ 260$ 3.9%
Lakewood90713 507,600$ 8.8% 390$ -0.3% 2,211$ 2,247$ 35$ 4.2%
Lakewood90715 412,300$ 11.9% 341$ 14.9% 1,804$ 1,807$ 3$ 4.2%
Monrovia91016 548,000$ 1.1% 399$ 5.8% 2,306$ 2,451$ 146$ 4.0%
MontereyPark91754 544,600$ 6.2% 383$ 5.6% 2,207$ 2,367$ 160$ 3.9%
MontereyPark91755 478,200$ 1.4% 346$ -0.2% 2,356$ 2,132$ (224)$ 4.7%
Newhall91321 343,500$ 7.3% 254$ 8.3% 1,683$ 1,547$ (135)$ 4.7%
Norwalk90650 391,500$ 14.1% 343$ 4.5% 1,965$ 1,741$ (224)$ 4.8%
Pasadena91101 493,500$ 0.7% 481$ 4.3% 2,514$ 2,210$ (305)$ 4.9%
Pasadena91103 604,300$ 26.7% 492$ 10.5% 2,392$ 2,620$ 228$ 3.8%
Pasadena91104 662,500$ 11.3% 479$ 13.0% 2,226$ 2,985$ 759$ 3.2%
Pasadena91105 1,127,600$ -2.4% 548$ 14.7% 3,402$ 5,172$ 1,771$ 2.9%
Pasadena91106 555,900$ 10.7% 483$ 4.6% 2,411$ 2,435$ 23$ 4.2%
Pasadena91107 699,200$ -5.0% 455$ 0.7% 2,562$ 3,134$ 573$ 3.5%
PlayadelRey90293 570,200$ 14.0% 555$ 5.5% 2,898$ 2,503$ (394)$ 4.9%
Pomona91767 340,700$ 7.3% 248$ 3.9% 1,808$ 1,505$ (303)$ 5.1%
MarketPerformanceandTrends:EastLosAngelesCounty,MajorCities,andZips
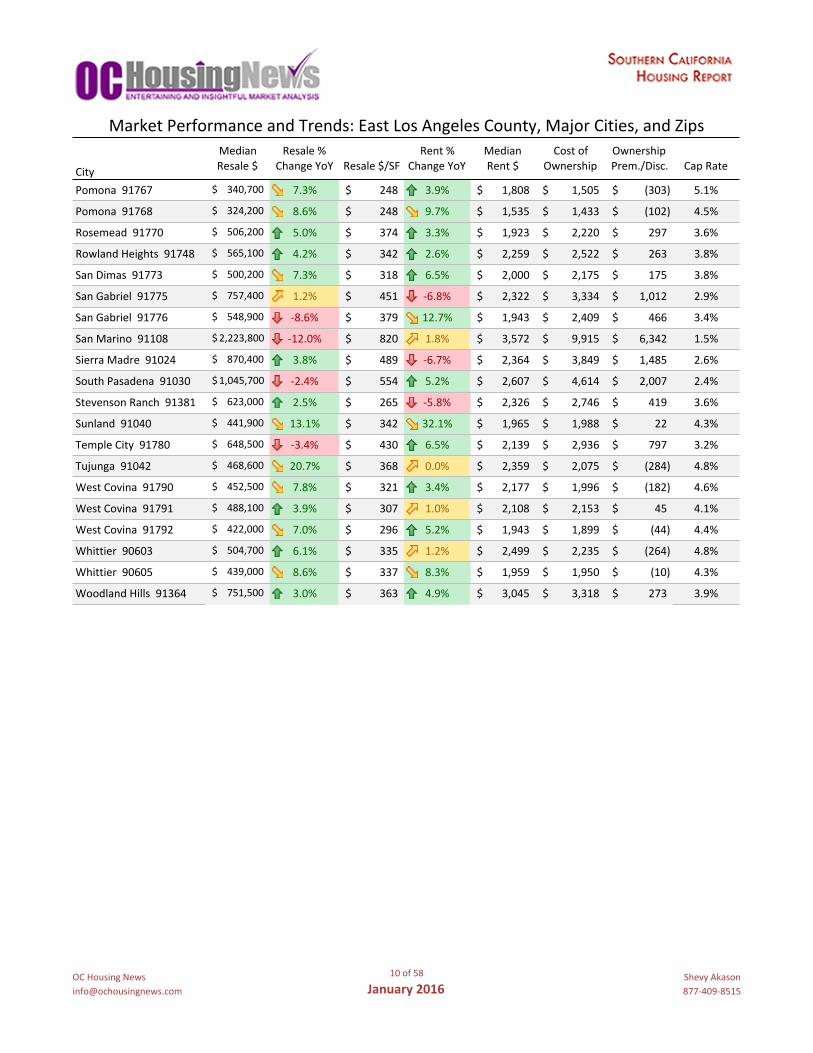
10of58
January2016ShevyAkason877-409-8515
Median Resale% Rent% Median Costof Ownership
City Resale$ ChangeYoY Resale$/SF ChangeYoY Rent$ Ownership Prem./Disc. CapRate
Pomona91767 340,700$ 7.3% 248$ 3.9% 1,808$ 1,505$ (303)$ 5.1%
Pomona91768 324,200$ 8.6% 248$ 9.7% 1,535$ 1,433$ (102)$ 4.5%
Rosemead91770 506,200$ 5.0% 374$ 3.3% 1,923$ 2,220$ 297$ 3.6%
RowlandHeights91748 565,100$ 4.2% 342$ 2.6% 2,259$ 2,522$ 263$ 3.8%
SanDimas91773 500,200$ 7.3% 318$ 6.5% 2,000$ 2,175$ 175$ 3.8%
SanGabriel91775 757,400$ 1.2% 451$ -6.8% 2,322$ 3,334$ 1,012$ 2.9%
SanGabriel91776 548,900$ -8.6% 379$ 12.7% 1,943$ 2,409$ 466$ 3.4%
SanMarino91108 2,223,800$ -12.0% 820$ 1.8% 3,572$ 9,915$ 6,342$ 1.5%
SierraMadre91024 870,400$ 3.8% 489$ -6.7% 2,364$ 3,849$ 1,485$ 2.6%
SouthPasadena91030 1,045,700$ -2.4% 554$ 5.2% 2,607$ 4,614$ 2,007$ 2.4%
StevensonRanch91381 623,000$ 2.5% 265$ -5.8% 2,326$ 2,746$ 419$ 3.6%
Sunland91040 441,900$ 13.1% 342$ 32.1% 1,965$ 1,988$ 22$ 4.3%
TempleCity91780 648,500$ -3.4% 430$ 6.5% 2,139$ 2,936$ 797$ 3.2%
Tujunga91042 468,600$ 20.7% 368$ 0.0% 2,359$ 2,075$ (284)$ 4.8%
WestCovina91790 452,500$ 7.8% 321$ 3.4% 2,177$ 1,996$ (182)$ 4.6%
WestCovina91791 488,100$ 3.9% 307$ 1.0% 2,108$ 2,153$ 45$ 4.1%
WestCovina91792 422,000$ 7.0% 296$ 5.2% 1,943$ 1,899$ (44)$ 4.4%
Whittier90603 504,700$ 6.1% 335$ 1.2% 2,499$ 2,235$ (264)$ 4.8%
Whittier90605 439,000$ 8.6% 337$ 8.3% 1,959$ 1,950$ (10)$ 4.3%
WoodlandHills91364 751,500$ 3.0% 363$ 4.9% 3,045$ 3,318$ 273$ 3.9%
MarketPerformanceandTrends:EastLosAngelesCounty,MajorCities,andZips

11of58
January2016ShevyAkason877-409-8515
%Over/Under Historic %Over/UnderCity Rating Median RentalParity RentalParity Premium HistoricPrem.
Alhambra 8 533,600$ 468,100$ 12.0% 26.6% -14.5%Arcadia 5 941,700$ 625,300$ 50.7% 56.3% -5.6%Artesia 6 392,400$ 383,000$ -1.3% 12.9% -14.1%Azusa 7 372,700$ 421,000$ -11.7% 1.8% -13.5%BaldwinPark 7 347,500$ 389,600$ -9.8% 4.2% -14.0%Bellflower 10 420,500$ 429,400$ -3.5% 23.0% -26.5%CanyonCountry 8 419,800$ 484,900$ -12.4% 8.8% -21.2%Cerritos 8 629,800$ 572,000$ 9.8% 21.4% -11.6%Claremont 6 579,100$ 496,300$ 14.2% 19.1% -4.9%Covina 7 430,100$ 446,400$ -4.3% 9.8% -14.1%DiamondBar 10 533,400$ 536,000$ -0.8% 25.6% -26.4%Downey 6 472,500$ 428,600$ 11.0% 7.2% 3.8%Duarte 7 413,900$ 444,900$ -10.4% 2.5% -12.9%ElMonte 7 412,400$ 404,000$ -1.2% 3.6% -4.8%Glendora 9 528,100$ 507,500$ 5.4% 20.6% -15.2%HaciendaHeights 7 545,000$ 506,900$ 7.3% 21.0% -13.6%LaMirada 9 488,500$ 544,700$ -11.8% -0.5% -11.3%LaPuente 9 380,100$ 431,300$ -12.0% 4.2% -16.3%LaVerne 10 561,900$ 518,800$ 10.4% 33.8% -23.4%Lakewood 8 491,300$ 501,600$ -3.1% 12.2% -15.3%Lancaster 6 208,200$ 328,800$ -37.8% -14.0% -23.8%Monrovia 7 548,000$ 514,300$ 10.1% 18.9% -8.9%MontereyPark 10 539,800$ 503,600$ 7.1% 29.7% -22.6%Newhall 9 354,300$ 375,300$ -3.1% 23.1% -26.2%Norwalk 8 391,500$ 438,400$ -12.1% 0.4% -12.5%Palmdale 7 249,700$ 342,400$ -26.9% -15.2% -11.7%Pasadena 6 668,700$ 532,900$ 22.1% 17.1% 5.1%Pomona 8 327,200$ 366,700$ -13.9% -4.6% -9.3%RowlandHeights 8 565,100$ 503,900$ 8.1% 13.5% -5.4%SanDimas 9 500,200$ 446,200$ 7.4% 24.5% -17.2%SanGabriel 4 660,200$ 518,000$ 28.2% 32.5% -4.3%SanMarino 1 2,223,800$ 796,900$ 170.8% 100.0% 70.8%SierraMadre 4 836,400$ 527,300$ 59.0% 53.2% 5.8%SouthPasadena 4 1,045,700$ 581,600$ 77.3% 56.6% 20.7%StevensonRanch 4 623,000$ 519,000$ 15.8% 14.6% 1.2%Sunland 6 441,900$ 438,400$ -0.4% 4.1% -4.4%
MarketTimingRatingandValuations:EastLosAngelesCounty,MajorCities,andZips

12of58
January2016ShevyAkason877-409-8515
%Over/Under Historic %Over/Under
City Rating Median RentalParity RentalParity Premium HistoricPrem.
TempleCity 6 653,700$ 477,100$ 36.9% 40.6% -3.7%Tujunga 4 468,600$ 474,400$ -2.4% -6.7% 4.4%VanNuys 8 439,200$ 438,700$ -3.1% 5.5% -8.6%WestCovina 9 460,600$ 455,500$ -1.3% 12.4% -13.7%Whittier 6 448,200$ 448,000$ -0.1% 10.1% -10.2%WoodlandHills 8 652,500$ 569,700$ 12.7% 20.2% -7.6%
Alhambra91801 8 531,300$ 437,600$ 18.6% 31.1% -12.5%Alhambra91803 8 535,200$ 420,400$ 25.2% 20.3% 4.9%Arcadia91006 6 928,000$ 628,400$ 47.1% 56.9% -9.9%Azusa91702 7 372,700$ 421,000$ -11.7% 1.8% -13.5%CanyonCountry91351 7 395,400$ 389,000$ -2.6% 9.7% -12.3%CanyonCountry91387 10 461,100$ 543,600$ -17.9% 31.7% -49.5%Covina91722 9 399,700$ 473,200$ -14.9% 10.5% -25.3%Covina91723 6 425,500$ 385,600$ 7.2% 11.1% -3.9%DiamondBar91765 10 540,500$ 537,900$ -0.5% 26.9% -27.4%Duarte91010 7 413,900$ 444,900$ -10.7% 2.5% -13.2%ElMonte91732 7 392,800$ 388,500$ -0.7% 5.5% -6.3%Glendora91740 10 454,700$ 518,700$ -10.2% 10.9% -21.1%Glendora91741 10 635,400$ 528,100$ 21.5% 43.2% -21.7%HaciendaHts91745 6 552,500$ 518,000$ 5.8% 20.9% -15.1%LaPuente91744 8 377,300$ 415,800$ -9.9% 5.0% -14.9%LaVerne91750 10 567,500$ 518,800$ 11.3% 33.4% -22.1%Lakewood90713 5 507,600$ 493,300$ 1.8% 12.4% -10.5%Lakewood90715 7 412,300$ 402,400$ 1.9% 10.3% -8.3%Monrovia91016 7 548,000$ 514,300$ 10.1% 18.9% -8.9%MontereyPark91754 10 544,600$ 492,300$ 10.1% 30.8% -20.7%MontereyPark91755 6 478,200$ 525,500$ -8.0% 23.4% -31.4%Newhall91321 9 343,500$ 375,300$ -5.8% 23.7% -29.5%Norwalk90650 8 391,500$ 438,400$ -12.1% 0.4% -12.4%Pasadena91101 6 493,500$ 560,900$ -12.2% -8.8% -3.4%Pasadena91103 5 604,300$ 533,600$ 8.0% -5.2% 13.2%Pasadena91104 6 662,500$ 496,500$ 33.5% 31.3% 2.2%Pasadena91105 6 1,127,600$ 758,900$ 51.8% 65.5% -13.7%Pasadena91106 8 555,900$ 537,900$ 0.2% 15.8% -15.6%Pasadena91107 5 699,200$ 571,500$ 23.4% 32.5% -9.1%PlayadelRey90293 10 570,200$ 646,400$ -13.4% 19.5% -32.9%
MarketTimingRatingandValuations:EastLosAngelesCounty,MajorCities,andZips
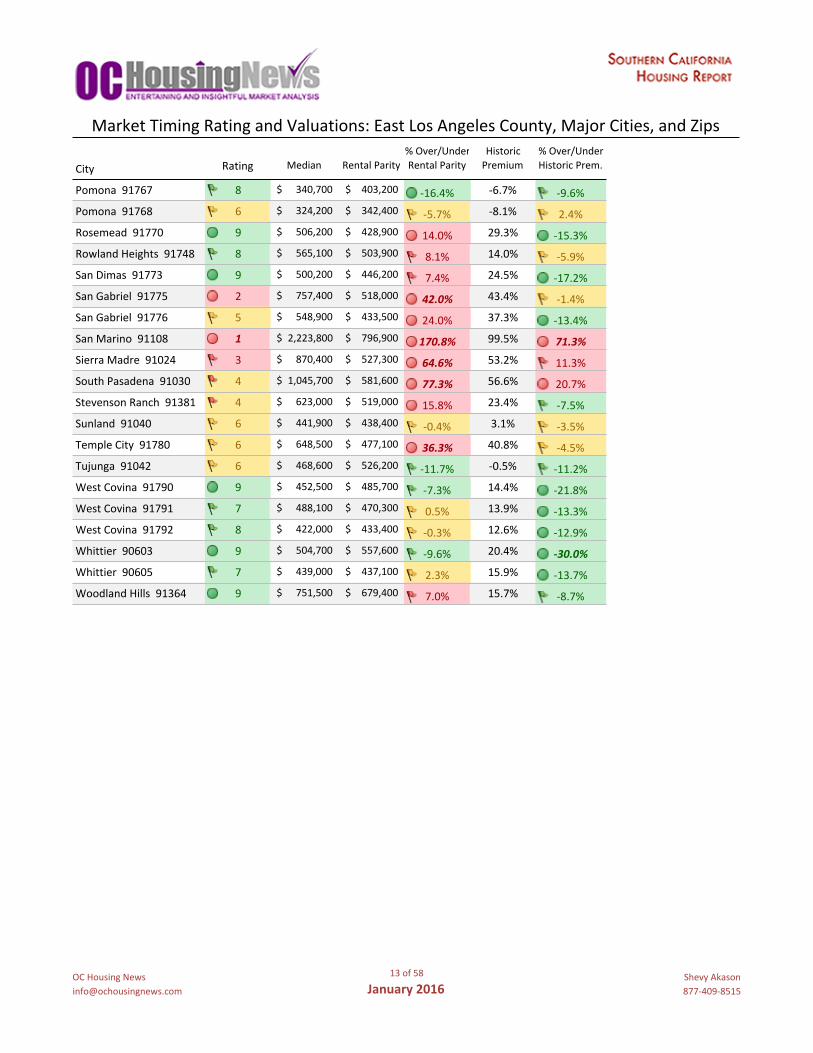
13of58
January2016ShevyAkason877-409-8515
%Over/Under Historic %Over/Under
City Rating Median RentalParity RentalParity Premium HistoricPrem.
Pomona91767 8 340,700$ 403,200$ -16.4% -6.7% -9.6%Pomona91768 6 324,200$ 342,400$ -5.7% -8.1% 2.4%Rosemead91770 9 506,200$ 428,900$ 14.0% 29.3% -15.3%RowlandHeights91748 8 565,100$ 503,900$ 8.1% 14.0% -5.9%SanDimas91773 9 500,200$ 446,200$ 7.4% 24.5% -17.2%SanGabriel91775 2 757,400$ 518,000$ 42.0% 43.4% -1.4%SanGabriel91776 5 548,900$ 433,500$ 24.0% 37.3% -13.4%SanMarino91108 1 2,223,800$ 796,900$ 170.8% 99.5% 71.3%SierraMadre91024 3 870,400$ 527,300$ 64.6% 53.2% 11.3%SouthPasadena91030 4 1,045,700$ 581,600$ 77.3% 56.6% 20.7%StevensonRanch91381 4 623,000$ 519,000$ 15.8% 23.4% -7.5%Sunland91040 6 441,900$ 438,400$ -0.4% 3.1% -3.5%TempleCity91780 6 648,500$ 477,100$ 36.3% 40.8% -4.5%Tujunga91042 6 468,600$ 526,200$ -11.7% -0.5% -11.2%WestCovina91790 9 452,500$ 485,700$ -7.3% 14.4% -21.8%WestCovina91791 7 488,100$ 470,300$ 0.5% 13.9% -13.3%WestCovina91792 8 422,000$ 433,400$ -0.3% 12.6% -12.9%Whittier90603 9 504,700$ 557,600$ -9.6% 20.4% -30.0%Whittier90605 7 439,000$ 437,100$ 2.3% 15.9% -13.7%WoodlandHills91364 9 751,500$ 679,400$ 7.0% 15.7% -8.7%
MarketTimingRatingandValuations:EastLosAngelesCounty,MajorCities,andZips
14of58
January2016ShevyAkason877-409-8515
Median Resale% Rent% Median Costof Ownership
City Resale$ ChangeYoY Resale$/SF ChangeYoY Rent$ Ownership Prem./Disc. CapRate
AgouraHills 687,600$ 9.2% 349$ 4.4% 2,788$ 3,026$ 239$ 3.9%
Altadena 672,700$ 12.3% 446$ -7.7% 2,467$ 3,019$ 552$ 3.5%
BeverlyHills 2,211,100$ 7.8% 954$ 7.8% 3,963$ 9,684$ 5,721$ 1.7%
Burbank 642,600$ 4.2% 444$ 10.9% 2,692$ 2,849$ 157$ 4.0%
Calabasas 1,035,900$ 5.8% 412$ 1.7% 3,268$ 4,599$ 1,331$ 3.0%
CanogaPark 368,400$ 12.5% 298$ 0.1% 1,792$ 1,656$ (136)$ 4.7%
Carson 413,100$ 8.8% 300$ 10.5% 2,257$ 1,850$ (407)$ 5.2%
Chatsworth 483,900$ 0.7% 271$ 9.7% 2,460$ 2,235$ (225)$ 4.9%
CulverCity 739,300$ 17.4% 578$ 3.1% 3,177$ 3,277$ 100$ 4.1%
Encino 689,600$ 2.0% 401$ 7.2% 2,747$ 3,108$ 361$ 3.8%
Gardena 418,300$ 9.6% 322$ 7.2% 2,243$ 1,855$ (388)$ 5.1%
Glendale 631,300$ 9.4% 423$ 3.4% 2,262$ 2,842$ 580$ 3.4%
GranadaHills 534,300$ 9.2% 319$ 6.6% 2,476$ 2,389$ (86)$ 4.4%
HarborCity 485,900$ 8.3% 319$ 1.7% 2,375$ 2,107$ (267)$ 4.7%
Hawthorne 485,000$ 5.5% 392$ 4.9% 2,939$ 2,182$ (757)$ 5.8%
HermosaBeach 1,394,100$ 11.2% 934$ 11.1% 3,766$ 6,119$ 2,353$ 2.6%
Inglewood 368,200$ 20.2% 291$ 1.6% 1,694$ 1,637$ (56)$ 4.4%
LaCanadaFlintridge 1,564,100$ 12.8% 632$ -1.9% 3,577$ 6,829$ 3,252$ 2.2%
LaCrescenta 728,300$ 9.4% 458$ 13.1% 3,212$ 3,237$ 24$ 4.2%
Lomita 523,400$ 11.0% 373$ 9.7% 2,203$ 2,320$ 117$ 4.0%
LongBeach 462,000$ 8.2% 382$ 9.5% 2,197$ 2,048$ (149)$ 4.6%
LosAngeles(City) 654,600$ 6.8% 512$ 7.8% 3,233$ 2,915$ (317)$ 4.7%
Malibu 2,022,100$ 1.5% 1,049$ 7.0% 3,960$ 8,719$ 4,759$ 1.9%
ManhattanBeach 2,096,600$ 18.0% 1,138$ 15.1% 3,856$ 9,078$ 5,223$ 1.8%
MarinadelRey 896,900$ 6.7% 604$ 6.2% 3,517$ 3,954$ 436$ 3.8%
Montrose 547,800$ 5.6% 406$ -1.7% 2,701$ 2,442$ (260)$ 4.7%
NorthHills 433,400$ 10.6% 267$ 7.7% 2,446$ 1,931$ (515)$ 5.4%
NorthHollywood 472,600$ 11.3% 364$ 3.8% 2,171$ 2,094$ (78)$ 4.4%
Northridge 600,500$ 8.3% 304$ 4.4% 3,081$ 2,661$ (421)$ 4.9%
PacificPalisades 2,251,700$ 4.7% 925$ -1.2% 4,642$ 10,019$ 5,378$ 2.0%
PlayadelRey 570,200$ 14.0% 555$ 6.2% 2,898$ 2,503$ (394)$ 4.9%
RanchoPalosVerdes 1,093,200$ 5.2% 518$ 3.3% 3,825$ 4,809$ 984$ 3.4%
RedondoBeach 852,900$ 7.3% 536$ 3.7% 3,117$ 3,819$ 702$ 3.5%
Reseda 428,300$ 10.9% 311$ 2.5% 2,359$ 1,900$ (459)$ 5.3%
SanPedro 467,700$ 7.6% 354$ 4.5% 1,943$ 2,079$ 136$ 4.0%
SantaMonica 1,196,800$ 0.6% 940$ 8.2% 3,592$ 5,402$ 1,810$ 2.9%
ShermanOaks 735,500$ 6.7% 451$ 3.1% 2,814$ 3,221$ 408$ 3.7%
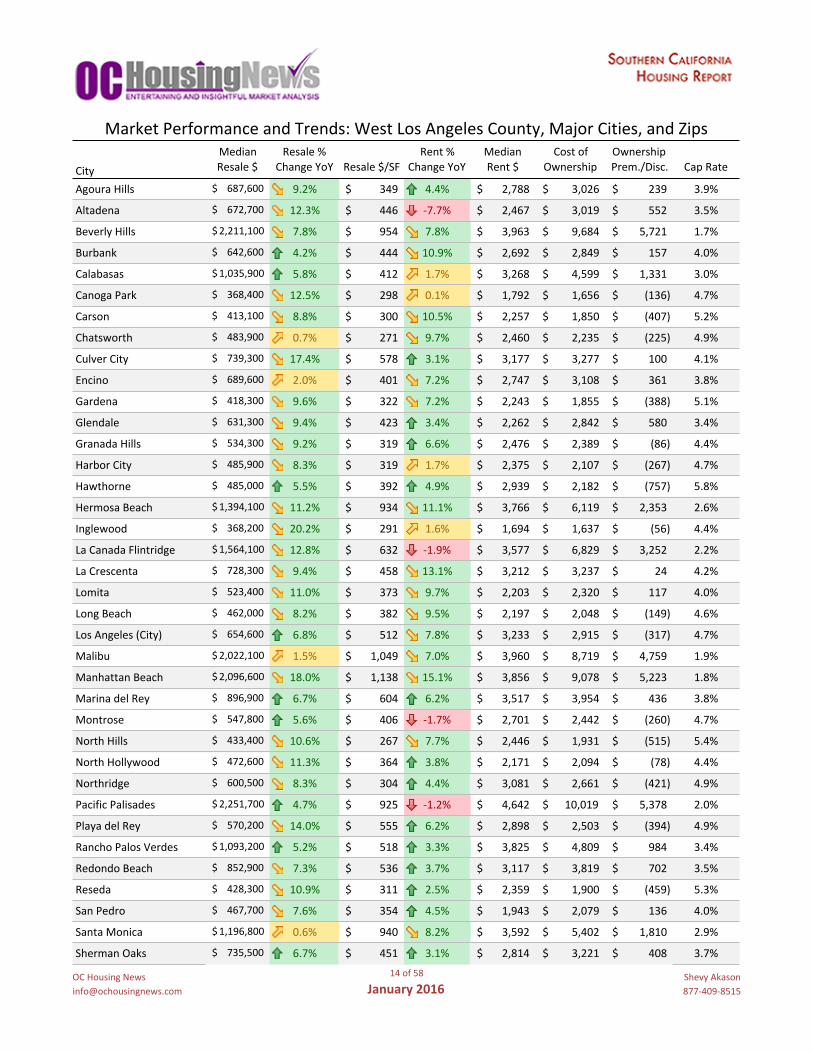
MarketPerformanceandTrends:WestLosAngelesCounty,MajorCities,andZips

15of58
January2016ShevyAkason877-409-8515
Median Resale% Rent% Median Costof Ownership
City Resale$ ChangeYoY Resale$/SF ChangeYoY Rent$ Ownership Prem./Disc. CapRate
StudioCity 927,700$ 5.8% 530$ 12.5% 3,682$ 4,189$ 507$ 3.8%
Sylmar 395,400$ 5.5% 268$ 3.1% 2,400$ 1,754$ (646)$ 5.8%
Tarzana 559,700$ 5.4% 333$ 9.3% 2,649$ 2,503$ (146)$ 4.5%
Torrance 591,500$ 2.7% 417$ 5.6% 2,693$ 2,644$ (49)$ 4.4%
Valencia 472,500$ 5.6% 288$ 4.2% 2,459$ 2,090$ (368)$ 5.0%
ValleyVillage 782,400$ 4.6% 423$ 11.0% 2,790$ 3,489$ 700$ 3.4%
Venice 1,597,700$ 8.3% 1,096$ 9.4% 3,958$ 7,269$ 3,310$ 2.4%
Walnut 709,900$ -1.5% 370$ 3.2% 2,616$ 3,182$ 566$ 3.5%
WestHills 574,300$ 10.6% 346$ 5.8% 2,735$ 2,544$ (192)$ 4.6%
WestHollywood 695,600$ 15.3% 701$ 4.2% 3,489$ 3,067$ (421)$ 4.8%
Winnetka 460,300$ 8.9% 293$ 3.3% 2,474$ 2,026$ (449)$ 5.2%
AgouraHills91301 687,600$ 9.2% 349$ 4.4% 2,788$ 3,026$ 239$ 3.9%
Altadena91001 672,700$ 12.1% 446$ -7.7% 2,467$ 3,019$ 552$ 3.5%
BeverlyHills90210 2,717,800$ 6.2% 1,036$ 5.2% 3,913$ 12,185$ 8,273$ 1.4%
BeverlyHills90211 1,541,600$ 0.1% 756$ 1.7% 4,298$ 6,698$ 2,400$ 2.7%
Burbank91501 598,000$ 8.7% 433$ 0.6% 2,567$ 2,632$ 65$ 4.1%
Burbank91504 623,700$ 3.2% 405$ 4.1% 2,889$ 2,748$ (141)$ 4.4%
Burbank91505 628,000$ 4.7% 470$ 14.8% 2,456$ 2,784$ 328$ 3.8%
Calabasas91302 1,124,800$ 5.0% 414$ 1.6% 3,356$ 4,886$ 1,531$ 2.9%
Chatsworth91311 483,900$ 0.7% 271$ 9.7% 2,460$ 2,235$ (225)$ 4.9%
CulverCity90230 510,800$ 16.6% 531$ 5.2% 2,839$ 2,220$ (619)$ 5.3%
Gardena90247 383,000$ 7.8% 299$ -2.0% 1,600$ 1,705$ 105$ 4.0%
Glendale91202 571,200$ 10.6% 401$ 10.7% 2,571$ 2,513$ (58)$ 4.3%
Glendale91206 628,600$ 7.4% 389$ -3.2% 2,246$ 2,645$ 399$ 3.4%
Glendale91207 810,900$ 15.3% 452$ 4.6% 2,665$ 3,675$ 1,011$ 3.2%
Glendale91208 829,000$ 10.8% 449$ 1.2% 2,635$ 3,700$ 1,065$ 3.1%
GranadaHills91344 537,200$ 8.5% 318$ 6.6% 2,476$ 2,406$ (69)$ 4.4%
HarborCity90710 482,100$ 8.2% 319$ 2.0% 2,383$ 2,098$ (285)$ 4.7%
LaCanadaFlintridge91011 1,564,100$ 12.8% 632$ -1.9% 3,577$ 6,829$ 3,252$ 2.2%
LaCrescenta91214 728,300$ 9.4% 458$ 13.1% 3,212$ 3,237$ 24$ 4.2%
Lomita90717 523,400$ 11.4% 373$ 9.1% 2,203$ 2,320$ 117$ 4.0%
LongBeach90802 293,000$ 9.0% 377$ 9.4% 2,084$ 1,291$ (793)$ 6.8%
LongBeach90803 660,700$ 4.3% 502$ 7.5% 2,497$ 3,044$ 547$ 3.6%
LongBeach90804 359,700$ 6.6% 358$ 7.6% 1,881$ 1,577$ (304)$ 5.0%
LongBeach90805 353,300$ 7.4% 308$ 10.2% 1,933$ 1,568$ (365)$ 5.3%
LongBeach90805 353,300$ 7.4% 308$ 10.2% 1,933$ 1,568$ (365)$ 5.3%
LongBeach90806 422,800$ 15.9% 346$ 9.8% 1,653$ 1,849$ 196$ 3.8%
MarketPerformanceandTrends:WestLosAngelesCounty,MajorCities,andZips

16of58
January2016ShevyAkason877-409-8515
Median Resale% Rent% Median Costof Ownership
City Resale$ ChangeYoY Resale$/SF ChangeYoY Rent$ Ownership Prem./Disc. CapRate
LongBeach90807 533,500$ 11.1% 369$ 8.3% 1,556$ 2,325$ 769$ 2.8%
LongBeach90808 571,900$ 3.6% 398$ 10.0% 2,252$ 2,546$ 295$ 3.8%
LongBeach90813 299,800$ 15.0% 300$ 10.3% 1,182$ 1,332$ 150$ 3.8%
LongBeach90814 617,400$ 1.6% 419$ 27.3% 2,236$ 2,718$ 482$ 3.5%
LongBeach90815 582,300$ 8.9% 406$ 11.2% 2,462$ 2,571$ 110$ 4.1%
LosAngeles90004 806,300$ 12.1% 629$ 23.3% 3,448$ 3,610$ 162$ 4.1%
LosAngeles90005 607,700$ -2.3% 435$ 10.6% 2,943$ 2,659$ (284)$ 4.6%
LosAngeles90012 460,800$ 2.5% 519$ 7.0% 2,294$ 2,051$ (243)$ 4.8%
LosAngeles90019 877,200$ 9.7% 497$ 5.6% 2,587$ 3,896$ 1,309$ 2.8%
LosAngeles90020 441,800$ 1.6% 493$ 9.0% 2,326$ 1,946$ (380)$ 5.1%
LosAngeles90024 834,800$ 5.7% 678$ 5.7% 3,114$ 3,686$ 573$ 3.6%
LosAngeles90025 772,100$ 10.5% 586$ 7.5% 3,721$ 3,430$ (291)$ 4.6%
LosAngeles90026 826,900$ 8.4% 592$ -1.7% 3,450$ 3,544$ 94$ 4.0%
LosAngeles90027 1,205,000$ 2.7% 605$ 10.7% 3,193$ 5,319$ 2,126$ 2.5%
LosAngeles90034 828,000$ 12.6% 596$ 32.4% 3,811$ 3,763$ (48)$ 4.4%
LosAngeles90035 973,900$ 14.6% 625$ 8.3% 3,269$ 4,288$ 1,019$ 3.2%
LosAngeles90036 1,205,200$ 1.9% 617$ 10.0% 3,743$ 5,153$ 1,411$ 3.0%
LosAngeles90042 511,700$ 0.7% 443$ 9.6% 2,127$ 2,315$ 187$ 4.0%
LosAngeles90045 913,200$ 8.5% 576$ 15.1% 3,627$ 4,009$ 382$ 3.8%
LosAngeles90046 1,232,200$ 1.3% 696$ -3.9% 3,426$ 5,566$ 2,140$ 2.7%
LosAngeles90048 1,507,200$ 13.6% 759$ -0.5% 3,744$ 6,643$ 2,899$ 2.4%
LosAngeles90049 1,624,800$ 5.6% 801$ 11.5% 3,743$ 7,057$ 3,314$ 2.2%
LosAngeles90064 1,066,400$ 8.1% 693$ 6.3% 3,478$ 4,627$ 1,149$ 3.1%
LosAngeles90066 1,126,600$ 9.8% 710$ 4.0% 3,793$ 4,990$ 1,197$ 3.2%
LosAngeles90068 1,193,500$ 7.8% 612$ 7.7% 3,944$ 5,321$ 1,377$ 3.2%
ManhattanBeach90266 2,096,600$ 18.3% 1,141$ 14.2% 3,856$ 9,078$ 5,223$ 1.8%
MarinadelRey90292 896,900$ 6.7% 604$ 6.2% 3,517$ 3,954$ 436$ 3.8%
Montrose91020 551,400$ 6.2% 407$ -1.0% 2,676$ 2,455$ (221)$ 4.7%
NorthHills91343 433,400$ 10.6% 267$ 7.6% 2,446$ 1,931$ (515)$ 5.4%
Northridge91325 531,800$ 10.7% 292$ 3.5% 2,357$ 2,352$ (5)$ 4.3%
PacificPalisades90272 2,251,700$ 4.8% 926$ -0.5% 4,642$ 10,019$ 5,378$ 2.0%
PalosVerdesEstates90274 1,640,200$ -2.3% 674$ 8.7% 3,793$ 7,467$ 3,674$ 2.2%
RedondoBeach90277 911,500$ 6.0% 597$ 5.6% 3,147$ 4,093$ 946$ 3.3%
RedondoBeach90278 804,800$ 11.2% 485$ 4.1% 3,285$ 3,587$ 302$ 3.9%
Reseda91335 428,300$ 11.0% 311$ 2.5% 2,359$ 1,900$ (459)$ 5.3%
SanPedro90731 472,300$ 8.7% 363$ 3.2% 1,668$ 2,085$ 417$ 3.4%
SanPedro90732 460,400$ 6.7% 343$ 6.5% 1,939$ 2,054$ 115$ 4.0%
MarketPerformanceandTrends:WestLosAngelesCounty,MajorCities,andZips
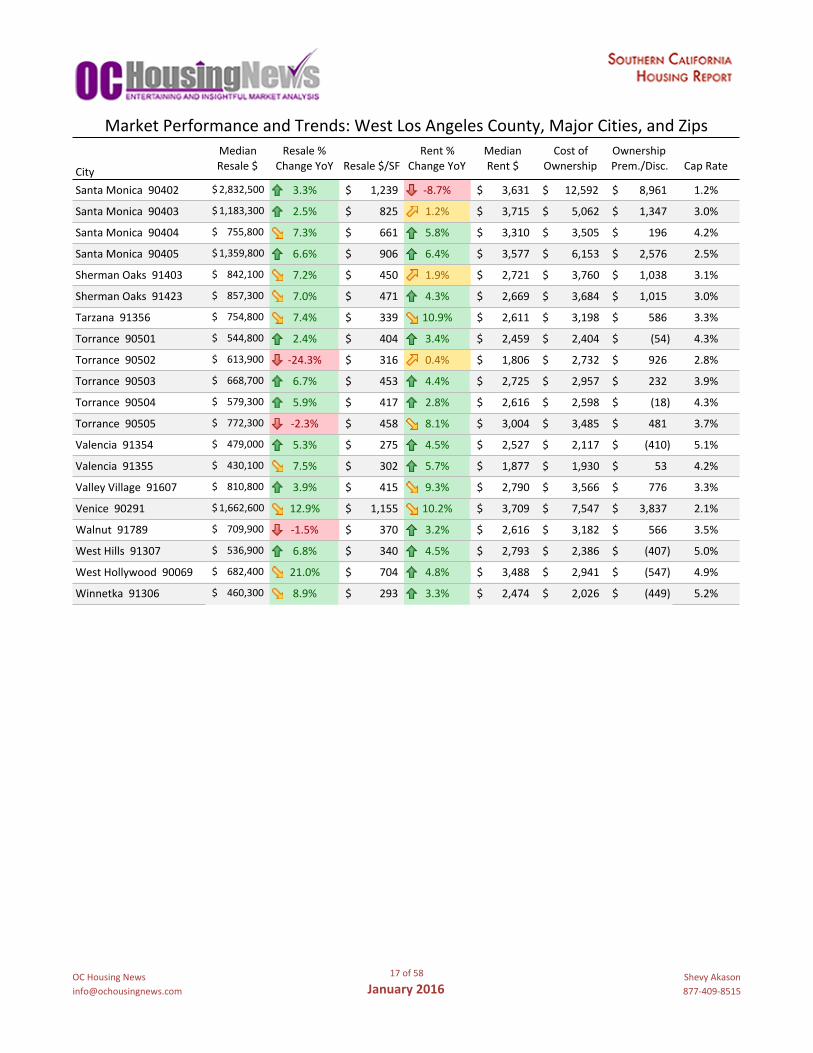
17of58
January2016ShevyAkason877-409-8515
Median Resale% Rent% Median Costof Ownership
City Resale$ ChangeYoY Resale$/SF ChangeYoY Rent$ Ownership Prem./Disc. CapRate
SantaMonica90402 2,832,500$ 3.3% 1,239$ -8.7% 3,631$ 12,592$ 8,961$ 1.2%
SantaMonica90403 1,183,300$ 2.5% 825$ 1.2% 3,715$ 5,062$ 1,347$ 3.0%
SantaMonica90404 755,800$ 7.3% 661$ 5.8% 3,310$ 3,505$ 196$ 4.2%
SantaMonica90405 1,359,800$ 6.6% 906$ 6.4% 3,577$ 6,153$ 2,576$ 2.5%
ShermanOaks91403 842,100$ 7.2% 450$ 1.9% 2,721$ 3,760$ 1,038$ 3.1%
ShermanOaks91423 857,300$ 7.0% 471$ 4.3% 2,669$ 3,684$ 1,015$ 3.0%
Tarzana91356 754,800$ 7.4% 339$ 10.9% 2,611$ 3,198$ 586$ 3.3%
Torrance90501 544,800$ 2.4% 404$ 3.4% 2,459$ 2,404$ (54)$ 4.3%
Torrance90502 613,900$ -24.3% 316$ 0.4% 1,806$ 2,732$ 926$ 2.8%
Torrance90503 668,700$ 6.7% 453$ 4.4% 2,725$ 2,957$ 232$ 3.9%
Torrance90504 579,300$ 5.9% 417$ 2.8% 2,616$ 2,598$ (18)$ 4.3%
Torrance90505 772,300$ -2.3% 458$ 8.1% 3,004$ 3,485$ 481$ 3.7%
Valencia91354 479,000$ 5.3% 275$ 4.5% 2,527$ 2,117$ (410)$ 5.1%
Valencia91355 430,100$ 7.5% 302$ 5.7% 1,877$ 1,930$ 53$ 4.2%
ValleyVillage91607 810,800$ 3.9% 415$ 9.3% 2,790$ 3,566$ 776$ 3.3%
Venice90291 1,662,600$ 12.9% 1,155$ 10.2% 3,709$ 7,547$ 3,837$ 2.1%
Walnut91789 709,900$ -1.5% 370$ 3.2% 2,616$ 3,182$ 566$ 3.5%
WestHills91307 536,900$ 6.8% 340$ 4.5% 2,793$ 2,386$ (407)$ 5.0%
WestHollywood90069 682,400$ 21.0% 704$ 4.8% 3,488$ 2,941$ (547)$ 4.9%
Winnetka91306 460,300$ 8.9% 293$ 3.3% 2,474$ 2,026$ (449)$ 5.2%
MarketPerformanceandTrends:WestLosAngelesCounty,MajorCities,andZips

18of58
January2016ShevyAkason877-409-8515
%Over/Under Historic %Over/UnderCity Rating Median RentalParity RentalParity Premium HistoricPrem.
AgouraHills 9 687,600$ 621,900$ 8.0% 24.3% -16.3%Altadena 1 672,700$ 550,300$ 25.5% 5.4% 20.1%BeverlyHills 6 2,211,100$ 884,100$ 143.6% 136.7% 6.9%Burbank 7 642,600$ 600,500$ 7.4% 3.5% 3.9%Calabasas 9 1,035,900$ 729,000$ 38.9% 70.9% -32.0%CanogaPark 8 368,400$ 399,800$ -11.9% 13.8% -25.7%Carson 7 413,100$ 503,600$ -18.1% -3.3% -14.7%Chatsworth 7 483,900$ 548,900$ -9.4% 8.7% -18.1%CulverCity 7 739,300$ 708,700$ 5.5% 6.5% -1.0%Encino 6 689,600$ 612,900$ 13.1% 25.7% -12.6%Gardena 8 418,300$ 500,300$ -17.0% 5.0% -22.0%Glendale 7 631,300$ 504,600$ 23.1% 21.5% 1.6%GranadaHills 7 534,300$ 552,300$ -1.7% 3.1% -4.8%HarborCity 8 485,900$ 529,800$ -11.6% 13.8% -25.4%Hawthorne 8 485,000$ 655,700$ -22.2% -18.5% -3.7%HermosaBeach 6 1,394,100$ 840,100$ 60.3% 62.6% -2.4%Inglewood 6 368,200$ 377,800$ -0.8% 9.6% -10.4%LaCanadaFlintridge 1 1,564,100$ 798,100$ 94.6% 58.7% 35.9%LaCrescenta 7 728,300$ 716,600$ 0.8% 14.5% -13.7%Lomita 9 523,400$ 491,400$ 10.8% 39.0% -28.3%LongBeach 7 462,000$ 490,100$ -6.8% 2.2% -9.0%LosAngeles(City) 6 654,600$ 721,100$ -9.3% -23.1% 13.8%Malibu 2 2,022,100$ 883,400$ 119.3% 92.4% 26.8%ManhattanBeach 1 2,096,600$ 860,100$ 135.1% 67.3% 67.8%MarinadelRey 8 896,900$ 784,700$ 10.0% 11.1% -1.1%Montrose 7 547,800$ 602,700$ -9.6% 8.2% -17.8%NorthHills 8 433,400$ 545,600$ -20.3% -3.1% -17.2%NorthHollywood 7 472,600$ 484,400$ -5.1% -2.9% -2.2%Northridge 7 600,500$ 687,400$ -10.5% -8.4% -2.1%PacificPalisades 3 2,251,700$ 1,035,500$ 122.8% 103.8% 19.0%PlayadelRey 10 570,200$ 646,400$ -13.4% 20.8% -34.1%RanchoPalosVerdes 10 1,093,200$ 853,300$ 26.8% 71.1% -44.3%RedondoBeach 7 852,900$ 695,300$ 20.1% 21.0% -0.9%Reseda 8 428,300$ 526,300$ -18.5% -9.3% -9.3%SanPedro 10 467,700$ 433,500$ 5.0% 34.9% -29.9%SantaMonica 1 1,196,800$ 801,300$ 51.3% 16.2% 35.0%ShermanOaks 8 735,500$ 627,700$ 13.5% 21.0% -7.5%
MarketTimingRatingandValuations:WestLosAngelesCounty,MajorCities,andZips

19of58
January2016ShevyAkason877-409-8515
%Over/Under Historic %Over/Under
City Rating Median RentalParity RentalParity Premium HistoricPrem.
StudioCity 7 927,700$ 821,500$ 17.3% 23.0% -5.7%Sylmar 10 395,400$ 535,500$ -25.4% -6.8% -18.6%Tarzana 10 559,700$ 591,000$ -5.0% 21.2% -26.2%Torrance 10 591,500$ 600,700$ -3.0% 17.1% -20.1%Valencia 10 472,500$ 548,500$ -14.8% 6.8% -21.6%ValleyVillage 9 782,400$ 622,300$ 24.1% 40.8% -16.6%Venice 1 1,597,700$ 883,100$ 86.3% -9.1% 95.4%Walnut 7 709,900$ 583,500$ 21.8% 36.2% -14.4%WestHills 8 574,300$ 610,200$ -6.6% 2.2% -8.8%WestHollywood 7 695,600$ 778,300$ -11.9% -9.1% -2.7%Winnetka 8 460,300$ 551,900$ -17.4% -2.3% -15.2%AgouraHills91301 9 687,600$ 621,900$ 8.0% 24.3% -16.3%Altadena91001 1 672,700$ 550,300$ 25.5% 5.4% 20.1%BeverlyHills90210 7 2,717,800$ 872,900$ 211.1% 195.7% 15.4%BeverlyHills90211 4 1,541,600$ 958,900$ 58.7% 64.5% -5.8%Burbank91501 6 598,000$ 572,700$ 4.5% 12.7% -8.2%Burbank91504 10 623,700$ 644,500$ -2.7% 14.8% -17.5%Burbank91505 7 628,000$ 547,800$ 12.4% 4.4% 8.0%Calabasas91302 8 1,124,800$ 748,600$ 43.5% 65.1% -21.6%Chatsworth91311 7 483,900$ 548,900$ -9.4% 8.7% -18.1%CulverCity90230 10 510,800$ 633,300$ -19.8% 7.9% -27.7%Gardena90247 3 383,000$ 357,000$ 9.0% 11.6% -2.7%Glendale91202 10 571,200$ 573,600$ -4.7% 29.6% -34.3%Glendale91206 4 628,600$ 501,000$ 18.3% 29.7% -11.5%Glendale91207 10 810,900$ 594,400$ 37.2% 74.7% -37.5%Glendale91208 6 829,000$ 587,900$ 40.4% 49.8% -9.3%GranadaHills91344 7 537,200$ 552,300$ -1.0% 3.1% -4.1%HarborCity90710 8 482,100$ 531,500$ -12.5% 15.0% -27.5%LaCanadaFlintridge91011 1 1,564,100$ 798,100$ 94.6% 62.6% 31.9%LaCrescenta91214 7 728,300$ 716,600$ 0.8% 14.1% -13.3%Lomita90717 9 523,400$ 491,400$ 10.8% 36.0% -25.2%LongBeach90802 6 293,000$ 465,000$ -36.4% -40.4% 4.0%LongBeach90803 10 660,700$ 557,100$ 16.1% 56.1% -40.0%LongBeach90804 9 359,700$ 419,700$ -17.8% 3.5% -21.3%LongBeach90805 10 353,300$ 431,200$ -19.1% 19.7% -38.8%LongBeach90805 10 353,300$ 431,200$ -19.1% 19.7% -38.8%LongBeach90806 10 422,800$ 368,700$ 13.9% 52.5% -38.6%
MarketTimingRatingandValuations:WestLosAngelesCounty,MajorCities,andZips

20of58
January2016ShevyAkason877-409-8515
%Over/Under Historic %Over/Under
City Rating Median RentalParity RentalParity Premium HistoricPrem.
LongBeach90807 9 533,500$ 347,200$ 48.2% 74.4% -26.1%LongBeach90808 7 571,900$ 502,300$ 8.8% 13.0% -4.2%LongBeach90813 5 299,800$ 263,600$ 11.7% -2.0% 13.7%LongBeach90814 5 617,400$ 498,700$ 24.6% 29.4% -4.8%LongBeach90815 7 582,300$ 549,200$ 5.0% 15.1% -10.1%LosAngeles90004 10 806,300$ 769,200$ 6.1% 44.2% -38.0%LosAngeles90005 10 607,700$ 656,500$ -8.7% 48.5% -57.1%LosAngeles90012 8 460,800$ 511,700$ -9.8% -5.2% -4.5%LosAngeles90019 2 877,200$ 577,100$ 46.7% 3.8% 42.9%LosAngeles90020 9 441,800$ 518,900$ -16.7% 17.4% -34.1%LosAngeles90024 10 834,800$ 694,700$ 16.9% 43.9% -27.0%LosAngeles90025 8 772,100$ 830,200$ -7.5% 14.7% -22.2%LosAngeles90026 2 826,900$ 769,800$ 5.6% -11.1% 16.7%LosAngeles90027 6 1,205,000$ 712,300$ 68.4% 53.4% 15.0%LosAngeles90034 6 828,000$ 850,100$ -1.1% 3.2% -4.4%LosAngeles90035 4 973,900$ 729,400$ 32.3% 15.8% 16.6%LosAngeles90036 2 1,205,200$ 835,000$ 39.4% 11.4% 28.0%LosAngeles90042 4 511,700$ 474,600$ 8.6% -5.0% 13.6%LosAngeles90045 6 913,200$ 809,100$ 13.2% 20.4% -7.2%LosAngeles90046 1 1,232,200$ 764,300$ 64.9% 14.2% 50.6%LosAngeles90048 1 1,507,200$ 835,200$ 81.6% 28.8% 52.8%LosAngeles90049 9 1,624,800$ 835,100$ 86.8% 110.5% -23.6%LosAngeles90064 7 1,066,400$ 775,900$ 33.6% 37.1% -3.5%LosAngeles90066 6 1,126,600$ 846,300$ 30.2% 14.8% 15.3%LosAngeles90068 4 1,193,500$ 879,800$ 36.1% 17.8% 18.3%ManhattanBeach90266 1 2,096,600$ 860,100$ 135.1% 66.1% 69.1%MarinadelRey90292 8 896,900$ 784,700$ 10.0% 11.0% -1.0%Montrose91020 7 551,400$ 597,000$ -8.3% 7.9% -16.2%NorthHills91343 8 433,400$ 545,600$ -20.3% -3.1% -17.2%Northridge91325 9 531,800$ 525,800$ -1.0% 21.6% -22.6%PacificPalisades90272 3 2,251,700$ 1,035,500$ 122.8% 103.5% 19.3%PalosVerdesEstates90274 4 1,640,200$ 846,100$ 105.6% 94.0% 11.6%RedondoBeach90277 8 911,500$ 702,100$ 27.0% 31.5% -4.5%RedondoBeach90278 7 804,800$ 732,900$ 9.7% 12.3% -2.5%Reseda91335 8 428,300$ 526,300$ -18.5% -9.3% -9.3%SanPedro90731 9 472,300$ 372,200$ 23.4% 45.2% -21.8%SanPedro90732 10 460,400$ 432,500$ 4.2% 32.7% -28.5%
MarketTimingRatingandValuations:WestLosAngelesCounty,MajorCities,andZips
21of58
January2016ShevyAkason877-409-8515
%Over/Under Historic %Over/Under
City Rating Median RentalParity RentalParity Premium HistoricPrem.
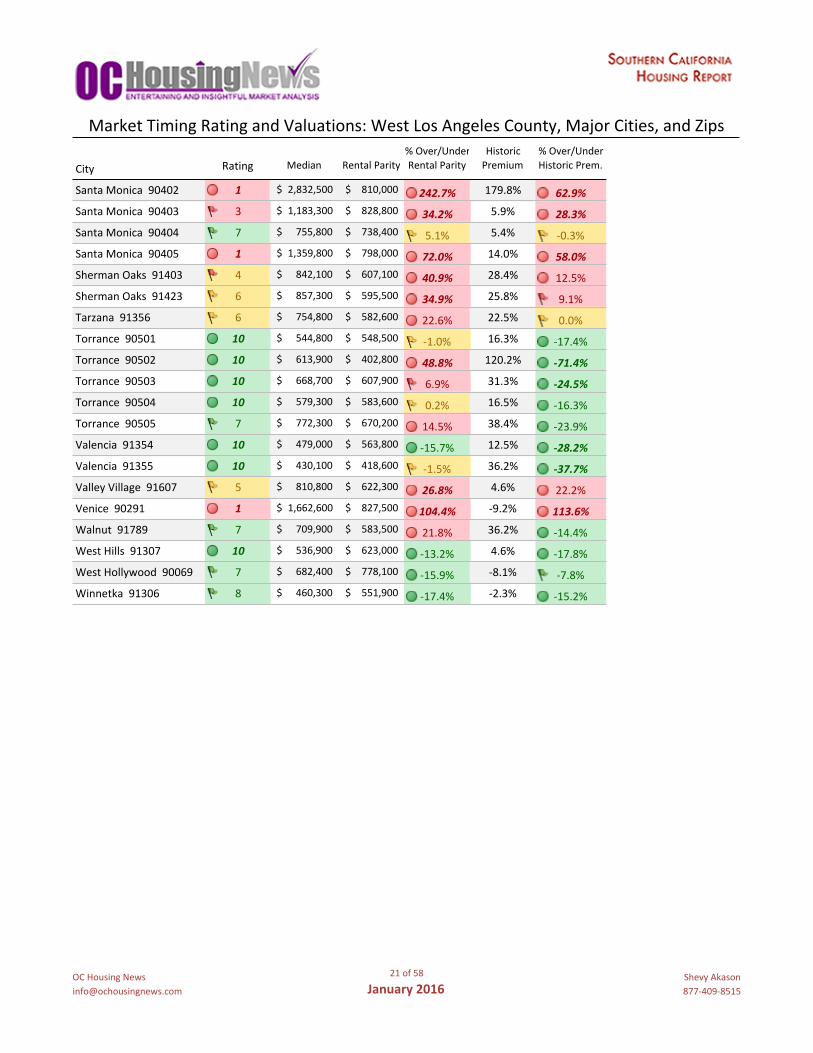
SantaMonica90402 1 2,832,500$ 810,000$ 242.7% 179.8% 62.9%SantaMonica90403 3 1,183,300$ 828,800$ 34.2% 5.9% 28.3%SantaMonica90404 7 755,800$ 738,400$ 5.1% 5.4% -0.3%SantaMonica90405 1 1,359,800$ 798,000$ 72.0% 14.0% 58.0%ShermanOaks91403 4 842,100$ 607,100$ 40.9% 28.4% 12.5%ShermanOaks91423 6 857,300$ 595,500$ 34.9% 25.8% 9.1%Tarzana91356 6 754,800$ 582,600$ 22.6% 22.5% 0.0%Torrance90501 10 544,800$ 548,500$ -1.0% 16.3% -17.4%Torrance90502 10 613,900$ 402,800$ 48.8% 120.2% -71.4%Torrance90503 10 668,700$ 607,900$ 6.9% 31.3% -24.5%Torrance90504 10 579,300$ 583,600$ 0.2% 16.5% -16.3%Torrance90505 7 772,300$ 670,200$ 14.5% 38.4% -23.9%Valencia91354 10 479,000$ 563,800$ -15.7% 12.5% -28.2%Valencia91355 10 430,100$ 418,600$ -1.5% 36.2% -37.7%ValleyVillage91607 5 810,800$ 622,300$ 26.8% 4.6% 22.2%Venice90291 1 1,662,600$ 827,500$ 104.4% -9.2% 113.6%Walnut91789 7 709,900$ 583,500$ 21.8% 36.2% -14.4%WestHills91307 10 536,900$ 623,000$ -13.2% 4.6% -17.8%WestHollywood90069 7 682,400$ 778,100$ -15.9% -8.1% -7.8%Winnetka91306 8 460,300$ 551,900$ -17.4% -2.3% -15.2%
MarketTimingRatingandValuations:WestLosAngelesCounty,MajorCities,andZips
22of58
January2016ShevyAkason877-409-8515
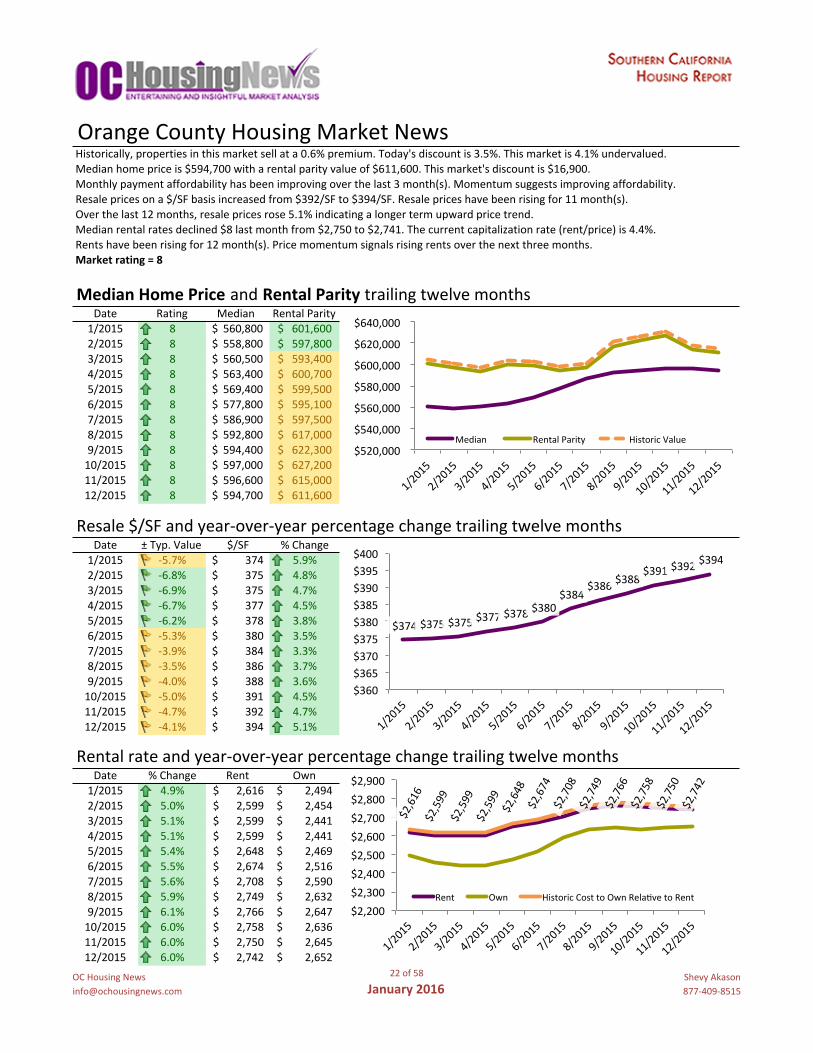
Historically,propertiesinthismarketsellata0.6%premium.Today'sdiscountis3.5%.Thismarketis4.1%undervalued.Medianhomepriceis$594,700witharentalparityvalueof$611,600.Thismarket'sdiscountis$16,900.Monthlypaymentaffordabilityhasbeenimprovingoverthelast3month(s).Momentumsuggestsimprovingaffordability.Resalepricesona$/SFbasisincreasedfrom$392/SFto$394/SF.Resalepriceshavebeenrisingfor11month(s).Overthelast12months,resalepricesrose5.1%indicatingalongertermupwardpricetrend.Medianrentalratesdeclined$8lastmonthfrom$2,750to$2,741.Thecurrentcapitalizationrate(rent/price)is4.4%.Rentshavebeenrisingfor12month(s).Pricemomentumsignalsrisingrentsoverthenextthreemonths.Marketrating=8
MedianHomePriceandRentalParitytrailingtwelvemonthsDate Rating Median RentalParity HistoricValue1/2015 8 560,800$ 601,600$ 605,294$2/2015 8 558,800$ 597,800$ 601,470$3/2015 8 560,500$ 593,400$ 597,043$4/2015 8 563,400$ 600,700$ 604,388$5/2015 8 569,400$ 599,500$ 603,181$6/2015 8 577,800$ 595,100$ 598,754$7/2015 8 586,900$ 597,500$ 601,169$8/2015 8 592,800$ 617,000$ 620,788$9/2015 8 594,400$ 622,300$ 626,121$10/2015 8 597,000$ 627,200$ 631,051$11/2015 8 596,600$ 615,000$ 618,776$12/2015 8 594,700$ 611,600$ 615,355$
Resale$/SFandyear-over-yearpercentagechangetrailingtwelvemonthsDate ±Typ.Value $/SF %Change1/2015 -5.7% 374$ 5.9%2/2015 -6.8% 375$ 4.8%3/2015 -6.9% 375$ 4.7%4/2015 -6.7% 377$ 4.5%5/2015 -6.2% 378$ 3.8%6/2015 -5.3% 380$ 3.5%7/2015 -3.9% 384$ 3.3%8/2015 -3.5% 386$ 3.7%9/2015 -4.0% 388$ 3.6%10/2015 -5.0% 391$ 4.5%11/2015 -4.7% 392$ 4.7%12/2015 -4.1% 394$ 5.1% 0.00613984
Rentalrateandyear-over-yearpercentagechangetrailingtwelvemonthsDate %Change Rent Own HistoricCosttoOwnRelativetoRent1/2015 4.9% 2,616$ 2,494$ 2,632$2/2015 5.0% 2,599$ 2,454$ 2,615$3/2015 5.1% 2,599$ 2,441$ 2,615$4/2015 5.1% 2,599$ 2,441$ 2,615$5/2015 5.4% 2,648$ 2,469$ 2,665$6/2015 5.5% 2,674$ 2,516$ 2,691$7/2015 5.6% 2,708$ 2,590$ 2,724$8/2015 5.9% 2,749$ 2,632$ 2,766$9/2015 6.1% 2,766$ 2,647$ 2,783$10/2015 6.0% 2,758$ 2,636$ 2,774$11/2015 6.0% 2,750$ 2,645$ 2,767$12/2015 6.0% 2,742$ 2,652$ 2,759$
OrangeCountyHousingMarketNews
$520,000
$540,000
$560,000
$580,000
$600,000
$620,000
$640,000
1/2015
2/2015
3/2015
4/2015
5/2015
6/2015
7/2015
8/2015
9/2015
10/2015
11/2015
12/2015
Median RentalParity HistoricValue
$374$375$375$377$378
$380$384
$386$388$391$392
$394
$360$365$370$375$380$385$390$395$400
1/2015
2/2015
3/2015
4/2015
5/2015
6/2015
7/2015
8/2015
9/2015
10/2015
11/2015
12/2015
$2,616
$2,599
$2,599
$2,599
$2,648
$2,674
$2,708
$2,749
$2,766
$2,758
$2,750
$2,742
$2,200$2,300$2,400$2,500$2,600$2,700$2,800$2,900
1/2015
2/2015
3/2015
4/2015
5/2015
6/2015
7/2015
8/2015
9/2015
10/2015
11/2015
12/2015
Rent Own HistoricCosttoOwnRelagvetoRent

23of58
January2016ShevyAkason877-409-8515
OrangeCountymedianhomepricesinceJanuary1988
OrangeCountymedianrentandmonthlycostofownershipsinceJanuary1988
$0
$100,000
$200,000
$300,000
$400,000
$500,000
$600,000
$700,000
$800,000
1/1988
1/1989
1/1990
1/1991
1/1992
1/1993
1/1994
1/1995
1/1996
1/1997
1/1998
1/1999
1/2000
1/2001
1/2002
1/2003
1/2004
1/2005
1/2006
1/2007
1/2008
1/2009
1/2010
1/2011
1/2012
1/2013
1/2014
1/2015
1/2016
1/2017
MedianResale Projecgon RentalParity HistoricValue
$0
$500
$1,000
$1,500
$2,000
$2,500
$3,000
$3,500
$4,000
$4,500
1/1988
1/1989
1/1990
1/1991
1/1992
1/1993
1/1994
1/1995
1/1996
1/1997
1/1998
1/1999
1/2000
1/2001
1/2002
1/2003
1/2004
1/2005
1/2006
1/2007
1/2008
1/2009
1/2010
1/2011
1/2012
1/2013
1/2014
1/2015
MedianRent CosttoOwn HistoricCosttoOwnRelagvetoRent

24of58
January2016ShevyAkason877-409-8515
Resale$/SFYear-over-YearPercentageChange:OrangeCountysinceJanuary1989
Rental$/SFYear-over-YearPercentageChange:OrangeCountysinceJanuary1989
-8%
-6%
-4%
-2%
0%
2%
4%
6%
8%
10%
12%
14%
1/1989
1/1990
1/1991
1/1992
1/1993
1/1994
1/1995
1/1996
1/1997
1/1998
1/1999
1/2000
1/2001
1/2002
1/2003
1/2004
1/2005
1/2006
1/2007
1/2008
1/2009
1/2010
1/2011
1/2012
1/2013
1/2014
1/2015
Normalandsustainable
Rentalratesinexcessof7%arenotsustainable.Longperiodsofexcessiveappreciagonleadtoacrash.
Falling/Correcgng
Weak
-20%
-15%
-10%
-5%
0%
5%
10%
15%
20%
25%
30%
35%
40%
1/1989
1/1990
1/1991
1/1992
1/1993
1/1994
1/1995
1/1996
1/1997
1/1998
1/1999
1/2000
1/2001
1/2002
1/2003
1/2004
1/2005
1/2006
1/2007
1/2008
1/2009
1/2010
1/2011
1/2012
1/2013
1/2014
1/2015
Normalandsustainable
Appreciagonratesinexcessof7%arenotsustainable.Longperiodsofexcessiveappreciagonleadtoacrash.
Falling/Correcgng

25of58
January2016ShevyAkason877-409-8515
HistoricMedianHomePriceRelativetoRentalParity:OrangeCountysinceJanuary1988
OCHNMarketTimingSystemRating:OrangeCountysinceJanuary1988
-35.0%-28.0%-21.0%-14.0%-7.0%0.0%7.0%14.0%21.0%28.0%35.0%42.0%49.0%56.0%63.0%70.0%77.0%84.0%91.0%
1/1988
1/1989
1/1990
1/1991
1/1992
1/1993
1/1994
1/1995
1/1996
1/1997
1/1998
1/1999
1/2000
1/2001
1/2002
1/2003
1/2004
1/2005
1/2006
1/2007
1/2008
1/2009
1/2010
1/2011
1/2012
1/2013
1/2014
1/2015
Discou
ntorP
remium
ValueRelagvetoRentalParity HistoricNorm
Stableperiodbetweenhousingbubblesfrom1993-1999establisheshistoricnorm.
0
1
2
3
4
5
6
7
8
9
10
1/1988
1/1989
1/1990
1/1991
1/1992
1/1993
1/1994
1/1995
1/1996
1/1997
1/1998
1/1999
1/2000
1/2001
1/2002
1/2003
1/2004
1/2005
1/2006
1/2007
1/2008
1/2009
1/2010
1/2011
1/2012
1/2013
1/2014
1/2015
Values7-10:UndervaluedMarket:StrongBuyRecommendagon
Values4-6:NeutralMarket,WeakBuyRecommendagon
Values1-3:InflatedorWeakMarket:ConsiderSelling.DonotBuy.

26of58
January2016ShevyAkason877-409-8515
CashInvestorCapitalizationRate:OrangeCountysinceJanuary1988
FinancedInvestorCash-on-CashReturn:OrangeCountysinceJanuary1988
0.0%
2.0%
4.0%
6.0%
8.0%
10.0%
12.0%
1/1988
1/1989
1/1990
1/1991
1/1992
1/1993
1/1994
1/1995
1/1996
1/1997
1/1998
1/1999
1/2000
1/2001
1/2002
1/2003
1/2004
1/2005
1/2006
1/2007
1/2008
1/2009
1/2010
1/2011
1/2012
1/2013
1/2014
1/2015
CapitalizagonRate MortgageInterestRate
-25.0%
-20.0%
-15.0%
-10.0%
-5.0%
0.0%
5.0%
10.0%
15.0%
1/1988
1/1989
1/1990
1/1991
1/1992
1/1993
1/1994
1/1995
1/1996
1/1997
1/1998
1/1999
1/2000
1/2001
1/2002
1/2003
1/2004
1/2005
1/2006
1/2007
1/2008
1/2009
1/2010
1/2011
1/2012
1/2013
1/2014
1/2015

27of58
January2016ShevyAkason877-409-8515
Median Resale% Rent% Median Costof Ownership
City Resale$ ChangeYoY Resale$/SF ChangeYoY Rent$ Ownership Prem./Disc. CapRate
AlisoViejo 506,200$ 3.0% 357$ 4.3% 2,507$ 2,269$ (238)$ 4.8%
Anaheim 470,600$ 5.5% 319$ 5.2% 2,183$ 2,093$ (90)$ 4.5%
AnaheimHills 627,700$ 5.0% 337$ 3.4% 2,583$ 2,796$ 213$ 4.0%
Brea 625,300$ 4.9% 340$ 7.8% 2,561$ 2,803$ 242$ 3.9%
BuenaPark 475,900$ 6.8% 333$ 3.8% 2,303$ 2,128$ (175)$ 4.6%
CoronaDelMar 1,528,300$ 14.2% 1,106$ 0.5% 4,071$ 6,615$ 2,543$ 2.6%
CostaMesa 686,700$ 8.6% 458$ 5.9% 2,802$ 3,051$ 249$ 3.9%
CotoDeCaza 1,019,200$ 3.6% 343$ 3.8% 3,584$ 4,523$ 939$ 3.4%
Cypress 543,600$ 8.2% 352$ 1.0% 2,533$ 2,430$ (103)$ 4.5%
DanaPoint 801,100$ 9.1% 545$ 6.5% 2,584$ 3,553$ 969$ 3.1%
FountainValley 668,300$ 6.5% 362$ 4.1% 2,794$ 2,985$ 191$ 4.0%
Fullerton 524,400$ 5.4% 342$ 6.5% 2,519$ 2,311$ (209)$ 4.6%
GardenGrove 490,200$ 5.4% 336$ 4.3% 2,006$ 2,176$ 170$ 3.9%
HuntingtonBeach 678,500$ 6.2% 439$ 4.8% 2,718$ 3,019$ 301$ 3.8%
Irvine 712,800$ 3.7% 433$ 3.3% 3,006$ 3,201$ 196$ 4.0%
LaHabra 471,800$ 7.5% 324$ 5.5% 1,801$ 2,068$ 268$ 3.7%
LaPalma 615,200$ 2.5% 311$ 0.5% 2,628$ 2,751$ 122$ 4.1%
LaderaRanch 630,500$ 3.2% 329$ 2.7% 2,907$ 2,828$ (79)$ 4.4%
LagunaBeach 1,671,100$ 4.8% 1,051$ 6.0% 3,571$ 7,305$ 3,734$ 2.1%
LagunaHills 600,500$ 2.9% 344$ 5.0% 2,539$ 2,585$ 46$ 4.1%
LagunaNiguel 719,300$ 2.9% 388$ 4.2% 2,757$ 3,211$ 453$ 3.7%
LagunaWoods 228,900$ 4.5% 230$ 9.0% 1,731$ 1,023$ (708)$ 7.3%
LakeForest 575,100$ 5.2% 342$ 1.4% 2,490$ 2,560$ 70$ 4.2%
MissionViejo 620,000$ 5.3% 352$ 3.0% 2,693$ 2,761$ 68$ 4.2%
NewportBeach 1,513,600$ 6.2% 789$ 9.7% 3,522$ 6,715$ 3,193$ 2.2%
NewportCoast 2,923,400$ 0.6% 761$ 3.4% 4,456$ 12,835$ 8,379$ 1.5%
NorthTustin 867,800$ 5.2% 362$ 5.5% 1,539$ 4,341$ 2,803$ 1.7%
Orange 581,700$ 6.5% 352$ 9.3% 2,588$ 2,609$ 22$ 4.3%
Placentia 579,800$ 5.5% 316$ 8.9% 2,397$ 2,548$ 151$ 4.0%
RanchoSantaMargarita 563,700$ 5.1% 343$ 7.4% 2,453$ 2,518$ 66$ 4.2%
SanClemente 837,300$ 7.1% 433$ 9.8% 2,622$ 3,701$ 1,079$ 3.0%
SanJuanCapistrano 719,600$ 3.7% 351$ 1.6% 2,756$ 3,183$ 427$ 3.7%
SantaAna 416,600$ 8.6% 325$ 5.9% 1,999$ 1,862$ (137)$ 4.6%
Tustin 560,200$ 6.3% 375$ 6.5% 2,456$ 2,506$ 51$ 4.2%
Westminster 556,500$ 7.8% 372$ -3.4% 2,482$ 2,491$ 9$ 4.3%
YorbaLinda 726,200$ 4.0% 352$ 1.1% 3,069$ 3,230$ 161$ 4.1%
MarketPerformanceandTrends:OrangeCountyandMajorCitiesandZips
28of58
January2016ShevyAkason877-409-8515
Median Resale% Rent% Median Costof Ownership
City Resale$ ChangeYoY Resale$/SF ChangeYoY Rent$ Ownership Prem./Disc. CapRate
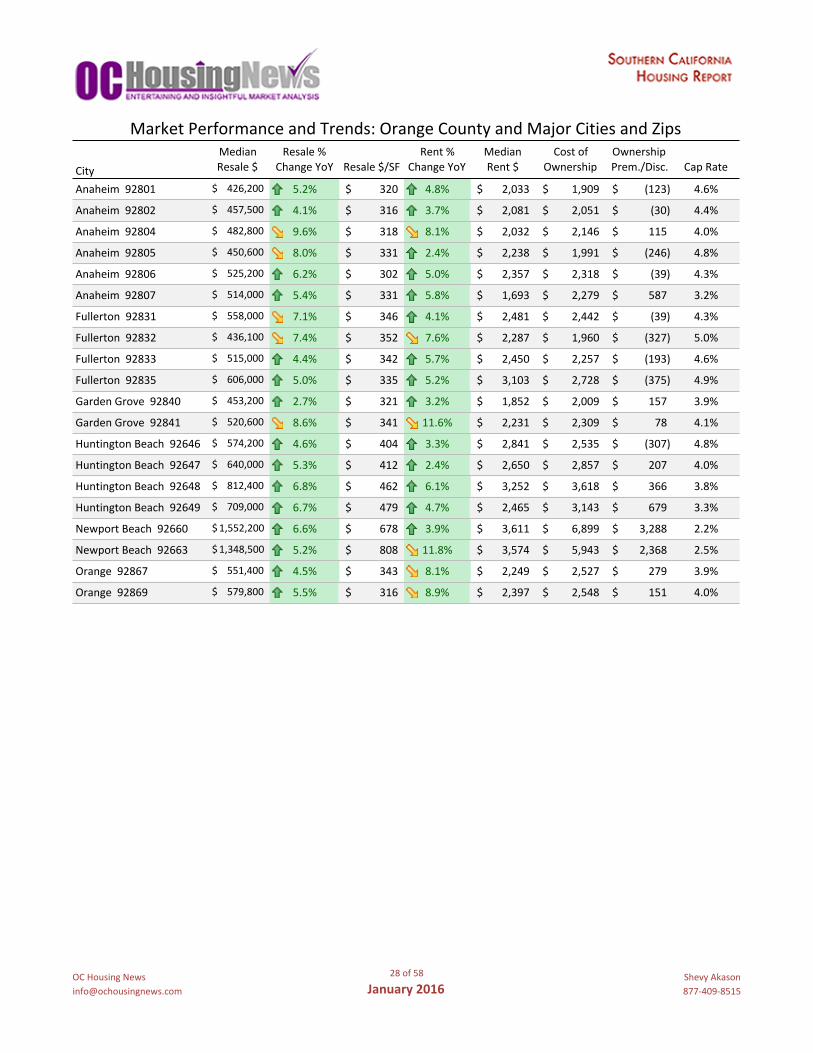
Anaheim92801 426,200$ 5.2% 320$ 4.8% 2,033$ 1,909$ (123)$ 4.6%
Anaheim92802 457,500$ 4.1% 316$ 3.7% 2,081$ 2,051$ (30)$ 4.4%
Anaheim92804 482,800$ 9.6% 318$ 8.1% 2,032$ 2,146$ 115$ 4.0%
Anaheim92805 450,600$ 8.0% 331$ 2.4% 2,238$ 1,991$ (246)$ 4.8%
Anaheim92806 525,200$ 6.2% 302$ 5.0% 2,357$ 2,318$ (39)$ 4.3%
Anaheim92807 514,000$ 5.4% 331$ 5.8% 1,693$ 2,279$ 587$ 3.2%
Fullerton92831 558,000$ 7.1% 346$ 4.1% 2,481$ 2,442$ (39)$ 4.3%
Fullerton92832 436,100$ 7.4% 352$ 7.6% 2,287$ 1,960$ (327)$ 5.0%
Fullerton92833 515,000$ 4.4% 342$ 5.7% 2,450$ 2,257$ (193)$ 4.6%
Fullerton92835 606,000$ 5.0% 335$ 5.2% 3,103$ 2,728$ (375)$ 4.9%
GardenGrove92840 453,200$ 2.7% 321$ 3.2% 1,852$ 2,009$ 157$ 3.9%
GardenGrove92841 520,600$ 8.6% 341$ 11.6% 2,231$ 2,309$ 78$ 4.1%
HuntingtonBeach92646 574,200$ 4.6% 404$ 3.3% 2,841$ 2,535$ (307)$ 4.8%
HuntingtonBeach92647 640,000$ 5.3% 412$ 2.4% 2,650$ 2,857$ 207$ 4.0%
HuntingtonBeach92648 812,400$ 6.8% 462$ 6.1% 3,252$ 3,618$ 366$ 3.8%
HuntingtonBeach92649 709,000$ 6.7% 479$ 4.7% 2,465$ 3,143$ 679$ 3.3%
NewportBeach92660 1,552,200$ 6.6% 678$ 3.9% 3,611$ 6,899$ 3,288$ 2.2%
NewportBeach92663 1,348,500$ 5.2% 808$ 11.8% 3,574$ 5,943$ 2,368$ 2.5%
Orange92867 551,400$ 4.5% 343$ 8.1% 2,249$ 2,527$ 279$ 3.9%
Orange92869 579,800$ 5.5% 316$ 8.9% 2,397$ 2,548$ 151$ 4.0%
MarketPerformanceandTrends:OrangeCountyandMajorCitiesandZips

29of58
January2016ShevyAkason877-409-8515
%Over/Under Historic %Over/UnderCity Rating Median RentalParity RentalParity Premium HistoricPrem.
AlisoViejo 8 506,200$ 559,300$ -9.6% -4.7% -4.9%Anaheim 8 470,600$ 487,100$ -3.5% 4.5% -8.0%AnaheimHills 9 627,700$ 576,300$ 7.5% 22.2% -14.7%Brea 7 625,300$ 571,300$ 9.5% 14.9% -5.4%BuenaPark 8 475,900$ 513,700$ -8.0% -1.5% -6.5%CoronaDelMar 7 1,528,300$ 908,300$ 59.6% 82.6% -23.0%CostaMesa 7 686,700$ 625,100$ 8.3% 13.8% -5.5%CotoDeCaza 10 1,019,200$ 799,600$ 27.3% 54.3% -27.0%Cypress 7 543,600$ 565,100$ -3.0% 17.6% -20.6%DanaPoint 7 801,100$ 576,400$ 34.1% 26.8% 7.3%FountainValley 9 668,300$ 623,400$ 9.0% 21.0% -12.0%Fullerton 8 524,400$ 562,100$ -8.2% -4.4% -3.8%GardenGrove 8 490,200$ 447,400$ 8.9% 5.3% 3.6%HuntingtonBeach 8 678,500$ 606,400$ 10.7% 15.8% -5.1%Irvine 8 712,800$ 670,500$ 6.7% 13.2% -6.5%LaHabra 6 471,800$ 401,700$ 15.5% 5.5% 10.0%LaPalma 7 615,200$ 586,400$ 5.6% 21.4% -15.8%LaderaRanch 9 630,500$ 648,600$ -4.7% 5.5% -10.2%LagunaBeach 3 1,671,100$ 796,700$ 107.3% 59.5% 47.8%LagunaHills 10 600,500$ 566,400$ 1.1% 27.8% -26.7%LagunaNiguel 8 719,300$ 615,100$ 14.0% 18.7% -4.7%LagunaWoods 10 228,900$ 386,000$ -40.9% -10.4% -30.5%LakeForest 6 575,100$ 555,500$ 2.1% 8.8% -6.7%MissionViejo 9 620,000$ 600,800$ 2.6% 11.6% -9.1%NewportBeach 6 1,513,600$ 785,800$ 88.3% 75.3% 13.0%NewportCoast 1 2,923,400$ 994,000$ 181.3% 105.3% 76.0%NorthTustin 1 867,800$ 343,300$ 151.1% 46.4% 104.7%Orange 6 581,700$ 577,300$ -0.2% -9.6% 9.4%Placentia 7 579,800$ 534,800$ 3.4% -1.3% 4.7%RanchoSantaMargarita 7 563,700$ 547,200$ 0.0% 2.2% -2.1%SanClemente 5 837,300$ 585,000$ 40.6% 28.9% 11.7%SanJuanCapistrano 6 719,600$ 614,700$ 14.8% 22.7% -7.8%SantaAna 7 416,600$ 445,900$ -8.2% -1.4% -6.8%Tustin 8 560,200$ 547,800$ 2.2% 6.3% -4.0%Westminster 3 556,500$ 553,700$ 4.1% 5.8% -1.7%YorbaLinda 8 726,200$ 684,800$ 4.9% 23.6% -18.7%
MarketTimingRatingandValuations:OrangeCountyandMajorCitiesandZips

30of58
January2016ShevyAkason877-409-8515
%Over/Under Historic %Over/UnderCity Rating Median RentalParity RentalParity Premium HistoricPrem.
Anaheim92801 7 426,200$ 453,400$ -5.6% -16.5% 11.0%Anaheim92802 9 457,500$ 464,200$ -2.4% 5.7% -8.1%Anaheim92804 5 482,800$ 453,200$ 2.8% -10.0% 12.8%Anaheim92805 6 450,600$ 455,700$ -1.5% -12.7% 11.2%Anaheim92806 8 525,200$ 525,900$ -1.5% 0.4% -1.9%Anaheim92807 3 514,000$ 377,600$ 34.6% -10.9% 45.6%Fullerton92831 7 558,000$ 544,700$ 4.1% -1.9% 6.0%Fullerton92832 6 436,100$ 510,200$ -15.0% -12.7% -2.3%Fullerton92833 9 515,000$ 546,600$ -8.3% 2.3% -10.6%Fullerton92835 10 606,000$ 692,300$ -9.8% 47.3% -57.1%GardenGrove92840 8 453,200$ 413,100$ 8.0% 9.6% -1.6%GardenGrove92841 7 520,600$ 497,700$ 3.6% 18.2% -14.6%HuntingtonBeach92646 10 574,200$ 633,900$ -10.8% 10.2% -21.0%HuntingtonBeach92647 8 640,000$ 591,200$ 7.8% 13.1% -5.3%HuntingtonBeach92648 10 812,400$ 725,500$ 13.4% 56.1% -42.7%HuntingtonBeach92649 8 709,000$ 549,800$ 27.9% 21.8% 6.1%NewportBeach92660 8 1,552,200$ 805,600$ 90.6% 83.2% 7.4%NewportBeach92663 3 1,348,500$ 797,300$ 68.6% 36.5% 32.1%Orange92867 6 551,400$ 501,700$ 9.3% 0.6% 8.7%Orange92869 7 579,800$ 534,800$ 3.4% -1.3% 4.7%
MarketTimingRatingandValuations:OrangeCountyandMajorCitiesandZips

31of58
January2016ShevyAkason877-409-8515
Historically,propertiesinthismarketsellata18.5%discount.Today'sdiscountis23.5%.Thismarketis4.9%undervalued.Medianhomepriceis$306,900witharentalparityvalueof$397,300.Thismarket'sdiscountis$90,400.Monthlypaymentaffordabilityhasbeenimprovingoverthelast3month(s).Momentumsuggestsimprovingaffordability.Resalepricesona$/SFbasisincreasedfrom$172/SFto$173/SF.Resalepriceshavebeenrisingfor2month(s).Overthelast12months,resalepricesrose4.9%indicatingalongertermupwardpricetrend.Medianrentalratesdeclined$4lastmonthfrom$1,785to$1,781.Thecurrentcapitalizationrate(rent/price)is5.6%.Rentshavebeenrisingfor12month(s).Pricemomentumsignalsrisingrentsoverthenextthreemonths.Marketrating=8
MedianHomePriceandRentalParitytrailingtwelvemonthsDate Rating Median RentalParity HistoricValue1/2015 7 289,600$ 389,100$ 316,987$2/2015 8 290,500$ 389,100$ 316,987$3/2015 8 292,300$ 386,200$ 314,625$4/2015 8 294,800$ 392,900$ 320,083$5/2015 8 298,100$ 388,600$ 316,580$6/2015 8 301,000$ 385,700$ 314,217$7/2015 8 305,100$ 388,000$ 316,091$8/2015 8 306,300$ 398,400$ 324,563$9/2015 8 306,500$ 401,800$ 327,333$10/2015 8 306,100$ 406,200$ 330,918$11/2015 8 307,400$ 399,300$ 325,297$12/2015 8 306,900$ 397,300$ 323,667$
Resale$/SFandyear-over-yearpercentagechangetrailingtwelvemonthsDate ±Typ.Value $/SF %Change1/2015 -5.6% 165$ 7.4%2/2015 -6.5% 164$ 5.4%3/2015 -6.5% 166$ 4.7%4/2015 -6.3% 168$ 4.2%5/2015 -5.7% 169$ 3.9%6/2015 -4.9% 170$ 3.6%7/2015 -3.7% 171$ 3.6%8/2015 -3.6% 172$ 3.4%9/2015 -4.2% 172$ 3.9%10/2015 -5.3% 172$ 4.3%11/2015 -5.3% 172$ 4.7%12/2015 -4.9% 173$ 4.9% -0.1853326
Rentalrateandyear-over-yearpercentagechangetrailingtwelvemonthsDate %Change Rent Own HistoricCosttoOwnRelativetoRent1/2015 2.2% 1,692$ 1,287$ 1,378$2/2015 2.2% 1,692$ 1,270$ 1,378$3/2015 2.4% 1,692$ 1,267$ 1,378$4/2015 2.4% 1,700$ 1,273$ 1,385$5/2015 2.7% 1,717$ 1,291$ 1,399$6/2015 2.9% 1,733$ 1,315$ 1,412$7/2015 3.4% 1,758$ 1,351$ 1,432$8/2015 3.7% 1,775$ 1,366$ 1,446$9/2015 4.0% 1,786$ 1,370$ 1,455$10/2015 4.2% 1,786$ 1,357$ 1,455$11/2015 4.6% 1,786$ 1,361$ 1,455$12/2015 5.0% 1,781$ 1,365$ 1,451$
RiversideCountyHousingMarketNews
$-
$100,000
$200,000
$300,000
$400,000
$500,000
1/2015
2/2015
3/2015
4/2015
5/2015
6/2015
7/2015
8/2015
9/2015
10/2015
11/2015
12/2015
Median RentalParity HistoricValue
$165$164$166$168
$169$170$171$172$172$172$172
$173
$150
$155
$160
$165
$170
$175
1/2015
2/2015
3/2015
4/2015
5/2015
6/2015
7/2015
8/2015
9/2015
10/2015
11/2015
12/2015
$1,692
$1,692
$1,692
$1,700
$1,717
$1,733
$1,758
$1,775
$1,786
$1,786
$1,786
$1,781
$1,000
$1,200
$1,400
$1,600
$1,800
$2,000
1/2015
2/2015
3/2015
4/2015
5/2015
6/2015
7/2015
8/2015
9/2015
10/2015
11/2015
12/2015
Rent Own HistoricCosttoOwnRelagvetoRent
32of58
January2016ShevyAkason877-409-8515
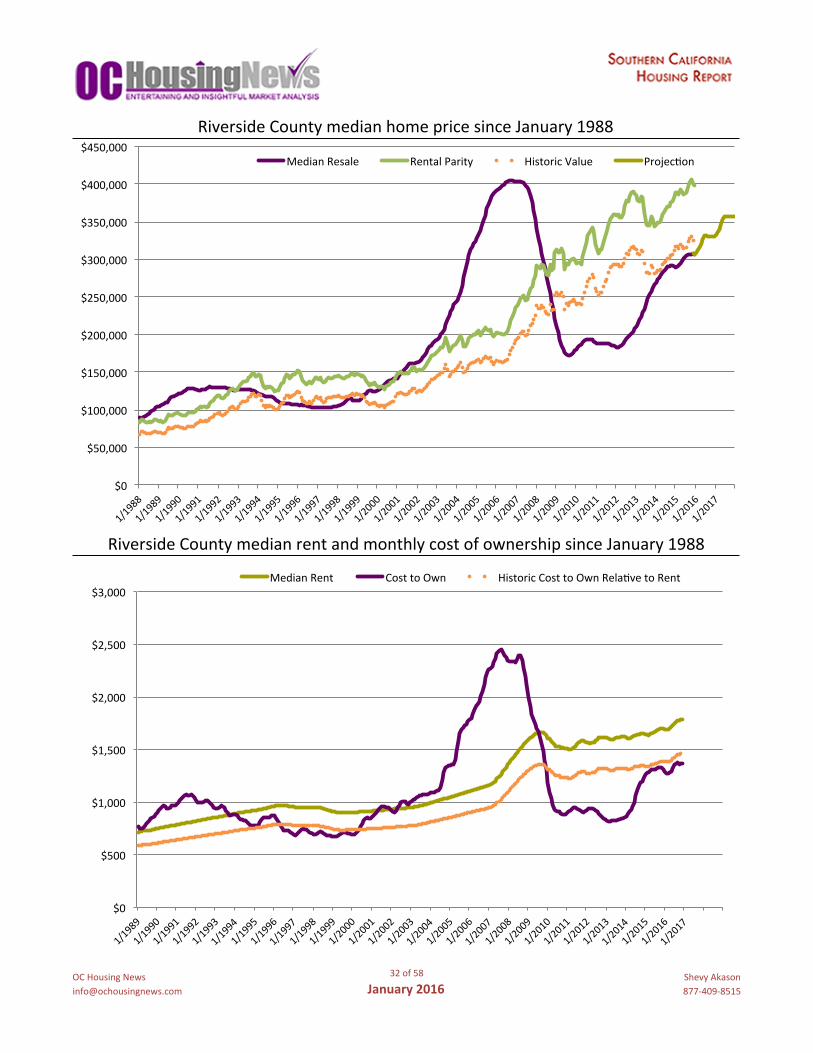
RiversideCountymedianhomepricesinceJanuary1988
RiversideCountymedianrentandmonthlycostofownershipsinceJanuary1988
$0
$50,000
$100,000
$150,000
$200,000
$250,000
$300,000
$350,000
$400,000
$450,000
1/1988
1/1989
1/1990
1/1991
1/1992
1/1993
1/1994
1/1995
1/1996
1/1997
1/1998
1/1999
1/2000
1/2001
1/2002
1/2003
1/2004
1/2005
1/2006
1/2007
1/2008
1/2009
1/2010
1/2011
1/2012
1/2013
1/2014
1/2015
1/2016
1/2017
MedianResale RentalParity HistoricValue Projecgon
$0
$500
$1,000
$1,500
$2,000
$2,500
$3,000
1/1989
1/1990
1/1991
1/1992
1/1993
1/1994
1/1995
1/1996
1/1997
1/1998
1/1999
1/2000
1/2001
1/2002
1/2003
1/2004
1/2005
1/2006
1/2007
1/2008
1/2009
1/2010
1/2011
1/2012
1/2013
1/2014
1/2015
1/2016
1/2017
MedianRent CosttoOwn HistoricCosttoOwnRelagvetoRent

33of58
January2016ShevyAkason877-409-8515
Resale$/SFYear-over-YearPercentageChange:RiversideCountysinceJanuary1989
Rental$/SFYear-over-YearPercentageChange:RiversideCountysinceJanuary1989
-8%
-6%
-4%
-2%
0%
2%
4%
6%
8%
10%
12%
14%
16%
18%
1/1989
1/1990
1/1991
1/1992
1/1993
1/1994
1/1995
1/1996
1/1997
1/1998
1/1999
1/2000
1/2001
1/2002
1/2003
1/2004
1/2005
1/2006
1/2007
1/2008
1/2009
1/2010
1/2011
1/2012
1/2013
1/2014
1/2015
1/2016
1/2017
Normalandsustainable
Rentalratesinexcessof7%arenotsustainable.Longperiodsofexcessiveappreciagonleadtoacrash.
Falling/Correcgng
Weak
-50%-45%-40%-35%-30%-25%-20%-15%-10%-5%0%5%
10%15%20%25%30%35%40%45%50%
1/1989
1/1990
1/1991
1/1992
1/1993
1/1994
1/1995
1/1996
1/1997
1/1998
1/1999
1/2000
1/2001
1/2002
1/2003
1/2004
1/2005
1/2006
1/2007
1/2008
1/2009
1/2010
1/2011
1/2012
1/2013
1/2014
1/2015
1/2016
1/2017
Normalandsustainable
Appreciagonratesinexcessof7%arenotsustainable.Longperiodsofexcessiveappreciagonleadtoacrash.
Falling/Correcgng

34of58
January2016ShevyAkason877-409-8515
HistoricMedianHomePriceRelativetoRentalParity:RiversideCountysinceJanuary1988
OCHNMarketTimingSystemRating:RiversideCountysinceJanuary1988
-63.0%-56.0%-49.0%-42.0%-35.0%-28.0%-21.0%-14.0%-7.0%0.0%7.0%14.0%21.0%28.0%35.0%42.0%49.0%56.0%63.0%70.0%77.0%84.0%91.0%98.0%
105.0%112.0%
1/1989
1/1990
1/1991
1/1992
1/1993
1/1994
1/1995
1/1996
1/1997
1/1998
1/1999
1/2000
1/2001
1/2002
1/2003
1/2004
1/2005
1/2006
1/2007
1/2008
1/2009
1/2010
1/2011
1/2012
1/2013
1/2014
1/2015
1/2016
1/2017
Discou
ntorP
remium
ValueRelagvetoRentalParity HistoricNorm
Stableperiodbetweenhousingbubblesfrom1993-1999establisheshistoricnorm.
0
1
2
3
4
5
6
7
8
9
10
1/1988
1/1989
1/1990
1/1991
1/1992
1/1993
1/1994
1/1995
1/1996
1/1997
1/1998
1/1999
1/2000
1/2001
1/2002
1/2003
1/2004
1/2005
1/2006
1/2007
1/2008
1/2009
1/2010
1/2011
1/2012
1/2013
1/2014
1/2015
1/2016
1/2017
Values7-10:UndervaluedMarket:StrongBuyRecommendagon
Values4-6:NeutralMarket,WeakBuyRecommendagon
Values1-3:InflatedorWeakMarket:ConsiderSelling.DonotBuy.
35of58
January2016ShevyAkason877-409-8515
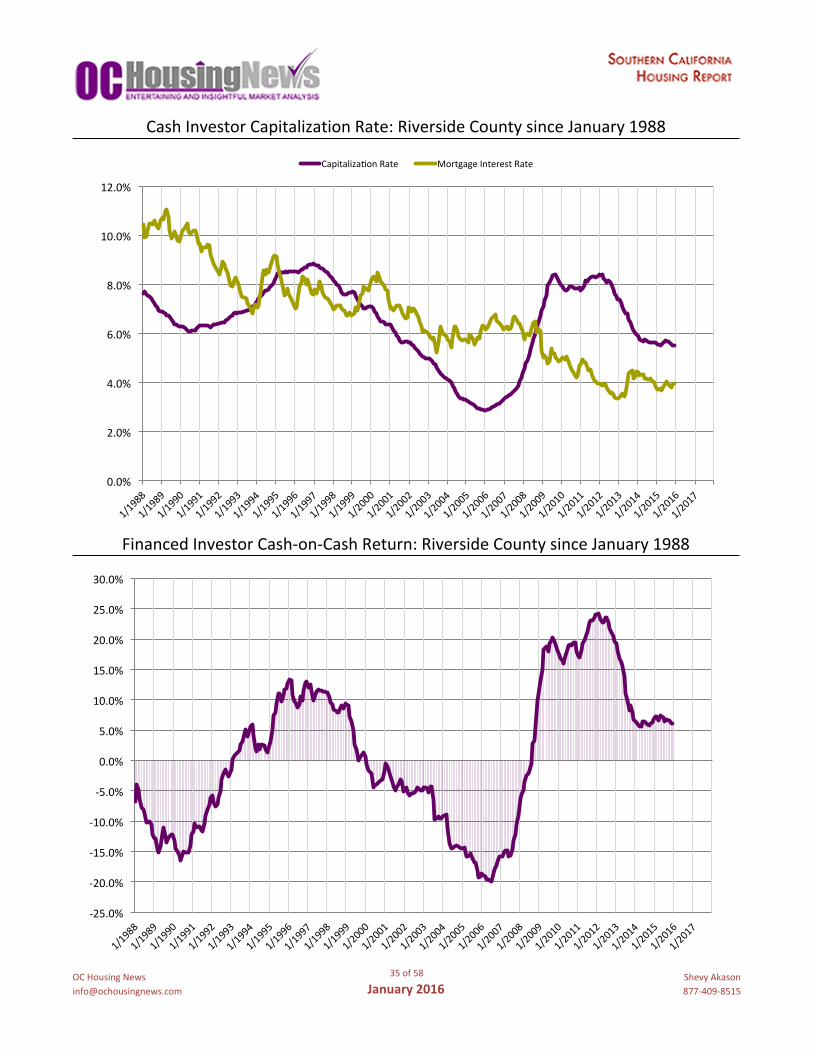
CashInvestorCapitalizationRate:RiversideCountysinceJanuary1988
FinancedInvestorCash-on-CashReturn:RiversideCountysinceJanuary1988
0.0%
2.0%
4.0%
6.0%
8.0%
10.0%
12.0%
1/1988
1/1989
1/1990
1/1991
1/1992
1/1993
1/1994
1/1995
1/1996
1/1997
1/1998
1/1999
1/2000
1/2001
1/2002
1/2003
1/2004
1/2005
1/2006
1/2007
1/2008
1/2009
1/2010
1/2011
1/2012
1/2013
1/2014
1/2015
1/2016
1/2017
CapitalizagonRate MortgageInterestRate
-25.0%
-20.0%
-15.0%
-10.0%
-5.0%
0.0%
5.0%
10.0%
15.0%
20.0%
25.0%
30.0%
1/1988
1/1989
1/1990
1/1991
1/1992
1/1993
1/1994
1/1995
1/1996
1/1997
1/1998
1/1999
1/2000
1/2001
1/2002
1/2003
1/2004
1/2005
1/2006
1/2007
1/2008
1/2009
1/2010
1/2011
1/2012
1/2013
1/2014
1/2015
1/2016
1/2017

36of58
January2016ShevyAkason877-409-8515
Median Resale% Rent% Median Costof Ownership
City Resale$ ChangeYoY Resale$/SF ChangeYoY Rent$ Ownership Prem./Disc. CapRate
Banning 202,600$ 3.3% 138$ 6.7% 1,174$ 905$ (270)$ 5.6%
Beaumont 272,000$ 6.7% 138$ 0.3% 1,698$ 1,209$ (489)$ 6.0%
CathedralCity 249,100$ 2.6% 150$ 1.4% 1,592$ 1,129$ (464)$ 6.1%
Corona 406,500$ 5.5% 217$ 4.4% 2,145$ 1,812$ (333)$ 5.1%
DesertHotSprings 160,500$ 12.6% 104$ 8.1% 967$ 711$ (256)$ 5.8%
Hemet 194,100$ 6.2% 116$ 8.0% 1,204$ 870$ (334)$ 6.0%
Indio 271,100$ 6.1% 148$ 2.0% 1,615$ 1,201$ (414)$ 5.7%
LaQuinta 376,100$ 7.5% 212$ 2.8% 1,481$ 1,646$ 165$ 3.8%
LakeElsinore 302,000$ 9.3% 154$ 7.2% 1,735$ 1,341$ (394)$ 5.5%
Menifee 306,500$ 7.3% 151$ 5.7% 1,606$ 1,365$ (241)$ 5.0%
MorenoValley 262,000$ 7.6% 156$ 3.6% 1,556$ 1,163$ (393)$ 5.7%
Murrieta 356,100$ 7.3% 166$ 5.2% 1,839$ 1,590$ (249)$ 5.0%
Norco 462,600$ 6.7% 248$ -1.7% 2,195$ 2,047$ (148)$ 4.6%
PalmDesert 308,500$ 5.5% 189$ 8.6% 1,557$ 1,378$ (179)$ 4.8%
PalmSprings 323,100$ 2.8% 233$ 5.9% 1,375$ 1,405$ 30$ 4.1%
Perris 246,300$ 7.4% 143$ 1.6% 1,443$ 1,085$ (359)$ 5.6%
RanchoMirage 394,100$ -4.8% 198$ -6.1% 2,013$ 1,776$ (237)$ 4.9%
Riverside 330,400$ 5.5% 200$ 2.1% 1,748$ 1,456$ (292)$ 5.1%
SanJacinto 216,300$ 7.2% 116$ 5.7% 1,434$ 966$ (467)$ 6.4%
SunCity 197,600$ 2.2% 141$ 0.1% 1,076$ 872$ (205)$ 5.2%
Temecula 403,700$ 5.0% 192$ 4.5% 2,003$ 1,789$ (214)$ 4.8%
Wildomar 308,200$ 10.9% 156$ 7.1% 1,785$ 1,380$ (405)$ 5.6%
Banning92220 202,600$ 3.3% 142$ 6.4% 1,174$ 905$ (270)$ 5.6%
Beaumont92223 271,900$ 6.4% 137$ 0.3% 1,698$ 1,208$ (490)$ 6.0%
CanyonLake92587 350,800$ 1.4% 185$ 2.3% 1,909$ 1,557$ (352)$ 5.2%
CathedralCity92234 245,900$ 2.4% 150$ 1.5% 1,600$ 1,115$ (486)$ 6.2%
Corona92880 415,600$ 2.8% 207$ 11.8% 2,283$ 1,851$ (433)$ 5.3%
Corona92881 442,400$ 3.6% 218$ 2.6% 2,228$ 2,002$ (226)$ 4.8%
Corona92882 402,200$ 9.7% 237$ 2.4% 2,228$ 1,800$ (428)$ 5.3%
Corona92883 409,500$ 3.7% 198$ 2.6% 2,225$ 1,829$ (396)$ 5.2%
DesertHotSprings92240 159,900$ 12.2% 103$ 10.6% 1,004$ 712$ (292)$ 6.0%
Hemet92544 201,000$ 7.0% 120$ 5.9% 1,214$ 898$ (316)$ 5.8%
Hemet92545 219,700$ 7.8% 119$ 7.2% 1,315$ 978$ (336)$ 5.7%
Indio92201 229,800$ 8.5% 145$ -1.4% 1,433$ 1,048$ (385)$ 6.0%
Indio92203 289,300$ 2.8% 151$ 2.5% 1,759$ 1,283$ (477)$ 5.8%
LaQuinta92253 376,900$ 7.5% 212$ 2.8% 1,481$ 1,649$ 168$ 3.8%
MarketPerformanceandTrends:RiversideCounty,MajorCities,andZips

37of58
January2016ShevyAkason877-409-8515
Median Resale% Rent% Median Costof Ownership
City Resale$ ChangeYoY Resale$/SF ChangeYoY Rent$ Ownership Prem./Disc. CapRate
LakeElsinore92530 279,600$ 8.2% 161$ 8.5% 1,393$ 1,233$ (159)$ 4.8%
Menifee92584 317,600$ 7.0% 151$ 2.9% 1,757$ 1,416$ (341)$ 5.3%
MorenoValley92551 250,800$ 7.2% 151$ 10.0% 1,388$ 1,115$ (273)$ 5.3%
MorenoValley92553 239,500$ 8.9% 167$ 5.7% 1,416$ 1,059$ (357)$ 5.7%
MorenoValley92555 301,800$ 2.3% 135$ 2.8% 1,700$ 1,336$ (364)$ 5.4%
MorenoValley92557 276,200$ 11.5% 165$ 0.6% 1,532$ 1,226$ (306)$ 5.3%
Murrieta92562 358,700$ 7.0% 179$ 4.5% 1,892$ 1,606$ (285)$ 5.1%
Murrieta92563 353,200$ 7.9% 155$ 6.3% 1,790$ 1,564$ (226)$ 4.9%
Norco92860 462,600$ 6.7% 248$ -1.7% 2,195$ 2,047$ (148)$ 4.6%
PalmDesert92211 307,400$ 4.5% 182$ 2.5% 1,659$ 1,381$ (279)$ 5.2%
PalmDesert92260 307,700$ 6.9% 198$ 16.4% 1,475$ 1,382$ (92)$ 4.6%
PalmSprings92262 330,500$ 1.8% 242$ 12.0% 1,618$ 1,444$ (173)$ 4.7%
PalmSprings92264 315,900$ 3.4% 222$ -2.2% 1,434$ 1,404$ (29)$ 4.4%
Perris92571 247,700$ 3.7% 142$ 2.5% 1,456$ 1,090$ (366)$ 5.6%
RanchoMirage92270 394,100$ -4.9% 198$ -6.0% 2,013$ 1,776$ (237)$ 4.9%
Riverside92503 330,900$ 5.8% 203$ 1.1% 1,731$ 1,448$ (283)$ 5.0%
Riverside92504 297,400$ 8.8% 205$ 8.6% 1,559$ 1,319$ (240)$ 5.0%
Riverside92506 361,800$ 7.2% 219$ 8.1% 1,629$ 1,620$ (8)$ 4.3%
Riverside92507 280,700$ 5.1% 195$ 3.6% 1,375$ 1,233$ (142)$ 4.7%
Riverside92508 414,800$ 3.6% 176$ -3.7% 1,973$ 1,838$ (135)$ 4.6%
SanJacinto92583 201,200$ 9.1% 122$ 5.7% 1,302$ 905$ (397)$ 6.2%
SunCity92586 183,200$ 1.1% 139$ 5.2% 1,085$ 814$ (270)$ 5.7%
Temecula92592 403,600$ 5.5% 193$ 3.9% 1,993$ 1,789$ (204)$ 4.7%
Wildomar92595 309,300$ 11.2% 156$ 6.5% 1,740$ 1,384$ (356)$ 5.4%
MarketPerformanceandTrends:RiversideCounty,MajorCities,andZips

38of58
January2016ShevyAkason877-409-8515
%Over/Under Historic %Over/UnderCity Rating Median RentalParity RentalParity Premium HistoricPrem.
Banning 9 202,600$ 397,300$ -24.1% -14.6% -9.5%Beaumont 6 272,000$ 378,800$ -28.7% -31.6% 2.9%CathedralCity 7 249,100$ 355,200$ -27.7% -18.0% -9.7%Corona 8 406,500$ 478,400$ -15.7% -19.4% 3.7%DesertHotSprings 6 160,500$ 215,600$ -25.1% -26.9% 1.8%Hemet 7 194,100$ 268,500$ -27.5% -20.2% -7.3%Indio 8 271,100$ 360,300$ -24.6% -31.2% 6.6%LaQuinta 6 376,100$ 330,300$ 10.5% -3.5% 14.1%LakeElsinore 6 302,000$ 387,000$ -23.7% -27.4% 3.7%Menifee 8 306,500$ 358,200$ -15.1% -7.0% -8.1%MorenoValley 7 262,000$ 347,200$ -25.2% -18.4% -6.8%Murrieta 8 356,100$ 410,200$ -14.0% -3.9% -10.1%Norco 5 462,600$ 489,700$ -5.1% -7.6% 2.5%PalmDesert 10 308,500$ 347,400$ -11.0% 14.9% -25.9%PalmSprings 7 323,100$ 306,700$ 2.6% -11.1% 13.7%Perris 5 246,300$ 322,000$ -25.2% -26.8% 1.6%RanchoMirage 6 394,100$ 449,000$ -11.8% 21.3% -33.1%Riverside 8 330,400$ 390,000$ -16.5% -20.4% 3.9%SanJacinto 8 216,300$ 319,900$ -31.8% -23.5% -8.2%SunCity 7 197,600$ 240,100$ -17.2% -4.0% -13.2%Temecula 8 403,700$ 446,800$ -12.3% -9.2% -3.1%Wildomar 8 308,200$ 398,100$ -23.0% -5.5% -17.5%
Banning92220 9 202,600$ 262,000$ -24.1% -13.9% -10.2%Beaumont92223 6 271,900$ 378,800$ -28.7% -33.6% 4.9%CanyonLake92587 9 350,800$ 425,900$ -18.7% 5.9% -24.5%CathedralCity92234 7 245,900$ 357,000$ -29.1% -20.1% -9.1%Corona92880 7 415,600$ 509,400$ -18.5% -19.9% 1.4%Corona92881 8 442,400$ 497,000$ -10.3% -10.2% -0.1%Corona92882 7 402,200$ 496,900$ -17.3% -10.2% -7.1%Corona92883 8 409,500$ 496,400$ -17.8% -22.0% 4.2%DesertHotSprings92240 7 159,900$ 224,000$ -30.5% -19.1% -11.3%Hemet92544 10 201,000$ 270,800$ -24.5% -1.9% -22.7%Hemet92545 6 219,700$ 293,300$ -25.6% -20.5% -5.1%Indio92201 4 229,800$ 319,600$ -27.2% -30.5% 3.3%Indio92203 10 289,300$ 392,500$ -27.1% -4.1% -23.0%LaQuinta92253 5 376,900$ 330,300$ 10.7% -8.2% 18.9%
MarketTimingRatingandValuations:RiversideCounty,MajorCities,andZips

39of58
January2016ShevyAkason877-409-8515
%Over/Under Historic %Over/Under
City Rating Median RentalParity RentalParity Premium HistoricPrem.
LakeElsinore92530 6 279,600$ 310,600$ -15.9% -18.2% 2.3%Menifee92584 8 317,600$ 391,900$ -18.9% -10.1% -8.8%MorenoValley92551 6 250,800$ 309,500$ -20.6% -14.6% -6.0%MorenoValley92553 7 239,500$ 315,800$ -25.9% -22.3% -3.6%MorenoValley92555 9 301,800$ 379,200$ -20.6% -5.7% -14.9%MorenoValley92557 6 276,200$ 341,800$ -19.8% -11.0% -8.8%Murrieta92562 9 358,700$ 422,000$ -15.1% 0.3% -15.3%Murrieta92563 7 353,200$ 399,200$ -13.3% -6.3% -7.1%Norco92860 5 462,600$ 489,700$ -5.1% -7.6% 2.5%PalmDesert92211 10 307,400$ 370,200$ -16.4% 22.5% -38.9%PalmDesert92260 8 307,700$ 328,900$ -4.4% 9.8% -14.3%PalmSprings92262 4 330,500$ 360,800$ -8.7% -17.9% 9.2%PalmSprings92264 4 315,900$ 319,800$ -4.2% -1.7% -2.4%Perris92571 8 247,700$ 324,800$ -25.5% -29.5% 4.0%RanchoMirage92270 4 394,100$ 449,000$ -11.8% 8.0% -19.8%Riverside92503 6 330,900$ 386,000$ -17.3% -23.0% 5.7%Riverside92504 5 297,400$ 347,700$ -14.5% -24.5% 10.0%Riverside92506 6 361,800$ 363,300$ -2.1% 0.0% -2.2%Riverside92507 8 280,700$ 306,700$ -11.2% -18.5% 7.3%Riverside92508 3 414,800$ 440,100$ -6.3% -16.9% 10.5%SanJacinto92583 8 201,200$ 290,500$ -31.1% -17.7% -13.5%SunCity92586 8 183,200$ 242,000$ -23.3% -4.1% -19.1%Temecula92592 8 403,600$ 444,700$ -10.5% -10.4% -0.1%Wildomar92595 9 309,300$ 388,200$ -21.6% -5.5% -16.1%
MarketTimingRatingandValuations:RiversideCounty,MajorCities,andZips
40of58
January2016ShevyAkason877-409-8515
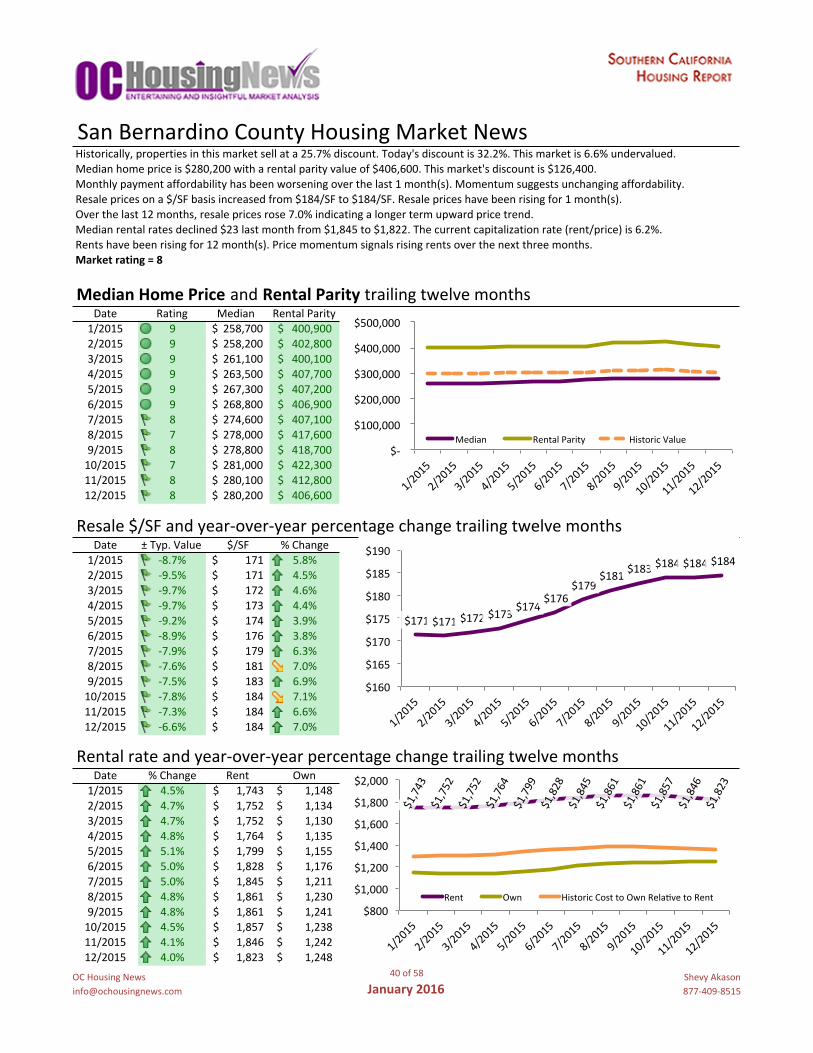
Historically,propertiesinthismarketsellata25.7%discount.Today'sdiscountis32.2%.Thismarketis6.6%undervalued.Medianhomepriceis$280,200witharentalparityvalueof$406,600.Thismarket'sdiscountis$126,400.Monthlypaymentaffordabilityhasbeenworseningoverthelast1month(s).Momentumsuggestsunchangingaffordability.Resalepricesona$/SFbasisincreasedfrom$184/SFto$184/SF.Resalepriceshavebeenrisingfor1month(s).Overthelast12months,resalepricesrose7.0%indicatingalongertermupwardpricetrend.Medianrentalratesdeclined$23lastmonthfrom$1,845to$1,822.Thecurrentcapitalizationrate(rent/price)is6.2%.Rentshavebeenrisingfor12month(s).Pricemomentumsignalsrisingrentsoverthenextthreemonths.Marketrating=8
MedianHomePriceandRentalParitytrailingtwelvemonthsDate Rating Median RentalParity HistoricValue1/2015 9 258,700$ 400,900$ 297,987$2/2015 9 258,200$ 402,800$ 299,399$3/2015 9 261,100$ 400,100$ 297,392$4/2015 9 263,500$ 407,700$ 303,041$5/2015 9 267,300$ 407,200$ 302,670$6/2015 9 268,800$ 406,900$ 302,447$7/2015 8 274,600$ 407,100$ 302,595$8/2015 7 278,000$ 417,600$ 310,400$9/2015 8 278,800$ 418,700$ 311,218$10/2015 7 281,000$ 422,300$ 313,893$11/2015 8 280,100$ 412,800$ 306,832$12/2015 8 280,200$ 406,600$ 302,224$
Resale$/SFandyear-over-yearpercentagechangetrailingtwelvemonthsDate ±Typ.Value $/SF %Change1/2015 -8.7% 171$ 5.8%2/2015 -9.5% 171$ 4.5%3/2015 -9.7% 172$ 4.6%4/2015 -9.7% 173$ 4.4%5/2015 -9.2% 174$ 3.9%6/2015 -8.9% 176$ 3.8%7/2015 -7.9% 179$ 6.3%8/2015 -7.6% 181$ 7.0%9/2015 -7.5% 183$ 6.9%10/2015 -7.8% 184$ 7.1%11/2015 -7.3% 184$ 6.6%12/2015 -6.6% 184$ 7.0% -0.2567051
Rentalrateandyear-over-yearpercentagechangetrailingtwelvemonthsDate %Change Rent Own HistoricCosttoOwnRelativetoRent1/2015 4.5% 1,743$ 1,148$ 1,296$2/2015 4.7% 1,752$ 1,134$ 1,302$3/2015 4.7% 1,752$ 1,130$ 1,303$4/2015 4.8% 1,764$ 1,135$ 1,311$5/2015 5.1% 1,799$ 1,155$ 1,337$6/2015 5.0% 1,828$ 1,176$ 1,359$7/2015 5.0% 1,845$ 1,211$ 1,371$8/2015 4.8% 1,861$ 1,230$ 1,383$9/2015 4.8% 1,861$ 1,241$ 1,383$10/2015 4.5% 1,857$ 1,238$ 1,380$11/2015 4.1% 1,846$ 1,242$ 1,372$12/2015 4.0% 1,823$ 1,248$ 1,355$
SanBernardinoCountyHousingMarketNews
$-
$100,000
$200,000
$300,000
$400,000
$500,000
1/2015
2/2015
3/2015
4/2015
5/2015
6/2015
7/2015
8/2015
9/2015
10/2015
11/2015
12/2015
Median RentalParity HistoricValue
$171$171$172$173$174
$176$179
$181$183$184$184$184
$160
$165
$170
$175
$180
$185
$190
1/2015
2/2015
3/2015
4/2015
5/2015
6/2015
7/2015
8/2015
9/2015
10/2015
11/2015
12/2015
$1,743
$1,752
$1,752
$1,764
$1,799
$1,828
$1,845
$1,861
$1,861
$1,857
$1,846
$1,823
$800
$1,000
$1,200
$1,400
$1,600
$1,800
$2,000
1/2015
2/2015
3/2015
4/2015
5/2015
6/2015
7/2015
8/2015
9/2015
10/2015
11/2015
12/2015
Rent Own HistoricCosttoOwnRelagvetoRent

41of58
January2016ShevyAkason877-409-8515
SanBernardinoCountymedianhomepricesinceJanuary1988
SanBernardinoCountymedianrentandmonthlycostofownershipsinceJanuary1988
$0
$50,000
$100,000
$150,000
$200,000
$250,000
$300,000
$350,000
$400,000
$450,000
1/1988
1/1989
1/1990
1/1991
1/1992
1/1993
1/1994
1/1995
1/1996
1/1997
1/1998
1/1999
1/2000
1/2001
1/2002
1/2003
1/2004
1/2005
1/2006
1/2007
1/2008
1/2009
1/2010
1/2011
1/2012
1/2013
1/2014
1/2015
1/2016
1/2017
MedianResale RentalParity HistoricValue Projecgon
$0
$500
$1,000
$1,500
$2,000
$2,500
Date
12/1988
12/1989
12/1990
12/1991
12/1992
12/1993
12/1994
12/1995
12/1996
12/1997
12/1998
12/1999
12/2000
12/2001
12/2002
12/2003
12/2004
12/2005
12/2006
12/2007
12/2008
12/2009
12/2010
12/2011
12/2012
12/2013
12/2014
12/2015
12/2016
MedianRent CosttoOwn HistoricCosttoOwnRelagvetoRent

42of58
January2016ShevyAkason877-409-8515
Resale$/SFYear-over-YearPercentageChange:SanBernardinoCountysinceJanuary1989
Rental$/SFYear-over-YearPercentageChange:SanBernardinoCountysinceJanuary1989
-8%
-6%
-4%
-2%
0%
2%
4%
6%
8%
10%
12%
14%
16%
18%
1/1989
1/1990
1/1991
1/1992
1/1993
1/1994
1/1995
1/1996
1/1997
1/1998
1/1999
1/2000
1/2001
1/2002
1/2003
1/2004
1/2005
1/2006
1/2007
1/2008
1/2009
1/2010
1/2011
1/2012
1/2013
1/2014
1/2015
Normalandsustainable
Rentalratesinexcessof7%arenotsustainable.Longperiodsofexcessiveappreciagonleadtoacrash.
Falling/Correcgng
Weak
-50%-45%-40%-35%-30%-25%-20%-15%-10%-5%0%5%
10%15%20%25%30%35%40%45%50%
1/1989
1/1990
1/1991
1/1992
1/1993
1/1994
1/1995
1/1996
1/1997
1/1998
1/1999
1/2000
1/2001
1/2002
1/2003
1/2004
1/2005
1/2006
1/2007
1/2008
1/2009
1/2010
1/2011
1/2012
1/2013
1/2014
1/2015
Normalandsustainable
Appreciagonratesinexcessof7%arenotsustainable.Longperiodsofexcessiveappreciagonleadtoacrash.
Falling/Correcgng
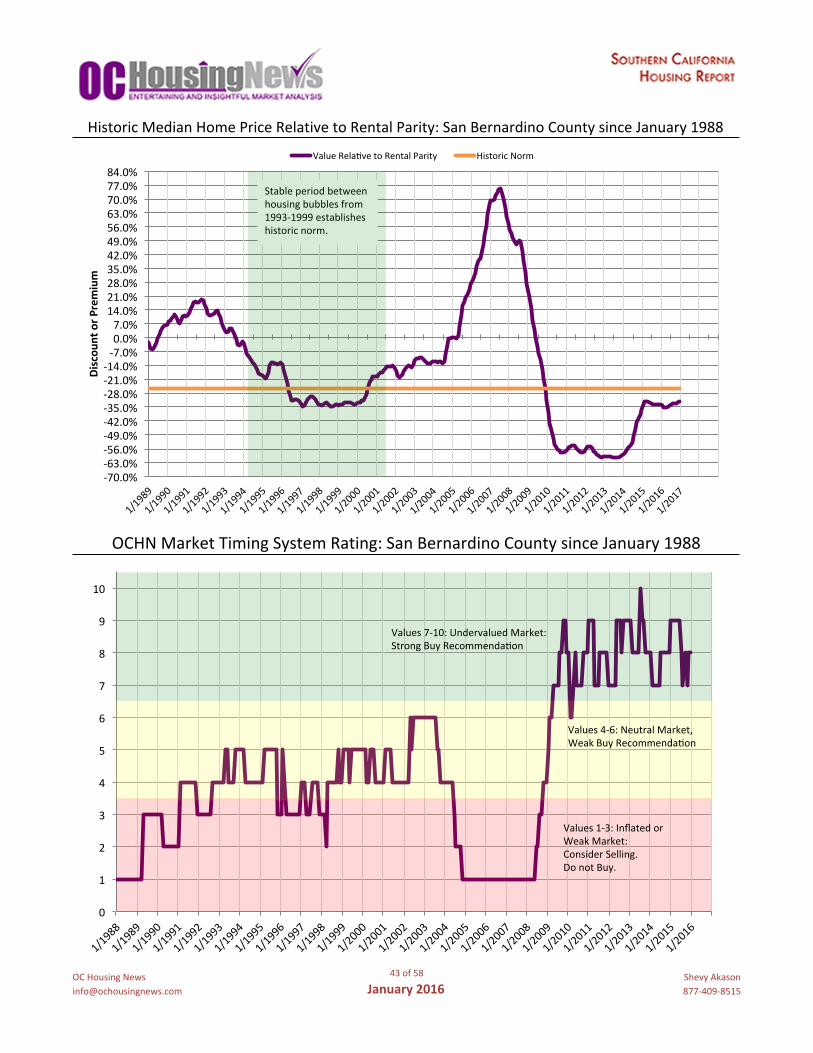
43of58
January2016ShevyAkason877-409-8515
HistoricMedianHomePriceRelativetoRentalParity:SanBernardinoCountysinceJanuary1988
OCHNMarketTimingSystemRating:SanBernardinoCountysinceJanuary1988
-70.0%-63.0%-56.0%-49.0%-42.0%-35.0%-28.0%-21.0%-14.0%-7.0%0.0%7.0%14.0%21.0%28.0%35.0%42.0%49.0%56.0%63.0%70.0%77.0%84.0%
1/1989
1/1990
1/1991
1/1992
1/1993
1/1994
1/1995
1/1996
1/1997
1/1998
1/1999
1/2000
1/2001
1/2002
1/2003
1/2004
1/2005
1/2006
1/2007
1/2008
1/2009
1/2010
1/2011
1/2012
1/2013
1/2014
1/2015
1/2016
1/2017
Discou
ntorP
remium
ValueRelagvetoRentalParity HistoricNorm
Stableperiodbetweenhousingbubblesfrom1993-1999establisheshistoricnorm.
0
1
2
3
4
5
6
7
8
9
10
1/1988
1/1989
1/1990
1/1991
1/1992
1/1993
1/1994
1/1995
1/1996
1/1997
1/1998
1/1999
1/2000
1/2001
1/2002
1/2003
1/2004
1/2005
1/2006
1/2007
1/2008
1/2009
1/2010
1/2011
1/2012
1/2013
1/2014
1/2015
1/2016
Values7-10:UndervaluedMarket:StrongBuyRecommendagon
Values4-6:NeutralMarket,WeakBuyRecommendagon
Values1-3:InflatedorWeakMarket:ConsiderSelling.DonotBuy.
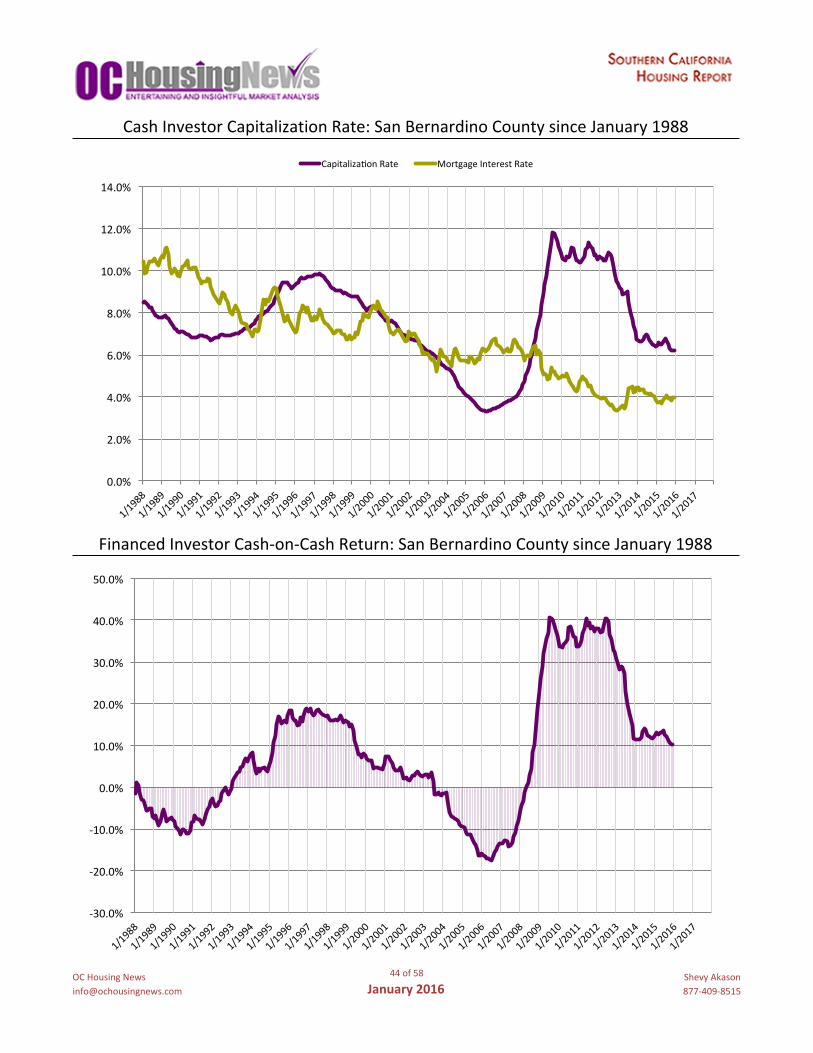
44of58
January2016ShevyAkason877-409-8515
CashInvestorCapitalizationRate:SanBernardinoCountysinceJanuary1988
FinancedInvestorCash-on-CashReturn:SanBernardinoCountysinceJanuary1988
0.0%
2.0%
4.0%
6.0%
8.0%
10.0%
12.0%
14.0%
1/1988
1/1989
1/1990
1/1991
1/1992
1/1993
1/1994
1/1995
1/1996
1/1997
1/1998
1/1999
1/2000
1/2001
1/2002
1/2003
1/2004
1/2005
1/2006
1/2007
1/2008
1/2009
1/2010
1/2011
1/2012
1/2013
1/2014
1/2015
1/2016
1/2017
CapitalizagonRate MortgageInterestRate
-30.0%
-20.0%
-10.0%
0.0%
10.0%
20.0%
30.0%
40.0%
50.0%
1/1988
1/1989
1/1990
1/1991
1/1992
1/1993
1/1994
1/1995
1/1996
1/1997
1/1998
1/1999
1/2000
1/2001
1/2002
1/2003
1/2004
1/2005
1/2006
1/2007
1/2008
1/2009
1/2010
1/2011
1/2012
1/2013
1/2014
1/2015
1/2016
1/2017

45of58
January2016ShevyAkason877-409-8515
Median Resale% Rent% Median Costof Ownership
City Resale$ ChangeYoY Resale$/SF ChangeYoY Rent$ Ownership Prem./Disc. CapRate
Adelanto 155,800$ 6.7% 98$ 11.7% 1,056$ 695$ (361)$ 6.5%
AppleValley 193,200$ 1.7% 110$ 3.5% 968$ 860$ (107)$ 4.8%
Chino 417,100$ 5.6% 238$ 5.3% 2,106$ 1,832$ (274)$ 4.8%
ChinoHills 533,000$ 6.0% 308$ -0.2% 2,289$ 2,397$ 108$ 4.1%
Colton 222,600$ 8.6% 173$ 3.2% 1,242$ 981$ (261)$ 5.4%
Fontana 331,600$ 6.9% 195$ 0.6% 2,041$ 1,477$ (564)$ 5.9%
Hesperia 214,300$ 4.6% 116$ 3.4% 1,240$ 953$ (287)$ 5.6%
Highland 274,900$ 12.7% 167$ -0.4% 1,670$ 1,196$ (475)$ 5.8%
JoshuaTree 121,300$ 6.9% 95$ -5.9% 824$ 531$ (294)$ 6.5%
LomaLinda 332,500$ 0.0% 153$ -0.1% 1,620$ 1,479$ (141)$ 4.7%
Montclair 345,800$ 8.1% 244$ 0.1% 1,656$ 1,535$ (121)$ 4.6%
Ontario 341,500$ 10.0% 245$ 0.6% 1,803$ 1,509$ (293)$ 5.1%
RanchoCucamonga 420,700$ 5.0% 248$ 0.8% 2,108$ 1,864$ (245)$ 4.8%
Redlands 330,800$ 8.3% 210$ 4.9% 1,711$ 1,482$ (229)$ 5.0%
Rialto 280,800$ 8.2% 180$ 5.7% 1,536$ 1,245$ (291)$ 5.3%
SanBernardino(City) 214,100$ 10.2% 159$ 2.1% 1,366$ 943$ (423)$ 6.1%
TwentyninePalms 71,200$ -7.4% 68$ -13.3% 828$ 319$ (509)$ 11.2%
Upland 466,600$ 4.6% 262$ 10.2% 2,040$ 2,119$ 78$ 4.2%
Victorville 195,100$ 7.1% 106$ 3.7% 1,274$ 873$ (402)$ 6.3%
Yucaipa 310,000$ 7.2% 177$ 8.8% 1,337$ 1,371$ 34$ 4.1%
MarketPerformanceandTrends:SanBernardinoCounty,MajorCities,andZips

46of58
January2016ShevyAkason877-409-8515
Median Resale% Rent% Median Costof Ownership
City Resale$ ChangeYoY Resale$/SF ChangeYoY Rent$ Ownership Prem./Disc. CapRate
Chino91710 420,400$ 6.0% 246$ 6.7% 2,047$ 1,843$ (205)$ 4.7%
Fontana92336 388,300$ 5.4% 190$ 0.8% 2,172$ 1,723$ (449)$ 5.4%
Fontana92337 316,800$ 2.9% 195$ -2.0% 1,740$ 1,416$ (324)$ 5.3%
GrandTerrace92313 286,200$ 11.7% 187$ 6.4% 1,520$ 1,284$ (235)$ 5.1%
Hesperia92344 225,900$ 1.7% 106$ 4.1% 1,290$ 1,014$ (276)$ 5.5%
Mentone92359 321,200$ 6.6% 156$ 1.0% 1,195$ 1,409$ 214$ 3.6%
Ontario91762 340,600$ 10.3% 244$ -3.8% 1,471$ 1,501$ 30$ 4.1%
RanchoCucamonga91701 437,800$ 5.0% 252$ 1.3% 2,036$ 1,957$ (79)$ 4.5%
RanchoCucamonga91730 353,800$ 7.2% 247$ 2.5% 1,890$ 1,585$ (306)$ 5.1%
RanchoCucamonga91737 467,500$ -0.6% 252$ 3.1% 2,116$ 2,094$ (21)$ 4.3%
RanchoCucamonga91739 570,100$ 4.2% 246$ -2.6% 2,626$ 2,510$ (116)$ 4.4%
Redlands92373 384,600$ 12.5% 235$ 2.1% 1,929$ 1,743$ (187)$ 4.8%
Rialto92376 263,300$ 7.7% 177$ 3.7% 1,478$ 1,174$ (304)$ 5.4%
Rialto92377 336,100$ 10.2% 190$ 14.2% 1,822$ 1,479$ (343)$ 5.2%
SanBernardino(City)92405 200,100$ 13.6% 159$ 10.9% 1,221$ 890$ (331)$ 5.9%
SanBernardino(City)92410 161,900$ 5.0% 149$ 6.4% 1,010$ 707$ (302)$ 6.0%
Upland91784 579,900$ 4.7% 258$ 7.4% 2,344$ 2,602$ 257$ 3.9%
Upland91786 390,500$ 5.6% 267$ 10.4% 1,824$ 1,766$ (58)$ 4.5%
Victorville92392 199,200$ 9.0% 105$ 4.5% 1,246$ 893$ (354)$ 6.0%
Victorville92394 187,300$ 2.0% 101$ 1.6% 1,268$ 840$ (428)$ 6.5%
Victorville92395 191,000$ 9.4% 113$ 4.0% 1,205$ 846$ (359)$ 6.1%
MarketPerformanceandTrends:SanBernardinoCounty,MajorCities,andZips

47of58
January2016ShevyAkason877-409-8515
%Over/Under Historic %Over/UnderCity Rating Median RentalParity RentalParity Premium HistoricPrem.
Adelanto 10 155,800$ 235,600$ -33.6% -3.8% -29.8%AppleValley 8 193,200$ 215,900$ -11.0% 9.7% -20.7%Chino 8 417,100$ 469,700$ -13.3% -9.0% -4.3%ChinoHills 5 533,000$ 510,600$ 4.5% 6.6% -2.1%Colton 8 222,600$ 277,000$ -21.2% -10.7% -10.5%Fontana 6 331,600$ 455,300$ -28.0% -33.7% 5.7%Hesperia 8 214,300$ 276,700$ -24.0% -21.2% -2.8%Highland 6 274,900$ 372,600$ -28.6% -11.9% -16.7%JoshuaTree 5 121,300$ 183,900$ -35.4% -20.0% -15.4%LomaLinda 8 332,500$ 361,400$ -8.7% 34.8% -43.5%Montclair 5 345,800$ 369,500$ -5.6% -6.0% 0.4%Ontario 6 341,500$ 402,100$ -15.5% -3.9% -11.6%RanchoCucamonga 6 420,700$ 470,300$ -12.1% -7.6% -4.4%Redlands 8 330,800$ 381,700$ -12.0% -0.2% -11.8%Rialto 7 280,800$ 342,700$ -19.8% -22.8% 3.0%SanBernardino(City) 7 214,100$ 304,700$ -28.8% -28.5% -0.3%TwentyninePalms 4 71,200$ 184,700$ -60.6% -28.7% -31.9%Upland 7 466,600$ 455,200$ 2.7% 6.9% -4.1%Victorville 10 195,100$ 284,200$ -30.8% -6.4% -24.4%Yucaipa 5 310,000$ 298,200$ 0.2% -9.2% 9.4%
MarketTimingRatingandValuations:SanBernardinoCounty,MajorCities,andZips

48of58
January2016ShevyAkason877-409-8515
%Over/Under Historic %Over/Under
City Rating Median RentalParity RentalParity Premium HistoricPrem.
Chino91710 8 420,400$ 456,700$ -10.9% -7.4% -3.4%Fontana92336 5 388,300$ 484,600$ -20.6% -33.2% 12.6%Fontana92337 5 316,800$ 388,200$ -18.8% -20.6% 1.8%GrandTerrace92313 8 286,200$ 339,000$ -17.0% -7.2% -9.8%Hesperia92344 7 225,900$ 287,700$ -21.5% -13.1% -8.4%Mentone92359 7 321,200$ 266,600$ 15.6% 28.1% -12.4%Ontario91762 3 340,600$ 328,200$ 2.0% 8.6% -6.7%RanchoCucamonga91701 6 437,800$ 454,200$ -2.7% 3.1% -5.8%RanchoCucamonga91730 7 353,800$ 421,700$ -17.3% -14.6% -2.7%RanchoCucamonga91737 9 467,500$ 472,000$ -0.7% 23.9% -24.6%RanchoCucamonga91739 3 570,100$ 585,800$ -4.4% -17.3% 12.9%Redlands92373 10 384,600$ 430,400$ -5.2% 20.5% -25.7%Rialto92376 7 263,300$ 329,800$ -21.9% -22.1% 0.3%Rialto92377 7 336,100$ 406,400$ -19.0% -8.2% -10.8%SanBernardino(City)92405 6 200,100$ 272,300$ -26.2% -18.6% -7.7%SanBernardino(City)92410 10 161,900$ 225,200$ -28.5% -1.5% -27.0%Upland91784 7 579,900$ 523,000$ 8.7% 10.9% -2.2%Upland91786 8 390,500$ 406,900$ -3.4% 8.5% -11.9%Victorville92392 10 199,200$ 278,000$ -28.8% 3.8% -32.6%Victorville92394 8 187,300$ 282,900$ -32.9% -14.4% -18.5%Victorville92395 9 191,000$ 268,700$ -30.0% -9.8% -20.2%
MarketTimingRatingandValuations:SanBernardinoCounty,MajorCities,andZips

49of58
January2016ShevyAkason877-409-8515
Historically,propertiesinthismarketsellata15.8%premium.Today'sdiscountis12.2%.Thismarketis28.0%undervalued.Medianhomepriceis$518,300witharentalparityvalueof$583,000.Thismarket'sdiscountis$64,700.Monthlypaymentaffordabilityhasbeenimprovingoverthelast9month(s).Momentumsuggestsimprovingaffordability.Resalepricesona$/SFbasisincreasedfrom$320/SFto$322/SF.Resalepriceshavebeenrisingfor1month(s).Overthelast12months,resalepricesrose8.9%indicatingalongertermupwardpricetrend.Medianrentalratesdeclined$32lastmonthfrom$2,645to$2,613.Thecurrentcapitalizationrate(rent/price)is4.8%.Rentshavebeenrisingfor12month(s).Pricemomentumsignalsrisingrentsoverthenextthreemonths.Marketrating=10
MedianHomePriceandRentalParitytrailingtwelvemonthsDate Rating Median RentalParity HistoricValue1/2015 10 501,900$ 558,500$ 646,955$2/2015 10 506,100$ 557,900$ 646,260$3/2015 10 507,900$ 557,600$ 645,913$4/2015 10 513,800$ 572,200$ 662,825$5/2015 10 515,900$ 577,200$ 668,617$6/2015 10 522,600$ 588,800$ 682,054$7/2015 10 523,400$ 583,900$ 676,378$8/2015 10 523,400$ 597,600$ 692,248$9/2015 10 523,100$ 591,500$ 685,182$10/2015 10 521,900$ 601,800$ 697,113$11/2015 10 519,400$ 591,600$ 685,297$12/2015 10 518,300$ 583,000$ 675,335$
Resale$/SFandyear-over-yearpercentagechangetrailingtwelvemonthsDate ±Typ.Value $/SF %Change1/2015 -26.0% 296$ 2.3%2/2015 -25.8% 297$ 2.3%3/2015 -25.3% 302$ 3.8%4/2015 -25.3% 307$ 4.9%5/2015 -25.8% 312$ 6.0%6/2015 -26.5% 317$ 6.9%7/2015 -26.6% 319$ 6.5%8/2015 -27.2% 320$ 6.7%9/2015 -27.3% 321$ 7.0%10/2015 -28.3% 321$ 7.1%11/2015 -28.2% 320$ 7.3%12/2015 -28.0% 322$ 8.9% 1/0/00
Rentalrateandyear-over-yearpercentagechangetrailingtwelvemonthsDate %Change Rent Own HistoricCosttoOwnRelativetoRent1/2015 8.2% 2,428$ 2,215$ 2,813$2/2015 6.9% 2,426$ 2,199$ 2,810$3/2015 7.0% 2,443$ 2,202$ 2,829$4/2015 6.8% 2,476$ 2,216$ 2,868$5/2015 6.8% 2,550$ 2,242$ 2,954$6/2015 7.1% 2,646$ 2,283$ 3,065$7/2015 7.3% 2,646$ 2,333$ 3,065$8/2015 6.8% 2,663$ 2,350$ 3,084$9/2015 4.9% 2,629$ 2,343$ 3,045$10/2015 4.7% 2,646$ 2,317$ 3,064$11/2015 4.0% 2,646$ 2,314$ 3,064$12/2015 3.8% 2,613$ 2,313$ 3,027$
VenturaCountyHousingMarketNews
$-
$200,000
$400,000
$600,000
$800,000
1/2015
2/2015
3/2015
4/2015
5/2015
6/2015
7/2015
8/2015
9/2015
10/2015
11/2015
12/2015
Median RentalParity HistoricValue
$296$297
$302
$307
$312
$317$319$320$321$321$320$322
$290
$295
$300
$305
$310
$315
$320
$325
1/2015
2/2015
3/2015
4/2015
5/2015
6/2015
7/2015
8/2015
9/2015
10/2015
11/2015
12/2015
$2,428
$2,426
$2,443
$2,476
$2,550
$2,646
$2,646
$2,663
$2,629
$2,646
$2,646
$2,613
$1,400
$1,900
$2,400
$2,900
$3,400
1/2015
2/2015
3/2015
4/2015
5/2015
6/2015
7/2015
8/2015
9/2015
10/2015
11/2015
12/2015
Rent Own HistoricCosttoOwnRelagvetoRent

50of58
January2016ShevyAkason877-409-8515
VenturaCountymedianhomepricesinceJanuary1988
VenturaCountymedianrentandmonthlycostofownershipsinceJanuary1988
$0
$100,000
$200,000
$300,000
$400,000
$500,000
$600,000
$700,000
$800,000
1/1988
1/1989
1/1990
1/1991
1/1992
1/1993
1/1994
1/1995
1/1996
1/1997
1/1998
1/1999
1/2000
1/2001
1/2002
1/2003
1/2004
1/2005
1/2006
1/2007
1/2008
1/2009
1/2010
1/2011
1/2012
1/2013
1/2014
1/2015
1/2016
1/2017
MedianResale RentalParity HistoricValue Projecgon
$0
$500
$1,000
$1,500
$2,000
$2,500
$3,000
$3,500
$4,000
1/1988
1/1989
1/1990
1/1991
1/1992
1/1993
1/1994
1/1995
1/1996
1/1997
1/1998
1/1999
1/2000
1/2001
1/2002
1/2003
1/2004
1/2005
1/2006
1/2007
1/2008
1/2009
1/2010
1/2011
1/2012
1/2013
1/2014
1/2015
1/2016
1/2017
MedianRent CosttoOwn HistoricCosttoOwnRelagvetoRent

51of58
January2016ShevyAkason877-409-8515
Resale$/SFYear-over-YearPercentageChange:VenturaCountysinceJanuary1989
Rental$/SFYear-over-YearPercentageChange:VenturaCountysinceJanuary1989
-8%
-6%
-4%
-2%
0%
2%
4%
6%
8%
10%
12%
14%
16%
18%
1/1989
1/1990
1/1991
1/1992
1/1993
1/1994
1/1995
1/1996
1/1997
1/1998
1/1999
1/2000
1/2001
1/2002
1/2003
1/2004
1/2005
1/2006
1/2007
1/2008
1/2009
1/2010
1/2011
1/2012
1/2013
1/2014
1/2015
Normalandsustainable
Rentalratesinexcessof7%arenotsustainable.Longperiodsofexcessiveappreciagonleadtoacrash.
Falling/Correcgng
Weak
-50%-45%-40%-35%-30%-25%-20%-15%-10%-5%0%5%
10%15%20%25%30%35%40%45%50%
1/1989
1/1990
1/1991
1/1992
1/1993
1/1994
1/1995
1/1996
1/1997
1/1998
1/1999
1/2000
1/2001
1/2002
1/2003
1/2004
1/2005
1/2006
1/2007
1/2008
1/2009
1/2010
1/2011
1/2012
1/2013
1/2014
1/2015
Normalandsustainable
Appreciagonratesinexcessof7%arenotsustainable.Longperiodsofexcessiveappreciagonleadtoacrash.
Falling/Correcgng

52of58
January2016ShevyAkason877-409-8515
HistoricMedianHomePriceRelativetoRentalParity:VenturaCountysinceJanuary1988
OCHNMarketTimingSystemRating:VenturaCountysinceJanuary1988
-42.0%-35.0%-28.0%-21.0%-14.0%-7.0%0.0%7.0%14.0%21.0%28.0%35.0%42.0%49.0%56.0%63.0%70.0%77.0%84.0%91.0%98.0%
105.0%112.0%119.0%126.0%
1/1988
1/1989
1/1990
1/1991
1/1992
1/1993
1/1994
1/1995
1/1996
1/1997
1/1998
1/1999
1/2000
1/2001
1/2002
1/2003
1/2004
1/2005
1/2006
1/2007
1/2008
1/2009
1/2010
1/2011
1/2012
1/2013
1/2014
1/2015
1/2016
1/2017
Discou
ntorP
remium
ValueRelagvetoRentalParity HistoricNorm
Stableperiodbetweenhousingbubblesfrom1993-1999establisheshistoricnorm.
0
1
2
3
4
5
6
7
8
9
10
1/1988
1/1989
1/1990
1/1991
1/1992
1/1993
1/1994
1/1995
1/1996
1/1997
1/1998
1/1999
1/2000
1/2001
1/2002
1/2003
1/2004
1/2005
1/2006
1/2007
1/2008
1/2009
1/2010
1/2011
1/2012
1/2013
1/2014
1/2015
1/2016
1/2017
Values7-10:UndervaluedMarket:StrongBuyRecommendagon
Values4-6:NeutralMarket,WeakBuyRecommendagon
Values1-3:InflatedorWeakMarket:ConsiderSelling.DonotBuy.

53of58
January2016ShevyAkason877-409-8515
CashInvestorCapitalizationRate:VenturaCountysinceJanuary1988
FinancedInvestorCash-on-CashReturn:VenturaCountysinceJanuary1988
0.0%
2.0%
4.0%
6.0%
8.0%
10.0%
12.0%
1/1988
1/1989
1/1990
1/1991
1/1992
1/1993
1/1994
1/1995
1/1996
1/1997
1/1998
1/1999
1/2000
1/2001
1/2002
1/2003
1/2004
1/2005
1/2006
1/2007
1/2008
1/2009
1/2010
1/2011
1/2012
1/2013
1/2014
1/2015
1/2016
1/2017
CapitalizagonRate MortgageInterestRate
-35.0%
-30.0%
-25.0%
-20.0%
-15.0%
-10.0%
-5.0%
0.0%
5.0%
10.0%
15.0%
1/1988
1/1989
1/1990
1/1991
1/1992
1/1993
1/1994
1/1995
1/1996
1/1997
1/1998
1/1999
1/2000
1/2001
1/2002
1/2003
1/2004
1/2005
1/2006
1/2007
1/2008
1/2009
1/2010
1/2011
1/2012
1/2013
1/2014
1/2015
1/2016
1/2017

54of58
January2016ShevyAkason877-409-8515
Median Resale% Rent% Median Costof Ownership
City Resale$ ChangeYoY Resale$/SF ChangeYoY Rent$ Ownership Prem./Disc. CapRate
Camarillo 530,000$ 8.5% 311$ 2.6% 2,517$ 2,363$ (154)$ 4.6%
Moorpark 607,800$ 8.7% 284$ 1.6% 2,495$ 2,688$ 193$ 3.9%
NewburyPark 635,300$ 4.5% 321$ 2.7% 2,784$ 2,837$ 52$ 4.2%
OakPark 616,100$ 4.0% 366$ 7.1% 2,529$ 2,778$ 249$ 3.9%
Oxnard 421,700$ 13.0% 299$ 18.0% 2,139$ 1,891$ (248)$ 4.9%
PortHueneme 339,300$ -3.4% 262$ 6.1% 1,531$ 1,492$ (39)$ 4.3%
SimiValley 496,900$ 10.0% 296$ 1.0% 2,358$ 2,218$ (140)$ 4.6%
ThousandOaks 621,000$ 1.8% 343$ 7.2% 2,675$ 2,772$ 97$ 4.1%
Ventura 500,300$ 11.5% 356$ 0.3% 2,003$ 2,203$ 200$ 3.8%
WestlakeVillage 780,200$ 13.8% 395$ 9.1% 2,678$ 3,524$ 847$ 3.3%
Camarillo93010 524,500$ 5.4% 310$ 7.7% 2,340$ 2,360$ 20$ 4.3%
NewburyPark91320 634,200$ 4.6% 322$ 3.1% 2,784$ 2,832$ 48$ 4.2%
Oxnard93033 367,300$ 15.7% 398$ -8.3% 1,916$ 1,599$ (318)$ 5.0%
Oxnard93035 537,800$ 12.5% 221$ 16.7% 2,237$ 2,415$ 178$ 4.0%
PortHueneme93041 329,500$ -3.5% 262$ 6.0% 1,531$ 1,456$ (75)$ 4.5%
SimiValley93063 491,700$ 10.0% 293$ 0.9% 2,621$ 2,197$ (423)$ 5.1%
SimiValley93065 500,300$ 9.2% 298$ 7.3% 2,290$ 2,241$ (49)$ 4.4%
ThousandOaks91360 592,100$ -1.8% 333$ 6.4% 2,530$ 2,640$ 110$ 4.1%
ThousandOaks91362 670,300$ 9.0% 349$ 6.1% 2,895$ 3,008$ 113$ 4.1%
Ventura93004 501,800$ 20.8% 297$ 7.3% 2,391$ 2,223$ (168)$ 4.6%
WestlakeVillage91361 781,700$ 9.9% 412$ 12.7% 2,913$ 3,469$ 556$ 3.6%
MarketPerformanceandTrends:VenturaCounty,MajorCities,andZips

55of58
January2016ShevyAkason877-409-8515
%Over/Under Historic %Over/UnderCity Rating Median RentalParity RentalParity Premium HistoricPrem.
Camarillo 10 530,000$ 561,500$ -6.2% 26.7% -32.9%Moorpark 6 607,800$ 556,500$ 4.8% 17.6% -12.9%NewburyPark 9 635,300$ 621,100$ -0.4% 14.3% -14.8%OakPark 10 616,100$ 564,300$ 6.6% 37.8% -31.2%Oxnard 9 421,700$ 477,100$ -12.8% 12.2% -24.9%PortHueneme 9 339,300$ 341,500$ -1.3% 28.7% -29.9%SimiValley 6 496,900$ 526,100$ -9.1% 3.1% -12.1%ThousandOaks 8 621,000$ 596,800$ 1.3% 26.5% -25.2%Ventura 7 500,300$ 446,800$ 12.4% 33.5% -21.1%WestlakeVillage 8 780,200$ 597,400$ 36.3% 58.7% -22.5%
Camarillo93010 10 524,500$ 522,100$ 1.4% 29.5% -28.1%NewburyPark91320 9 634,200$ 621,100$ -0.6% 14.3% -14.9%Oxnard93033 8 367,300$ 427,500$ -16.4% 27.3% -43.7%Oxnard93035 9 537,800$ 499,000$ 5.1% 34.5% -29.4%PortHueneme93041 10 329,500$ 341,500$ -3.7% 28.6% -32.3%SimiValley93063 7 491,700$ 584,600$ -16.2% 7.4% -23.6%SimiValley93065 6 500,300$ 510,900$ -2.6% 1.9% -4.4%ThousandOaks91360 8 592,100$ 564,400$ 1.3% 19.8% -18.6%ThousandOaks91362 10 670,300$ 645,800$ 1.1% 45.4% -44.3%Ventura93004 10 501,800$ 533,400$ -7.1% 32.2% -39.3%WestlakeVillage91361 10 781,700$ 649,800$ 15.0% 66.5% -51.5%
MarketTimingRatingandValuations:VenturaCounty,MajorCities,andZips

56of58
January2016ShevyAkason877-409-8515
OCHousingNewsMonthlyMarketReportOCHousingNewsmonthlymarketreportandnewslelerprovidesaclearpictureofthehealthofthehousingmarket.Bothbuyersandsellersfindtheinformagononlocagon,valuagon,andpricetrends,gmelyandrelevanttotheirdecisiontobuyorsellahome.TheOCHousingNewsreportanswersthemostimportantquesgonstobuyersandsellers:(1)WhereshouldIlookforbargains,(2)Arecurrentpricesoverorundervaluedinmyarea,and(3)whatdirecgonarepricesheaded,upordowninmyarea?Armedwithbelerinformagon,peoplemakebelerdecisions.ThereistoomuchinformagonabouthousingfloagngaroundtheInternet,andmostofitisbad.Itiseasytotakedataandcreateprelychartsandgraphsthatdon'tprovideanyusefulinformagonsomeonemightusetomakeagooddecision.TheOCHousingNewshaseliminatedtheuselessinformagonanddisglledthemarketdowntothreekeypiecesofinformagon:(1)resalevaluerelagvetorent,(2)yearlychangeinresaleprices,and(3)yearlychangesinrents.UsingtheOCHNMonthlyReportWhenmostpeopleareconsideringrengngorbuyingahome,theyalreadyhavenarrowedtheirchoicesforlocagon.Mostwanttobenearwork,buttheymayalsowanttobenearfamily,friends,orapargcularschooldistrict.ThetableofcontentsonthefrontpageoftheOCHNmonthlyreportorganizesthereportsbycountysopeoplecannarrowtheirsearchtotheareatheyaremostinterestedin.Isuggestsearchersstartwiththeoverviewofthecountyasthisprovidesimportantdataonthebroaderrealestatemarket.InterpreJnganOCHNMonthlyMarketReportThefirstpageofacountyreportbreaksdownintofourparts:Thenewsoverview,MedianHomePriceandRentalParitytrailingtwelvemonths,Resale$/SFandyear-over-yearpercentagechangetrailingtwelvemonths,Rentalrateandyear-over-yearpercentagechangetrailingtwelvemonths.NEWSOVERVIEWThenewsoverviewprovidesconcisedescripgonsofthefactsandcondigonsinthemarket.Itstateswhetherthemarkettradesatapremiumoradiscounttorentalparityandprovidesameasureofit.Amarkettradingatapremiumtorentalparityismoredesirable,sobuyersarewillingtopaymorethanrentalparitytolivethere.Amarkettradingatadiscountislessdesirable,andpeoplemustbemogvatedtolivetherebysavingversusrengng.Thenewsoverviewmeasuresthecurrentpremiumordiscount,comparesittothehistoricpremiumordiscount,andstateswhetherthemarketiscurrentlyovervaluedorundervalued.Thisisanimportantmeasureoffuturefinancialperformance.MEDIANHOMEPRICEANDRENTALPARITYTRAILINGTWELVEMONTHSForthosewhowantthebolomlinewithoutalltheanalysisanddetail,themarketragngisthefirstrowofthefirstsecgonofdata.Theragngencapsulatesallthecondigonsofthemarketintoonefigure.Sufficetosaythataragngof10isgoodandaragngof1isbad.Buyerscanrestassuredthatahighlyratedpropertyormarketisagoodfinancialbuy.Thechartdisplaysthreelinesthatrevealmuchaboutthemarket.Thefirsttwolinestonotearetheparallelgreenandorangelines,rentalparity(green)andhistoricvalue(orange).Asmengonedpreviously,somemarketstradeatadiscountandsomeatapremiumtorentalparity.Iftheorangeline(historicvalue)isabovethegreenline(rentalparity),themarketisapremiummarket.Iftheorangeline(historicvalue)isbelowthegreenline(rentalparity),themarketisadiscountmarket.Thelargerthegap,thegreaterthepremiumordiscountis.Thethirdlineploledagainstthesetwoparallellinesisthemedianresalepriceforthearea.Thislinerevealswhetherthemarketiscurrentlytradingatapremiumordiscounttorentalparityandhistoricvalue.Themoreimportantoftheserelagonshipsisbetweenmedianresalepriceandhistoricvalue.Overgme,themarkethasshownatendencytowardtradingathistoricvalue.Ifittradesaboveforawhile,overgmeitwillrevertbacktothisvalue.Thatmayhappeneitherbyanextendedperiodoflilleornoappreciagonoranoutrightdeclineinprices.Ifthemarkettradesbelowitshistoricvalue,it’slikelytoseeareboundbacktothisvalueinthefuture.Thebestmarketsarethosetradingatasteepdiscounttoitshistoricvalue.
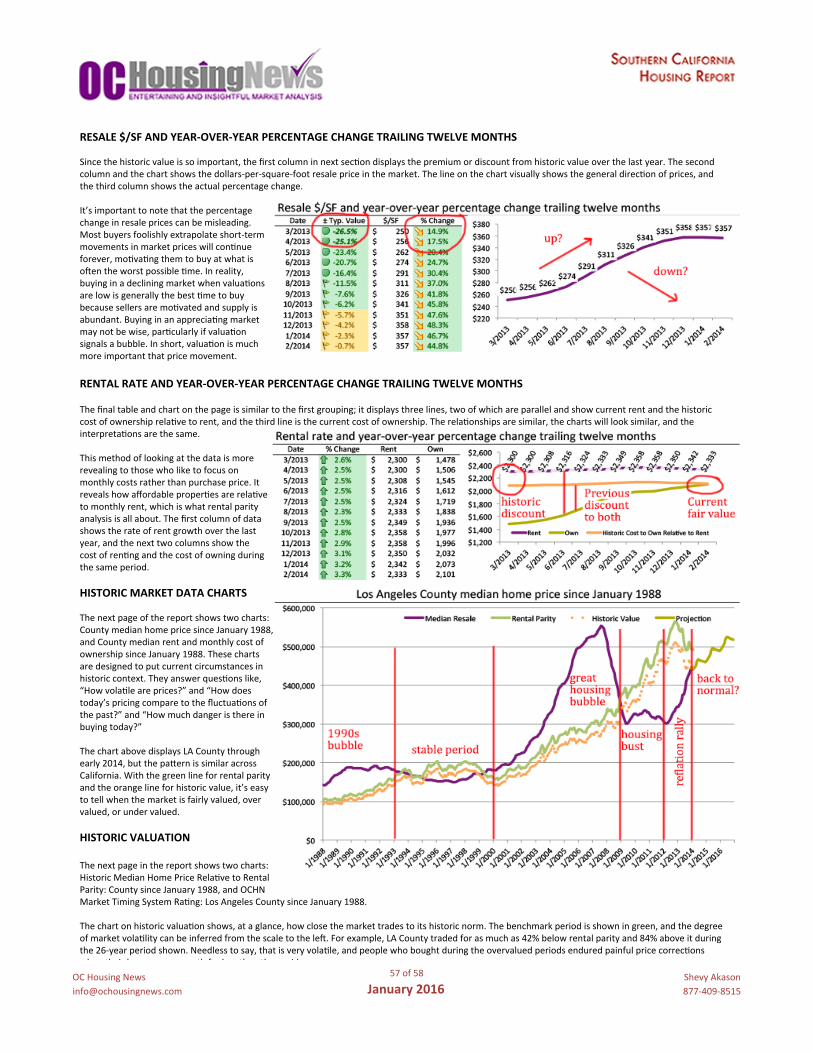
57of58
January2016ShevyAkason877-409-8515
RESALE$/SFANDYEAR-OVER-YEARPERCENTAGECHANGETRAILINGTWELVEMONTHSSincethehistoricvalueissoimportant,thefirstcolumninnextsecgondisplaysthepremiumordiscountfromhistoricvalueoverthelastyear.Thesecondcolumnandthechartshowsthedollars-per-square-footresalepriceinthemarket.Thelineonthechartvisuallyshowsthegeneraldirecgonofprices,andthethirdcolumnshowstheactualpercentagechange.It’simportanttonotethatthepercentagechangeinresalepricescanbemisleading.Mostbuyersfoolishlyextrapolateshort-termmovementsinmarketpriceswillcongnueforever,mogvagngthemtobuyatwhatisorentheworstpossiblegme.Inreality,buyinginadecliningmarketwhenvaluagonsarelowisgenerallythebestgmetobuybecausesellersaremogvatedandsupplyisabundant.Buyinginanappreciagngmarketmaynotbewise,pargcularlyifvaluagonsignalsabubble.Inshort,valuagonismuchmoreimportantthatpricemovement. RENTALRATEANDYEAR-OVER-YEARPERCENTAGECHANGETRAILINGTWELVEMONTHSThefinaltableandchartonthepageissimilartothefirstgrouping;itdisplaysthreelines,twoofwhichareparallelandshowcurrentrentandthehistoriccostofownershiprelagvetorent,andthethirdlineisthecurrentcostofownership.Therelagonshipsaresimilar,thechartswilllooksimilar,andtheinterpretagonsarethesame.Thismethodoflookingatthedataismorerevealingtothosewholiketofocusonmonthlycostsratherthanpurchaseprice.Itrevealshowaffordablepropergesarerelagvetomonthlyrent,whichiswhatrentalparityanalysisisallabout.Thefirstcolumnofdatashowstherateofrentgrowthoverthelastyear,andthenexttwocolumnsshowthecostofrengngandthecostofowningduringthesameperiod. HISTORICMARKETDATACHARTSThenextpageofthereportshowstwocharts:CountymedianhomepricesinceJanuary1988,andCountymedianrentandmonthlycostofownershipsinceJanuary1988.Thesechartsaredesignedtoputcurrentcircumstancesinhistoriccontext.Theyanswerquesgonslike,“Howvolagleareprices?”and“Howdoestoday’spricingcomparetothefluctuagonsofthepast?”and“Howmuchdangeristhereinbuyingtoday?”ThechartabovedisplaysLACountythroughearly2014,butthepalernissimilaracrossCalifornia.Withthegreenlineforrentalparityandtheorangelineforhistoricvalue,it’seasytotellwhenthemarketisfairlyvalued,overvalued,orundervalued.HISTORICVALUATIONThenextpageinthereportshowstwocharts:HistoricMedianHomePriceRelagvetoRentalParity:CountysinceJanuary1988,andOCHNMarketTimingSystemRagng:LosAngelesCountysinceJanuary1988.Thechartonhistoricvaluagonshows,ataglance,howclosethemarkettradestoitshistoricnorm.Thebenchmarkperiodisshowningreen,andthedegreeofmarketvolaglitycanbeinferredfromthescaletotheler.Forexample,LACountytradedforasmuchas42%belowrentalparityand84%aboveitduringthe26-yearperiodshown.Needlesstosay,thatisveryvolagle,andpeoplewhoboughtduringtheovervaluedperiodsenduredpainfulpricecorrecgonswhentheirhouseswereworthfarlessthantheypaid.

58of58
January2016ShevyAkason877-409-8515
OCHNRATINGSYSTEMCHARTThemarketgmingragngsystemmechanicallyidengfiesbothgoodandbuydimestobuybasedonvaluagon,resalepricechange,andrentalratechange.Since1988,inLACounty,itwaswronginitsrecommendagoninonlyasingletwo-yearperiodfromlate1999tomid2001asthelocaleconomygppedintoarecession.Thesystemcorrectlyidengfiedthehousingbubblesfromthelate80sandthemid00saswellasthebuyingopportunigesinthemid90sandearly10s.MARKETPERFORMANCEANDTRENDSTABLEThemarketperformancetrendstableprovidesatabularsummaryofthecurrentmarketcondigonsbycityandzipwithinthecounty.Itdisplaysthesameperformancemetricsdetailedinprevioussecgonsincluding:medianresaleprice,resalepercentagechangeyear-over-year,resaledollars-per-square-foot,rentpercentagechangeyear-over-year,medianrent,monthlycostofownership,theownershippremiumordiscountbasedonrent,andthecapitalizagonrate.Forhowtointerpretthesenumbersseeprevioussecgonsformoredetail.Tousethesetableseffecgvely,usersshouldhaveashortlistofpotengalcigestheywouldconsiderlivingin.Thesetablesallowtheusertosearchalphabegcallyforcitydata.It’ssuggestedtoconsultboththecitydataandthezipcodedatathatorenprovidesmoredetail,pargcularlyinlargercigesthatmayhavesignificantneighborhoodvariability.Forexample,inCanyonCountry,thetwozipcodesdemonstratethat91387ismoredesirablethan91351becausetheformercostsmoretoownthantorentwhereasthelatercostsmoretorentthantoown.Bycompilingandcomparingdatafromthevariouscigesinauserssearcharea,theycandeterminehowmuchtheywouldhavetospendtoeitherownorrentineacharea,suggesgnghowdesirableandaffordableeachareais.Thiswillalsoallowuserstoeliminateareastheymaynotbeabletoafford.MARKETTIMINGRATINGANDVALUATIONSTABLEThenexttableshowstheragngsandvaluagonsforeachcityandzipwithinthecounty.Thisinformagonismostvaluableforthosehungngforbargainpropergesorfearfulofoverpayinginanovervaluedmarket.IntheexampleaboveArtesiaisaprimemarketforbuyingahome.Themarketusuallytradesata12.9%premiumtorentalparity,butatthegmeofthisreport,itwastradingata16.9%discount,makingit29.6%undervalued!Abuyerinthismarketshouldexperienceaboveaverageappreciagonasthemarketreboundstoitshistoricnorm.Thistablehelpsbuyersspotthosemarketswherethebestdealsaretobefound.Helpingbuyerstargettheirsearchtowheredealsarebestistheprimaryvalueofthisreport.
Top Related