


Languages
Pages
Legal


International Journal of Mechanical & Mechatronics Engineering IJMME-IJENS Vol:19 No:01 1
190401-3535-IJMME-IJENS © February 2019 IJENS I J E N S
Rehan Khan 1a), H. H. Ya 2, William Pao3 1, 2, 3 Mechanical Engineering Department, Universiti Teknologi PETRONAS, Tronoh Perak, Malaysia
(a) Corresponding author: [email protected]
Abstract-- Solid particle erosion is predominant in
hydrocarbon production, drilling, and minerals processing
industries. Erosion may be cause by the impact of particles of
various sizes, shape and hardness to the surface at various
speeds and impact conditions. This work pertains
Computational fluid dynamics (CFD) study to characterize the
wear behavior of carbon steel material long radius elbows used
as flow changing devices in pipelines of the hydrocarbon
production industry. Although extensive studies have been
directed to substantiate the association of system parameters
and material erosion rate, accurate prediction of the erosion
severity in flow changing devices is still a challenge. In this
study, CFD with the discrete phase models is adopted to study
the solid particle erosion physics and the erosion severity of
carbon steel long radius elbow with three different angles 90o,
60o and 30o under the impact of sand particles. The simulation
is done with the k–epsilon turbulence model and the simulation
result from the k–epsilon model was validated by comparing
with the experimental results from the previous study. The 60o
and 30o elbow are less prone to erosion wear and maximum
rate appeared in the 90o elbow. The largest erosion zones have
been identified at or near the outlet of the 90oand 60o elbows
and near to the inlet for 30o elbow. Furthermore, the
relationship of curvature angle on erosion, particle trajectory
and turbulence in the elbow pipe has been discussed.
Index Term— Solid particle erosion; Long radius elbow;
discrete phase model; CFD.
I. INTRODUCTION
In hydrocarbon production when particles have to be
transported, flow changing devices i.e. elbow, bends and
tees are inclined to erosion damage because of the high
transport velocity rate required to keep the particle
motion [1]. In this sense, flow changing devices such as
elbows are more likely to wear during the abrasive
particle conveying and considered a weak component of
gathering and transferring pipelines [2]. Despite a simple
geometry configuration, the erosive wear elbows
encounter has emphasized numerous researchers past
decades [3]. Many experimental studies have been
executed to extract the erosion pattern in an elbow
configuration.
Table I summarizes the pertinent literature on erosion
research on solid particles erosion in elbow
configurations. Most of the past studies in solid particle
erosion have been related in the liquid phase for the
standard elbow while few investigations have been
conducted for various elbow angular configuration
[4].Most of the literatures have focused on 900 elbow and
fewer studies have investigated erosion with smaller
angular configuration elbow.
The study of the elbow in erosion research is
significant since it is the common configuration that is
the most influence to erosion failure under industrial
operating conditions [5].The velocity developed
downstream of the elbow forces particles in direction of
the wall. For low Stokes number (liquid-solid flows), the
deviation in particle trajectories before impact is seen due
to fluid flow and particles impact the target surface with
a range of different impact angles. Collective
mechanisms further enhance the erosion in the larger
angle elbow [6]. In the present work, the influential effect
of elbow angular configuration on sand erosion was
studied using computational fluid dynamics simulation . A
semi-empirical erosion correlation is implemented to
quantify erosion severity of elbow geometry
configuration. Furthermore, considering that in long-
range flow pipelines large curvature angle i.e. 90° elbows
can be substitute by elbows configuration with smaller
curvature angle, as 60° and 30°elbows, on which the
limited studied had done in literature. This study
highlights to quantify erosion in elbows geometrical
configurations by adopting of a numerical approach.
Numerical Investigation of the Elbow Angle
Effect on Solid Particle Erosion for Liquid-Solid
Flow

International Journal of Mechanical & Mechatronics Engineering IJMME-IJENS Vol:19 No:01 2
190401-3535-IJMME-IJENS © February 2019 IJENS I J E N S
Table I
Literature in the sand erosion of elbow configuration
S. N Reference Geometry Fluid Particle Measurement
technique
Key Findings
1 Ronald E. Vieira
[7]
Material:
Aluminum
Configuration:
90o Elbow
Gas
Water
Sand
300μm;150 μm
Flow loop with non-
intrusive Ultrasonic Technique (UT)
The 300 μm sand particles generate 3.1 times more metal
removal in comparisonto 150
μm sand particles.
The annular flow regime is
creating more erosion induced damage than pseudo-
slug flow regime conditions
2 Soroor Karimi [8]
Material:
Stainless steel 316
Carbon steel 1018
Configuration:
90o Elbow
Gas Water
Sand; Fine
300μm;25 μm
CFD The CFD over predict the erosion-induceddamage due to
fine particles and not accurately predicts the erosion
intensity and locations in
elbows geometry. 3 JianGuo Liu
[9] Material: Carbon steel
Configuration:
90o Elbow
Water Sand
250 μm
Flow Loop The erosion intensity changes
significantly as velocity changes from 3.5 to 4.0 m/s.
4 Wenshan Peng [10]
Material:
Stainless steel 316
Configuration:
90° elbow and 180° elbow
Water Sand
150 μm
CFD Erosion significantly occurs at the boundary walls of the
flow pipeline near to the elbow exit and the outer side
of the elbow
5 Jukai Chen
[4] Material: Carbon steel
Configuration:
450,600,90°
standard elbow
Water Sand
150 μm
CFD-DEM The maximum locations
oferosion induced damage are closest to exit for all elbows
configurations.
The bend-angle significantly
affects the erosion and alter its
magnitude. 6 Gabriel Chucri
Pereira
[5]
Material:
Aluminum
Configuration:
90o Elbow
Air Sand
150 μm
CFD The wall roughness
significantly affects the erosion and increases its
magnitude.
The specific value of the friction coefficient does not
affect erosion measurement.
II. COMPUTATIONAL FLUID DYNAMIC
SIMULATION
To quantify the erosion intensity and damage in the wide
range of geometries under different flow conditions, erosion
equations should be implemented into CFD codes. Because
of the significance of computational techniques in erosion
quantification, a range of studies has been done by scholars
for complex geometries [4, 5, 8, 10]. For that reason,
erosion computational code was implemented in
Computational Fluid Dynamic (CFD) software such as
FLUENT, CFX, STAR-CCM+. These CFD tools offer the
advancement of computational capabilities in providing
better accuracy of sand erosion rate and suspected erodent
locations.
Generally, each CFD simulation has three main
components: a pre-processing unit, flow physics solver, and
post-processing unit. In the erosion, CFD simulation step
followed shown in Fig 1.
Fig. 1. CFD simulation stages
The Oka CFD based erosion model is considered for this
research and the k–ε model is selected to restrain turbulent
flow. Numerous empirical and semi-empirical erosion

International Journal of Mechanical & Mechatronics Engineering IJMME-IJENS Vol:19 No:01 3
190401-3535-IJMME-IJENS © February 2019 IJENS I J E N S
correlations have been published in the literature. Many
experimental and theoretical types of research are
performed for erosion processes and erosion prediction
models are evaluated and developed based on different
parameters. For a ductile material where the erosion varies
with the impact angle and velocity, the Oka erosion model
is more suitable erosion model [11]. In this paper, the
erosion correlation developed by Oka outlined in Equation
1 is adopted which accounts for material characteristic and
geometrical shape. The erosion damage can be related to
other parameters in the form
3)(2)(1))((
9101
k
d
pdk
V
pVk
vHkF
wER
(1)
Where ρw is the density of target material, F(ϴ)
dimensionless function of the impact angle, Hv is the
Vickers hardness of the target material,VP particle impact
velocity,V’ is the impact velocity of the reference
particle,dp is the particle diameter and d’ is the reference
diameter.
A. Turbulence model
In this study,the k–ε turbulence model is implemented to
extract the flow profile. Zhang and Liu [12] identified the
certaintyby comparison of various turbulence correlations
and found that the k–epsilon correlation accurately predicts
flow field in elbows geometry. The k–ε model pertains two
important parameters: turbulent kinetic energy (k) and the
turbulence dissipation rate (ε). Equation 2 represents the
mean kinetic energy.
).''(''.2
'''.2
1''2''
)(
ijE
ju
iu
ije
ije
ju
iu
iu
ijepdiv
kdivt
k
uu
U
(2)
Where Eij is the mean rate of deformation tensor. For high
viscosity, generally, turbulence flow has fewer occurrences.
Such aspect influence to impact velocity and particles
impact angle.
Fig. 2. Schematic of geometry (a) 900 (b) 600 (c) 300
B. Numerical Simulation
Erosion of the low stroke number flow was simulated using
a commercial software package. Assuming that sand
particle was introduced at a steady flow condition entrance
length of 1m and exist length 0.5m was added to the elbow
configuration. The long radius elbow pipe having an inner
radius of 0.0255m and the radius of curvature of a 0.0765m,
schematic of geometric configurations are shown in Fig 2.
The erosion rate and sand trajectory were extracted from the
simulation. The two phases were water as liquid phase and
the sand as the solid phase. The computational mesh was
generated by ANSYS, 524000 elements with an element
size of 0.003 m were intended to assure the quality. To
extract erosion rate and particle trajectories, discrete phase
model (DPM) approach was introduced in simulation
stages. The simulation parameters used to extract the
erosion profile of the elbow configurations are listed in
table II: Table II
Simulation Setup
Simulation Parameters
Target surface material Carbon Steel
Erodent Particle SiO2
Particle Diameter 250 micron
Density 2.65 [g/cm3]
Shape Uniform-sphere
Mass flow rate 230 [kg/hr]
Turbulence Model Realizable k-epsilon
Residuals 1e-5
Turbulent intensities 3.68 %
C. Computational Mesh:
To depict the numerical setup, the entire flow domain was
solved and generated using hexahedral mesh, which gives a

International Journal of Mechanical & Mechatronics Engineering IJMME-IJENS Vol:19 No:01 4
190401-3535-IJMME-IJENS © February 2019 IJENS I J E N S
provision of stable and minimization of numerical diffusion
error in the numerical simulations. To capture flow pattern
more accurately near the wall gradual refinement technique
adopted near the vicinity of walls as shown in Fig 3.To
assure the stability of results quality and computation use, a
mesh independence study was performed. The results are
presented in a mesh independence study section.
Fig. 3. Computational Mesh for Elbow configuration
As the numerical approach is adopted to solve the problem,
to ensure its applicability it is important to assess the
validity of the adopted approach. Therefore, Ronald et al.[7]
flow loop test results on a long radius elbow has been used
for validation of flow physics. Fig. 4 shows the agreement
between the flow loop tests and the CFD results. There is a
good agreement in terms of the quantification of erosion
rate and location of highest erosion as outlined in Fig 4. The
trend of the variation of erosion rate over the curvature of
long radius elbow is also captured by CFD. As a result, the
CFD approach with the current simulation arrangement is
considered being suitable to the problem of quantification
of the erosion rate on different elbow geometric
configuration types.
D. Mesh independence study
Three mesh resolutions were analyzed for this study to
adjudge the mesh independence. All three meshes were
hexahedral and generated with the ANSYS pre-built
meshing module. For the k–epsilon turbulence models
refinement of the grid is important to assure that y + value
less than 1 in the first element is not outside the laminar
layer and away from the wall, parameters for the mesh is
listed in Table 3. The erosion rate was quantified from three
grid sizes, producing slight differences from mesh to mesh
as presented in Fig 5. As the difference in the quantified
erosion rate from mesh 2 and mesh, 3 was less than 2%, the
mesh 2 was in good agreement for minimizing run-time and
memory use. Based on the study, the numerical simulations
of the current study were performed considering the mesh
2.
Fig. 4. Simulation and experimental [7] erosion rate vs. bend curvature
angle for 900 elbow
Fig. 5.Numerical erosion rate vs. bend curvature angle for 900 elbows for three mesh resolutions.

International Journal of Mechanical & Mechatronics Engineering IJMME-IJENS Vol:19 No:01 5
190401-3535-IJMME-IJENS © February 2019 IJENS I J E N S
Table III
Mesh independence statistics
III. RESULTS AND DISCUSSION
The results and discussion are outlined with erosion
pattern and particle trajectories for three elbow
geometric configurations in first section. Thereafter the
numerical erosion rate under liquid-solid flow along the
curvature angle for various elbow configurations is
investigated. Then the effects of elbow curvature angle
on flow field are presented.
A. Erosion profile and erodent particle trajectories
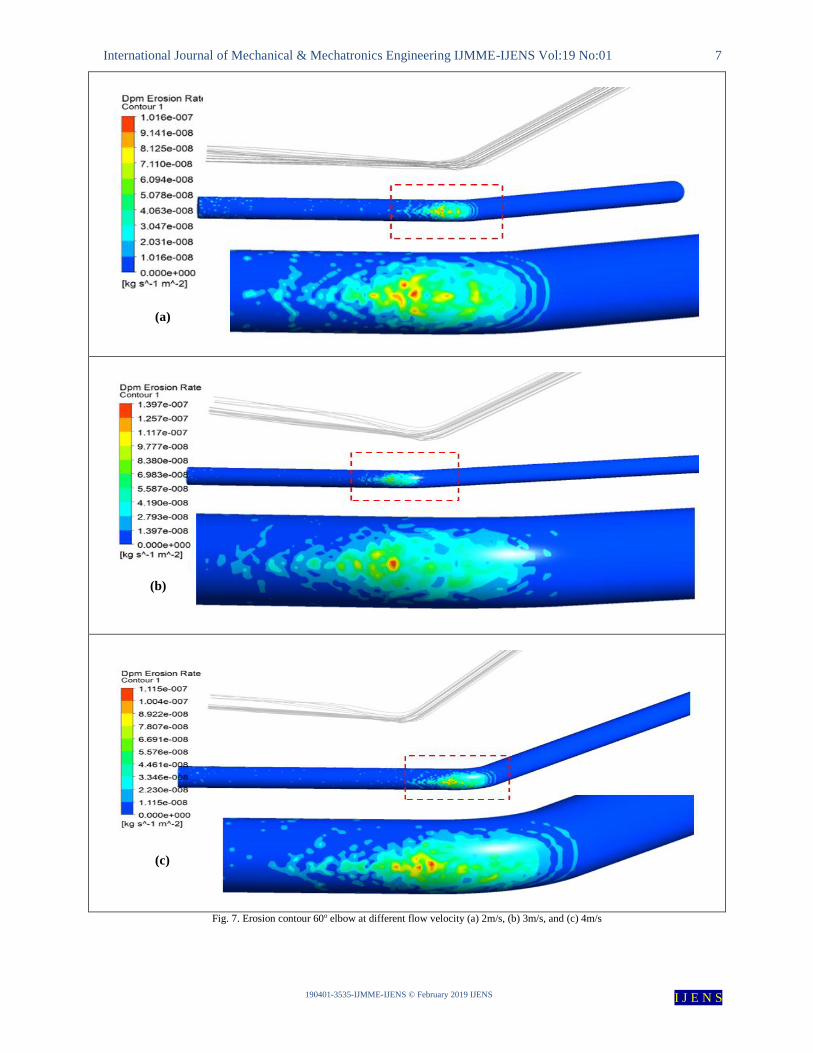
Fig. 6, Fig. 7 and Fig.8presentstheextracted erosion
profile, erosion contour, and erodent particle path in
three elbow configuration for carrier fluid velocity of
2m/s, 3m/s and 4m/s with particle diameters of 250
microns. In low Stokes number flow, i.e. liquid-solid
flow the dynamics of particles depends on carrier fluid
flow. Consequently, the erosion region depends on the
collective impact and a path followed by erodent
particles towards wall surface of the elbow.
Fig. 6, Fig. 7 and Fig.8shows that particle collision with
wall generates erosion profile under liquid-solid flow
condition; the erosion rate with 900curvature is
considerably larger than the 600 and 300 curvature
configuration. The large erosive zone generated due to
the impact of particles transported at high speed to the
outer wall surface with high impact angles. Fig. 6, Fig. 7
and Fig.8displays that consideration of curvature angle
escalates the maximum erosion rate and erosion region.
Also, consideration of curvature angle causes numerous
particles-wall impacts and leads to narrow particle
cluster region created in 900 bends, a cluster region will
resulted in narrow erosion crater on the elbow wall
surface. Thus large curvature angle maximizes the
erosion in the liquid-solids flow. Fig. 9 shows the
trajectories of particles. Fig. 9(a), Fig. 9(b) and Fig.9(c)
comparisons clearly show that curvature angle alters
particle trajectories. Particle dynamics leads to a more
catastrophic impact to the wall surface of 900elbows as
the particle disintegrates more walls mass compared to
600 and 300 and turnout in an increase of the erosion rate.
B. Influence of the curvature angle and flow speed on
the erosion rate
Fig 9 depicts, the erosive region is affiliated to the path
of the erodent particle in the carrier fluid and the
trajectory of the particles is preeminent per flow
conditions. Altering the curvature angle of the elbow
will alter the flow conditions and leads to the maximum
erosion location. Fig. 9 shows the erosive wear in elbow
due to sand particles resulted in the disintegration in the
outer wall surface. As illustrated by the particle tracks,
the particles are inclined to the rotation motion when the
elbow configuration is changed to 300 the erosion
location is shifted to location B at the elbow inlet side.
The erodent particles will cause more percussion the
wall in region B at inlet side for 300elbows whereas for
900and 600elbow configuration the more particles collide
the wall in region A at elbow outlet sides as shown Fig.
9. The maximum erosion rate for 900 in Fig. 10 reflects
reduction with increasing carrier fluid velocity. The
maximum erosion rate gets going to reduce for the
carrier fluid velocity is 4 m/s in 90°, 60°, and30° elbows
and when the carrier fluid velocity is 3 m/s the maximum
erosion rate appears for
Mesh Study
Mesh 1 2 3
No of cells 356900 524000 876000
No of the node
on k
5 8 12
Erosion
rate(Maximum)
(mm/year)
1.306 1.334 1.356

International Journal of Mechanical & Mechatronics Engineering IJMME-IJENS Vol:19 No:01 6
190401-3535-IJMME-IJENS © February 2019 IJENS I J E N S
Fig. 6. Erosion contour 90o elbow at different flow velocity (a) 2m/s, (b) 3m/s, and (c) 4m/s
(a)
(b)
(c)
(a)
International Journal of Mechanical & Mechatronics Engineering IJMME-IJENS Vol:19 No:01 7
190401-3535-IJMME-IJENS © February 2019 IJENS I J E N S
Fig. 7. Erosion contour 60o elbow at different flow velocity (a) 2m/s, (b) 3m/s, and (c) 4m/s
(a)
(b)
(c)

International Journal of Mechanical & Mechatronics Engineering IJMME-IJENS Vol:19 No:01 8
190401-3535-IJMME-IJENS © February 2019 IJENS I J E N S
Fig. 8. Erosion contour 30o elbow at different flow velocity (a) 2 m/s, (b) 3m/s, and (c) 4m/s
(a)
(b)
(c)

International Journal of Mechanical & Mechatronics Engineering IJMME-IJENS Vol:19 No:01 9
190401-3535-IJMME-IJENS © February 2019 IJENS I J E N S
Fig. 9. Erosion contour and particle trajectory for 3m/s flow velocity: (a) 900 elbow ; (b) 600 elbow and; (c) 300 elbow
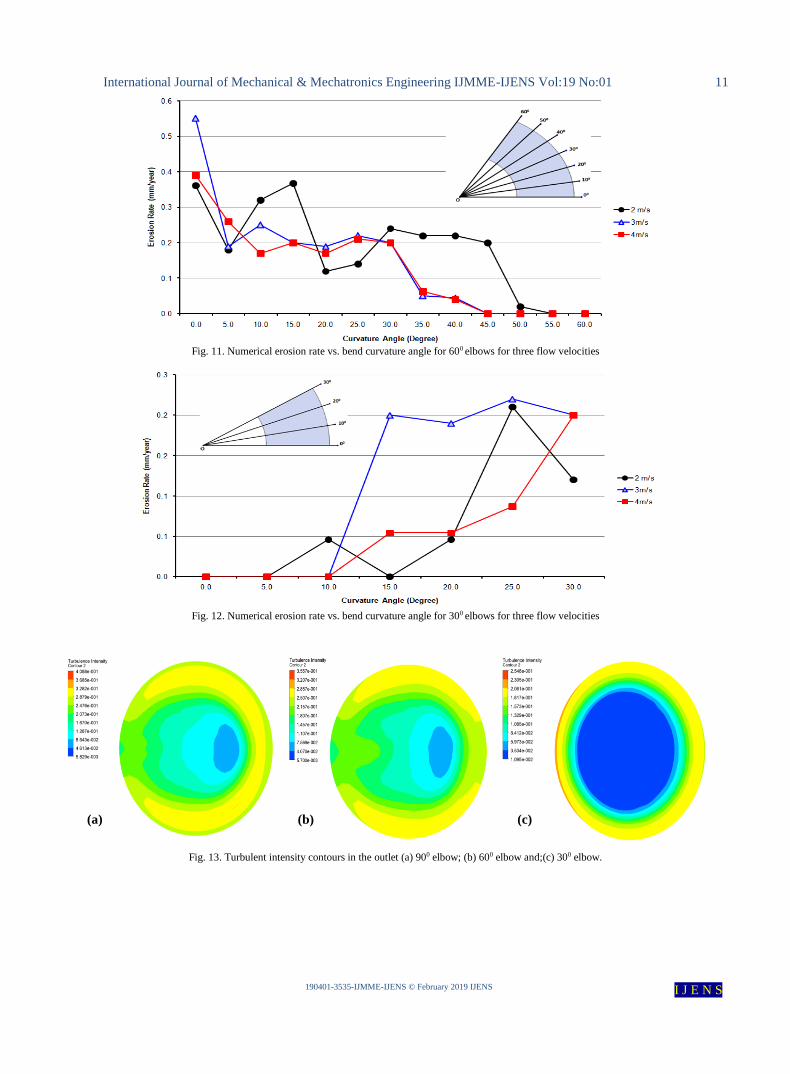
all three elbow configurations as shown in Fig 10, 11 and
12. The maximum erosion rate of 90° elbow is 0.95
mm/year located in Ө = 5° and 60° elbow is 0.55 mm/year
at Ө = 0°. The simulation results show that the maximum
erosive zone of large curvature angle elbows configuration
i.e. 90° and 60°are located at or adjacent to the exit wall and
the reduction in erosion rate is observed for low curvature
angle i.e. 30° with a maximum erosion rate of 0.22 mm/year
located in Ө = 25° near the inlet.
Figs. 10, 11 and 12 shows the erosion rate of bend under
different flow velocities and the wall thickness loss of the
bend along the bend section curvature angle θ with the
maximum erosive region of the various elbow geometrical
configurations. Figure 10, it can be seen that for 90° elbow
(a) (b)
(c)

International Journal of Mechanical & Mechatronics Engineering IJMME-IJENS Vol:19 No:01 10
190401-3535-IJMME-IJENS © February 2019 IJENS I J E N S
when 0°<θ<40° the more erosive zone induced at the outer
surface of the bend leads to a considerable wall thickness
loss, and for 40°<θ<80°, the small erosive zone is created at
the outer surface and no erosive zone developed for
80°<θ<90°. Figure 11, it can be seen that in 60° elbow for
0°<θ<20° high erosive wear disintegrate outer surface wall
of the bend, and for 20°<θ<50°, the less erosive wear
induced at the outer wall of the bend and no surface
disintegration can be seen for 50°<θ<60°, In Figure 12, for
30° elbow with curvature angle of 0°<θ<10° the erosive
wear in elbow wall is zero and for 10°<θ<30°, the outer
wall erosion rate of the is the considerable large, which is
the most likely to cause wear and tear and cause bend wear
failure.Note that for curvature angle from 0° to 90°, erosion
and particles impact the outer wall surface of elbow
geometrical configuration. From this simulation study, it is
clear at the exit of 90° and 60° elbow, particle motion are
primarily suspected for altering erosion pattern. This can be
observed in Fig 9.By comparing 900, 600 and 300 elbow
erosion rate results the maximum erosion rate in 600elbow
is 42% less than 900 elbow and in 300elbowit's 76.8% less
compared to 900elbow. As a result, taking all the above
under consideration, the replacement of 900elbow with 600
and 300 elbow is recommended for suitable cases.
C. Relationship of the curvature angle and turbulence
intensity
Fig. 13 and 14 illustrates that turbulent intensity also leads
to increase particle impact and erosion at the outer surface
of the elbow curvature. The high intensity turbulent flow at
downstream of 90° elbow escalates motion of particles in
the radial directions and results in more impact induced to
the outer wall surface. It turns out to be a narrow erosive
region. This means that apart from the drag force,
turbulence intensity contributes to altering particle
trajectories in 90°, 60°,and 30° elbows. Based on analysis
turbulence weigh more in 90° and 60° elbow at the
downstream and for 30° elbow high turbulence occurrence
at the upstream. Fig. 13 and 14 illustrate the turbulent
intensity contours in the outlet and inlet of the elbows
configuration. The turbulent intensity contours suggest that
the contraction in the blue zone and the enlargement in the
red and yellow zone signify the maximization of turbulent
intensity. This means an excessive turbulence turn out in
90° and 60° elbow exit sections.
Fig. 10. Numerical erosion rate vs. bend curvature angle for 900 elbows for three flow velocities
International Journal of Mechanical & Mechatronics Engineering IJMME-IJENS Vol:19 No:01 11
190401-3535-IJMME-IJENS © February 2019 IJENS I J E N S
Fig. 11. Numerical erosion rate vs. bend curvature angle for 600 elbows for three flow velocities
Fig. 12. Numerical erosion rate vs. bend curvature angle for 300 elbows for three flow velocities
Fig. 13. Turbulent intensity contours in the outlet (a) 900 elbow; (b) 600 elbow and;(c) 300 elbow.
(a) (b) (c)

International Journal of Mechanical & Mechatronics Engineering IJMME-IJENS Vol:19 No:01 12
190401-3535-IJMME-IJENS © February 2019 IJENS I J E N S
Fig. 14. Turbulent intensity contours in the inlet (a) 900 elbow ; (b) 600 elbow and;(c) 300 elbow.
IV. CONCLUSIONS
This work pertains erosion study of carbon steel long radius
elbow pipe under liquid-solids flow using computational
fluid dynamics.Numerical results show that the curvature
angle has an influence on the particle dynamics and the
wear profile of the elbow. The adopted erosion model
developed by Oka to be an accurate model for
quantification of the erosion rate under liquid-solids pipe
flows. This paper highlights the numerical investigation to
decouple the relationship of elbow curvature angle and
erosion rate. The following conclusions can be summarized
based on the results extracted in this study:
1. The results reveal that the severe erosion occurrence is
downstream of the 900 and 600 elbows. Since, in the
300elbow the locations of maximum erosion are shifted
to upstream and the curvature angle significantly
influences the maximum erosion rate.
2. In 900 and 600 curvature angle elbow, a sand particle
concentration region induced on the outer surfaces of
the elbow towards downstream generates an erosion
crater on the elbow near or at the outlet side.
3. When the curvature angle is changed to 300, the
particle trajectories changes and the particle
concentration region shifted to upstream and cause
more destructive impact to the outer surface at the inlet
side.
4. In presence high curvature angle elbow, the high
turbulence due to flow driven at exists affects particles
trajectories and induces more collisions to the outer
wall surface and leads to alter the erosion pattern.
5. The effect of curvature angle on erosion in the elbows
geometrical configuration shows that 90° elbow pipe is
more prone to erosion than 60° and 30° elbows. A
reduction in the 90° curvature angle to 30° seems to
reduce the maximum erosion rate up to 76.8%.On the
other hand, the use of 60° curvature angle reduces the
maximum erosion rate up to 42% .Thus, to replace
large curvature-angle elbows with less curvature-angle
(e.g. 30° and 60°) elbow is recommended for suitable
cases.
ACKNOWLEDGMENT
The authors acknowledge the support given by the
Universiti Teknologi PETRONAS for this research.
AUTHOR’S CONTRIBUTIONS
Rehan Khan: Literature study, data analysis and the
simulations analysis of the research and also participated in
writing the manuscript.
H. H. Ya and William Pao: Provided the research topic,
guided to the route of research and numerical study.
Ethics
This article pertains an original research. There are no
ethical issues ensue after the publication of this manuscript
REFERENCES [1] Carlos Antonio Ribeiro Duarte, Francisco José deSouz, Vinicius
Fagundes dos Santos, (2015). “Mitigating elbow erosion with a
vortex chamber”, Powder Technology, Vol.288, pp.6-25.
DOI:10.1016/j.powtec.2015.10.032
[2] R.E. Vieira, N.R. Kesana, B.S. McLaury, S.A. Shirazi, C.F. Torres,
E. Schleicher, U. Hampel, (2014). “Experimental investigation of the
effect of 90° standard elbow on horizontal gas-liquid stratified and annular flow characteristics using dual wire-mesh sensors”, Exp.
Thermal Fluid Sci, Vol.59, pp.72–87.
DOI:10.1016/j.expthermflusci.2014.08.001 [3] X. Chen, B.S. McLaury, S.A. Shirazi. (2004). “Application and
experimental validation of a computational fluid dynamics (CFD)-
based erosion prediction model in elbows and plugged tees”, Comput. Fluids 33, Vol.10, pp 1251–1272.
DOI: 10. 1016/j.compfluid.2004.02.003.
[4] Jukai Chen, YuesheWang, Xiufeng Li, Renyang He, Shuang Han, Yanlin Chen. (2015). “Erosion prediction of liquid-particle two-
phase flow in pipeline elbows via CFD–DEM coupling method”,
PowderTechnology,Vol.275,pp.182–187. DOI:10.1016/j.powtec.2014.12.057
[5] G.C. Pereira, F.J. de Souza, D.A. de MoroMartins.(2014).“Numerical
prediction of the erosiondue to particles in elbows”, Powder Technol. Vol.261,pp.105–117, DOI: 10.1016/j.powtec.2014.04.033
[6] Jie Pei, AihuaLui, Qiong Zhang,TingXiong, Pan Jiang, WeiWei,
(2018). “Numerical investigation of the maximum erosion zone in elbows for liquid-particle flow”, Powder Technology, Vol. 333,
pp.4759.DOI:10.1016/j.powtec.2018.04.001
(a) (b) (c)

International Journal of Mechanical & Mechatronics Engineering IJMME-IJENS Vol:19 No:01 13
190401-3535-IJMME-IJENS © February 2019 IJENS I J E N S
[7] Ronald E. Vieira, Mazdak Parsi, Peyman Zahedi, Brenton S.
McLaury, Siamack A. Shirazi ,(2017),“Sand erosion measurements under multiphase annular flow conditions in a horizontal-horizontal
elbow”, Powder Technology, Vol. 320, pp.625–636.
DOI:10.1016/j.powtec. 2017.07.087 [8] Soroor Karimi, Siamack A. Shirazi ,(2017), “Predicting fine particle
erosion utilizing computational fluid dynamics”.Wear, Vol. 376–377,
pp.1130-1137. DOI:10.1016/j.wear.2016.11.022 [9] JianGuoLiu, WuLan BaKeDaShi,ZiLi Li,YaZhou Xu,WanRan
Ji,Chao Zhang,Gan Cui, RuiYuZhang,(2017). “Effect of flow
velocity on erosion-corrosion of 90-degree horizontal elbow”. Wear,Vol.376-377,pp .516 525.DOI:10.1016/j.wear.2016.11.015
[10] Wenshan Peng, Xuewen Cao ,(2017). “Numerical simulation of
solid particle erosion in pipe bends for liquid-solid flow”. Powder Technology, Vol. 294, pp.266–279.
DOI:10.1016/j.powtec.2016.02.030
[11] Vahid Abdolkarimi, Rasool Mohammadikhah. (2013). “CFD Modeling of Particulates Erosive Effect on a CommercialScale
Pipeline Bend”, ISRN Chemical Engineering, Article ID 105912
DOI.org/10.1155/2013/105912 [12] R.Zhang, H.X.Liu .2014. “Numerical simulation of solid particle
erosion in a 90-degree bend for gas flow”: Proceedings of ASME
33rd International Conference on Ocean, Offshore and Arctic Engineering,June8-13, ASME, Paper no.23656.
Top Related