


Languages
Pages
Legal


Bridgestone Corporation16
NOTE 1 NATURE OF OPERATIONS Bridgestone Corporation and its subsidiaries (hereinafter referred to collectively as the “Companies”) engage in developing, manufacturing and marketing tires and diversified products. The Companies market their products worldwide and operate manufacturing plants in every principal market. Development activities take place primarily in Japan, the United States of America (the “U.S.”) and Europe.
Tire operations include retread business, automotive maintenance and repairs, retail business and raw material supplies, as well as tire development, manufacturing and marketing. Diversified products include industrial products, chemical products, automotive components, construction materials, electronic equipment, bicycles and sporting goods.
NOTE 2 BASIS OF PRESENTATION OF CONSOLIDATED FINANCIAL STATEMENTSThe accompanying consolidated financial statements have been prepared in accordance with the provisions set forth in the Japanese Financial Instruments and Exchange Act and its related accounting regulations, and in accordance with accounting principles generally accepted in Japan (“Japanese GAAP”), which are different in certain respects as to the application and disclosure requirements of International Financial Reporting Standards (“IFRS”) and the accounting principles generally accepted in the U.S. (“U.S. GAAP”).
The consolidated financial statements are stated in Japanese yen, the currency of the country in which Bridgestone Corporation (the “Company”) is incorporated and operates. The translations of Japanese yen amounts into U.S. dollar amounts are included solely for the convenience of readers outside Japan and have been made at the rate of ¥116.49 to $1, the approximate rate of exchange on December 31, 2016. Such translations should not be construed as representations that the Japanese yen amounts could be converted into U.S. dollars at that or any other rate.
NOTE 3 SUMMARY OF SIGNIFICANT ACCOUNTING POLICIES(1) Consolidation
The consolidated financial statements include the accounts of the Companies in which the Company has effective control. All significant intercompany balances and transactions have been eliminated in consolidation. All material unrealized profits included in assets resulting from transactions within the Companies are also eliminated. Investments in affiliated companies, primarily those owned 20% to 50%, are accounted for under the equity method with appropriate adjustments for intercompany profits and dividends. Share of profit of entities accounted for using the equity method is included in other income (expenses) in the consolidated statements of income. The number of consolidated subsidiaries and affiliated companies for 2016 and 2015 is summarized below:
2016 2015
Consolidated subsidiaries 294 300
Affiliated companies 148 145
(2) Unification of accounting policies applied to foreign
subsidiaries for the consolidated financial statements
In May 2006, the Accounting Standards Board of Japan (the “ASBJ”) issued ASBJ Practical Issues Task Force (“PITF”) No. 18, “Practical Solution on Unification of Accounting Policies Applied to Foreign Subsidiaries for the Consolidated Financial
Statements,” which was subsequently revised in February 2010 and March 2015 to reflect revisions of the relevant Japanese GAAP or accounting standards in other jurisdictions. PITF No. 18 prescribes that the accounting policies and procedures applied to a parent company and its subsidiaries for similar transactions and events under similar circumstances should in principle be unified for the preparation of the consolidated financial statements. However, financial statements prepared by foreign subsidiaries in accordance with either IFRS or U.S. GAAP tentatively may be used for the consoli dation process, except for the following items that should be adjusted in the consolidation process so that net income is accounted for in accordance with Japanese GAAP, unless they are not material: (i) amortization of goodwill; (ii) scheduled amortization of actuarial gain or loss of pensions that has been recorded in equity through other comprehensive income; (iii) expensing capitalized development costs of R&D; and (iv) cancellation of the fair value model of accounting for property, plant and equipment and investment properties and incorporation of the cost model of accounting.
(3) Unification of accounting policies applied to foreign
affiliated companies for the equity method
In March 2008, the ASBJ issued ASBJ Statement No. 16, “Accounting Standard for Equity Method of Accounting for Investments” which was subsequently revised in line with the revisions to PITF No. 18 above. The standard requires
NOTES TO CONSOLIDATED FINANCIAL STATEMENTSBridgestone Corporation and Subsidiaries

ANNUAL REPORT 2016 Financial Review 17
adjustments to be made to conform the affiliate’s accounting policies for similar transactions and events under similar circumstances to those of the parent company when the affiliate’s financial statements are used in applying the equity method unless it is impracticable to determine such adjustments. In addition, financial statements prepared by foreign affiliated companies in accordance with either IFRS or U.S. GAAP tentatively may be used in applying the equity method if the following items are adjusted so that net income is accounted for in accordance with Japanese GAAP, unless they are not material: (i) amortization of goodwill; (ii) scheduled amortization of actuarial gain or loss of pensions that has been recorded in equity through other comprehensive income; (iii) expensing capitalized development costs of R&D; and (iv) cancellation of the fair value model of accounting for property, plant and equipment and investment properties and incorporation of the cost model of accounting.
(4) Cash equivalents
Cash equivalents are shortterm investments that are readily convertible into cash and that are exposed to insignificant risk of changes in value. Cash equivalents include highly liquid investments with original maturities of three months or less.
(5) Allowance for doubtful accounts
Allowance for doubtful accounts is established in amounts considered to be appropriate based on the Companies’ past credit loss experience and an evaluation of potential losses in the receivables outstanding.
(6) Inventories
Inventories are substantially stated at the lower of cost, determined by the average method, or net selling value. Meanwhile, inventories held by subsidiaries in the U.S. are substantially stated at the lower of cost, determined principally by the lastin, firstout method, or market value.
(7) Marketable and investment securities
Marketable and investment securities are classified and accounted for, depending on management’s intent, as follows: Available–for–sale securities, which are not classified as either of the aforementioned securities, are reported at fair value, with unrealized gains and losses, net of applicable taxes, reported in a separate component of equity. Nonmarketable available–for–sale securities are stated at cost determined by the moving–average method. For other–than–temporary declines in fair value, investment securities are reduced to net realizable value by a charge to income.
(8) Property, plant and equipment
Property, plant and equipment are stated at cost. Depreciation of property, plant and equipment of the Company and its domestic subsidiaries is computed substantially by the decliningbalance method based on the estimated useful lives of the assets, while the straightline method is applied to property, plant and equipment of the Company’s overseas subsidiaries. Maintenance, repair and minor renewals are charged to income as incurred.
(9) Impairment of assets
Assets are reviewed for impairment whenever events or changes in circumstance indicate the carrying amount of an asset or asset group may not be recoverable. An impairment loss is recognized if the carrying amount of an asset or asset group exceeds the sum of the undiscounted future cash flows expected to result from the continued use and eventual disposition of the asset or asset group. The impairment loss would be measured as the amount by which the carrying amount of an asset or asset group exceeds its recoverable amount, which is the higher of the discounted future cash flows expected to result from the continued use and eventual disposition of the asset or asset group, or the net selling price at disposition.
(10) Goodwill
Goodwill recorded by subsidiaries, and the excess of cost of the Company’s investments in subsidiaries and affiliated companies over its equity at the respective dates of acquisition, are mainly being amortized on a straightline basis over a reasonable economical life of up to 20 years.
(11) Provision for sales returns
Provision for sales returns is estimated and recorded principally to provide for future losses on the return of snow tires.
(12) Provision for recall
In order to reserve for outlays related to check and replacement of object tires, an estimated amount of future obligations is recorded.
(13) Provision for product warranties
Provision for product warranties, included in other liabilities, is estimated and recorded at the time of sale to provide for future potential costs, such as costs related to after–sales services, in amounts considered to be appropriate based on the Companies’ past experience.
(14) Provision for environmental remediation
In order to reserve for outlays legally required for removal and disposal of polychlorinated biphenyl (“PCB”) and other, the estimated amount of future obligations is recorded.
NOTES TO CONSOLIDATED FINANCIAL STATEMENTS
Bridgestone Corporation18
(15) Provision for reorganization of R&D and
manufacturing base
In order to reserve for outlays related to reorganization of R&D and manufacturing base, the estimated amount of future obligations is recorded.
(16) Retirement and pension plans
The Company and its domestic subsidiaries have contributory funded defined benefit pension plans and unfunded retirement benefit plans for employees. Certain of the Company’s overseas subsidiaries have funded defined benefit pension plans and defined contribution pension plans. Effective April 1, 2000, the Company adopted an accounting standard for retirement benefits and accounted for the liability for retirement benefits based on the projected benefit obligations and plan assets at the balance sheet date. The projected benefit obligations are attributed to periods on a straightline basis. For the Company and its domestic subsidiaries, actuarial gains and losses are amortized on a straightline basis over 10 years and past service costs are amortized on a straightline basis over 10 years within the average remaining service period. For certain overseas subsidiaries, actuarial gains and losses are amortized on a straightline basis over 8 to 12 years in case actuarial gains and losses exceed 10% of the larger of retirement benefit obligations or pension plan assets and past service costs are amortized on a straightline basis over 3 to 12 years within the average remaining service period. In addition, at certain consolidated subsidiaries in the Americas, an estimated total amount of expenses for postretirement benefits in addition to pensions is allotted based on the number of years of service provided by the employees. In May 2012, the ASBJ issued ASBJ Statement No. 26, “Accounting Standard for Retirement Benefits” and ASBJ Guidance No. 25, “Guidance on Accounting Standard for Retirement Benefits,” which replaced the accounting standard for retirement benefits that had been issued by the Business Accounting Council in 1998 with an effective date of April 1, 2000, and the other related practical guidance, and were followed by partial amendments from time to time through 2009.(i) Under the revised accounting standard, actuarial gains and losses and past service costs that are yet to be recognized in profit or loss are recognized within equity (accumulated other comprehensive income), after adjusting for tax effects, and any resulting deficit or surplus is recognized as a liability (net defined benefit liability) or asset (net defined benefit asset).(ii) The revised accounting standard does not change how to recognize actuarial gains and losses and past service costs in profit or loss. Those amounts are recognized in profit or loss
over a certain period no longer than the expected average remaining service period of the employees. However, actuarial gains and losses and past service costs that arose in the current period and have not yet been recognized in profit or loss are included in other comprehensive income and actuarial gains and losses and past service costs that were recognized in other comprehensive income in prior periods and then recognized in profit or loss in the current period, are treated as reclassification adjustments. (iii) The revised accounting standard also made certain amendments relating to the method of attributing expected benefit to periods, the discount rate, and expected future salary increases. This accounting standard and the guidance for (i) and (ii) above are effective for the end of annual periods beginning on or after April 1, 2013, and for (iii) above are effective for the beginning of annual periods beginning on or after April 1, 2014, or for the beginning of annual periods beginning on or after April 1, 2015, subject to certain disclosure in December 2015, both with earlier application being permitted from the beginning of annual periods beginning on or after April 1, 2013. However, no retrospective application of this accounting standard to consolidated financial statements in prior periods is required. The Company applied the revised accounting standard and guidance for retirement benefits for (i) and (ii) above, effective December 31, 2014, and for (iii) above, effective January 1, 2015. With respect to (iii) above, the Company changed the method of attributing the expected benefit to periods from the straight–line basis to a benefit formula basis, the method of determining the discount rate from using the period which approximates the expected average remaining service period to using a single weighted average discount rate reflecting the estimated timing and amount of benefit payment, and recorded the effect of (iii) above as of January 1, 2015, in retained earnings.
(17) Asset retirement obligations
In March 2008, the ASBJ issued ASBJ Statement No. 18, “Accounting Standard for Asset Retirement Obligations” and ASBJ Guidance No. 21, “Guidance on Accounting Standard for Asset Retirement Obligations.” Under this accounting standard, an asset retirement obligation is defined as a legal obligation imposed either by law or contract that results from the acquisition, construction, development and normal operation of a tangible fixed asset and is associated with the retirement of such tangible fixed asset.
NOTES TO CONSOLIDATED FINANCIAL STATEMENTS

ANNUAL REPORT 2016 Financial Review 19
The asset retirement obligation is recognized as the sum of the discounted cash flows required for the future asset retirement and is recorded in the period in which the obligation is incurred if a reasonable estimate can be made. If a reasonable estimate of the asset retirement obligation cannot be made in the period the asset retirement obligation is incurred, the liability should be recognized when a reasonable estimate of the asset retirement obligation can be made. Upon initial recognition of a liability for an asset retirement obligation, an asset retirement cost is capitalized by increasing the carrying amount of the related fixed asset by the amount of the liability. The asset retirement cost is subsequently allocated to expense through depreciation over the remaining useful life of the asset. Over time, the liability is accreted to its present value each period. Any subsequent revisions to the timing or the amount of the original estimate of undiscounted cash flows are reflected as an adjustment to the carrying amount of the liability and the capitalized amount of the related asset retirement cost.
(18) Leases
Finance leases are capitalized, and the present value of the related payments is recorded as a liability. Amortization of capitalized leased assets is computed substantially by the decliningbalance method based on the term of the lease.
(19) Income taxes
The provision for income taxes is computed based on income before income taxes included in the consolidated statement of income. The asset and liability approach is used to recognize deferred tax assets and liabilities for the expected future tax consequences of temporary differences between the carrying amounts and the tax bases of assets and liabilities. Deferred income taxes are measured by applying currently enacted income tax rates to the temporary differences. A valuation allowance is provided for any portion of the deferred tax assets where it is considered more likely than not that they will not be realized.
(20) Foreign currency transactions
All shortterm and longterm monetary receivables and payables denominated in foreign currencies are translated into Japanese yen at the exchange rates at the balance sheet date. The foreign currency exchange gains and losses from translation are recognized in the consolidated statement of income.
(21) Foreign currency financial statements
The balance sheet accounts of the Company’s overseas subsidiaries are translated into Japanese yen at the current exchange rate at the balance sheet date except for equity, which is translated at the historical rate. Differences arising from such
translation are shown as foreign currency translation adjustments under accumulated other comprehensive income in a separate component of equity. Revenue and expense accounts of the Company’s overseas subsidiaries are translated into Japanese yen at the average annual exchange rate.
(22) Derivatives and hedging activities
The Companies use derivative financial instruments to manage their exposures to fluctuations in foreign currency exchange rates, interest rates and commodity prices. Foreign currency forward contracts, currency swap contracts and currency option contracts are utilized by the Companies to reduce foreign currency exchange risks. Interest rate swaps are utilized by the Companies to reduce interest rate risks. Also, commodity swap contracts are utilized by the Companies to reduce commodity price risks. The Companies do not enter into derivatives for trading or speculative purposes. Derivative financial instruments are classified and accounted for as follows: (i) all derivatives are recognized as either assets or liabilities and measured at fair value, and gains or losses on derivative transactions are recognized in the consolidated statement of income; and (ii) for derivatives used for hedging purposes, if such derivatives qualify for hedge accounting because of high correlation and effectiveness between the hedging instruments and the hedged items, gains or losses on derivatives are deferred until maturity of the hedged transactions. Foreign currency forward contracts which are designated as hedging exposure to variable cash flows of forecasted transactions are measured at fair value, and the unrealized gains or losses are deferred until the underlying transactions are completed. Other foreign currency forward contracts, currency swap contracts and currency option contracts employed to hedge foreign currency exchange exposures to changes in fair value and in cash flow are also measured at fair value but the unrealized gains or losses are recognized in income. Shortterm and longterm debt denominated in foreign currencies for which foreign currency forward contracts and currency swap contracts are used to hedge the foreign currency fluctuations are translated at the contracted rate if the foreign currency forward contracts and currency swap contracts qualify for hedge accounting. Interest rate swaps which qualify for hedge accounting and meet specific matching criteria are not remeasured at market value, but the differential paid or received under the swap agreements is recognized and included in interest expenses. The gains or losses on commodity swap contracts used to hedge fluctuations of commodity prices are recognized currently in income.
NOTES TO CONSOLIDATED FINANCIAL STATEMENTS

Bridgestone Corporation20
(23) Per share of common stock
Basic net income per share is computed by dividing net income available to common shareholders by the weightedaverage number of common stock outstanding for the period, retroactively adjusted for stock splits. Diluted net income per share reflects the potential dilution that could occur if securities were exercised or converted into common stock. Diluted net income per share of common stock assumes full conversion of the outstanding convertible notes and bonds at the beginning of the year (or at the time of issuance) with an applicable adjustment for related interest expense, net of tax, and full exercise of outstanding warrants and stock options. Cash dividends per share presented in the accompanying consolidated statement of income are dividends applicable to the respective fiscal years, including dividends to be paid after the end of the year.
(24) Reclassification
In preparing the consolidated financial statements, certain reclassifications and rearrangements have been made to the consolidated financial statements issued domestically in order to present them in a form which is more familiar to readers outside Japan. In addition, certain reclassifications have been made in the 2015 consolidated financial statements to conform to the classifications used in 2016.
(25) Changes in presentation
Consolidated statement of cash flowsPrior to January 1, 2016, “Amortization of goodwill” was disclosed separately in the cash flows from operating activities section of the consolidated statement of cash flows. Since during this fiscal year ended December 31, 2016, the materiality of the amount decreased, such amount was included in “Other” in the cash flows from operating activities section of the consolidated statement of cash flows for the year ended December 31, 2016. The amount included in “Other” for the year ended December 31, 2015, was ¥2,147 million. Prior to January 1, 2016, “Share of profit of entities accounted for using equity method” was included in “Other” in the cash flows from operating activities section of the consolidated statement of cash flows. Since during this fiscal year ended December 31, 2016, the materiality of the amount increased, such amount was disclosed separately in the cash flows from operating activities section of the consolidated statement of cash flows. The amount included in “Other” for the year ended December 31, 2015 was (¥397) million.
Prior to January 1, 2016, “Repayments of obligations under finance leases” and “Proceeds from noncontrolling interests for additional shares” were disclosed separately in the cash flows from financing activities section of the consolidated statement of cash flows. Since during this fiscal year ended December 31, 2016, the materiality of the amount decreased, such amount was included in “Other” in the cash flows from financing activities section of the consolidated statement of cash flows for the year ended December 31, 2016. The amount included in “Other” for the year ended December 31, 2015 was ¥5,461 million.
(26) Accounting changes and error corrections
In December 2009, the ASBJ issued ASBJ Statement No. 24, “Accounting Standard for Accounting Changes and Error Corrections” and ASBJ Guidance No. 24, “Guidance on Accounting Standard for Accounting Changes and Error Corrections.” Accounting treatments under this standard and guidance are as follows:(i) Changes in accounting policiesWhen a new accounting policy is applied following revision of an accounting standard, the new policy is applied retrospectively unless the revised accounting standard includes specific transitional provisions, in which case the entity shall comply with the specific transitional provisions.(ii) Changes in presentationWhen the presentation of financial statements is changed, priorperiod financial statements are reclassified in accordance with the new presentation. (iii) Changes in accounting estimatesA change in an accounting estimate is accounted for in the period of the change if the change affects that period only, and is accounted for prospectively if the change affects both the period of the change and future periods.(iv) Corrections of prior-period errorsWhen an error in prior period financial statements is discovered, those statements are restated.
(27) Accounting Changes
(i) Application of accounting standard for business combinations, etc.
The Company has applied the “Accounting Standard for Business Combinations” (ASBJ Statement No. 21, September 13, 2013), the “Accounting Standard for Consolidated Financial Statements” (ASBJ Statement No. 22, September 13, 2013), the “Accounting Standard for Business Divestitures” (ASBJ Statement No. 7, September 13, 2013) and other relevant
NOTES TO CONSOLIDATED FINANCIAL STATEMENTS

ANNUAL REPORT 2016 Financial Review 21
standards from fiscal 2016. As a result, the difference arising from changes in ownership interests in its subsidiary when the Companies continue to have control of the subsidiary is accounted for as capital surplus, and acquisitionrelated costs are treated as expenses in the consolidated fiscal year in which they occurred. Also, for any business combinations on or after the beginning of fiscal 2016, the adjustments of the purchase price allocation following the determination of the provisional accounting treatment are reflected in the consolidated financial statements in which the business combination occurred. In addition, the presentation of net income has been changed, and the presentation of minority interests has been changed to noncontrolling interests. In accordance with the transitional treatment provided in Paragraph 582 (4) of the Accounting Standard for Business Combinations, Paragraph 445 (4) of the Accounting Standard for Consolidated Financial Statements, and Paragraph 574 (4) of the Accounting Standard for Business Divestitures, these accounting standards have been applied from the beginning of fiscal 2016 and thereafter. The effect of this change on the consolidated statement of income is immaterial.(ii) Application of practical solution on unification of
accounting policies applied to foreign subsidiaries for consolidated financial statements
The Company has applied the “Practical Solution on Unification of Accounting Policies Applied to Foreign Subsidiaries for Consolidated Financial Statements” (Practical Issues Task Force (“PITF”) No. 18, March 26, 2015) from fiscal 2016. In accordance with the transitional treatment provided in PITF No. 18, the overseas subsidiary “BRIDGESTONE HOSE AMERICA INC.” prospectively amortized the goodwill for which it has selected amortization treatment based on Financial Accounting Standards Board (“FASB”) Accounting Standards Codification, Topic 350, “IntangibleGoodwill and Other” using the remaining amortization period of goodwill on the consolidated financial statements. There was no impact on the consolidated statement of income from such accounting change.
(28) New accounting pronouncements
Implementation guidance on recoverability of deferred tax assetsOn March 28, 2016, the ASBJ issued ASBJ Implementation Guidance No. 26, “Guidance on recoverability of deferred tax assets.” With regards to the treatment of the recoverability of deferred tax assets, a necessary review was conducted on the
following treatments following the provisions of the Japanese Institute of Certified Public Accountants (the “JICPA”) Auditing Standards Committee Report No. 66 “Audit Treatment for Determining the Recoverability of Deferred Tax Assets,” whereby companies are categorized into five categories and deferred tax assets are calculated based on each of these categories.(i) Treatment of companies that do not fulfill any of the
requirements for classification from Category 1 to Category 5
(ii) Requirements for classification as Category 2 and Category 3
(iii) Treatment of temporary differences in future temporary differences that cannot be scheduled for companies applicable to Category 2
(iv) Treatment concerning the reasonable estimable period of temporary differences in future preadjusted taxable income for companies applicable to Category 3
(v) Treatment in cases where a company fulfilling the requirements of Category 4 is also applicable to Category 2 or Category 3
The above implementation “Guidance for recoverability of deferred tax assets” is effective for the beginning of annual periods beginning on or after April 1, 2016. Earlier application is permitted for the annual periods ended March 31, 2016. The Company expects to apply the implementation guidance from the beginning of the annual period beginning on January 1, 2017, and is in the process of measuring the effects of applying the implementation guidance in future applicable periods.
LeasesOn January 13, 2016, the ISAB issued IFRS16 “Leases” and on February 25, FASB issued ASU201602 “Leases” requiring recognition of substantially all lease assets and lease liabilities on the balance sheet. Certain overseas subsidiaries which apply U.S. GAAP or IFRS expect to apply this accounting standard from the beginning of the annual period beginning on January 1, 2019, and are in the process of measuring the effects of applying the accounting standard in future applicable periods.
NOTES TO CONSOLIDATED FINANCIAL STATEMENTS

Bridgestone Corporation22
NOTE 4 INVENTORIESInventories at December 31, 2016 and 2015 consist of the following:
2016 2015 2016
Millions of yen Thousands of U.S. dollars
Finished products ¥377,413 ¥370,047 $3,239,875
Work in process 35,470 35,878 304,490
Raw materials and supplies 140,824 149,815 1,208,893
Total ¥553,707 ¥555,740 $4,753,258
Availableforsale securities whose fair values are not readily determinable at December 31, 2016 and 2015, are as follows:
2016 2015 2016
Carrying amount Millions of yen Thousands of U.S. dollars
Available-for-sale:
Equity securities ¥1,487 ¥1,936 $12,765
Proceeds from sales of available–for–sale securities for the years ended December 31, 2016 and 2015, are ¥14,430 million ($123,873 thousand) and ¥17,861 million, respectively. Gross realized gains on these sales for the years ended December 31, 2016 and 2015, computed on the moving average cost basis, are ¥11,118 million ($95,442 thousand) and ¥15,481 million, respectively.
The information of availableforsale securities which were sold during the year ended December 31, 2016, is as follows:
Proceeds Realized gains Realized losses Proceeds Realized gains Realized losses
2016
Millions of yen Thousands of U.S. dollars
Securities Classified as:
Available-for-sale:
Equity securities ¥14,430 ¥11,118 ¥2 $123,873 $95,442 $17
NOTE 5 MARKETABLE AND INVESTMENT SECURITIESInformation regarding each category of availableforsale securities at December 31, 2016 and 2015, is as follows:
Cost Unrealized
gainsUnrealized
losses Fair value Cost Unrealized
gains Unrealized
losses Fair value
2016 2015
Millions of yen
Securities Classified as:
Available-for-sale:
Equity securities ¥33,098 ¥214,787 ¥— ¥247,885 ¥35,942 ¥244,148 ¥ (1) ¥280,089
Thousands of U.S. dollars
Securities Classified as:
Available-for-sale:
Equity securities $284,127 $1,843,824 $— $2,127,951
In addition to the above, the Companies have availableforsale securities classified as marketable securities under U.S. GAAP of ¥157,697 million ($1,353,739 thousand) and ¥151,063 million, respectively, for the years ended December 31, 2016 and 2015.
NOTES TO CONSOLIDATED FINANCIAL STATEMENTS

ANNUAL REPORT 2016 Financial Review 23
NOTES TO CONSOLIDATED FINANCIAL STATEMENTS
Notes and accounts receivable and property, plant and equipment were pledged as collateral for certain bank loans. The aggregate carrying amount of the assets pledged as collateral for short–term bank loans of ¥38 million ($326 thousand) and long–term bank loans of ¥75 million ($644 thousand) at December 31, 2016, is ¥843 million ($7,237 thousand). General agreements with respective banks provide, as is customary in Japan, that additional collateral must be provided under certain circumstances if requested by such banks and that certain banks have the right to offset cash deposited with them against any long–term or short–term debt or obligation that becomes due and, in case of default and certain other specified events, against all other debt payable to the banks. The Company has never been requested to provide any additional collateral.
Effective January 2017, Bridgestone Americas, Inc. (“BSAM”) and its major subsidiaries in the U.S. entered into separate fifteenth amended and restated revolving credit agreement with a syndicate of banks providing an aggregate borrowing commitment of $1,100 million. The revolving credit agreement consists of two tranches, each of which has an aggregate borrowing commitment of $550 million, and expire in January 2018 and January 2019, respectively. These agreement contains certain customary affirmative and negative covenants, the most restrictive of which includes (i) the maintenance by BSAM and its major subsidiaries of their consolidated tangible net worth and (ii) restrictions on entering into additional debt arrangements and (iii) restrictions related to the sale of assets. The above agreement replaced the separate fourteenth amended and restated revolving credit agreement, whose expiration dates are January 2017 and January 2018. As of December 31, 2016, BSAM’s outstanding balance under the fourteenth amended and restated revolving credit agreement was $0.
NOTE 6 SHORT-TERM AND LONG-TERM DEBTShortterm debt at December 31, 2016 and 2015, consists of the following:
2016 2015 2016
Millions of yen Thousands of U.S. dollars
Shortterm bank loans, weighted average interest rate of 4.0% at December 31, 2016, and 3.1% at December 31, 2015 ¥55,086 ¥63,918 $472,882
Total ¥55,086 ¥63,918 $472,882
Longterm debt at December 31, 2016 and 2015, consists of the following:
2016 2015 2016
Millions of yen Thousands of U.S. dollars
Borrowings from banks, insurance companies and others, weighted average interest rate of 1.9% at December 31, 2016, and 2.0% at December 31, 2015, denominated mainly in Japanese yen, U.S. dollars and Euros:
Secured ¥ 75 ¥ 83 $ 644
Unsecured 189,976 250,183 1,630,835
0.2% yen unsecured straight bonds, due 2016 — 30,000 —
0.3% yen unsecured straight bonds, due 2018 20,000 20,000 171,6890.2% yen unsecured straight bonds, due 2019 70,000 70,000 600,910Obligations under finance leases 7,633 7,393 65,525
Total 287,684 377,659 2,469,603
Less current portion (120,610) (93,128) (1,035,368)
Long-term Debt, Less Current Portion ¥ 167,074 ¥284,531 $ 1,434,235
Annual maturities of longterm debt at December 31, 2016, are as follows:
Year ending December 31, Millions of yen Thousands of U.S. dollars
2017 ¥120,610 $1,035,368
2018 66,584 571,586
2019 95,324 818,302
2020 3,390 29,101
2021 530 4,550
2022 and thereafter 1,246 10,696
Total ¥287,684 $2,469,603

Bridgestone Corporation24
NOTE 7 RETIREMENT AND PENSION PLANSEmployees serving with the Company and its domestic subsidiaries are generally entitled to a lumpsum payment at retirement and, in certain cases, annuity payments at retirement, provided by funded defined benefit pension plans based on the rate of pay at the time of termination, years of service and certain other factors. There are defined contribution pension plans available for the employees as well provided by the Company and certain of its domestic subsidiaries.
Employees serving with certain of the Company’s overseas subsidiaries are entitled to either (1) funded defined benefit pension plans, corporate pension plans, lumpsum payment plans and others, or (2) defined contribution pension plans. There are escalated payment plans for voluntary retirement at certain specific ages prior to the mandatory retirement age.
(1) The changes in defined benefit obligation for the years ended December 31, 2016 and 2015, are as follows:
2016 2015 2016
Millions of yen Thousands of U.S. dollars
Balance at beginning of year (as previously reported) ¥767,653 ¥793,416 $6,589,862
Cumulative effect of accounting change — 28,697 —
Balance at beginning of year (as restated) 767,653 822,113 6,589,862
Service cost 18,588 21,260 159,567
Interest cost 18,994 24,599 163,053
Actuarial (gains) losses 39,122 (39,885) 335,840
Benefits paid (41,991) (46,262) (360,469)
Effect of foreign exchange translation (18,580) (5,869) (159,499)
Others (669) (8,303) (5,742)
Balance at end of year ¥783,117 ¥767,653 $6,722,612
Service cost includes net periodic benefit costs of certain subsidiaries that have adopted a simplified method.
(2) The changes in plan assets for the years ended December 31, 2016 and 2015, are as follows:
2016 2015 2016
Millions of yen Thousands of U.S. dollars
Balance at beginning of year ¥587,419 ¥583,242 $5,042,656
Expected return on plan assets 28,905 31,614 248,133
Actuarial (losses) gains (258) (33,389) (2,215)
Contributions from the employer 63,135 46,957 541,978
Benefits paid (36,719) (40,103) (315,212)
Effect of foreign exchange translation (9,977) (2,989) (85,647)
Others 113 2,087 971
Balance at end of year ¥632,618 ¥587,419 $5,430,664
NOTES TO CONSOLIDATED FINANCIAL STATEMENTS
ANNUAL REPORT 2016 Financial Review 25
NOTES TO CONSOLIDATED FINANCIAL STATEMENTS
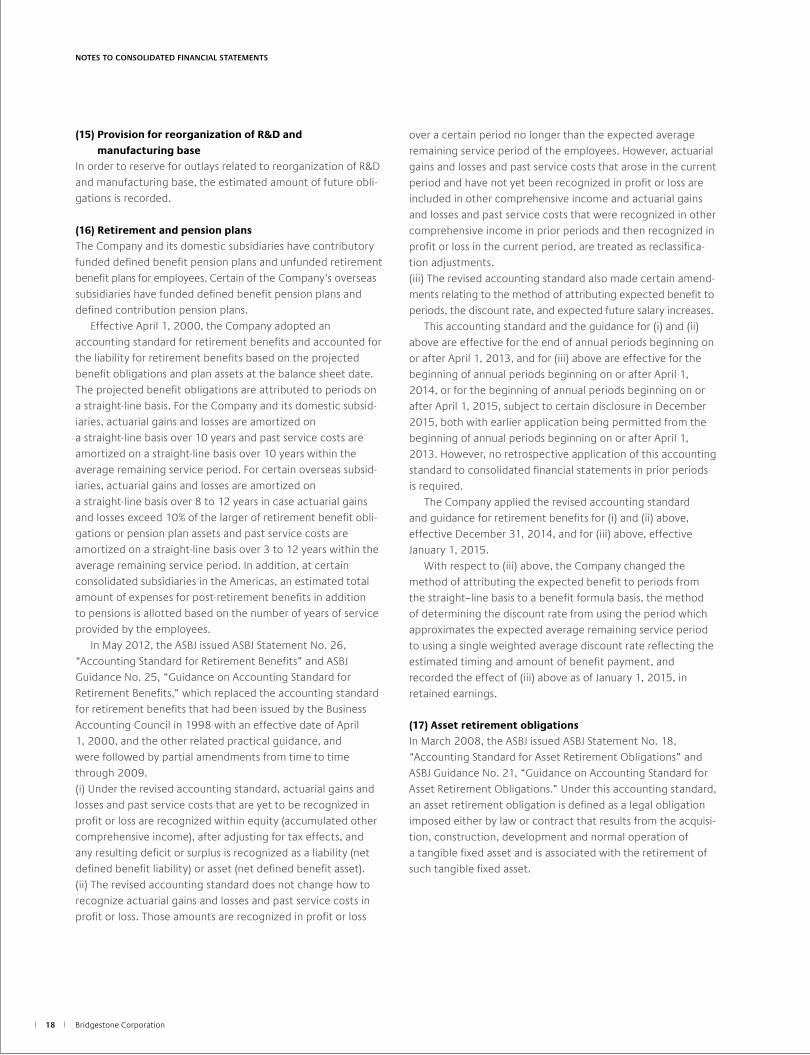
(3) Reconciliation between the liability recorded in the consolidated balance sheet and the balances of defined benefit obligation and plan assets
2016 2015 2016
Millions of yen Thousands of U.S. dollars
Funded defined benefit obligation ¥ 697,761 ¥ 685,496 $ 5,989,879
Plan assets (632,618) (587,419) (5,430,664)
65,143 98,077 559,215
Unfunded defined benefit obligation 85,356 82,157 732,733
Net liability arising from defined benefit obligation 150,499 180,234 1,291,948
Net defined benefit liability 146,368 178,409 1,256,486
Net defined benefit asset (2,039) — (17,504)
Others 6,170 1,825 52,966
Net liability arising from defined benefit obligation ¥ 150,499 ¥ 180,234 $ 1,291,948
In addition to liability for retirement benefits noted above, a liability for postretirement benefits of ¥68,075 million ($584,384 thousand) and ¥81,112 million ($672,515 thousand) is included in the consolidated balance sheet at December 31, 2016 and 2015, respectively.
(4) The components of net periodic benefit costs for the years ended December 31, 2016 and 2015, are as follows:
2016 2015 2016
Millions of yen Thousands of U.S. dollars
Service cost ¥ 18,588 ¥ 21,260 $ 159,567
Interest cost 18,994 24,599 163,053
Expected return on plan assets (28,905) (31,614) (248,133)
Amortization of prior service cost 17,282 588 148,356
Recognized actuarial (gains) losses 539 21,448 4,627
Net periodic benefit costs ¥ 26,498 ¥ 36,281 $ 227,470
Service cost includes net periodic benefit costs of certain subsidiaries that have adopted a simplified method.
(5) Amounts recognized in other comprehensive income (before income tax effect) in respect of defined retirement benefit plans as of December 31, 2016 and 2015
2016 2015 2016
Millions of yen Thousands of U.S. dollars
Prior service cost ¥ 1,157 ¥ 998 $ 9,932
Actuarial (gains) losses (12,512) 37,729 (107,408)
Others 1 412 8
Total ¥(11,354) ¥39,139 $ (97,468)
In addition to accumulated other comprehensive income on defined retirement benefit plans noted above, accumulated other comprehensive income for postretirement benefits of a credit of ¥9,125 million ($78,333 thousand) and a credit of ¥10,852 million ($89,976 thousand) at certain overseas subsidiaries in the Americas is included in the consolidated statement of comprehensive income at December 31, 2016 and 2015, respectively.
Bridgestone Corporation26
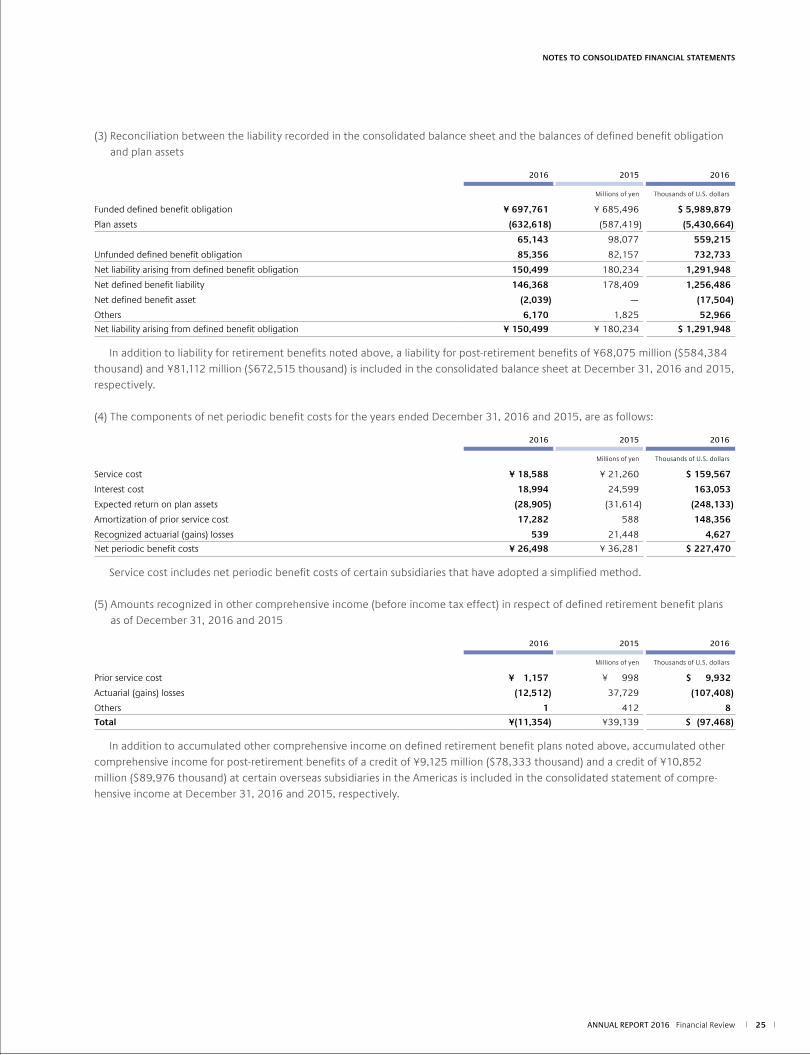
(6) Amounts recognized in accumulated other comprehensive income (before income tax effect) in respect of defined retirement benefit plans as of December 31, 2016 and 2015
2016 2015 2016
Millions of yen Thousands of U.S. dollars
Unrecognized prior service cost ¥ (1,735) ¥ (2,893) $ (14,894)
Unrecognized actuarial (gains) losses (212,335) (199,822) (1,822,774)
Others (1) (2) (9)
Total ¥(214,071) ¥(202,717) $(1,837,677)
In addition to accumulated other comprehensive income on defined retirement benefit plans noted above, accumulated other comprehensive income for postretirement benefits of a credit of ¥5,711 million ($49,026 thousand) and a debit of ¥3,414 million ($28,306 thousand) at certain overseas subsidiaries in the Americas is included in the consolidated balance sheet at December 31, 2016 and 2015, respectively.
(7) Plan assetsa. Components of plan assets
Plan assets consisted of the following:
2016 2015
%
Debt investments 50% 52%
Equity investments 23 26
Cash and cash equivalents 3 2
Alternative investments 10 12
Others 14 8
Total 100% 100%
b. Method of determining the expected rate of return on plan assets
The expected rate of return on plan assets is determined considering the longterm rates of return which are expected currently and in the future from the various components of the plan assets.
(8) Assumptions used for the years ended December 31, 2016 and 2015, are set forth as follows:
2016 2015
%
The Company and domestic subsidiaries
Discount rate 0.7% to 0.9% 1.0% to 1.4%
Expected long–term rate of return on plan assets 2.5% 2.5%
Overseas subsidiaries
Discount rate 3.5% to 4.1% 3.6% to 4.4%
Expected long–term rate of return on plan assets 5.0% to 6.5% 1.0% to 6.8%
(9) Defined contribution pension plans
The Company and certain of its domestic and overseas subsidiaries paid costs for defined contribution pension plans of ¥9,318 million ($79,990 thousand) and ¥9,002 million ($74,637 thousand), respectively, for the years ended December 31, 2016 and 2015.
NOTES TO CONSOLIDATED FINANCIAL STATEMENTS

ANNUAL REPORT 2016 Financial Review 27
NOTES TO CONSOLIDATED FINANCIAL STATEMENTS
NOTE 8 EQUITYSignificant provisions in the Companies Act of Japan (the “Act”) that affect financial and accounting matters are summarized below:(i) Dividends:The Act allows Japanese companies to pay dividends at any time during the fiscal year in addition to the year–end dividend upon resolution at the shareholders’ meeting. Additionally, for Japanese companies that meet certain criteria including having a Board of Directors, having independent auditors, having an Audit & Supervisory Board, and the term of service of the directors being prescribed as one year rather than the normal two–year term by its articles of incorporation, the Board of Directors may declare dividends (except for dividends in kind) if the company has prescribed so in its articles of incorporation. The Board of Directors of companies with board committees (including appointment committee, compensation committee and audit committee) can also do so because such companies with board committees already, by nature, meet the above criteria under the Act, even though such companies have an audit committee instead of an Audit & Supervisory Board. The Company is organized as a company with board committees. The Act permits Japanese companies to distribute dividends in kind (noncash assets) to shareholders subject to certain limitations and additional requirements. Semiannual interim dividends may also be paid once a year upon resolution by the Board of Directors if the articles of incorporation of the company so stipulate. The Act continues to provide certain limitations on the amounts available for dividends or the purchase of treasury stock. The limitation is defined as the amount available for distribution to the shareholders, but the amount of equity after dividends must be maintained at no less than ¥3 million.
(ii) Increases/decreases and transfer of common stock, reserve and surplus:
The Act requires that an amount equal to 10% of dividends must be appropriated as a legal reserve (of retained earnings) or as additional paidin capital (of capital surplus) depending on the equity account charged upon the payment of such dividends until the aggregate amount of legal reserve and additional paidin capital equals 25% of the common stock. Under the Act, the total amount of additional paidin capital and legal reserve may be reversed without limitation. The Act also provides that common stock, legal reserve, additional paidin capital, other capital surplus and retained earnings can be transferred among the accounts within equity under certain conditions upon resolution of the shareholders.(iii) Treasury stock and treasury stock acquisition rights:The Act also provides for Japanese companies to repurchase/dispose of treasury stock by resolution of the Board of Directors. The amount of treasury stock purchased cannot exceed the amount available for distribution to the shareholders which is determined by a specific formula. Under the Act, stock acquisition rights are presented as a separate component of equity. The Act also provides that companies can purchase both treasury stock acquisition rights and treasury stock. Such treasury stock acquisition rights are presented as a separate component of equity or deducted directly from stock acquisition rights.
Bridgestone Corporation28
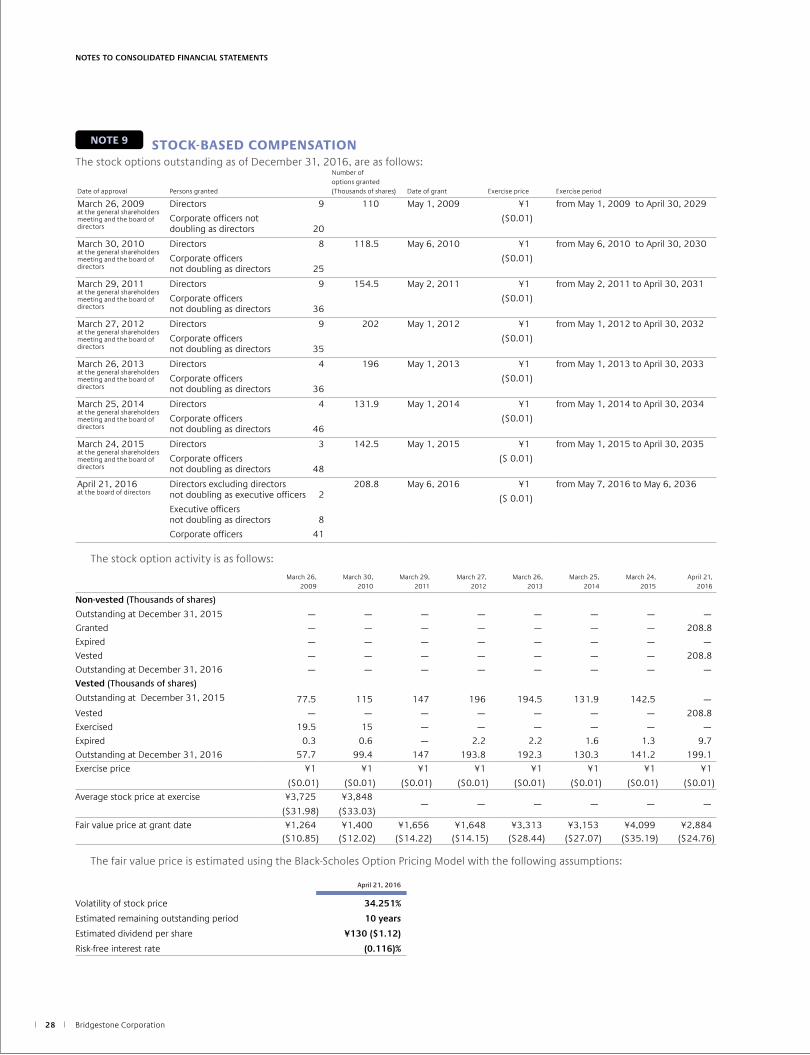
NOTE 9 STOCK-BASED COMPENSATIONThe stock options outstanding as of December 31, 2016, are as follows:
Date of approval Persons granted
Number of options granted (Thousands of shares) Date of grant Exercise price Exercise period
March 26, 2009at the general shareholders meeting and the board of directors
Directors 9
Corporate officers not doubling as directors 20
110 May 1, 2009 ¥1
($0.01)
from May 1, 2009 to April 30, 2029
March 30, 2010at the general shareholders meeting and the board of directors
Directors 8
Corporate officers not doubling as directors 25
118.5 May 6, 2010 ¥1
($0.01)
from May 6, 2010 to April 30, 2030
March 29, 2011at the general shareholders meeting and the board of directors
Directors 9
Corporate officers not doubling as directors 36
154.5 May 2, 2011 ¥1
($0.01)
from May 2, 2011 to April 30, 2031
March 27, 2012at the general shareholders meeting and the board of directors
Directors 9
Corporate officers not doubling as directors 35
202 May 1, 2012 ¥1
($0.01)
from May 1, 2012 to April 30, 2032
March 26, 2013at the general shareholders meeting and the board of directors
Directors 4
Corporate officers not doubling as directors 36
196 May 1, 2013 ¥1
($0.01)
from May 1, 2013 to April 30, 2033
March 25, 2014at the general shareholders meeting and the board of directors
Directors 4
Corporate officers not doubling as directors 46
131.9 May 1, 2014 ¥1
($0.01)
from May 1, 2014 to April 30, 2034
March 24, 2015at the general shareholders meeting and the board of directors
Directors 3
Corporate officers not doubling as directors 48
142.5 May 1, 2015 ¥1
($ 0.01)
from May 1, 2015 to April 30, 2035
April 21, 2016at the board of directors
Directors excluding directors not doubling as executive officers 2
Executive officers not doubling as directors 8
Corporate officers 41
208.8 May 6, 2016 ¥1
($ 0.01)
from May 7, 2016 to May 6, 2036
The stock option activity is as follows:
March 26, 2009
March 30, 2010
March 29, 2011
March 27, 2012
March 26, 2013
March 25, 2014
March 24, 2015
April 21, 2016
Non-vested (Thousands of shares)
Outstanding at December 31, 2015 — — — — — — — —
Granted — — — — — — — 208.8
Expired — — — — — — — —
Vested — — — — — — — 208.8
Outstanding at December 31, 2016 — — — — — — — —
Vested (Thousands of shares)
Outstanding at December 31, 2015 77.5 115 147 196 194.5 131.9 142.5 —
Vested — — — — — — — 208.8
Exercised 19.5 15 — — — — — —
Expired 0.3 0.6 — 2.2 2.2 1.6 1.3 9.7
Outstanding at December 31, 2016 57.7 99.4 147 193.8 192.3 130.3 141.2 199.1
Exercise price ¥1
($0.01)
¥1
($0.01)
¥1
($0.01)
¥1
($0.01)
¥1
($0.01)
¥1
($0.01)
¥1
($0.01)
¥1
($0.01)
Average stock price at exercise ¥3,725
($31.98)
¥3,848
($33.03)— — — — — —
Fair value price at grant date ¥1,264($10.85)
¥1,400($12.02)
¥1,656($14.22)
¥1,648($14.15)
¥3,313($28.44)
¥3,153($27.07)
¥4,099($35.19)
¥2,884($24.76)
The fair value price is estimated using the BlackScholes Option Pricing Model with the following assumptions:
April 21, 2016
Volatility of stock price 34.251%
Estimated remaining outstanding period 10 years
Estimated dividend per share ¥130 ($1.12)
Riskfree interest rate (0.116)%
NOTES TO CONSOLIDATED FINANCIAL STATEMENTS

ANNUAL REPORT 2016 Financial Review 29
NOTES TO CONSOLIDATED FINANCIAL STATEMENTS
NOTE 10 NET INCOME PER SHAREReconciliation of the differences between basic and diluted net income per share (“EPS”) for the years ended December 31, 2016 and 2015, is as follows:
Profit attributable to owners of the parent Weightedaverage shares EPS
For the year ended December 31, 2016
Millions of yen Thousands of shares Yen U.S. dollars
Basic EPS
Net income available to common shareholders ¥265,551 783,241 ¥339.04 $2.91Effect of dilutive securities
Stock options 1,197Diluted EPS
Net income for computation ¥265,551 784,438 ¥338.52 $2.91
Profit attributable to owners of the parent Weightedaverage shares EPS
For the year ended December 31, 2015
Millions of yen Thousands of shares Yen
Basic EPS
Net income available to common shareholders¥284,294 783,205 ¥362.99
Effect of dilutive securities
Stock options1,022
Diluted EPS
Net income for computation¥284,294 784,227 ¥362.52

Bridgestone Corporation30
NOTES TO CONSOLIDATED FINANCIAL STATEMENTS
NOTE 11 RESEARCH AND DEVELOPMENT COSTSResearch and development costs are charged to income as incurred. Research and development costs are ¥95,403 million ($818,980 thousand) and ¥94,978 million for the years ended December 31, 2016 and 2015, respectively.
NOTE 12 OTHER INCOME (EXPENSES)Gain on sales of property, plant and equipment
Gain on sales of property, plant and equipment for the years ended December 31, 2015 mainly consisted of gain on sales of land.
Impairment loss
The Companies group their assets for business in accordance with the classification used for internal management. Assets to be disposed (assets that the Companies plan to dispose of through scrapping or sale) and idle assets are grouped on an individual basis.
In the current period, for assets for business whose profitability has declined, assets to be disposed through planned scrapping or sale, and idle assets that are not expected to be used in the future, the carrying amounts were reduced to their recoverable amounts. As a result, the Companies recognized an impairment loss of ¥6,830 million. The loss consists of ¥4,539 million for buildings and structures, ¥2,116 million for machinery, equipment and vehicles, and ¥175 million for others. Note that ¥2,416 million of the total impairment loss of ¥6,830 million was included in “Loss related to reorganization of R&D and manufacturing base.”
The recoverable amounts of assets for business are principally measured by value in use, which is calculated by discounting future cash flows at a discount rate of 3.7% to 15.0%. The recoverable amounts of assets to be disposed and idle assets are measured at the net selling price. Assets to be scrapped are evaluated at memorandum value, and assets to be sold and idle assets are evaluated at the estimated selling price and other.
Loss related to reorganization of R&D and
manufacturing base
In order to reorganize the research and development, and manufacturing base in Kodaira city in Tokyo, relevant expenses are recognized in relation to relocation and aggregation of the
production of radial tires for passenger cars and small trucks in the Tokyo plant to other domestic plants and the expansion of the research and development facilities.
Loss on deconsolidation of subsidiaries
During the year ended December 31, 2015, under US GAAP, BSAM has recorded related expenses based on the deconsolidation of Venezuelan subsidiaries, Bridgestone Firestone Venezolana, C.A. (“BFVZ”) and its subsidiary from its consolidated financial statements because an otherthantemporary lack of exchangeability between the Bolivar and the U.S. dollar is restricting the subsidiaries’ ability to purchase raw materials and pay dividends on a sustainable basis.
Use Classification Location AmountMillions of yen
Assets for business Buildings and structures, Machinery, equipment and vehicles, and others Indonesia, Japan and others ¥2,941Assets to be disposed Buildings and structures, Machinery, equipment and vehicles, and others Japan, China and others 3,853Idle assets Land Japan 36

ANNUAL REPORT 2016 Financial Review 31
NOTE 13 INCOME TAXESThe Company and its domestic subsidiaries are subject to Japanese national and local income taxes which, in the aggregate, resulted in normal effective statutory tax rates of approximately 32.9% and 35.5% for each of the years ended December 31, 2016 and 2015, respectively.
The tax effects of significant temporary differences and tax loss carryforwards which resulted in deferred tax assets and liabilities at December 31, 2016 and 2015, are as follows:
2016 2015 2016
Millions of yen Thousands of U.S. dollars
Deferred Tax Assets:
Net defined benefit liability ¥ 62,357 ¥ 87,482 $ 535,299
Accrued expenses 37,424 38,888 321,264
Unrealized intercompany profits 23,355 27,979 200,489
Net operating loss carryforwards for tax purposes 38,593 46,902 331,299
Other 53,749 57,932 461,405
Less valuation allowance (30,994) (36,643) (266,066)
Total 184,484 222,540 1,583,690
Deferred Tax Liabilities:
Reserve for deferred gain related fixed assets for tax purposes (11,819) (12,458) (101,459)
Unrealized gain on availableforsale securities (40,608) (51,857) (348,597)
Depreciation (40,365) (40,559) (346,510)
Other (37,272) (39,666) (319,959)
Total (130,064) (144,540) (1,116,525)
Net deferred tax assets ¥ 54,420 ¥ 78,000 $ 467,165
A reconciliation between the normal effective statutory tax rates and the actual effective tax rates reflected in the accompanying consolidated statement of income for the year ended December 31, 2016, with the corresponding figures for 2015, is as follows:
2016 2015
%
Normal effective statutory tax rate 32.9% 35.5%
Expenses not deductible for income tax purposes and income not taxable—net (3.9) (1.6)
Lower income tax rates applicable to income in certain consolidated subsidiaries (0.1) (1.7)
Tax credit for research and development costs of domestic companies (1.4) (1.3)
Change in valuation allowance for deferred tax assets (0.1) 0.4
Tax adjustment of overseas companies 2.7 2.8
Other—net 4.6 4.1
Actual Effective Tax Rate 34.7% 38.2%
NOTES TO CONSOLIDATED FINANCIAL STATEMENTS
Bridgestone Corporation32
NOTES TO CONSOLIDATED FINANCIAL STATEMENTS
Note 14 FINANCIAL INSTRUMENTS1. Qualitative information on financial instruments
(1) Policies for using financial instrumentsThe Companies raise the necessary funds mainly by bank borrowings or issuance of bonds based on funding requirements of their business activities. The Companies invest temporary cash surpluses only in highly secure financial instruments. The Companies follow the policy of using derivative financial instruments not for speculative purposes, but for managing financial risks as described later.(2) Details of financial instruments used and the
exposures to riskReceivables, such as notes and accounts receivable, are exposed to customer credit risk. Receivables in foreign currencies are exposed to foreign currency exchange fluctuation risk. Marketable securities consist primarily of the reservation of receivables liquidation that are exposed to customer credit risk or certificates of deposit regarded as marketable securities in accordance with U.S. GAAP. Investments in securities consist primarily of equity securities of business partners and are exposed to market price fluctuation risk. Payment terms of payables, such as notes and accounts payable are approximately less than one year. Payables in foreign currencies are exposed to foreign currency exchange fluctuation risk. Borrowings, bonds and obligations under finance leases are mainly for the purpose of obtaining working capital and preparing for capital expenditures. Some of the borrowings and bonds with floating interest rates are exposed to interest rate fluctuation risk. Derivative transactions consist of the use of foreign currency forward contracts and currency option contracts for the purpose of hedging foreign currency exchange fluctuation risk on receivables, payables and forecasted transactions in foreign currencies; currency swap contracts for the purpose of hedging foreign currency exchange fluctuation risk and interest rate fluctuation risk on loans and borrowings in foreign currencies; interest rate swap contracts for the purpose of hedging interest rate fluctuation risk on borrowings; and commodity swap contracts for the purpose of hedging commodity price fluctuation risk. Hedging instruments and hedged items, hedge policy, assessment method for hedge effectiveness and others related to hedge accounting are described in Note 3. (22) “Derivative and hedging activities” and Note 15 “Derivatives.”
(3) Risk management of financial instrumentsa. Management of credit risk The Companies regularly monitor the financial position of
significant customers and manage the due dates and the receivables balance of each customer to minimize the risk of default resulting from deterioration of customers’ financial position.
The Companies enter into derivative transactions only with highly rated financial institutions in order to minimize counterparty risk.
The maximum credit risk on December 31, 2016, is represented by the book value of the financial instruments exposed to credit risk on the consolidated balance sheet.
b. Management of market risk The Company and certain of its subsidiaries principally use
foreign currency forward contracts to hedge foreign currency exchange fluctuation risk identified by currency and on a monthly basis for receivables and payables in foreign currencies. Also, when receivables and payables in foreign currencies are expected from a forecasted transaction, foreign currency forward contracts and currency option contracts may be used. In addition, currency swap contracts are used to hedge foreign currency exchange fluctuation risk and interest rate fluctuation risk on loans and borrowings in foreign currencies; interest rate swap contracts are used to hedge interest rate fluctuation risk on borrowings; and commodity swap contracts are used to hedge commodity price fluctuation risk.
With respect to marketable and investment securities, the Company regularly monitors fair market values and financial positions of the issuers, with whom it has business relations, and appropriately reviews the status of these securities considering the relationships with the issuers.
Derivative transactions are carried out under internal regulations by the responsible divisions, and details of transactions are reported to the responsible corporate officers.
c. Management of liquidity risk in financing activities The Companies practice money management effectively by
recognizing the fund position beforehand based on cash flow projection. The Companies also strive to diversify sources of financing in order to reduce liquidity risk.
New tax reform laws enacted in 2016 in Japan changed the normal effective statutory tax rate for the fiscal year beginning on or after April 1, 2016, from approximately 32.1% to 30.8% for temporary differences expected to be realized during the years ended December 31, 2017 and 2018, and 30.5% thereafter. The effect of these changes was to decrease deferred tax liabilities, net of deferred tax assets, by ¥118 million ($1,013
thousand) and remeasurements of defined benefit plans by ¥259 million ($2,223 thousand), and increase net unrealized gain on availableforsale securities by ¥2,116 million ($18,165 thousand) and deferred gain (loss) on derivative instruments by ¥55 million ($472 thousand) in the consolidated balance sheet as of December 31, 2016, and to increase income taxes–deferred in the consolidated statement of income for the year then ended by ¥1,794 million ($15,401 thousand).

ANNUAL REPORT 2016 Financial Review 33
NOTES TO CONSOLIDATED FINANCIAL STATEMENTS
(4) Supplementary explanation on fair value of financial instrumentsFair values of financial instruments include market prices and values calculated reasonably when there is no market price. As variable factors are incorporated in calculating the relevant fair values, such values may change depending on the different assumptions. The contract amounts described in Note 15 “Derivatives” do not indicate the amounts of market risk related to derivative transactions.
2. Fair values of financial instruments
Carrying amount, fair value and unrealized gain (loss) of the financial instruments as of December 31, 2016 and 2015, are as follows:Financial instruments whose fair values are not readily determinable are excluded from the following table.
Carrying amount
Fair value
Unrealized gain (loss)
Carrying amount
Fair value
Unrealized gain (loss)
2016
Millions of yen Thousands of U.S. dollars
(1) Cash and cash equivalents ¥ 471,742 ¥ 471,742 ¥ — $ 4,049,635 $ 4,049,635 $ —
(2) Notes and accounts receivable 455,219 3,907,795
Allowance for doubtful accounts*1 (16,180) (138,896)
439,039 439,039 — 3,768,899 3,768,899 —
(3) Marketable and investment securities 405,582 405,582 — 3,481,689 3,481,689 —
Total ¥1,316,363 ¥1,316,363 ¥ — $11,300,223 $11,300,223 $ —
(1) Shortterm debt ¥ 55,086 ¥ 55,086 ¥ — $ 472,882 $ 472,882 $ —
(2) Current portion of longterm debt 120,610 120,610 — 1,035,368 1,035,368 —
(3) Notes and accounts payable 363,176 363,176 — 3,117,658 3,117,658 —
(4) Longterm debt 167,074 167,874 (800) 1,434,235 1,441,103 (6,868)
Total ¥ 705,946 ¥ 706,746 ¥(800) $ 6,060,143 $ 6,067,011 $(6,868)
Derivative transactions*2 ¥ (5,313) ¥ (5,313) ¥ — $ (45,609) $ (45,609) $ —
Carrying amount
Fair value
Unrealized gain (loss)
2015
Millions of yen
(1) Cash and cash equivalents ¥ 426,727 ¥ 426,727 ¥ —
(2) Notes and accounts receivable 488,833
Allowance for doubtful accounts*1 (33,357)
455,476 455,476 —
(3) Marketable and investment securities 431,152 431,152 —
Total ¥1,313,355 ¥1,313,355 ¥ —
(1) Shortterm debt ¥ 63,918 ¥ 63,918 ¥ —
(2) Current portion of longterm debt 93,128 93,144 (16)
(3) Notes and accounts payable 345,606 345,606 —
(4) Longterm debt 284,531 287,271 (2,740)
Total ¥ 787,183 ¥ 789,939 ¥(2,756)
Derivative transactions*2 ¥ 1,412 ¥ 1,412 ¥ —
*1 This comprises the allowance for doubtful accounts with respect to notes and accounts receivable, shortterm loan receivable and others.*2 Receivables and payables arising from derivative transactions are presented net. If the net amount is a liability, it is written in parentheses ( ).*3 Prior to January 1, 2016, “Income taxes payable” was presented separately. Since during this fiscal year ended December 31, 2016, the materiality of the amount decreased,
such amount was not presented separately. Presentation of fair values of financial instruments for the previous fiscal year have been changed accordingly. The amount of “Income taxes payable” in the previous fiscal year was ¥50,524 million.

Bridgestone Corporation34
NOTES TO CONSOLIDATED FINANCIAL STATEMENTS
Notes
1. Calculation methods of fair values of financial instruments, investments in securities,
and derivative transactions are as follows:
Assets
(1) Cash and cash equivalents, and (2) Notes and accounts receivable
The fair values approximate book values because of their shortterm maturities.
(3) Marketable and investment securities
The fair values of the reservation of receivables liquidation are based on values
calculated reasonably, the fair values of equity securities are based on the market
prices at the securities exchanges, and the fair values of bonds are based on the
market prices at the securities exchanges or on the prices disclosed by financial
institutions. Information on availableforsale securities is described in Note 5
“Marketable and investment securities.”
Liabilities
(1) Shortterm debt, and (2) Current portion of longterm debt.
The fair values of bonds with market prices are based on the market prices. The fair
values of others approximate book values because of their shortterm maturities.
(3) Notes and accounts payable
The fair values approximate book values because of their shortterm maturities.
(4) Longterm debt
The fair values of bonds with market prices are based on the market prices.
The fair values of bonds without market prices and longterm bank borrowings are
determined by discounting the aggregated values of the principal and interest
using an assumed interest rate as if identical debt was newly issued.
Derivative transactions
Information of derivative transactions is described in Note 15 “Derivatives.”
2. Financial instruments whose fair values are extremely difficult to calculate
Carrying amount
2016 2015 2016
Millions of yen Thousands of U.S. dollars
Availableforsale securities
Unlisted equity securities ¥1,487 ¥1,936 $12,765
It is extremely difficult to calculate their fair values because there are no market prices.
Therefore, these items are not included in “(3) Marketable and investment securities.”
3. Redemption schedule of monetary assets and investments in securities with contractual maturities
Due 2017 Due 2018 to 2021 Due 2022 to 2026Due 2027 and
thereafter
2016
Millions of yen
Cash and cash equivalents ¥471,742 ¥— ¥— ¥—Notes and accounts receivable 455,219 — — —Marketable and investment securities
Availableforsale securities with contractual maturitiesPublic bonds — — — —Corporate bonds — 2 — —Other 10,000 — — —
Thousands of U.S. dollars
Cash and cash equivalents $4,049,635 $— $— $—Notes and accounts receivable 3,907,795 — — —Marketable and investment securities
Availableforsale securities with contractual maturitiesPublic bonds — — — —Corporate bonds — 17 — —Other 85,844 — — —
4. Please see Note 6 “Shortterm and longterm debt” for annual maturities of longterm debt.

ANNUAL REPORT 2016 Financial Review 35
NOTE 15 DERIVATIVESThe Companies enter into foreign currency forward contracts, currency swap contracts and currency option contracts to hedge foreign currency exchange risk associated with certain assets and liabilities denominated in foreign currencies. The Companies enter into interest rate swap contracts to manage their interest rate exposures on certain liabilities. In addition, the Companies enter into commodity swap contracts to hedge the risk of fluctuation of commodity prices for raw materials. All derivative transactions are entered into to hedge foreign currency, interest and commodity price exposures that arise in the course of the Companies’ business. Accordingly, the market risk in these derivatives is basically offset by opposite
movements in the value of hedged assets or liabilities. Because the counterparties to these derivatives are limited to major international financial institutions, the Companies do not anticipate any losses arising from credit risk. Derivative transactions entered into by the Companies have been made in accordance with internal policies which regulate the authorization and credit limit amounts. The contract or notional amounts of derivatives which are shown in the following table do not represent the amounts exchanged by the parties and do not measure the Companies’ exposure to credit or market risk.
NOTES TO CONSOLIDATED FINANCIAL STATEMENTS
The outstanding balances of derivative contracts which do not qualify for hedge accounting at December 31, 2016 and 2015, are as follows:
Contract amount Fair value Unrealized gain (loss)
2016
Millions of yen
Foreign Currency Forward Contracts:
Sell:
U.S. dollar ¥47,437 ¥(2,578) ¥(2,578)
Euro 15,924 (764) (764)
Australian dollar 9,670 (428) (428)
Russian ruble 7,905 (1,936) (1,936)
Other 17,431 (709) (709)
Buy:
U.S. dollar 36,338 941 941
Japanese yen 8,059 69 69
Mexican peso 5,682 (388) (388)
Other 5,960 (33) (33)
Currency Swap Contracts:
U.S. dollar receipt, Japanese yen payment ¥47,474 ¥ (21) ¥ (21)
Chinese yuan receipt, Japanese yen payment 11,817 1,969 1,969
Russian ruble receipt, Japanese yen payment 11,417 (1,146) (1,146)
Thai baht receipt, Japanese yen payment 10,625 (246) (246)
Euro receipt, Japanese yen payment 10,277 1,677 1,677
Poland zloty receipt, Japanese yen payment 8,973 684 684
Indian rupee receipt, Japanese yen payment 5,744 (262) (262)
Other 8,287 110 110
Commodity Swap Contracts:
Natural rubber ¥ 423 ¥ 235 ¥ 235
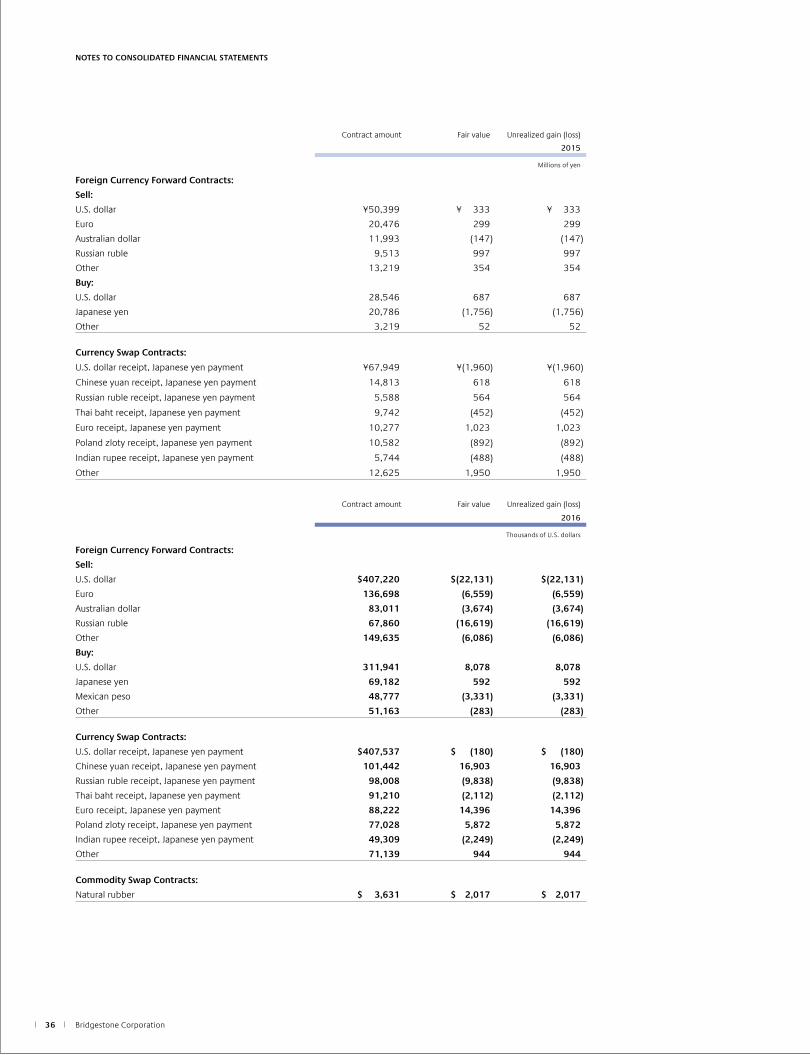
Bridgestone Corporation36
NOTES TO CONSOLIDATED FINANCIAL STATEMENTS
Contract amount Fair value Unrealized gain (loss)
2015
Millions of yen
Foreign Currency Forward Contracts:
Sell:
U.S. dollar ¥50,399 ¥ 333 ¥ 333
Euro 20,476 299 299
Australian dollar 11,993 (147) (147)
Russian ruble 9,513 997 997
Other 13,219 354 354
Buy:
U.S. dollar 28,546 687 687
Japanese yen 20,786 (1,756) (1,756)
Other 3,219 52 52
Currency Swap Contracts:
U.S. dollar receipt, Japanese yen payment ¥67,949 ¥(1,960) ¥(1,960)
Chinese yuan receipt, Japanese yen payment 14,813 618 618
Russian ruble receipt, Japanese yen payment 5,588 564 564
Thai baht receipt, Japanese yen payment 9,742 (452) (452)
Euro receipt, Japanese yen payment 10,277 1,023 1,023
Poland zloty receipt, Japanese yen payment 10,582 (892) (892)
Indian rupee receipt, Japanese yen payment 5,744 (488) (488)
Other 12,625 1,950 1,950
Contract amount Fair value Unrealized gain (loss)
2016
Thousands of U.S. dollars
Foreign Currency Forward Contracts:
Sell:
U.S. dollar $407,220 $(22,131) $(22,131)
Euro 136,698 (6,559) (6,559)
Australian dollar 83,011 (3,674) (3,674)
Russian ruble 67,860 (16,619) (16,619)
Other 149,635 (6,086) (6,086)
Buy:
U.S. dollar 311,941 8,078 8,078
Japanese yen 69,182 592 592
Mexican peso 48,777 (3,331) (3,331)
Other 51,163 (283) (283)
Currency Swap Contracts:
U.S. dollar receipt, Japanese yen payment $407,537 $ (180) $ (180)
Chinese yuan receipt, Japanese yen payment 101,442 16,903 16,903
Russian ruble receipt, Japanese yen payment 98,008 (9,838) (9,838)
Thai baht receipt, Japanese yen payment 91,210 (2,112) (2,112)
Euro receipt, Japanese yen payment 88,222 14,396 14,396
Poland zloty receipt, Japanese yen payment 77,028 5,872 5,872
Indian rupee receipt, Japanese yen payment 49,309 (2,249) (2,249)
Other 71,139 944 944
Commodity Swap Contracts:
Natural rubber $ 3,631 $ 2,017 $ 2,017
ANNUAL REPORT 2016 Financial Review 37
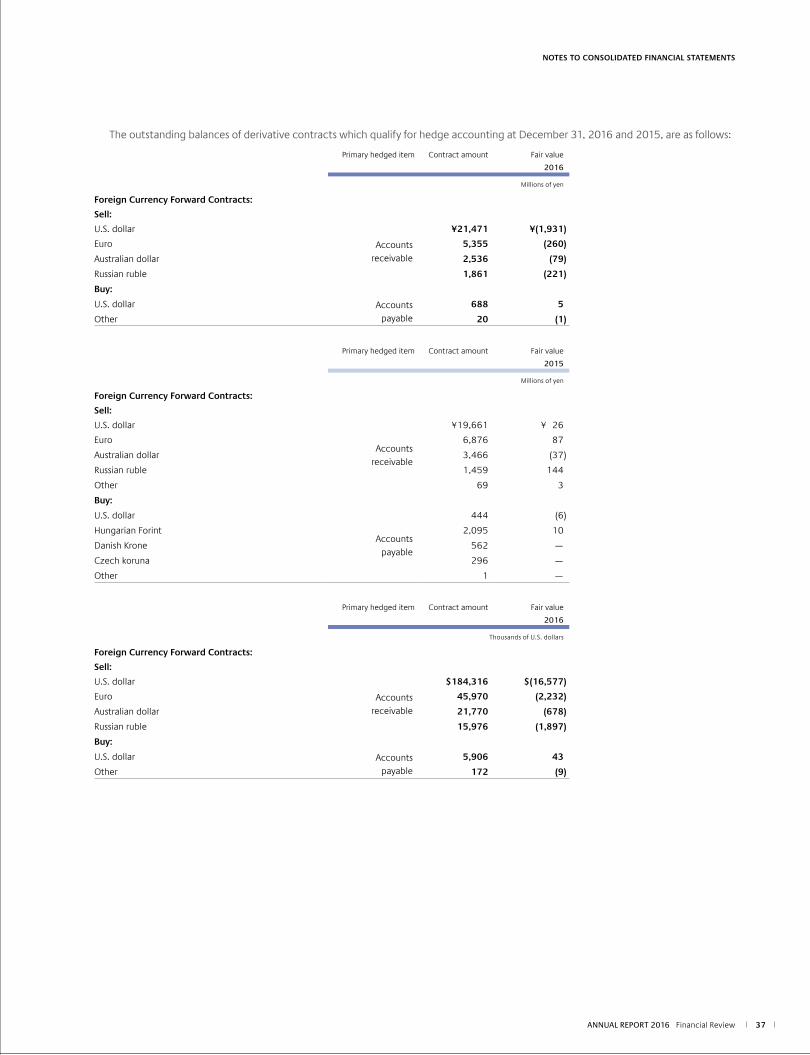
The outstanding balances of derivative contracts which qualify for hedge accounting at December 31, 2016 and 2015, are as follows:
Primary hedged item Contract amount Fair value
2016
Millions of yen
Foreign Currency Forward Contracts:
Sell:
U.S. dollar
Accountsreceivable
¥21,471 ¥(1,931)
Euro 5,355 (260)
Australian dollar 2,536 (79)
Russian ruble 1,861 (221)
Buy:
U.S. dollar Accountspayable
688 5
Other 20 (1)
Primary hedged item Contract amount Fair value
2015
Millions of yen
Foreign Currency Forward Contracts:
Sell:
U.S. dollar
Accountsreceivable
¥19,661 ¥ 26
Euro 6,876 87
Australian dollar 3,466 (37)
Russian ruble 1,459 144
Other 69 3
Buy:
U.S. dollar
Accountspayable
444 (6)
Hungarian Forint 2,095 10
Danish Krone 562 —
Czech koruna 296 —
Other 1 —
Primary hedged item Contract amount Fair value
2016
Thousands of U.S. dollars
Foreign Currency Forward Contracts:
Sell:
U.S. dollar
Accountsreceivable
$184,316 $(16,577)
Euro 45,970 (2,232)
Australian dollar 21,770 (678)
Russian ruble 15,976 (1,897)
Buy:
U.S. dollar Accountspayable
5,906 43
Other 172 (9)
NOTES TO CONSOLIDATED FINANCIAL STATEMENTS

Bridgestone Corporation38
NOTE 17 SEGMENT INFORMATIONFor the years ended December 31, 2016 and 2015
Under ASBJ Statement No. 17, “Accounting Standard for Segment Information Disclosures” and ASBJ Guidance No. 20, “Guidance on Accounting Standard for Segment Information Disclosures,” an entity is required to report financial and descriptive information about its reportable segments. Reportable segments are operating segments or aggregations of operating segments that meet specified criteria. Operating segments are components of an entity about which separate financial information is available and such information is evaluated regularly by the chief operating decision maker in deciding how to allocate resources and in assessing performance. Generally, segment information is required to be reported on the same basis as is used internally for evaluating operating segment performance and deciding how to allocate resources to operating segments.
1. Description of reportable segments
The Companies’ reportable segments are components of the Companies whose separate financial information is obtainable, and the Board of Directors and the Management Committee regularly consider these segments in order to decide the allocation of business resources and evaluate business performance. The Companies’ reportable segments consist mainly of Tire business that comprises the manufacture and sale of tires and tubes, sale of wheels and accessories, the manufacture and sale of retread material and services, and auto maintenance; and Diversified products business that comprises Chemical and Industrial Products, BSAM Diversified Products*, sporting goods, bicycles, etc. Thus, the Companies have two reporting segments: Tires and Diversified products.* BSAM Diversified Products: A business under BRIDGESTONE AMERICAS, INC.
supplying commercial roofing materials and others.
2. Methods of measurement for the amounts of sales
and income (loss), assets, and other items for each
reportable segment
The accounting policies for each reportable segment are consistent with those outlined in Note 3 “Summary of significant accounting policies.” Reportable segment income figures are on an operating income basis. Internal sales and transfers between segments are mainly based on prices for thirdparty transactions.
NOTE 16 CONTINGENT LIABILITIES AND COMMITMENTS(a) Contingent liabilities
At December 31, 2016, the Companies have the following contingent liabilities:
2016
Millions of yen Thousands of U.S. dollars
Trade notes discounted ¥222 $1,906
Total ¥222 $1,906
(b) Operating lease commitments
The Companies lease certain land, machinery, vehicles, computer equipment, office space and other assets. The minimum lease commitments under noncancelable operating leases at December 31, 2016, are as follows:
2016
Millions of yen Thousands of U.S. dollars
Due within one year ¥ 38,088 $ 326,964
Due after one year 191,176 1,641,136
Total ¥229,264 $1,968,100
NOTES TO CONSOLIDATED FINANCIAL STATEMENTS

ANNUAL REPORT 2016 Financial Review 39
3. Information about sales and income (loss), assets and other items by reportable segment
Tires Diversified products Total Reconciliations* Consolidated
Year ended December 31, 2016
Millions of yen
Net Sales:
External customers ¥2,759,275 ¥577,742 ¥3,337,017 ¥ — ¥3,337,017 Intersegment 6,500 7,969 14,469 (14,469) —Total 2,765,775 585,711 3,351,486 (14,469) 3,337,017 Segment income
(Operating income) ¥ 414,711 ¥ 34,820 ¥ 449,531 ¥ 18 ¥ 449,549 Segment assets ¥3,312,939 ¥409,100 ¥3,722,039 ¥ (1,802) ¥3,720,237 Other
Depreciation and amortization ¥ 168,296 ¥ 19,766 ¥ 188,062 ¥ — ¥ 188,062 Amortization of goodwill 1,153 846 1,999 — 1,999 Investment for equitymethod affiliates 13,873 310 14,183 (5) 14,178
Increase in property, plant and equipment and intangible assets 183,265 16,073 199,338 — 199,338
Tires Diversified products Total Reconciliations* Consolidated
Year ended December 31, 2015
Millions of yen
Net Sales:
External customers ¥3,168,219 ¥622,032 ¥3,790,251 ¥ — ¥3,790,251
Intersegment 6,227 13,017 19,244 (19,244) —
Total 3,174,446 635,049 3,809,495 (19,244) 3,790,251
Segment income
(Operating income) ¥ 472,763 ¥ 44,519 ¥ 517,282 ¥ (34) ¥ 517,248
Segment assets ¥3,345,495 ¥452,275 ¥3,797,770 ¥ (1,923) ¥3,795,847
Other
Depreciation and amortization ¥ 181,783 ¥ 20,551 ¥ 202,334 ¥ — ¥ 202,334
Amortization of goodwill 1,204 943 2,147 — 2,147
Investment for equitymethod affiliates 16,884 224 17,108 (3) 17,105
Increase in property, plant and equipment and intangible assets 229,886 23,695 253,581 — 253,581
Tires Diversified products Total Reconciliations* Consolidated
Year ended December 31, 2016
Thousands of U.S. dollars
Net Sales:
External customers $23,686,797 $4,959,585 $28,646,382 $ — $28,646,382 Intersegment 55,799 68,409 124,208 (124,208) —Total 23,742,596 5,027,994 28,770,590 (124,208) 28,646,382 Segment income
(Operating income) $ 3,560,057 $ 298,909 $ 3,858,966 $ 155 $ 3,859,121 Segment assets $28,439,686 $3,511,889 $31,951,575 $ (15,469) $31,936,106 Other
Depreciation and amortization $ 1,444,725 $ 169,680 $ 1,614,405 $ — $ 1,614,405 Amortization of goodwill 9,898 7,262 17,160 — 17,160 Investment for equitymethod affiliates 119,092 2,661 121,753 (43) 121,710
Increase in property, plant and equipment and intangible assets 1,573,225 137,978 1,711,203 — 1,711,203
* The reconciliations are as follows:1 Reconciliations of segment income refer to elimination of intersegment transactions.2 Reconciliations of segment assets refer to elimination of intersegment receivables and payables.
NOTES TO CONSOLIDATED FINANCIAL STATEMENTS

Bridgestone Corporation40
4. Related information
From the current fiscal year, Europe segment reporting structure was realigned into EMEA, which includes Europe, the Middle East and Africa. This realignment is reflected accordingly in comparison figures.
1. Information about product and servicesInformation has been omitted, as the classification is the same as that for reportable segments.
2. Information about geographical areas(1) Sales
Japan The Americas United States*2 EMEA Other Total
Year ended December 31, 2016
Millions of yen
¥653,529 ¥1,625,724 ¥1,338,040 ¥494,337 ¥563,427 ¥3,337,017
Thousands of U.S. dollars
$5,610,173 $13,955,910 $11,486,308 $4,243,600 $4,836,699 $28,646,382
Japan The Americas United States*2 EMEA Other Total
Year ended December 31, 2015
Millions of yen
¥661,908 ¥1,919,549 ¥1,543,990 ¥559,314 ¥649,480 ¥3,790,251
*1 Sales are classified by country or region based on location of customers.*2 The figure for the United States is included in that of the Americas.
(2) Property, plant and equipment
Japan The Americas United States*1 EMEA Other China*2 Total
Year ended December 31, 2016
Millions of yen
¥335,616 ¥563,625 ¥437,518 ¥149,257 ¥406,171 ¥143,709 ¥1,454,669
Thousands of U.S. dollars
$2,881,071 $4,838,398 $3,755,842 $1,281,286 $3,486,746 $1,233,660 $12,487,501
Japan The Americas United States*1 EMEA Other China*2 Total
Year ended December 31, 2015
Millions of yen
¥340,007 ¥577,518 ¥459,329 ¥157,020 ¥429,346 ¥164,817 ¥1,503,891
*1 The figure for the United States is included in that of the Americas.*2 The figure for China is included in that of Other.
3. Information about major customersThe Companies are not required to disclose information on external customers since there are no sales to a single external customer amounting to 10% or more of the Companies’ net sales.
5. Information about impairment loss of property, plant and equipment
Tires* Diversified products Reconciliations Consolidated
Year ended December 31, 2016
Millions of yen
Impairment Loss of Assets ¥6,001 ¥829 ¥— ¥6,830
Thousands of U.S. dollars
Impairment Loss of Assets $51,515 $7,117 $— $58,632
* Note that ¥2,416 million of impairment loss recognized in Tires was included in Loss related to reorganization of R&D and manufacturing base in the consolidated income statement.
NOTES TO CONSOLIDATED FINANCIAL STATEMENTS

ANNUAL REPORT 2016 Financial Review 41
6. Information about amortization of goodwill and unamortized balance
Tires Diversified products Reconciliations Consolidated
Year ended December 31, 2016
Millions of yen
Amortization ¥1,153 ¥ 846 ¥— ¥ 1,999
Unamortized Balance 7,060 15,876 — 22,936
Thousands of U.S. dollars
Amortization $ 9,898 $ 7,262 $— $ 17,160
Unamortized Balance 60,606 136,286 — 196,892
Tires Diversified products Reconciliations Consolidated
Year ended December 31, 2015
Millions of yen
Amortization ¥1,204 ¥ 943 ¥— ¥ 2,147
Unamortized Balance 2,845 17,377 — 20,222
NOTES TO CONSOLIDATED FINANCIAL STATEMENTS
NOTE 18 SUBSEQUENT EVENTS1. Cash dividend
On March 24, 2017, the shareholders of the Company approved payment of a cash dividend of ¥70.0 ($0.60) per share, or a total of ¥54,828 million ($470,667 thousand), to shareholders of record as of December 31, 2016.
2. Acquisition of Treasury Stock
The Company has resolved to acquire Treasury Stock at the Board of Directors meeting held on February 17, 2017 as per Article 1653 and Article 156 of the Companies Act.
(1) Reason of Acquisition of Treasury Stock To enhance enterprise value by improving capital efficiency (2) Kind of shares to acquire Common shares of the Company (3) Total number of shares to acquire 50 million shares (up to) (% of issued shares (not included Treasury Stock); 6.4%) (4) Total acquisition cost ¥150 billion (up to) (5) Procedure Market purchases based on the discretionary dealing contract regarding repurchase
of shares (6) Timing February 20, 2017 to December 22, 2017 (7) Other 936 thousand common shares of the Company have been acquired by the
acquisition cost of ¥4.2 billion from February 23, 2017 to February 28, 2017 based on the resolution of the Board of Directors meeting.
3. Cancellation of Treasury Stock
The Company has resolved to cancel Treasury Stock at the Board of Directors meeting held on February 17, 2017 as per Article 178 of the Companies Act. (1) Kind of shares to cancel Common shares of the Company (2) Total number of shares to cancel 20 million shares and all the common shares acquired from February 20, 2017 to
December 22, 2017 (3) Effective date of the Cancellation January 19, 2018

Bridgestone Corporation42
NOTE 19 OTHER COMPREHENSIVE INCOMEThe components of other comprehensive income for the years ended December 31, 2016 and 2015, are as follows:
2016 2015 2016
Millions of yen Thousands of U.S. dollars
Net Unrealized Gain (Loss) on Available-for-sale Securities:
Gains (losses) arising during the year ¥(18,253) ¥ 29,290 $(156,692)
Reclassification adjustment to profit or loss (11,105) (15,481) (95,330)
Amount before income tax effect (29,358) 13,809 (252,022)
Income tax effect 11,248 10,329 96,558
Total ¥(18,110) ¥ 24,138 $(155,464)
Deferred Gain (Loss) on Derivative Instruments:
Gains (losses) arising during the year ¥ 645 ¥ 3,212 $ 5,537
Reclassification adjustment to profit or loss (2,410) (986) (20,689)
Reclassification adjustment to acquisition cost of assets — 9 —
Amount before income tax effect (1,765) 2,235 (15,152)
Income tax effect 696 (967) 5,975
Total ¥ (1,069) ¥ 1,268 $ (9,177)
Foreign Currency Translation Adjustments:
Adjustments arising during the year ¥(59,880) ¥(112,568) $(514,036)
Reclassification adjustment to profit or loss 178 14,739 1,528
Total ¥(59,702) ¥ (97,829) $(512,508)
Remeasurements of Defined Benefit Plans:
Gains (losses) arising during the year ¥(18,428) ¥ 28,547 $(158,194)
Reclassification adjustment to profit or loss 16,199 21,446 139,059
Amount before income tax effect (2,229) 49,993 (19,135)
Income tax effect (1,146) (19,622) (9,837)
Total ¥ (3,375) ¥ 30,371 $ (28,972)
Share of Other Comprehensive Income in Affiliates:
Gains (losses) arising during the year ¥ (1,969) ¥ (3,595) $ (16,903)
Reclassification adjustment to profit or loss (100) 843 (858)
Total ¥ (2,069) ¥ (2,752) $ (17,761)
Total Other Comprehensive Income ¥(84,325) ¥ (44,804) $(723,882)
NOTES TO CONSOLIDATED FINANCIAL STATEMENTS
4. Issue of the Bonds
The Company has resolved to issue domestic unsecured straight bonds (the “Bonds”) at the Board of Directors meeting held on February 17, 2017. (1) Total amount of issue Maximum of ¥150 billion, Multiple offerings are possible by dividing this amount (2) Issuance period February 17, 2017 to December 31, 2017 (3) Issue price ¥100 or larger per each principal amount of ¥100 (4) Coupon Up to the sum of prevailing yields of Japanese Government Bonds which have the
corresponding maturities with the Bonds and 1.0% (5) Maturity Up to 10 years (6) Redemption The Bonds will be redeemed in full upon maturity (7) Use of proceeds Capital expenditures, investments, loans and acquisition of treasury stock, etc.
Top Related