


Languages
Pages
Legal


Non-interest Income, Financial Performance &
the Macroeconomy: Evidence on Jamaican Panel Data
Sherene A. Bailey-Tapper1
Financial Stability Department Bank of Jamaica
December 2010 This paper demonstrates the empirical inter-linkages between non-interest income, financial performance and the macroeconomy by applying a SUR model to Jamaican panel data for the period March 1999 to September 2010. The study also investigates the determinants of non-interest income in a context of the increasing reliance by banking institutions on revenue generation from non-interest income activities. ATM technology, personal lending and loan quality are among the main microeconomic factors driving the performance in non-interest income in the commercial banking sector. Regarding the macroeconomic environment, interest rate and foreign exchange rate volatility are the key factors which explain the performance in non-interest income. Against this background, stronger performance in non-interest income not only leads to increased profitability but also increased variability in performance. Additionally, results for large banks show that lower earnings on investments lead to increases in service charges from loans and may reflect more aggressive loans expansion by these increase institutions to increase fee income. Moreover, lower earnings on investments also contribute to increases in ‘Other’ service charges by the larger banks and may reflect the need for greater competition, particularly in the low interest rate environment of the post-Jamaica Debt Exchange (JDX) period. JEL Code: C23, G21, EO2 Keywords: Non-interest income; Financial Performance; Macroeconomy
1 The views expressed are those of the author and do not necessarily reflect those of The Bank of Jamaica.

1
Table of Contents
1.0 Introduction…………………………….……….............................2
2.0 Literature Review: NII & Financial Performance…………………3
3.0 Trends in NII: 1999 - 2010…….……………………….…..……...5
4.0 Empirical Model...………...……...…………………………….…..8
4.1 Methodology…..………………….…………………...…….10
4.2 Data & Estimation Technique………………………………10
5.0 Results ……………………………...….……….…...…....…...…..11
5.1 Commercial Banking Sector...…...……….....…..……..…...12
5.2 Large & Small Banks…....... ….............................................16
6.0 Conclusion & Policy Implications...………..……....…...................19
References…………………………..…………………………............….21
Appendix………………………...…………………….…………………....……….22

2
1.0 Introduction
The increasing importance of non-interest income (NII), particularly in recent years, has
stimulated research on the factors which have underpinned its performance.2 International
evidence has shown that bank characteristics as well as environmental factors such as
deregulation, globalization, investment in technology and developments in the financial
architecture have played a significant part in explaining trends in NII. For example,
within the Caribbean, Craigwell and Maxwell (2005) showed that ATM technology and
bank-specific characteristics in Barbados were the main factors influencing the
performance in non-interest income at these banks over the period 1985 to 2001. More
specifically, these bank-specific features included the composition of the loan portfolio as
well as the degree of personal service offered by the banking institution. The findings for
Barbados also showed that non-interest income was positively related to both bank
profitability and earnings volatility.
Over the past decade, Jamaica’s commercial banks have exhibited an increasing reliance
on income generation from non-core areas of business. At end-March 1999, NII
accounted for approximately 12.1 per cent of commercial banking sector revenue and this
figure has more than doubled increasing to approximately 28.6 per cent of total income at
end-September 2010 (see Table 1A in Appendix). The increasing reliance on non-interest
income by Jamaica’s commercial banks has also been shaped by the increased
prominence of ATM and POS technology. 3 Furthermore, an analysis of the data has
revealed that strong acceleration in the pace of growth in non-interest income coincided
with periods of heightened macroeconomic volatility. The fact that economic conditions
is an important determinant of non-interest income, is supported by the De Young and
Rice (2004) study of U.S. commercial bank data over the period 1989 to 2001.
2 Non-interest income is the part of a bank’s revenue that is not generated by its interest-bearing business. NII can generally be
divided into commission and fee activities and trading activities. 3 The components of non-interest income at Jamaica banks includes service charges, transaction fees and commissions, dividends and
trading profits on securities, foreign exchange gains and losses and other income.

3
Given the increasing role of NII in the performance of Jamaican commercial banks, this
has highlighted some pertinent questions for policymakers. Firstly, what factors drive the
sector’s non-interest income? Is NII associated with improvements or declines in bank
financial performance? And, what is the impact of the performance in investment
earnings on non-interest income for both large and small banks?4 This is particularly
relevant in a context where the JDX, the GOJ’s debt re-profiling programme involving a
par-for-par exchange of domestic bonds for new notes of longer maturities and lower
interest rates, strongly impacted the business model of Jamaica banks.5 In addition,
macroeconomic volatility, which is typically a concern in emerging and developing
economies, has been included in the simultaneous equation model employed to capture
the interrelationship between non-interest income and financial performance in the
Jamaican commercial banking sector.
The main results of the study indicate that ATM technology, loan portfolio composition,
loan quality as well as interest rate and foreign exchange rate volatility are key factors
influencing the performance in non-interest income for Jamaica’s commercial banks.
Additionally, the results for the sample period showed that non-interest income has a
strong impact on financial performance in the sector. Also noteworthy is the fact that
lower earnings on investments is found to lead to increases in both service charges earned
on loans as well as ‘other’ service charges at large commercial banks.
The paper is organized as follows: Section 2 presents the literature review while section 3
provides an overview of the trends in NII over the period 1999 – 2010. Section 4 gives a
brief description of the data and the estimation technique employed. Section 5 presents
the findings of the model, while the policy implications of the results and the conclusion
are outlined in section 6.
4 The JDX was launched on 14 January 2010 and involved investors voluntarily participating by surrendering old bonds and choosing new bonds according to specified rules. The financial settlement date was 24 February 2010 and on this date, new bonds were issued and accrued interest paid. 5 More specifically, banks’ investment profile and net earnings performance were substantially affected by the impact of the JDX on interest rates offered on domestic debt as well as the composition and maturity profile of the domestic debt stock.

4
2.0 Literature Review: NII & Financial Performance
The literature on NII and bank performance is still relatively nascent. Much of the
growing body of literature in this area has focused on determining the relationship
between this revenue source and the performance and variability in bank earnings as well
as the factors underpinning the performance in non-interest income.
Utilizing data for the U.S. commercial banking sector for the period 1989 to 2001, De
Young and Rice (2004) found that relationship banking tends to generate increases in
noninterest income and that some technological advances, for example cashless
transactions, contribute to increased earnings from non-interest income. At the same time,
however, technological advances such as loan securitization contribute to reduced
noninterest income flows at banks.6 Findings also indicate that large banks generate
relatively more noninterest income, while well-managed banks rely less heavily on
earnings from non-intermediation. Furthermore, the results suggest that marginal
increases in noninterest income have been associated with higher profits, more variable
profits and, on net, a worsening of the risk-return tradeoff for the average commercial
bank during our sample period. Overall, the study concluded that intermediation-based
products and services are likely to remain the central business activities at the average
U.S. commercial bank.
Chiorrazzo et al. (2008) conducted a study of the link between non-interest revenues and
profitability using data from a sample of Italian banks for the period 1993 to 2003. There
is evidence that income diversification increases risk-adjusted returns. In addition, the
findings also indicate that there are limits to the diversification gains which can be
achieved as banks get larger. Additionally, results showed that small banks can make
gains from increasing non-interest income, but this is premised on these institutions
having an initially low non-interest income share.
6 Loan securitization is the process of pooling various types of receivables, including mortgage loans and credit card receivables, and using them as collateral to issue securities. This structured finance process enables the originators of various types of loans to reduce their risk and adjust their finances.

5
Evidence based on German banking sector data for the period 1995 to 2007 (Busch,
2009) confirms previous discussed findings that bank returns are positively affected by
higher fee income activities. The findings also show that increases in non-interest income
also positively impact the asset base of banks. Additionally, a strong engagement in fee-
generating activities goes along with higher risk. Additionally, an assessment of the
impact of fee-based services on interest margin showed that institutions with a strong
focus on fee business charges lower interest margins when credit risk is controlled.
Mnasri and Abaoub (2010) provided evidence that banks which diversified across both
interest and non-interest income generating activities have higher levels of raw share
returns than those focusing their activities. However, in contrast to previous findings
discussed, focusing on non-interest income generating activities decreases market
profitability of banks. Furthermore, banks that are functionally diversified also
experience higher levels of systematic risk while the effect on the idiosyncratic
component is non-significant.
3.0 Trends in NII: 1999 - 2010
The Jamaican commercial banking sector has gradually expanded beyond its traditional
role and sources of income to encompass more activities that generate non-interest
income over the sample period. By the close of the third quarter of 2010, aggregate non-
interest income of the commercial banks had increased significantly by approximately
489.0 per cent to J$5.3 billion relative to end-March 1999 while interest income
increased by roughly 110.0 per cent during the same period to total J$13.2 billion at end-
September 2010 (see Figure 1 & Table 1A in Appendix). During this period, the
performance in non-interest income has been underpinned by the increasing prominence
of non-cash means of payment, such as automated Telling machines (ATMs) and point-
of-sale (POS) technology, since its introduction in the sector over two decades ago (see

6
Figure 1).7 Of importance is that an analysis of the data has also revealed that periods of
strong increases in non-interest income have generally coincided with episodes of
substantial macroeconomic volatility. This relationship was particularly evident during
the March 2003 and December 2008 quarters when there was significant instability in the
foreign exchange market (see Figure 2). The performance in non-interest income during
these periods largely reflects increased income from trading profits on securities as well
as foreign exchange gains.
There was a moderate falloff in non-interest income during most of 2009, which may
have reflected the continued weak performance in economic activity during that year (see
Figure 1). Nonetheless, there has been a sustained increase in non-interest income since
the March 2010 quarter.
7 New delivery channels like ATMs provide more choice and convenience for additional fees (see Parris (2002) and Coppin, Craigwell and Moore (2003)). At end-2000, ATM volumes for the commercial banking sector totaled 440,265 and significantly increased to 3,060,187 at end-August 2010.

7
In addition to the rise in aggregate levels of non-interest income in the commercial
banking sector, various measures of the performance in non-interest income suggest that
its relative importance has steadily increase over the sample period. Specifically, non-
interest income as a proportion of operating income increased substantially from 12.1 per
cent at end-March 1999 to 28.6 per cent at the close of the sample period. At the same
time, non-interest income as a share of total assets increased from 0.4 per cent at end-
March 1999 to 0.9 per cent at end-September 2010.
An analysis of the data by bank size revealed that the movement in this ratio is largely
influenced by the performance of the larger commercial banks (see Figures 5 & 6 in
Appendix). Nonetheless, both large and small banks registered a general trend increase
in non-interest income throughout the sample period, but smaller banks experienced a
stronger decline in the non-interest income ratio during 2009. Additionally, while larger
banks generate a greater amount of non-interest per dollar of assets, non-interest accounts
for a smaller proportion of the operating income of these banks. This suggests that larger
institutions may experience greater economies of scale in generating non-interest income.

8
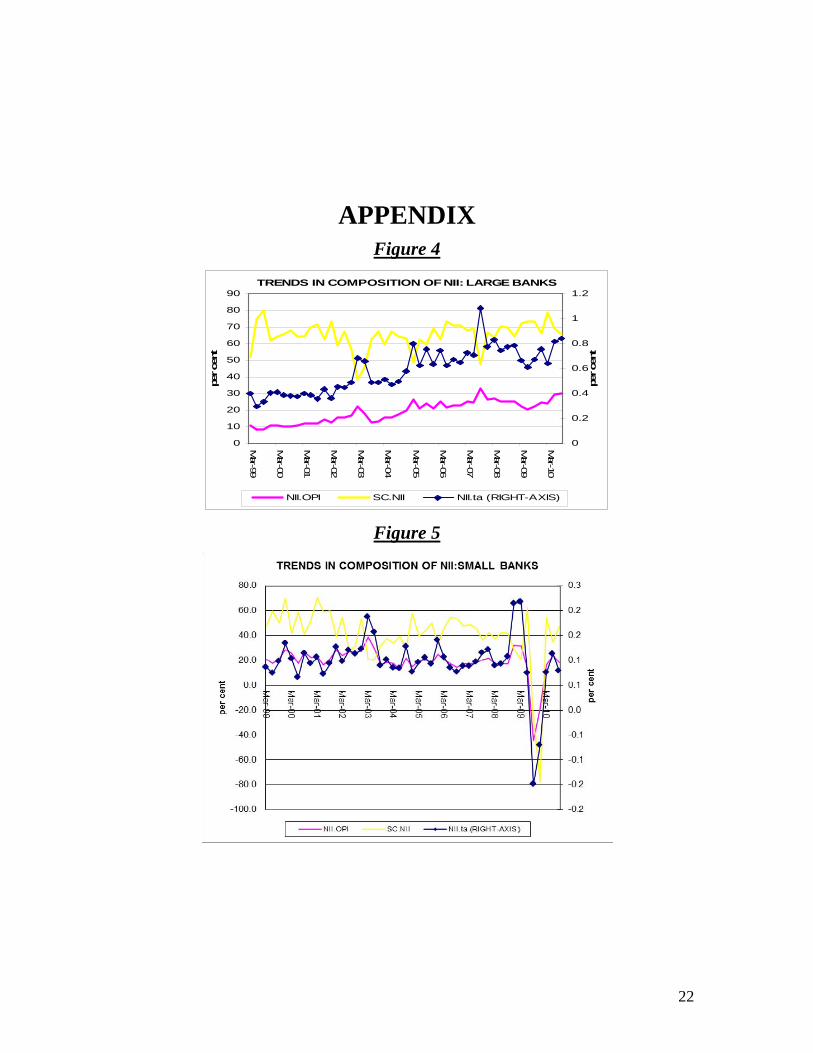
With regard to the composition of non-interest income in the commercial banking
industry, service charges represent the most significant component of non-interest income
for both large and small banks (see Figure 7 in Appendix). More specifically, at end-
September 2010 service charges as share of non-interest income totaled roughly 66.0 per
cent, while for small banks this ratio was approximately 47.2 per cent at the close of this
period (see Figure 4).
4.0 Empirical Model
4.1 Methodology
The framework employed to evaluate the interaction between non-interest income,
financial performance and the economy draws from De Young & Rice (2004) and
Craigwell and Maxwell (2005) and consists of a system of three equations. The first
equation in the model captures the impact of bank characteristics, technological
developments and measures of market conditions on noninterest income performance
(see equation 1). Additionally, measures of market conditions also include key measures
of the macroeconomic environment in an effort to capture the impact of these variables
on non-interest income performance. The second and third equations are included in the
model in order to determine whether and how NII is related to bank financial

9
performance, after accounting for bank characteristics, market conditions and
technological developments.
The dependent variable in equation 1 captures total non-interest income as a share of
assets and is defined as NIITA, where the subscripts i and t index banks and quarters,
respectively.
)1(.12,11,10
,9,8,7,6,5
.4,3,2,10,
ittitit
ititititit
ititititit
TBILLVOLEXRVOLGDPgwth
ATMHHIOINVESTRATIYLOANQUALITPSLSHARE
CLSHARELOANRATIOCORERATIORELROANIIRATIO
In addition, the independent variables in equation 1 include a variable to capture relative
bank performance, which is measured by RELROE. This variable is computed as the
bank’s ROA relative to its peers and is a proxy for the quality of bank management.8 A
priori expectations are that banks with high management quality (as reflected in the
ROA) should be better at generating NII. Core deposits as a share of total assets
(CORERATIO) is included as a proxy for the impact of traditional relationship banking,
given that banks with large deposit shares can generally exercise greater market power in
terms of service charges. In addition, each bank’s lending strategy is represented by the
ratios of loans-to-assets (LOANRATIO), consumer loans to total loans (CLSHARE) and
private sector loans as a share of total loans (PSLSHARE). A number of variables have
been included to capture the development and application of new technologies in the
banking system. Technological development is proxied by a dummy variable (ATM)
which captures banks with ATM technology. Proxies have also been included to capture
the impact of bank loan quality (LOANQUALITY) and performance in investment
earnings (INVESTRATIO) on non-interest income performance.
In an effort to capture the characteristics of the banks’ local environment, a loan
concentration Herfindahl-Hirschman index (HHI) has been included in the analysis. In
8 More specifically, the variable is calculated as the bank’s return on assets minus the average return on assets of the other banks. Based on a priori expectations and previous literature non-interest income should increase bank earnings but its effect on volatility is ambiguous.

10
addition, a number measures have been included as proxies of the macroeconomic
environment, which include the growth in domestic GDP (GDPgwth), exchange rate
volatility (EXRVOL) and the variability in Treasury bill rates (TBILLVOL).9
In order to capture the relationship between non-interest income and financial
performance, dependent variables have been included in equations 2 and 3 to capture
bank profitability and the variability in bank earnings, respectively, while the NIITA ratio
is included as an explanatory variable in both equations. Bank profitability is measured
by return on assets (ROA), while the variability of bank earnings is the standard deviation
of the return on assets (STDEVROA). Specific explanatory variables from the NIITA
equation have also been included as control variables in both equations. More
specifically, the loan quality ratio has been included given the impact of changes in this
variable on profits by due to changes in loan loss provisioning. Also, the LOANRATIO
and CORERATIO variables capture the impact of banks’ intermediation strategies on
earnings performance. The state of the macroeconomic economic environment is
important in determining earnings performance and as such proxies for these variables
have been included in both equations.10
)2(.,9,8,7,6
.5,4,3,21,
ititititit
ititititit
TBILLVOLOINVESTRATIGDPgwthHHI
YLOANQUALITLOANRATIOCORERATIONIIRATIOROA
The dependent variable (in equation 3) is computed as the rolling three-quarter standard
deviation of the ROA.
)3(.,8,7,6.5
,4,3,21,
ititititit
itititit
TBILLVOLGDPgwthOINVESTRATIYLOANQUALIT
LOANRATIOCORERATIONIIRATIOSTDEVROA
9 EXRVOL and TBILLVOL are calculated as the rolling three-quarter standard deviation for exchange rates and Treasury bill rates, respectively. 10 The HHI variable is included in equation 2 to capture the impact of the structure of the loan portfolio on earnings performance.

11
4.2 Data & Estimation Technique
The model outlined in equations 1-3 was estimated as a system employing the seemingly
unrelated regression (SUR) estimation method. These equations were estimated for the
commercial banking sector in order to determine the relationship between non-interest
income and financial performance and the macroeocnomy over the period March 1999 to
September 2010. The data used in this study is a balanced panel of quarterly
macroeconomic and balance sheet data.
A SUR system comprises several individual relationships that are linked by the fact that
their disturbances are correlated. SUR models are usually used to gain efficiency in
estimation by combining information on different equations and to impose and/or test
restrictions that involve parameters of different equations. The traditional SUR model
with M equations can be written as:
iiit xy Mi ,......,2,1
where iy is the T-dimensional vector of observations on a dependent variable, ix is
the (TxKi) matrix of observations on iK non-stochastic explanatory variables, possibly
including a constant term, i is a iK dimensional vector of unknown coefficients that is
to be estimated and ie is a T-dimensional unobserved random vector.
The M equations can be expressed as:

12
where Y is of dimension (TMx1), X is of dimension (TMxK), with
m
iiKK
1, the vector
is (Kx1) and e is given by ),0( TINe .Therefore, the errors in each
equation are homoskedastic and there is contemporaneous correlation between the errors
in the different equations. The variance of the i-th equation is denoted by ii , the i-th
diagonal element of . The covariance between two corresponding error in different
equations (say i and j), we write as ij which appear as off-diagonal elements of .
Table 1 - SUR RESULTS (COMMERCIAL BANK SECTOR)Dependent Variable: NIIRATIO Coefficient Std. Error t-Statistic Prob.RELROA 0.8593 0.0138 62.1134 0.0000
GDPGWTH 0.0001 0.0001 0.4184 0.6758
CORERATIO -0.0236 0.0011 -22.4240 0.0000
LOANRATIO -0.0078 0.0012 -6.3191 0.0000
CLSHARE 0.0039 0.0011 3.5418 0.0004
PSLSHARE -0.0002 0.0007 -0.3037 0.7614
HHI 0.0167 0.0073 2.3034 0.0215
ATM 0.0233 0.0009 24.8139 0.0000
INVESTRATIO 0.0325 0.0062 5.2097 0.0000
EXRVOL 0.0009 0.0002 4.1223 0.0000
LOANQUALITY 0.1414 0.0088 16.0966 0.0000
TBILLVOL 0.0005 0.0001 4.7596 0.0000
Dependent Variable: ROA Coefficient Std. Error t-Statistic Prob.NIIRATIO 0.7289 0.0151 48.3004 0.0000
GDPGWTH -0.0004 0.0002 -1.8624 0.0629
LOANRATIO 0.0056 0.0013 4.1889 0.0000
HHI -0.0249 0.0101 -2.4733 0.0136
CORERATIO 0.0062 0.0009 7.0113 0.0000
LOANQUALITY -0.2504 0.0165 -15.1933 0.0000
INVESTRATIO -0.0131 0.0068 -1.9337 0.0534
TBILLVOL -0.0004 0.0001 -3.5905 0.0003
Dependent Variable: STDEVROA Coefficient Std. Error t-Statistic Prob.NIIRATIO 0.1179 0.0130 9.0843 0.0000
CORERATIO 0.0039 0.0004 9.0558 0.0000
LOANRATIO -0.0024 0.0007 -3.6641 0.0003
GDPGWTH 0.0000 0.0001 0.2706 0.7867
LOANQUALITY 0.0131 0.0103 1.2707 0.2042
INVESTRATIO 0.0139 0.0038 3.6722 0.0003
TBILLVOL 0.0000 0.0001 0.3319 0.7400
Determinant residual covariance 2.70E-108

13
5.0 RESULTS: COMMERCIAL BANKING SECTOR
Results of the system of equations estimated for the commercial banking sector are
generally consistent with a prior expectations (see Table 1). The equation capturing the
determinants of non-interest income, show that the majority of the coefficients are
significant (see equation 1).
The coefficient on the technology variable (ATM) is positive and significant suggesting
that banks with ATMs are likely to generate stronger levels of NII. The relative
performance indicator, (RELROA), is also positively related to the non-interest income
variable and results indicate that the relative performance of banks is important in
explaining non-interest income performance in Jamaica. The coefficient on the relative
performance indicator is positive and significant. In particular, well managed banks
generate higher amounts of non-interest income per dollar of assets. This is in contrast to
evidence from North America which suggests that the coefficient on this variable should
be negative given the generally volatile nature of non-interest income as well-managed
banks are unlikely to use non-interest income revenues to justify the added risk.
With respect to the riskiness of the loan portfolio, the insignificance of the parameter on
HHI suggests that concentration risk is not important in influencing non-interest income
generation in the sector. The results also show that loan quality is positively related to
non-interest income. This is expected as generally the more risky the banking sector’s
portfolio, the greater the non-interest income, as this goes towards compensating banks’
shareholders for risk.11 Indicators capturing the banks’ lending strategy are all significant.
More specifically, the parameter on the loans to asset ratio is negative, indicating that
banks which rely more heavily on an intermediation based strategy (whereby banks rely
on interest income) are likely to generate lower levels of non-interest income.
Furthermore, the findings show mixed results regarding the impact of respective loan
categories on earnings from non-interest income. Higher levels of consumer loans as a
share of the loan portfolio provide greater opportunities for fee income while higher 11 See Craigwell & Maxwell (2005)

14
commercial and industrial loan share is associated with lower levels of non-interest
income. In addition, the performance in investment earnings is positively related to non-
interest income generation.12
Contrary to a priori expectations, there is a negative relationship between the traditional
relationship banking indicator (CORERATIO) and non-interest income variable. This
finding for overall banks suggest that these institutions have not taken advantage of close
relationships with their depositors in order to generate higher fee earnings in a context
where customers’ demand is inelastic due to switching costs.
Regarding indicators capturing the influence of the banks’ macroeconomic environment,
GDP growth does not seem to be important in explaining non-interest income in Jamaica.
At the same time, exchange rate and interest rate volatility is positively related to non-
interest income, reflecting increased earnings in respect of foreign exchange gains and
trading profits on securities, respectively.
The equations for bank profitability and variability of bank earnings contain NIITA as
well as most of the other explanatory variables from the NIITA equation acting as
controls. Regarding the bank profitability equation, the findings show there is a strong
positive and significant relationship between the ROA and the non-interest income
variable. Additionally, increases in the non-interest income ratio also generate increased
variability in the ROA.
12 This relationship is further explored in order to gain implications based on bank size.

15
Table 2 - SUR RESULTS (LARGE BANKS)Dependent Variable: NIIRATIO Coefficient Std. Error t-Statistic Prob.RELROA 0.1501 0.0324 4.6335 0.0000
GDPGWTH 0.0000 0.0001 0.0700 0.9442
CORERATIO -0.0066 0.0023 -2.8786 0.0042
LOANRATIO 0.0031 0.0014 2.2568 0.0246
CLSHARE 0.0081 0.0020 3.9690 0.0001
PSLSHARE -0.0003 0.0020 -0.1271 0.8989
HHI 0.0164 0.0062 2.6595 0.0082
ATM 0.0090 0.0023 3.8933 0.0001
INVESTRATIO -0.0641 0.0129 -4.9600 0.0000
EXRVOL 0.0002 0.0002 1.0878 0.2774
LOANQUALITY 0.0690 0.0216 3.1981 0.0015
TBILLVOL 0.0001 0.0001 1.8058 0.0717
Dependent Variable: ROA Coefficient Std. Error t-Statistic Prob.NIIRATIO 0.3457 0.1290 2.6807 0.0077
GDPGWTH -0.0003 0.0003 -1.1087 0.2683
LOANASSET:RATIO 0.0022 0.0033 0.6738 0.5008
HHI -0.0112 0.0156 -0.7178 0.4733
COREDEPOSIT: RATIO 0.0174 0.0023 7.7113 0.0000
PROVAST -0.4219 0.0754 -5.5986 0.0000
INVEST:RATIO -0.0467 0.0222 -2.0993 0.0364
TBILL 0.0000 0.0002 -0.0235 0.9812
Dependent Variable: STDEVROA Coefficient Std. Error t-Statistic Prob.NIIRATIO 0.11767 0.061696 1.907236 0.0572
CORERATIO 0.003842 0.001164 3.300307 0.0011
LOANRATIO -0.007181 0.00152 -4.725515 0
GDPGWTH -6.68E-05 9.37E-05 -0.713266 0.4761
LOANQUALITY -0.017449 0.018701 -0.933028 0.3514
INVESTRATIO 0.067432 0.01132 5.956651 0
TBILLVOL -4.21E-05 6.19E-05 -0.680152 0.4968
Determinant residual covariance 5.57E-48

16
Table 3 - SUR RESULTS (SMALL BANKS)Dependent Variable: NIIRATIO Coefficient Std. Error t-Statistic Prob.RELROA 0.9918 0.0307 32.3475 0.0000
GDPGWTH 0.0001 0.0004 0.1584 0.8742
CORERATIO -0.0163 0.0021 -7.8846 0.0000
LOANRATIO -0.0116 0.0025 -4.6772 0.0000
CLSHARE 0.0037 0.0027 1.3767 0.1692
PSLSHARE -0.0027 0.0024 -1.1153 0.2652
HHI 0.0116 0.0196 0.5903 0.5553
ATM 0.0226 0.0024 9.3699 0.0000
INVESTRATIO 0.0260 0.0100 2.5938 0.0098
EXRVOL 0.0011 0.0005 2.1161 0.0348
LOANQUALITY 0.2100 0.0456 4.6011 0.0000
TBILLVOL 0.0010 0.0003 3.4389 0.0006
Dependent Variable: ROA Coefficient Std. Error t-Statistic Prob.NIIRATIO 0.7649 0.0231 33.0485 0.0000
GDPGWTH -0.0005 0.0004 -1.2252 0.2210
LOANASSET:RATIO 0.0070 0.0022 3.1446 0.0018
HHI -0.0193 0.0193 -1.0012 0.3172
COREDEPOSIT: RATIO 0.0028 0.0013 2.1272 0.0339
PROVAST -0.2340 0.0425 -5.5076 0.0000
INVEST:RATIO -0.0043 0.0094 -0.4643 0.6426
TBILL -0.0010 0.0002 -4.0619 0.0001
Dependent Variable: STDEVROA Coefficient Std. Error t-Statistic Prob.NIIRATIO 0.1286 0.0158 8.1628 0.0000
CORERATIO 0.0037 0.0008 4.5388 0.0000
LOANRATIO 0.0008 0.0014 0.5979 0.5501
GDPGWTH 0.0002 0.0002 1.0529 0.2929
LOANQUALITY -0.0123 0.0269 -0.4560 0.6486
INVESTRATIO -0.0007 0.0052 -0.1244 0.9011
TBILLVOL -0.0001 0.0001 -1.0037 0.3160
Determinant residual covariance 4.47E-59
5.1 RESULTS: LARGE & SMALL BANKS The system of equations was also estimated for large and small banks in order to
ascertain the determinants of non-interest income based on bank size (see Tables 2 & 3).
As such, much of the discussion will be largely focused on the findings based on equation
1 as well as the sign and magnitude of the parameters capturing the relationship between
the non-interest income variable and financial performance.

17
Results show a positive and significant relationship between financial performance (as
measured by the ROA) and non-interest income for larger banks, indicating that increases
in NII contributes to strong improvements in financial performance. Nonetheless, there is
an insignificant relationship between NII and the variability in the ROA indicating that
the performance in NII is not influential in explaining the variability in bank earnings.
For large banks, indicators capturing the relative performance of banks (RELROA), GDP
growth, exchange rate volatility and provisions as a share of assets are not important in
explaining the performance in NII of these institutions. Nonetheless, the variability in
GOJ Treasury bill rates was found to be positively related to the performance in non-
interest income.
However, there is a significant and inverse relationship between deposits as a share of
asset ratio and the non-interest income ratio, suggesting that larger banks have not been
able use established customer relationships to generate stronger non-interest income
earnings. Additionally, for these banks, increased intermediation is associated with
increased stronger performance in non-interest income, as evidenced by the positive
relationship between the loans to asset ratio and the NII ratio. Moreover specifically,
increases in personal loans as a share of total loans also contribute to increases in the non-
interest income ratio.
Of importance is that there is a significant and inverse relationship between the proxy for
investments earnings (INVESTRATIO) and NII. However, of concern is that this may
point to uncompetitive practices by these institutions to increase fee income in order to
compensate for declines in earnings on investments. In order to further investigate this
relationship, the system of equations was re-estimated after re-defining NII using the two
components of service charges. As such, the dependent variables included in the
estimation are service charges on loans as a share of assets and other service charges as a
proportion of assets.

18
Against this background, results showed that for larger banks, there is a significant
inverse relationship between the service charge on loans ratio (SCLOANS) and the
INVESTRATIO variable. This may reflect more aggressive loan expansion by these
increase institutions to increase fee income in the context of lower earnings from
securities which may have resulted from a fall in interest rates (see Table 4 in Appendix).
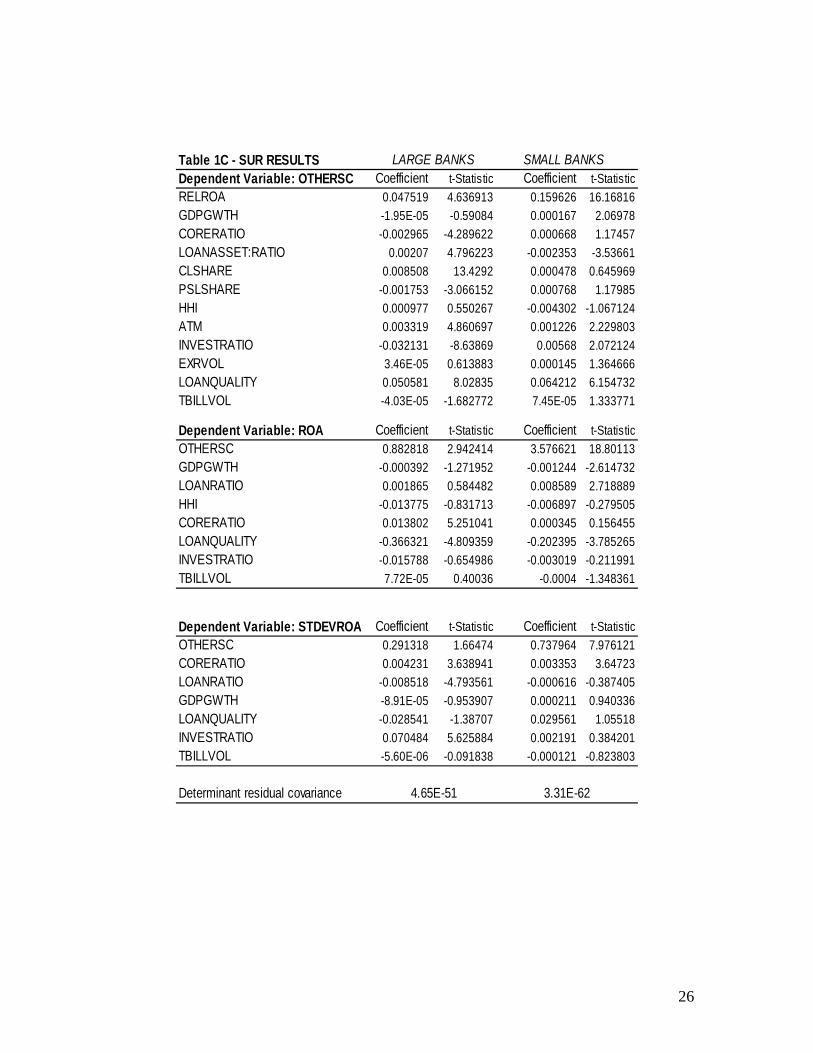
Nonetheless, declines in the INVESTRATIO variable are also associated with increases
in the other service charge ratio (OTHERSC) (see Table 5 in Appendix). This suggests
that there is need for greater competition in this area as it relates to the larger banks. Of
importance is that for the smaller banks increases in the INVESTRATIO variable
contribute to increases in other service charges. The increase in other service charges may
be due to higher credit card receivables in the context of higher earnings from securities
and possibly a higher interest rate environment.
Results for small banks show that non-interest income is important in explaining both
ROA and its variability. More specifically, increases in NII contribute to increases in
both variables. Similar to findings for the larger commercial banks, GDP growth and
concentration risk (HHI) are not important in explaining the performance in non-interest
income. Nonetheless, there is a significant inverse relationship between the core deposit
ratio and NII. However, the parameters capturing exchange rate volatility and interest rate
volatility are positive and significant indicating that both variables are more important in
explaining the performance in non-interest income for smaller commercial banks.
Furthermore, deepened intermediation does not seem to affect the performance in non-
interest income, based on the insignificance of the loan to assets ratio. In addition,
deterioration in loan quality is associated with increases in non-interest income, which
compensates for the added risk associated with the loan portfolio.
6.0 Conclusion & Policy Implications
The main purpose of the study was to investigate the interrelationship between non-
interest income, financial performance and the macroeconomic environment using
19
Jamaican panel data for the period March 1999 to December 2010. This is accomplished
through the estimation of a system of equations based on commercial bank financial
statements as well as key measures of the state of the macroeconomic environment. The
study is intended to provide regulators and policymakers with evidence on the
microeconomic and macroeconomic factors which drive the performance in non-interest
income for Jamaica. Among the microeconomic factors included is a proxy for revenue
generation from alternative income streams in order to understand the role that this
variable plays in non-interest income generation and what this implies about competition
in the sector. Additionally, evidence from the study is useful for policymakers in order to
gauge the dynamics of non-interest income in relation to the financial performance of the
commercial banking sector.
Based on the results of the study, regarding the microeconomic factors, there is evidence
for the commercial banks that the proliferation in ATMs, deterioration in loan quality,
and increases in relative bank efficiency, consumer loans and the investment ratio
contribute to increases in non-interest income. While there is an inverse relationship
between core deposits as a share of total deposits and the loan to assets ratio and the non-
interest income ratio. At the same time, increases in non-interest income generate growth
in both the ROA and its variability, indicating that the increased profitability is also
associated with increased riskiness. As a consequence, continued increases in non-interest
income generation should be associated with continued close monitoring of risk
indicators. Additionally, findings for the sector show that macroeconomic factors, in
particular, exchange rate volatility and interest rate volatility contribute to increases in
non-interest income.
Unlike the case for small banks, findings for large banks show that increased
concentration risk (as measures by the HHI) is compensated by increases in non-interest
income. For large banks, declines in earnings on investments are associated with
increases in non-interest income. Moreover, further investigation has shown that declines
in this ratio are associated with increases in fee income in respect of loans, which may
reflect the impact of repositioning of the asset portfolio by these institutions in terms of
20
greater loan expansion. The results for these institutions also suggest that there is need for
greater competition in respect of ‘other services’, given the inverse relationship between
the INVRATIO variable and the other service charge ratio.
For small banks, there is a positive relationship between the INVRATIO and other
service charge ratio, and this may reflect higher earnings in respects of credit cards in the
context of a higher interest rate environment. In addition, consumer loans are not
important in explaining in the performance in non-interest income for small banks.
Moreover, regarding macroeconomic factors, the results show that interest rate volatility
is only relevant in explaining the performance in non-interest income of small banks.

21
References
Craigwell, R., and Maxwell, C., (1986). “Non-Interest Income and Financial Performance at Commercial Banks in the Caribbean”, Central Bank of Barbados Working Paper.
DeYoung, R., and Rice, T., (2004). “Non-Interest Income and Financial Performance at U.S. Commercial Banks”, The Financial Review, vol 39, pp. 101-127.
Smith, R., Staikouras, C. and Wood, G, “Non-Interest Income and Total Income Stability,” Banco de Espana, Working Paper No. 198.
Chiorrazo, V., Milani, C., Salvini, F, (2008). “Income Diversification and Bank Performance: Evidence from Italian Banks”, Journal of Financial Services Research, vol 33, pp. 181-203.
De Young, R., and Roland, K. (2001). “Product Mix and Earnings Volatility at Commerical Banks: Evidence from a Degree of Total Leverage Model”, Journal of Financial Intermediation, vol. 10, pp. 54-84.
Busch, R., and Kick, T., (2009). “Income Diversification in the German Banking Industry”, Deutsche Bundesbank Discussion Paper Series 2: Banking and Financial Studies.
Mnasri, K., Abaoub, E., (2010). “Diversification, Bank Risk Taking and Performance: Evidence from Tunisian Banks”, International Journal of Monetary Economics and Finance, Vol. 3, pp. 13-32.
Demirguc, A., Huizinga, H.P., (2009). “Bank Activity and Funding Strategies: The Impact on Risk and Return”, Centre for Economic Research.
Lepetit, L., Nys, E., Rous, P., Tarazi, A., (2008). “Bank Income Structure and Risk: An Empirical Analysis of European Banks”, Journal of Banking and Finance.
22
APPENDIX Figure 4
TRENDS IN COMPOSITION OF NII: LARGE BANKS
0
10
20
30
40
50
60
70
80
90
Mar-99
Mar-00
Mar-01
Mar-02
Mar-03
Mar-04
Mar-05
Mar-06
Mar-07
Mar-08
Mar-09
Mar-10
per cent
0
0.2
0.4
0.6
0.8
1
1.2
per cent
NII.OPI SC.NII NII.ta (RIGHT-AXIS)
Figure 5

23
Figure 6

24
(as % of operating income (OPI) & in J$bns)
(J$bns) % OPI (J$bns) %OPIMar-99 0.9 12.1 6.3 87.7Jun-99 0.7 9.0 6.7 91.0Sep-99 0.8 10.1 7.2 89.9Dec-99 1.0 12.8 6.9 87.7Mar-00 1.0 12.5 7.3 87.5Jun-00 0.9 10.9 7.5 89.1Sep-00 1.0 12.0 7.6 88.0Dec-00 1.0 12.0 7.4 87.4Mar-01 1.1 12.9 7.5 87.1Jun-01 1.0 12.5 6.9 87.5Sep-01 1.1 13.4 6.8 86.6Dec-01 1.3 16.3 6.8 83.7Mar-02 1.1 14.0 7.1 86.0Jun-02 1.4 16.8 7.1 83.2Sep-02 1.4 16.7 7.1 83.3Dec-02 1.6 18.1 7.2 81.9Mar-03 2.5 24.4 7.7 75.6Jun-03 2.4 19.5 10.0 80.5Sep-03 1.8 13.1 11.7 86.9Dec-03 1.8 14.1 11.2 85.9Mar-04 2.0 15.9 10.5 84.1Jun-04 1.8 15.1 10.3 84.9Sep-04 2.2 18.5 9.5 81.5Dec-04 2.3 19.4 9.6 80.6Mar-05 3.1 25.3 9.2 74.7Jun-05 2.6 21.0 9.6 79.0Sep-05 3.1 23.3 10.1 76.7Dec-05 2.9 21.8 10.3 78.2Mar-06 3.3 24.2 10.4 75.8Jun-06 2.9 21.0 10.8 79.0Sep-06 3.1 21.7 11.2 78.3Dec-06 3.2 21.9 11.4 78.1Mar-07 3.6 23.9 11.5 76.1Jun-07 3.7 23.6 11.9 76.4Sep-07 5.7 31.3 12.5 68.7Dec-07 4.5 25.6 13.0 74.4Mar-08 4.6 25.6 13.4 74.4Jun-08 4.3 23.9 13.8 76.1Sep-08 4.7 23.7 15.0 76.3Dec-08 5.5 26.7 15.0 73.3Mar-09 5.0 24.0 16.0 76.0Jun-09 3.9 19.4 16.2 80.6Sep-09 3.0 15.5 16.2 84.5Dec-09 3.9 19.7 15.8 80.3Mar-10 4.2 22.8 14.2 77.2Jun-10 5.3 28.6 13.2 71.4Sep-10 5.3 28.6 13.2 71.4
Interest Income Non-interest Income
Table 1A : Non-interest Income & Interest Income

25
Table 1B - SUR RESULTS Dependent Variable: SCLOANS Coefficient t-Statistic Coefficient t-Statistic
RELROA 0.002181 0.497156 0.0364 8.9865
GDPGWTH 2.29E-06 0.121777 0.0000 0.2026
CORERATIO -0.000255 -0.838139 0.0012 5.2781
LOANASSET:RATIO 0.000926 4.702186 0.0018 7.6617
CLSHARE 0.000217 0.719775 0.0027 6.6410
PSLSHARE -0.000104 -0.411877 -0.0009 -3.2154
HHI 0.001476 1.437838 -0.0016 -1.0622
ATM 0.000964 3.264767 -0.0004 -1.1190
INVESTRATIO -0.00846 -4.439344 0.0008 0.8517
EXRVOL 2.87E-05 0.861651 -0.0001 -1.7261
LOANQUALITY 0.003535 1.25449 0.0214 5.0033
TBILLVOL 1.70E-05 1.237005 0.0001 3.0384
Dependent Variable: ROA Coefficient t-Statistic Coefficient t-Statistic
SCLOANS -1.279803 -1.127197 1.030323 1.446193
GDPGWTH -0.000305 -1.048041 -0.000717 -1.640357
LOANRATIO 0.007568 2.122969 4.44E-05 0.013446
HHI 0.007175 0.468061 -0.02573 -1.120199
CORERATIO 0.021398 9.760768 0.011375 5.235075
LOANQUALITY -0.44447 -5.960238 -0.042552 -0.831175
INVESTRATIO -0.07303 -3.285022 0.033295 2.281401
TBILLVOL -6.44E-05 -0.352767 -0.000271 -0.991501
Dependent Variable: STDEVROA Coefficient t-Statistic Coefficient t-Statistic
SCLOANS -0.021063 -0.04544 0.028195 0.09805
CORERATIO 0.00496 4.052511 0.006304 6.763882
LOANRATIO -0.006622 -4.581467 -0.001894 -1.109159
GDPGWTH -8.90E-05 -0.929433 0.000357 1.731436
LOANQUALITY -0.022774 -1.224817 0.042287 1.534106
INVESTRATIO 0.064925 5.602545 0.007575 1.313467
TBILLVOL -4.17E-05 -0.652245 -8.94E-05 -0.661393
Determinant residual covariance 5.20E-53 1.40E-63
LARGE BANKS SMALL BANKS
26
Table 1C - SUR RESULTS Dependent Variable: OTHERSC Coefficient t-Statistic Coefficient t-Statistic
RELROA 0.047519 4.636913 0.159626 16.16816
GDPGWTH -1.95E-05 -0.59084 0.000167 2.06978
CORERATIO -0.002965 -4.289622 0.000668 1.17457
LOANASSET:RATIO 0.00207 4.796223 -0.002353 -3.53661
CLSHARE 0.008508 13.4292 0.000478 0.645969
PSLSHARE -0.001753 -3.066152 0.000768 1.17985
HHI 0.000977 0.550267 -0.004302 -1.067124
ATM 0.003319 4.860697 0.001226 2.229803
INVESTRATIO -0.032131 -8.63869 0.00568 2.072124
EXRVOL 3.46E-05 0.613883 0.000145 1.364666
LOANQUALITY 0.050581 8.02835 0.064212 6.154732
TBILLVOL -4.03E-05 -1.682772 7.45E-05 1.333771
Dependent Variable: ROA Coefficient t-Statistic Coefficient t-Statistic
OTHERSC 0.882818 2.942414 3.576621 18.80113
GDPGWTH -0.000392 -1.271952 -0.001244 -2.614732
LOANRATIO 0.001865 0.584482 0.008589 2.718889
HHI -0.013775 -0.831713 -0.006897 -0.279505
CORERATIO 0.013802 5.251041 0.000345 0.156455
LOANQUALITY -0.366321 -4.809359 -0.202395 -3.785265
INVESTRATIO -0.015788 -0.654986 -0.003019 -0.211991
TBILLVOL 7.72E-05 0.40036 -0.0004 -1.348361
Dependent Variable: STDEVROA Coefficient t-Statistic Coefficient t-Statistic
OTHERSC 0.291318 1.66474 0.737964 7.976121
CORERATIO 0.004231 3.638941 0.003353 3.64723
LOANRATIO -0.008518 -4.793561 -0.000616 -0.387405
GDPGWTH -8.91E-05 -0.953907 0.000211 0.940336
LOANQUALITY -0.028541 -1.38707 0.029561 1.05518
INVESTRATIO 0.070484 5.625884 0.002191 0.384201
TBILLVOL -5.60E-06 -0.091838 -0.000121 -0.823803
Determinant residual covariance 4.65E-51 3.31E-62
LARGE BANKS SMALL BANKS
Top Related