


Languages
Pages
Legal


README Document for
North America Land Data Assimilation System Phase 1 (NLDAS-1) Products
Prepared by Hualan Rui, GES DISC
Last revised: January 22, 2013

North America Land Data Assimilation System Phase 1 (NLDAS-1) Products README
2
Revision History
Revision
Date
Changes Author
05/19/2010 Initial version based on information on
http://ldas.gsfc.nasa.gov/nldas/
Hualan Rui
06/30/2010 Review and revise David Mocko
03/10/2011 Add parameter and spatial subsetting service Hualan Rui
03/10/2011 Add Giovanni Online Visualization and Analysis Hualan Rui
11/21/2011 Update GES DISC Helpdesk email address Hualan Rui
10/26/2012 Add information for monthly forcing data Hualan Rui
11/08/2012 Review and revise David Mocko
01/22/2013 Add information for monthly climatology data Hualan Rui
03/14/2013 Review and revise David Mocko
North America Land Data Assimilation System Phase 1 (NLDAS-1) Products README
3
Contents
.......................................................................................................................... 1 Revision History ............................................................................................................................. 2 Introduction .................................................................................................................................... 4
Basic characteristics of the NLDAS-1 data ................................................................. 4 What are the differences between NLDAS -1 and NLDAS-2? ..................................... 5
Updates ............................................................................................................................................ 5 Data Citation ................................................................................................................................... 5 Data Organization .......................................................................................................................... 6
File Naming Convention .............................................................................................. 6
1. Hourly Data Set .................................................................................................... 6 2. Monthly Data Set .................................................................................................. 6 3. Monthly Climatology Data Set ............................................................................. 6
File Format Structure .................................................................................................. 6 Data Contents ................................................................................................................................. 7
Forcing Data ............................................................................................................... 7 Reading the Data .......................................................................................................................... 10
Set NLDAS-specific GRIB Parameter Table ............................................................. 10
Reading the data by WGRIB ...................................................................................... 10 Reading/viewing the data by GrADS ......................................................................... 12
Retrieve Data through the GrADS Data Server (GDS) ............................................. 14 Data Interpretation ...................................................................................................................... 15 Data Access ................................................................................................................................... 15
Data Volume .............................................................................................................. 16
Search and download data via Mirador .................................................................... 16 Access data via GrADS Data Server (GDS) .............................................................. 16 Anonymous ftp ........................................................................................................... 16
Data Services ................................................................................................................................. 16 On-the-Fly (OTF) Parameter and Spatial Subset ..................................................... 16 Online Visualization and Analysis in Giovanni ......................................................... 19
Points of Contact .......................................................................................................................... 22 Sponsor and Acknowledgement .................................................................................................. 23 References ..................................................................................................................................... 24 Appendices .................................................................................................................................... 25
A. Description of Metadata........................................................................................ 25 B. User-defined Parameter Tables for Different GRIB Files .................................... 26 C. Acronyms ............................................................................................................... 28

North America Land Data Assimilation System Phase 1 (NLDAS-1) Products README
4
Introduction
The goal of the North American Land Data Assimilation System (NLDAS) is to construct
quality-controlled, and spatially and temporally consistent, land-surface model (LSM)
datasets from the best available observations and model output to support modeling
activities. More information about NLDAS is available at http://ldas.gsfc.nasa.gov/nldas/.
NLDAS is a collaboration project among several groups: NOAA/NCEP's Environmental
Modeling Center (EMC), NASA's Goddard Space Flight Center (GSFC), Princeton
University, the University of Washington, the NOAA/NWS Office of Hydrological
Development (OHD), and the NOAA/NCEP Climate Prediction Center (CPC). NLDAS
is a core project with support from NOAA's Climate Prediction Program for the Americas
(CPPA). Data from the project can be accessed from the NASA Goddard Earth Science
Data and Information Services Center (GES DISC) as well as from the NCEP/EMC
NLDAS website.
This document specifically describes the forcing data for Phase 1 of the North American
Land Data Assimilation System (hereafter, NLDAS-1). The information about NLDAS-
1 model data will be added in the future.
NLDAS-1 forcing data are in 1/8th-degree grid spacing and range from 01 Aug 1996 to
31 Dec 2007. The temporal resolutions are hourly and monthly. The file format is WMO
GRIB-1.
Basic characteristics of the NLDAS-1 data
Table 1. Basic characteristics of the NLDAS-1 data.
Contents Forcing data, land-surface model output
Latitude extent 25 to 53
Longitude extent -125 to -67
Spatial resolution 1/8th degree
Temporal resolution Hourly and monthly
Temporal coverage 1 August 1996 to 31 December 2007
Dimension 464 (lon) x 224 (lat)
Grid box center points Lower left: -124.9375, 25.0625 Upper right: -67.0625, 52.9375
Land surface models Mosaic
However, due to limitations of the GRIB 1 format, the location of the origin (lower-left
grid point) can be expressed only to a precision of .001 degree in the GDS (Grid
Description Section) of the GRIB header. The values for the lower-left, as given by the
GDS in NLDAS-1 GRIB files, are 25.063 for latitude and -124.938 for longitude.
North America Land Data Assimilation System Phase 1 (NLDAS-1) Products README
5
What are the differences between NLDAS -1 and NLDAS-2?
The most significant difference is the time frames of the datasets. NLDAS-1 is available
from mid-1996 to the end of December 2007. NLDAS-2 is available from January 1979
to present.
Another major difference between the two phases of NLDAS is the sources of model data
and observations used to create the respective forcing datasets. NLDAS-1 uses the 40-
km NCEP Eta model-based Data Assimilation System (EDAS) for the surface
meteorology, while NLDAS-2 uses the 32-km NARR system. For downward shortwave
radiation at the surface, NLDAS-1 uses GOES-based satellite retrievals, with EDAS data
used when/where not available; NLDAS-2 uses GOES data to bias-correct the NARR
shortwave radiation.
For more information about the differences between NLDAS-2 and NLDAS-2, please
visit LDAS FAQ at: http://ldas.gsfc.nasa.gov/faq/#NLDAS_1vs2.
Updates
Please check periodically the GES DISC web site and GES DISC Hydrology Portal for
the latest NLDAS data.
Data Citation
Please refer to Mitchell et al. (2004) for more information about the NLDAS project.
NASA requests that you include the following acknowledgment in papers published
using these data:
"The data used in this study were acquired as part of the mission of NASA's Earth
Science Division and archived and distributed by the Goddard Earth Sciences (GES)
Data and Information Services Center (DISC)."
We would appreciate receiving a copy of your publication, which can be forwarded to the
following address:
GES DISC Help Desk
Code 610.2
NASA/Goddard Space Flight Center
Greenbelt, MD 20771
Phone: 301-614-5224
Fax: 301-614-5268
Email: [email protected]

North America Land Data Assimilation System Phase 1 (NLDAS-1) Products README
6
Data Organization
File Naming Convention
1. Hourly Data Set
“<HH>” in the following is GMT hour of the day.
The NLDAS-1hourly forcing data files are named in accordance with the following
convention:
NLDAS_<Forcing dataset><Grid spacing>_H.A<Date>.<Product version>.grb
Attribute Description
<Forcing dataset> “FOR” for forcing dataset “File FOR”
<Grid spacing> “0125” for 1/8th degree
<Date> * With format <YYYYMMDD>.<HH>00
<Product version> “001” for NLDAS-1 * (4-digit year; 2-digit month; 2-digit day of month; 2-digit GMT hour of the day)
For example, file name for NLDAS-1 1/8th
degree forcing data 00:00Z on 1 August 1996
is “NLDAS_FOR0125_H.A19960801.0000.001.grb”.
2. Monthly Data Set
The NLDAS-1 monthly data have the same name convention, except replacing the “H”
with “M” for denoting Monthly and with format <YYYYMM> for <Date>.
For example, file name of NLDAS-1 1/8th
degree forcing data for August 1996 is
“NLDAS_FOR0125_M.A199608.001.grb”.
3. Monthly Climatology Data Set
The NLDAS-1 monthly climatology data have the same name convention, except
replacing the “H” with “MC” for denoting “Monthly Climatology” and with format
“<CLIMMM>” for <Date>.
For example, file name of NLDAS-1 1/8th
degree monthly climatology data for August is
“NLDAS_FORA0125_MC.ACLIM08.001.grb”.
File Format Structure
The NLDAS LSM data are created using the GRIdded Binary (GRIB) format, WMO
GRIB-1. For more details about the GRIB format, please see:
http://www.nco.ncep.noaa.gov/pmb/docs/on388/.
North America Land Data Assimilation System Phase 1 (NLDAS-1) Products README
7
GRIB parameter tables for NLDAS-1 data are provided in Appendix B. WGRIB or other
GRIB reader (grib2ctl.pl) is required to read the GRIB files. The NLDAS-1 land surface
forcing files and land model output files utilizes GRIB-1 Parameter Table 130, which is
oriented toward land/hydrology modeling and land/hydrology physics. NLDAS-1
parameter IDs names, units, and abbreviations are defined in the GRIB-1 Parameter
Table 130. The parameter IDs 000-127 in Part 1 of Table 130 are identical to those
defined in ON388 Table 2.
Data Contents
Forcing Data
NLDAS-1 hourly land surface forcing data contains fifteen fields.
The chief source of NLDAS-1 forcing is NCEP's Eta model-based Data Assimilation
System (EDAS) [Rogers et al., 1995], a continuously cycled North American 4DDA
system. GOES-based solar insolation (Pinker et al., 2003) provides the primary
insolation forcing (shortwave down at the surface) for NLDAS-1. NLDAS-1
precipitation forcing over CONUS is anchored to NCEP's 1/4th
-degree gauge-only daily
precipitation analyses of Higgins et al. [2000]. More information about the source of
NLDAS-1 forcing data is available at:
http://ldas.gsfc.nasa.gov/nldas/NLDAS1forcing.php.
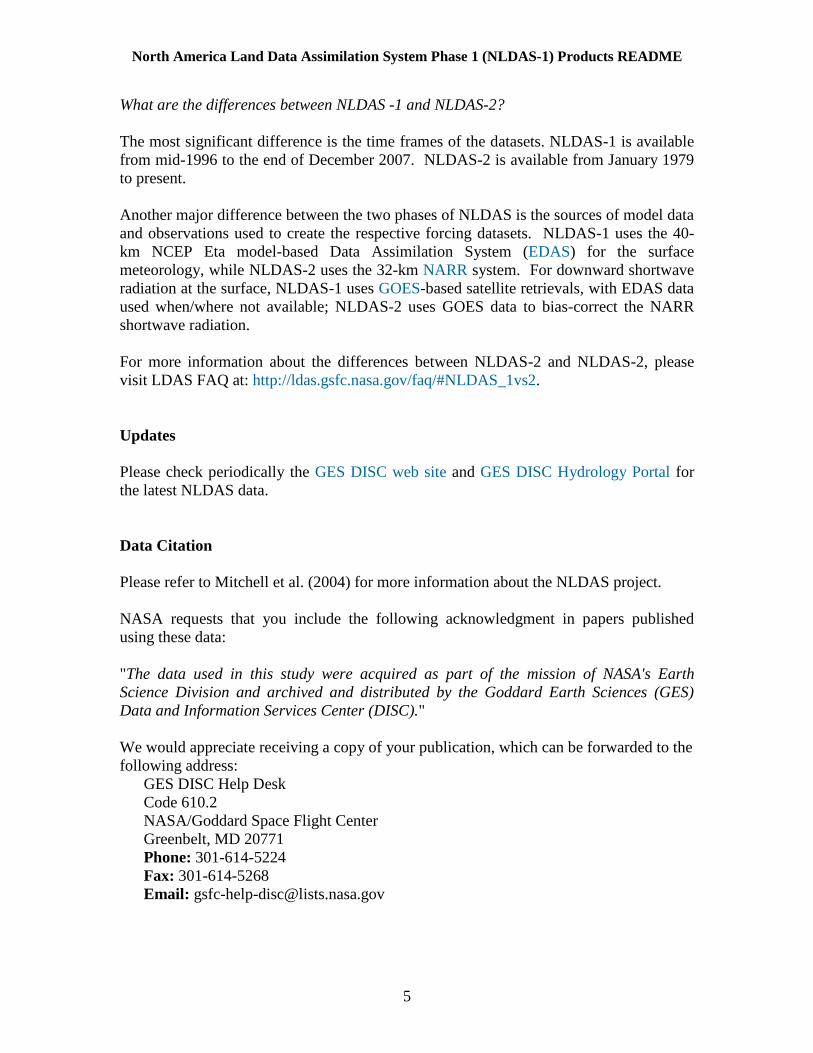
Table 2a shows a list of parameters provided in the NLDAS-1 hourly forcing GRIB files.
This table shows the GRIB Product Definition Section (PDS) ID and the corresponding
parameter name and unit, as well as if the variable is instantaneous or backward-
accumulated (over the entire previous hour before the time listed in the dataset).
Table 2a. Parameters in the NLDAS-1 hourly forcing data.
PDS ID Full Name Unit Time
63 Convective precipitation hourly total from EDAS kg/m^2 Hourly backward-accumulated
61 Precipitation hourly total kg/m^2 Hourly backward-accumulated
118 Surface brightness temperature from GOES-UMD Pinker K Hourly instantaneous
157 Convective Available Potential Energy J/kg Hourly instantaneous
205 Longwave radiation flux downwards (surface) W/m^2 Hourly instantaneous
204 Shortwave radiation flux downwards (surface) W/m^2 Hourly instantaneous
101 PAR Photosynthetically Active Radiation from GOES-UMD Pinker W/m^2 Hourly instantaneous
201 Precipitation hourly total from EDAS kg/m^2 Hourly backward-accumulated
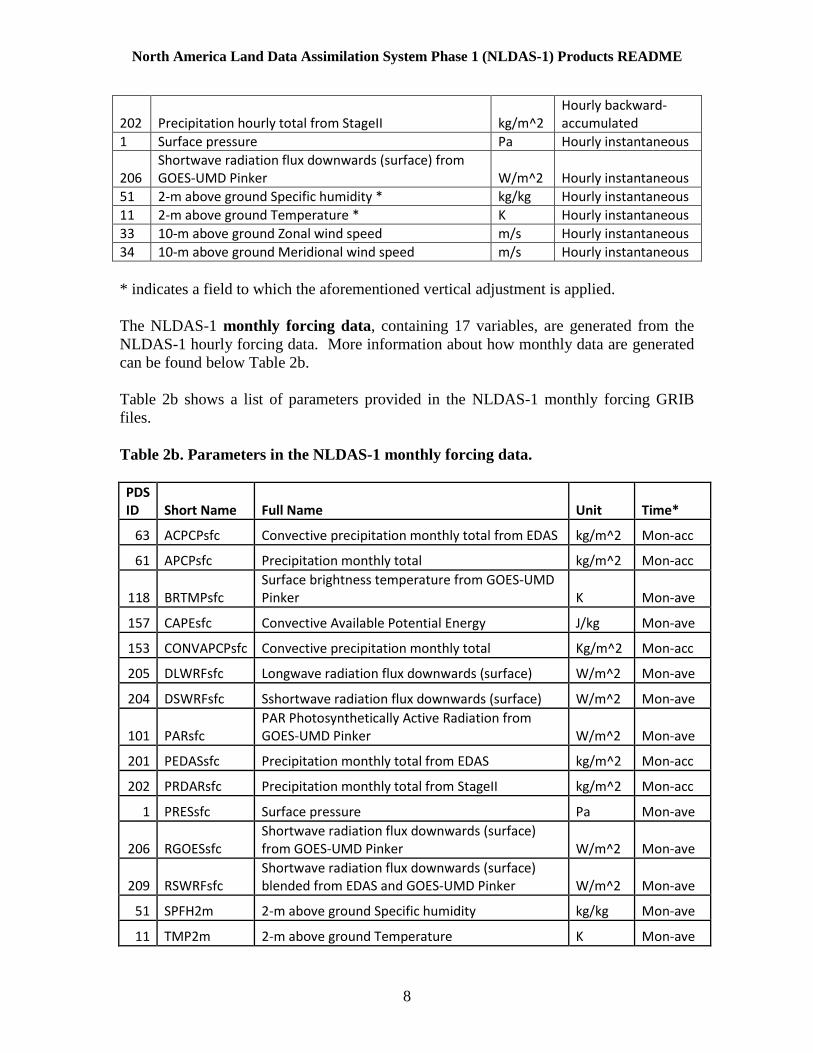
North America Land Data Assimilation System Phase 1 (NLDAS-1) Products README
8
202 Precipitation hourly total from StageII kg/m^2 Hourly backward-accumulated
1 Surface pressure Pa Hourly instantaneous
206 Shortwave radiation flux downwards (surface) from GOES-UMD Pinker W/m^2 Hourly instantaneous
51 2-m above ground Specific humidity * kg/kg Hourly instantaneous
11 2-m above ground Temperature * K Hourly instantaneous
33 10-m above ground Zonal wind speed m/s Hourly instantaneous
34 10-m above ground Meridional wind speed m/s Hourly instantaneous
* indicates a field to which the aforementioned vertical adjustment is applied.
The NLDAS-1 monthly forcing data, containing 17 variables, are generated from the
NLDAS-1 hourly forcing data. More information about how monthly data are generated
can be found below Table 2b.
Table 2b shows a list of parameters provided in the NLDAS-1 monthly forcing GRIB
files.
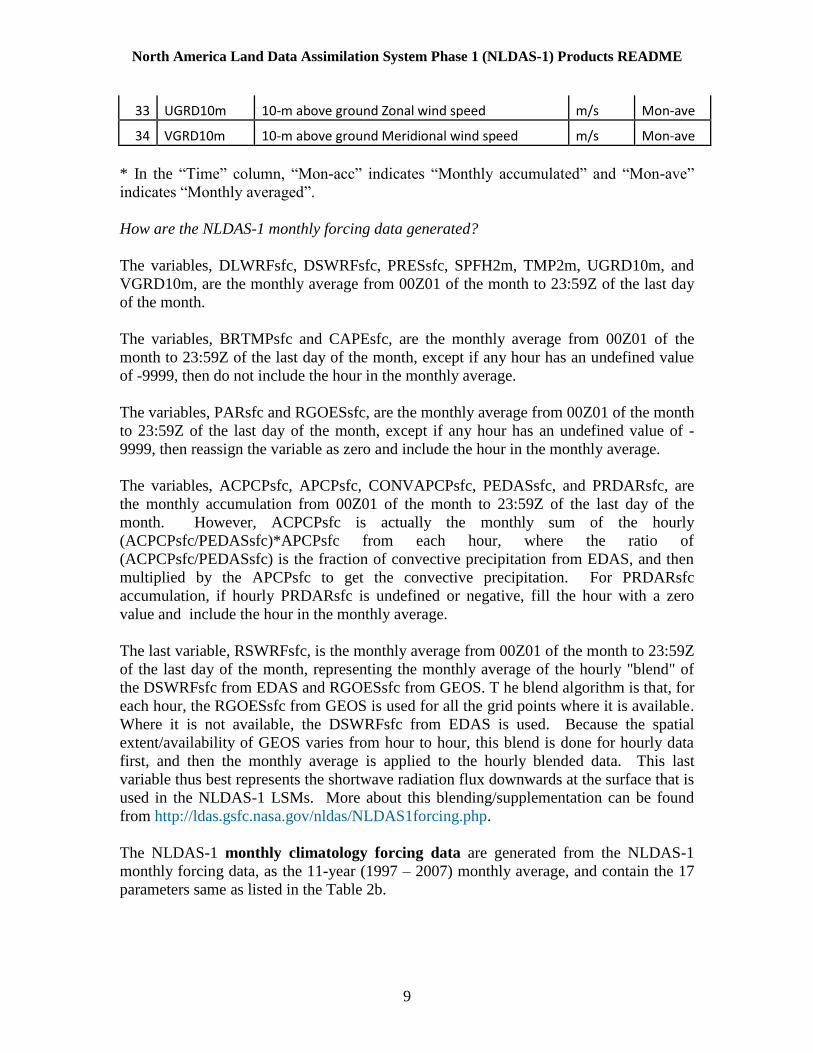
Table 2b. Parameters in the NLDAS-1 monthly forcing data.
PDS ID Short Name Full Name Unit Time*
63 ACPCPsfc Convective precipitation monthly total from EDAS kg/m^2 Mon-acc
61 APCPsfc Precipitation monthly total kg/m^2 Mon-acc
118 BRTMPsfc Surface brightness temperature from GOES-UMD Pinker K Mon-ave
157 CAPEsfc Convective Available Potential Energy J/kg Mon-ave
153 CONVAPCPsfc Convective precipitation monthly total Kg/m^2 Mon-acc
205 DLWRFsfc Longwave radiation flux downwards (surface) W/m^2 Mon-ave
204 DSWRFsfc Sshortwave radiation flux downwards (surface) W/m^2 Mon-ave
101 PARsfc PAR Photosynthetically Active Radiation from GOES-UMD Pinker W/m^2 Mon-ave
201 PEDASsfc Precipitation monthly total from EDAS kg/m^2 Mon-acc
202 PRDARsfc Precipitation monthly total from StageII kg/m^2 Mon-acc
1 PRESsfc Surface pressure Pa Mon-ave
206 RGOESsfc Shortwave radiation flux downwards (surface) from GOES-UMD Pinker W/m^2 Mon-ave
209 RSWRFsfc Shortwave radiation flux downwards (surface) blended from EDAS and GOES-UMD Pinker W/m^2 Mon-ave
51 SPFH2m 2-m above ground Specific humidity kg/kg Mon-ave
11 TMP2m 2-m above ground Temperature K Mon-ave
North America Land Data Assimilation System Phase 1 (NLDAS-1) Products README
9
33 UGRD10m 10-m above ground Zonal wind speed m/s Mon-ave
34 VGRD10m 10-m above ground Meridional wind speed m/s Mon-ave
* In the “Time” column, “Mon-acc” indicates “Monthly accumulated” and “Mon-ave”
indicates “Monthly averaged”.
How are the NLDAS-1 monthly forcing data generated?
The variables, DLWRFsfc, DSWRFsfc, PRESsfc, SPFH2m, TMP2m, UGRD10m, and
VGRD10m, are the monthly average from 00Z01 of the month to 23:59Z of the last day
of the month.
The variables, BRTMPsfc and CAPEsfc, are the monthly average from 00Z01 of the
month to 23:59Z of the last day of the month, except if any hour has an undefined value
of -9999, then do not include the hour in the monthly average.
The variables, PARsfc and RGOESsfc, are the monthly average from 00Z01 of the month
to 23:59Z of the last day of the month, except if any hour has an undefined value of -
9999, then reassign the variable as zero and include the hour in the monthly average.
The variables, ACPCPsfc, APCPsfc, CONVAPCPsfc, PEDASsfc, and PRDARsfc, are
the monthly accumulation from 00Z01 of the month to 23:59Z of the last day of the
month. However, ACPCPsfc is actually the monthly sum of the hourly
(ACPCPsfc/PEDASsfc)*APCPsfc from each hour, where the ratio of
(ACPCPsfc/PEDASsfc) is the fraction of convective precipitation from EDAS, and then
multiplied by the APCPsfc to get the convective precipitation. For PRDARsfc
accumulation, if hourly PRDARsfc is undefined or negative, fill the hour with a zero
value and include the hour in the monthly average.
The last variable, RSWRFsfc, is the monthly average from 00Z01 of the month to 23:59Z
of the last day of the month, representing the monthly average of the hourly "blend" of
the DSWRFsfc from EDAS and RGOESsfc from GEOS. T he blend algorithm is that, for
each hour, the RGOESsfc from GEOS is used for all the grid points where it is available.
Where it is not available, the DSWRFsfc from EDAS is used. Because the spatial
extent/availability of GEOS varies from hour to hour, this blend is done for hourly data
first, and then the monthly average is applied to the hourly blended data. This last
variable thus best represents the shortwave radiation flux downwards at the surface that is
used in the NLDAS-1 LSMs. More about this blending/supplementation can be found
from http://ldas.gsfc.nasa.gov/nldas/NLDAS1forcing.php.
The NLDAS-1 monthly climatology forcing data are generated from the NLDAS-1
monthly forcing data, as the 11-year (1997 – 2007) monthly average, and contain the 17
parameters same as listed in the Table 2b.

North America Land Data Assimilation System Phase 1 (NLDAS-1) Products README
10
Reading the Data
WGRIB, GrADS, or other GRIB readers are required for reading the NLDAS data.
Set NLDAS-specific GRIB Parameter Table
GRIB files identify the contents (e.g., soil moisture, temperature) by parameter numbers.
These numbers are linked to their respective parameter names in a parameter table. The
parameter tables used for NLDAS data are shown in Appendices B.1~B.2, for the forcing
datasets and then each land surface model, as indicated. The name of the user-defined
table is searched for in the following order:
1. Environment variable “GRIBTAB”
2. Environment variable “gribtab”
3. File gribtab
Defining an environment variable depends on the operating system and on the shell.
Examples for setting the environment variable GRIBTAB:
MS-DOS or Windows: set GRIBTAB=~/data/gribtab
Bash: export GRIBTAB=~/data/gribtab
Csh: setenv GRIBTAB ~/data/gribtab
Sh: GRIBTAB=$HOME/data/gribtab; export GRIBTAB
The GRIBTAB file for NLDAS-1 Forcing Data is defined in Appendix B.
Reading the data by WGRIB
WGRIB is a program to manipulate, inventory, and decode GRIB files; version 1.7.X (or
later) is recommended to avoid any possible discrepancies caused by different WGRIB
versions. The source code and installation instructions for WGRIB are available from:
http://www.cpc.ncep.noaa.gov/products/wesley/wgrib.html.
Download the corresponding GRIBTAB (See Appendix B) and set the environmental
variable GRIBTAB (See Set NLDAS-specific GRIB Parameter Table above) first before
using WGRIB.
1. GRIB data verbose inventory
Usage: ./wgrib grib_file [options]
Example: wgrib –v NLDAS_FOR0125_H.20010101.1800.001.grb

North America Land Data Assimilation System Phase 1 (NLDAS-1) Products README
11
The above inventories consist of several fields separated by colons. The contents of the
fields are as follows:
1. Record number
2. Position in bytes
3. Date (YYYYMMDDHH)
4. Parameter name
5. Type of level/layer (grib PDS octet 10)
6. KPDS5, KPDS6, KPDS7 (grib PDS octets 9, 10, 11-12)
7. Forecasts, analysis, etc.
8. Description of parameter type
Users are suggested to refer to the metadata associated (See Appendix A) with the GRIB
files for more details about the type of level/layer information.
2. Extract a specific field from GRIB data
Usage wgrib -s infile|grep ":TMP:"|wgrib -i infile -o outfile
Convert to a binary file
wgrib –s NLDAS_FORA0125_H.20010101.1800.002.grb|grep ":TMP:"| wgrib –i NLDAS_FORA0125_H.20010101.1800.002.grb -o tmp2m.2001010118.bin
Convert to a text file
wgrib –s NLDAS_FORA0125_H.20010101.1800.002.grb| grep ":TMP:"| wgrib –i –text NLDAS_FORA0125_H.20010101.1800.002.grb -o tmp2m.2001010118.txt
Examples are for converting a specific GRIB field, e.g., 2-meter surface temperature to a
binary file and a text file respectively.
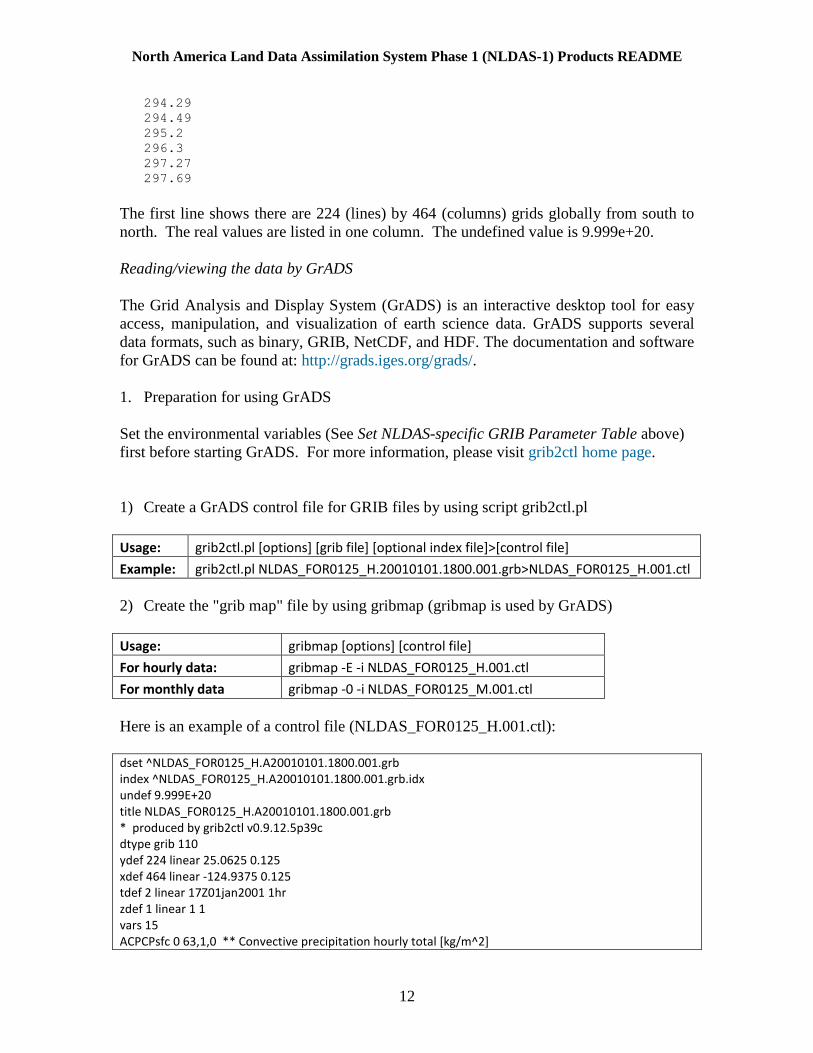
A sample tmp2m.2001010118.txt file looks like:
464 224
9.999e+20
9.999e+20
9.999e+20
9.999e+20
9.999e+20
…….
…….
1:0:D=2001010118:TMP2m:2 m above gnd:kpds=11,105,2:anl:"2-m above ground Temperature [K] 2:143796:D=2001010118:SPFH2m:2 m above gnd:kpds=51,105,2:anl:"2-m above ground Specific humidity [kg/kg] 3:317756:D=2001010118:PRESsfc:sfc:kpds=1,1,0:anl:"Surface pressure [Pa] 4:491716:D=2001010118:UGRD10m:10 m above gnd:kpds=33,105,10:anl:"10-m above ground Zonal wind speed [m/s] 5:625456:D=2001010118:VGRD10m:10 m above gnd:kpds=34,105,10:anl:"10-m above ground Meridional wind speed [m/s] 6:759196:D=2001010118:DSWRFsfc:sfc:kpds=204,1,0:anl:"Shortwave radiation flux downwards (surface) [W/m^2] 7:933156:D=2001010118:DLWRFsfc:sfc:kpds=205,1,0:anl:"Longwave radiation flux downwards (surface) [W/m^2] 8:1097062:D=2001010117:PEDASsfc:sfc:kpds=201,1,0:0-1hr acc:"Precipitation hourly total from EDAS [kg/m^2] 9:1250912:D=2001010117:ACPCPsfc:sfc:kpds=63,1,0:0-1hr acc:"Convective precipitation hourly total [kg/m^2] 10:1374598:D=2001010118:CAPEsfc:sfc:kpds=157,1,0:anl:"Convective Available Potential Energy [J/kg] 11:1548558:D=2001010118:RGOESsfc:sfc:kpds=206,1,0:anl:"Shortwave radiation flux downwards (surface) from GOES-UMD Pinker [W/m^2] 12:1722518:D=2001010118:BRTMPsfc:sfc:kpds=118,1,0:anl:"Surface brightness temperature from GOES-UMD Pinker [K] 13:1896478:D=2001010118:PARsfc:sfc:kpds=101,1,0:anl:"PAR Photosynthetically Active Radiation from GOES-UMD Pinker [W/m^2] 14:2070438:D=2001010117:APCPsfc:sfc:kpds=61,1,0:0-1hr acc:"Precipitation hourly total [kg/m^2] 15:2234344:D=2001010117:PRDARsfc:sfc:kpds=202,1,0:0-1hr acc:"Precipitation hourly total from StageII [kg/m^2]
North America Land Data Assimilation System Phase 1 (NLDAS-1) Products README
12
294.29
294.49
295.2
296.3
297.27
297.69
The first line shows there are 224 (lines) by 464 (columns) grids globally from south to
north. The real values are listed in one column. The undefined value is 9.999e+20.
Reading/viewing the data by GrADS
The Grid Analysis and Display System (GrADS) is an interactive desktop tool for easy
access, manipulation, and visualization of earth science data. GrADS supports several
data formats, such as binary, GRIB, NetCDF, and HDF. The documentation and software
for GrADS can be found at: http://grads.iges.org/grads/.
1. Preparation for using GrADS
Set the environmental variables (See Set NLDAS-specific GRIB Parameter Table above)
first before starting GrADS. For more information, please visit grib2ctl home page.
1) Create a GrADS control file for GRIB files by using script grib2ctl.pl
Usage: grib2ctl.pl [options] [grib file] [optional index file]>[control file]
Example: grib2ctl.pl NLDAS_FOR0125_H.20010101.1800.001.grb>NLDAS_FOR0125_H.001.ctl
2) Create the "grib map" file by using gribmap (gribmap is used by GrADS)
Usage: gribmap [options] [control file]
For hourly data: gribmap -E -i NLDAS_FOR0125_H.001.ctl
For monthly data gribmap -0 -i NLDAS_FOR0125_M.001.ctl
Here is an example of a control file (NLDAS_FOR0125_H.001.ctl):
dset ^NLDAS_FOR0125_H.A20010101.1800.001.grb index ^NLDAS_FOR0125_H.A20010101.1800.001.grb.idx undef 9.999E+20 title NLDAS_FOR0125_H.A20010101.1800.001.grb * produced by grib2ctl v0.9.12.5p39c dtype grib 110 ydef 224 linear 25.0625 0.125 xdef 464 linear -124.9375 0.125 tdef 2 linear 17Z01jan2001 1hr zdef 1 linear 1 1 vars 15 ACPCPsfc 0 63,1,0 ** Convective precipitation hourly total [kg/m^2]
North America Land Data Assimilation System Phase 1 (NLDAS-1) Products README
13
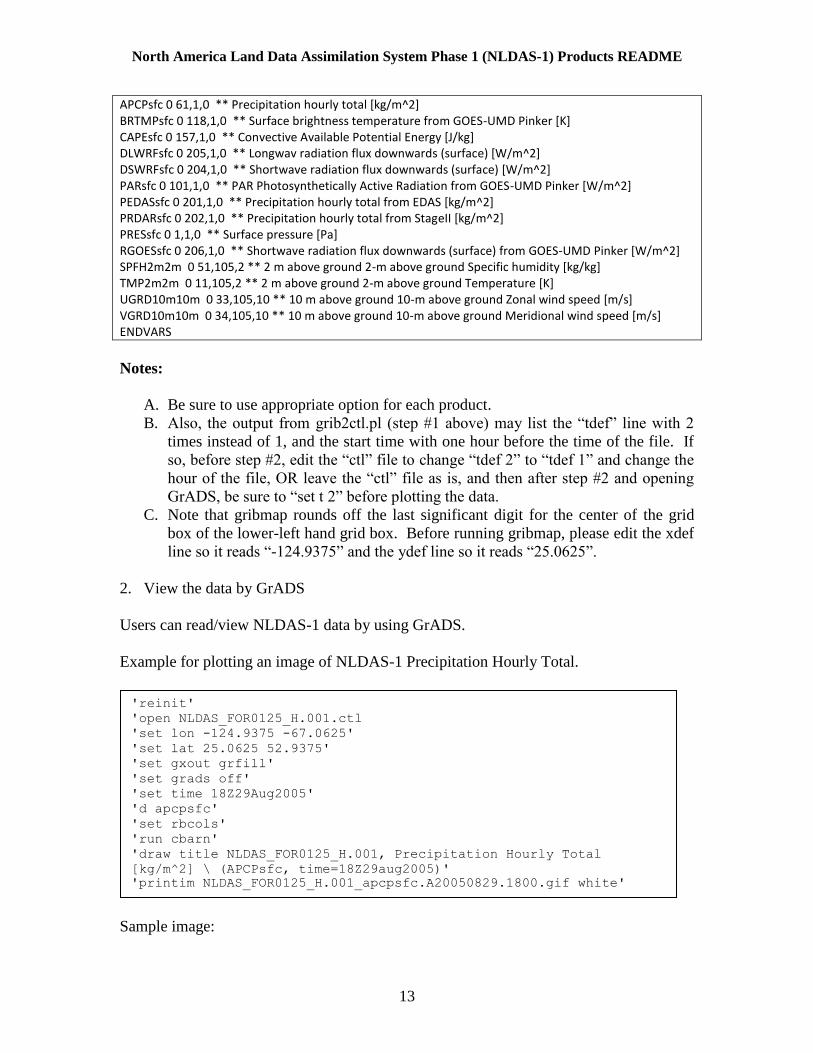
APCPsfc 0 61,1,0 ** Precipitation hourly total [kg/m^2] BRTMPsfc 0 118,1,0 ** Surface brightness temperature from GOES-UMD Pinker [K] CAPEsfc 0 157,1,0 ** Convective Available Potential Energy [J/kg] DLWRFsfc 0 205,1,0 ** Longwav radiation flux downwards (surface) [W/m^2] DSWRFsfc 0 204,1,0 ** Shortwave radiation flux downwards (surface) [W/m^2] PARsfc 0 101,1,0 ** PAR Photosynthetically Active Radiation from GOES-UMD Pinker [W/m^2] PEDASsfc 0 201,1,0 ** Precipitation hourly total from EDAS [kg/m^2] PRDARsfc 0 202,1,0 ** Precipitation hourly total from StageII [kg/m^2] PRESsfc 0 1,1,0 ** Surface pressure [Pa] RGOESsfc 0 206,1,0 ** Shortwave radiation flux downwards (surface) from GOES-UMD Pinker [W/m^2] SPFH2m2m 0 51,105,2 ** 2 m above ground 2-m above ground Specific humidity [kg/kg] TMP2m2m 0 11,105,2 ** 2 m above ground 2-m above ground Temperature [K] UGRD10m10m 0 33,105,10 ** 10 m above ground 10-m above ground Zonal wind speed [m/s] VGRD10m10m 0 34,105,10 ** 10 m above ground 10-m above ground Meridional wind speed [m/s] ENDVARS
Notes:
A. Be sure to use appropriate option for each product.
B. Also, the output from grib2ctl.pl (step #1 above) may list the “tdef” line with 2
times instead of 1, and the start time with one hour before the time of the file. If
so, before step #2, edit the “ctl” file to change “tdef 2” to “tdef 1” and change the
hour of the file, OR leave the “ctl” file as is, and then after step #2 and opening
GrADS, be sure to “set t 2” before plotting the data.
C. Note that gribmap rounds off the last significant digit for the center of the grid
box of the lower-left hand grid box. Before running gribmap, please edit the xdef
line so it reads “-124.9375” and the ydef line so it reads “25.0625”.
2. View the data by GrADS
Users can read/view NLDAS-1 data by using GrADS.
Example for plotting an image of NLDAS-1 Precipitation Hourly Total.
Sample image:
'reinit'
'open NLDAS_FOR0125_H.001.ctl
'set lon -124.9375 -67.0625'
'set lat 25.0625 52.9375'
'set gxout grfill'
'set grads off'
'set time 18Z29Aug2005'
'd apcpsfc'
'set rbcols'
'run cbarn'
'draw title NLDAS_FOR0125_H.001, Precipitation Hourly Total
[kg/m^2] \ (APCPsfc, time=18Z29aug2005)'
'printim NLDAS_FOR0125_H.001_apcpsfc.A20050829.1800.gif white'

North America Land Data Assimilation System Phase 1 (NLDAS-1) Products README
14
Retrieve Data through the GrADS Data Server (GDS)
The GrADS Data Server is a stable, secure data server that provides subsetting and
analysis services across the internet. The NLDAS-1 data is accessible via the GDS at
GES DISC.
Users can retrieve NLDAS data from a GDS server using analysis tools such as GrADS,
Ferret, Matlab, or IDL. Here is an example of the GrADS script to access the GDS server
and draw the total hourly precipitation in the primary forcing data.
'reinit'
'sdfopen http://hydro1.sci.gsfc.nasa.gov/dods/NLDAS_FOR0125_H.001'
'set lon -124.9375 -67.0625'
'set lat 25.0625 52.9375'
'set gxout grfill'
'set grads off'
'set time 18Z29Aug2005'
'd apcpsfc'
'set rbcols'
'run cbarn'
'draw title NLDAS_FOR0125_H.001, Precipitation Hourly Total
[kg/m^2] \ (APCPsfc, time=18Z29aug2005)'
'printim NLDAS_FOR0125_H.001_apcpsfc.A20050829.1800.gif white'

North America Land Data Assimilation System Phase 1 (NLDAS-1) Products README
15
Users can convert the NLDAS-1 data to ASCII or binary format on the fly, using a
standard web browser through a constructed URL. Here is an example for “How to
retrieve NLDAS data via GDS as ASCII text?”
http://hydro1.sci.gsfc.nasa.gov/dods/NLDAS_FOR0125_H.001.ascii?apcpsfc[802:804][85:88][302:306]
The output looks like:
apcpsfc, [3][4][5]
[0][0], 0.1328, 0.1408, 0.2592, 2.1208, 2.2368
[0][1], 0.3872, 3.4616, 4.4656, 3.3304, 3.4408
[0][2], 0.2696, 2.4912, 2.2696, 2.1808, 6.5312
[0][3], 0.272, 0.8256, 2.1712, 4.448, 9.1088
[1][0], 0.0, 0.0, 0.1136, 1.0196, 1.3596
[1][1], 0.0040, 0.2244, 0.346, 0.3552, 0.5244
[1][2], 0.0064, 0.1848, 0.1736, 0.1388, 0.41
[1][3], 0.0232, 0.084, 0.1372, 0.3028, 0.5052
[2][0], 0.0, 0.0, 0.1384, 1.2248, 2.8024
[2][1], 0.0, 0.0, 0.0, 0.036, 1.0528
[2][2], 0.0, 0.0, 0.0, 0.0, 0.2944
[2][3], 0.0, 0.0, 0.0, 0.0, 0.0072
time, [3]
728906.4166666666, 728906.4583333334, 728906.5
lat, [4]
35.6875, 35.8125, 35.9375, 36.0625
lon, [5]
-87.1875, -87.0625, -86.9375, -86.8125, -86.6875
The expression apcpsfc[802:804][85:88][302:306] is an array expression; the numbers
are array indexes, starting from 0; and "apcpsfc" is the variable name for "precipitation
hourly total”.
The dimension information is listed at the end of the results page. For this example, they
are time, latitude, and longitude.
The time indexes, "728906.4166666666, 728906.4583333334, 728906.5," are for
days referenced from 00z01Jan0001. For this NLDAS-1 Hourly Forcing Data,
corresponding time steps are 10Z03SEP1996, 11Z03SEP1996, and 12Z03SEP1996.
Data Interpretation
Data Access
The NASA GES DISC maintains archives of all NLDAS data products and many other
Hydrology data sets. The archived data can be accessed via FTP network transfer.
NLDAS-1 data can be accessed via the GES DISC’s Hydrology Data and Information
Services Center (HDISC), http://disc.gsfc.nasa.gov/hydrology.
North America Land Data Assimilation System Phase 1 (NLDAS-1) Products README
16
Data Volume
Data Set Resolution Hourly Monthly
Files/Day Vol/Year Files/Year Vol/Year
Forcing 0.125 × 0.125 24 21.5 GB 12 33 MB
The monthly climatology data set has total 12 files with total volume about 33 MB.
Search and download data via Mirador
NLDAS data can be searched through a keyword (e.g., Mosaic) and the time span, and
downloaded in a batch mode via Mirador, http://mirador.gsfc.nasa.gov/.
Mirador is a fast interface for searching Earth science data at NASA GES DISC.
Access data via GrADS Data Server (GDS)
The NLDAS products are accessible via the GDS at http://hydro1.sci.gsfc.nasa.gov/dods/.
The GDS is a stable, secure data server that provides subsetting and analysis services
across the internet. The GDS supports any operation that can be expressed in a single
GrADS expression, including basic math functions, averages, smoothing, differencing,
correlation, and regression. (See the example in Retrieve Data through the GrADS Data
Server (GDS) above.)
Anonymous ftp
The hourly NLDAS-1 data can be downloaded directly via the GES DISC anonymous
ftp: ftp://hydro1.gsfc.nasa.gov/data/s4pa/NLDAS/.
Data Services
On-the-Fly (OTF) Parameter and Spatial Subset
For example, a user selects three days of NLDAS Phase1 (NLDAS-1) data from Mirador
by entering the begin date and the end date of the desired time range. Then the user
proceeds by clicking on the Search GES-DISC button. On the next screen, the user clicks
Select All, followed by Add Selected Files to Cart. The following screen will appear:

North America Land Data Assimilation System Phase 1 (NLDAS-1) Products README
17
Then, from the list of Available Services, the user can select Subset Spatially and/or by
Parameter, which leads to a new page that allows parameter selection and the spatial
region-of-interest to subset. In the current example, the user selects Subset Spatially
and/or by Parameter for “NLDAS Primary Forcing (NLDAS_FOR0125_H.001),” which
leads to a page for the NLDAS_FOR0125_H.001 parameter and spatial selections, shown
below:

North America Land Data Assimilation System Phase 1 (NLDAS-1) Products README
18
After the user has specified the spatial region and selected the parameters of interest,
clicking the Submit Selected Criteria button leads to an updated page listing all selected
data sets (three in this example) and services, shown below:

North America Land Data Assimilation System Phase 1 (NLDAS-1) Products README
19
From the updated page, the user can continue selecting Subset Spatially and/or by
Parameter for another data set if selected more than one product, or click the Continue to
Shopping Cart button. If the latter option is chosen, then the user sees the selected
product in the shopping cart, shown below:
The “Checkout” button leads to a batch download interface for the subsetted files. The
subsetted data are in the GRIB format, same as that of the original NLDAS products.
Online Visualization and Analysis in Giovanni
Giovanni is a Web-based application developed by the NASA GES DISC that provides a
simple and intuitive way to visualize, analyze, and access vast amounts of Earth science
remote sensing data without having to download the data.
All parameters from NLDAS hourly and monthly data sets are available via the Giovanni
NLDAS Hourly Portal and NLDAS Monthly Portal respectively.
Users simply select one or more parameters, spatial and temporal ranges, and the
visualization function, and then click on “Generate Visualization” button to get a result.
Seven visualization and analysis functions are available in the current instance:
animation, lat-lon map (time-averaged), correlation map, lat-lon map (time-averaged
differences), scatter plot, scatter plot (time-averaged), and time series. More advanced
services will be added in the future.
In the example of the NLDAS Hourly Portal below, a user selects area as 95W ~ 67W,
25N ~ 48N, parameter as the “Precipitation hourly total” from Primary Forcing, time
range as 08Z Sept. 02, 20011 to 12Z Sept. 09, 2011, and visualization type as the “Lat-
Lon Map, Time-averaged”, to exam the average precipitation rate of 2011 Tropical Storm
Lee, As shown below. “Edit Preferences” is available as well.

North America Land Data Assimilation System Phase 1 (NLDAS-1) Products README
20

North America Land Data Assimilation System Phase 1 (NLDAS-1) Products README
21
Then the user clicks on the “Generate Visualization” button and sees a resultant Lat-Lon
Map of average precipitation rate between Sept. 2 and Sept. 9 2011, shown below:
There are many user options available from the result page, i.e., “Download Data”,
“Product Lineage”, “Acknowledgement Policy”, “Edit Plot Preferences”, and “Refine
Constraints”. In this example, the user clicks on “Download Data” tab, and then sees a
page allowing downloading the data in HDF, netCDF, ASCII, and KMZ formats, shown
below:
North America Land Data Assimilation System Phase 1 (NLDAS-1) Products README
22
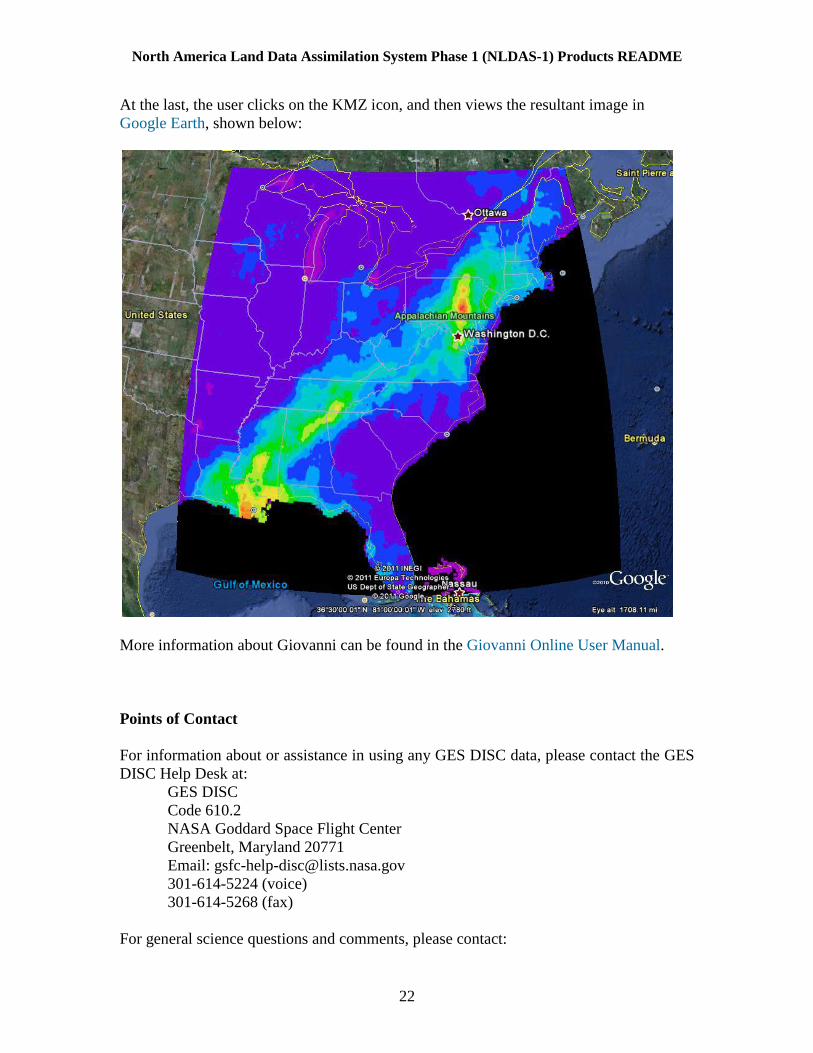
At the last, the user clicks on the KMZ icon, and then views the resultant image in
Google Earth, shown below:
More information about Giovanni can be found in the Giovanni Online User Manual.
Points of Contact
For information about or assistance in using any GES DISC data, please contact the GES
DISC Help Desk at:
GES DISC
Code 610.2
NASA Goddard Space Flight Center
Greenbelt, Maryland 20771
Email: [email protected]
301-614-5224 (voice)
301-614-5268 (fax)
For general science questions and comments, please contact:

North America Land Data Assimilation System Phase 1 (NLDAS-1) Products README
23
David M. Mocko
Hydrological Sciences Laboratory, Code 617
NASA Goddard Space Flight Center
Greenbelt, Maryland 20771
Email: [email protected]
301-614-6222 (voice)
301-614-6264 (fax)
Sponsor and Acknowledgement
The North America Land Data Assimilation System (NLDAS) project is funded in part
by NOAA’s Climate Prediction Program for the Americas (CPPA).

North America Land Data Assimilation System Phase 1 (NLDAS-1) Products README
24
References
Cosgrove, B.A., D. Lohmann, K.E. Mitchell, P.R. Houser, E.F. Wood, J.C. Schaake, A.
Robock, C. Marshall, J. Sheffield, Q. Duan, L. Luo, R.W. Higgins, R.T. Pinker,
J.D. Tarpley, and J. Meng, 2003: Real-time and retrospective forcing in the North
American Land Data Assimilation System (NLDAS) project. J. Geophys. Res.,
108(D22), 8842, doi:10.1029/2002JD003118.
Koster, R., and M. Suarez, 1994: The components of a SVAT scheme and their effects on
a GCM’s hydrological cycle. Adv. Water Resour., 17, 61–78.
Koster, R., and M. Suarez, 1996: Energy and water balance calculations in the Mosaic
LSM. NASA Tech. Memo., 104606, 9, 60 pp.
Kumar, S.V., C.D. Peters-Lidard, Y. Tian, P.R. Houser, J. Geiger, S. Olden, L. Lighty,
J.L. Eastman, B. Doty, P. Dirmeyer, J. Adams, K. Mitchell, E.F. Wood, and J.
Sheffield, 2006: Land Information System – An Interoperable Framework for
High Resolution Land Surface Modeling. Environ. Mod. & Soft., 21, 1402-1415.
Mahrt L., and M. Ek, 1984: The Influence of Atmospheric Stability on Potential
Evaporation. J. Appl. Meteor., 23(2), 222–234. doi:10.1175/1520-
0450(1984)023<0222:TIOASO>2.0.CO;2x.
Mitchell, K.E., D. Lohmann, P.R. Houser, E.F. Wood, J.C. Schaake, A. Robock, B.A.
Cosgrove, J. Sheffield, Q. Duan, L. Luo, R.W. Higgins, R.T. Pinker, J.D. Tarpley,
D.P. Lettenmaier, C.H. Marshall, J.K. Entin, M. Pan, W. Shi, V. Koren, J. Meng,
B.H. Ramsay, and A.A. Bailey, 2004: The multi-institution North American Land
Data Assimilation System (NLDAS): Utilizing multiple GCIP products and
partners in a continental distributed hydrological modeling system, J. Geophys.
Res., 109, D07S90, doi:10.1029/2003JD003823.
Peters-Lidard, C.D., P.R. Houser, Y. Tian, S.V. Kumar, J. Geiger, S. Olden, L. Lighty, B.
Doty, P. Dirmeyer, J. Adams, K. Mitchell, E.F. Wood and J. Sheffield, 2007:
High-performance Earth system modeling with NASA/GSFC's Land Information
System. Innov. Sys. and Soft. Eng., 3(3), 157-165.
Pinker, R.T., J.D. Tarpley, I. Laszlo, K.E. Mitchell, P.R. Houser, E.F. Wood, J.C.
Schaake, A. Robock, D. Lohmann, B.A. Cosgrove, J. Sheffield, Q. Duan, L. Luo,
and R.W. Higgins, 2003: Surface radiation budgets in support of the GEWEX
Continental-Scale International Project (GCIP) and the GEWEX Americas
Prediction Project (GAPP), including the North American Land Data Assimilation
System (NLDAS) project. J. Geophys. Res., 108(D22), 8844,
doi:10.1029/2002JD003301, 2003.

North America Land Data Assimilation System Phase 1 (NLDAS-1) Products README
25
Appendices
A. Description of Metadata
Table A.1. Collection level metadata
Metadata items
C1. Collection data description
1. ShortName
2. LongName
3. TemporalRange
4. SpatialCoverage
5. DataResolution
6. Format (e.g., GRIB1)
7. LandSurfaceModel
8. LandSurfaceModelVersionID
C2. ScienceParameter group (Parameters listed in Table 2)
Table A.2. Granule level metadata
Metadata items
G1. General description
1. GranuleID
2. GranuleDate
3. LatitudeResolution
4. LongitudeResolution
5. Format (e.g., GRIB1)
6. SizeBytesDataGranule
7. LandSurfaceModel
G2. Grib data description
1. SouthernmostLatitude
2. NorthernmostLatitude
3. WesternmostLongitude
4. EasternmostLongitude
5. BeginningDateTime
6. EndingDateTime
G3. ScienceParameter Group
1. ParameterShortName
2. ParameterLongName
3. Center
4. Subcenter
5. Process
6. Level (or Layer)
7. Height (or Pressure)
8. TimeRange
9. PeriodTime1
North America Land Data Assimilation System Phase 1 (NLDAS-1) Products README
26
10. PeriodTime2
11. ForecastTimeUnit
12. GridSize
13. ForecastAnalysisFlag
14. NumberGridsAverage
15. MinValueData
16. MaxValueData
G4. Ingest information
1. ProductionDateTime
2. InsertDateTime
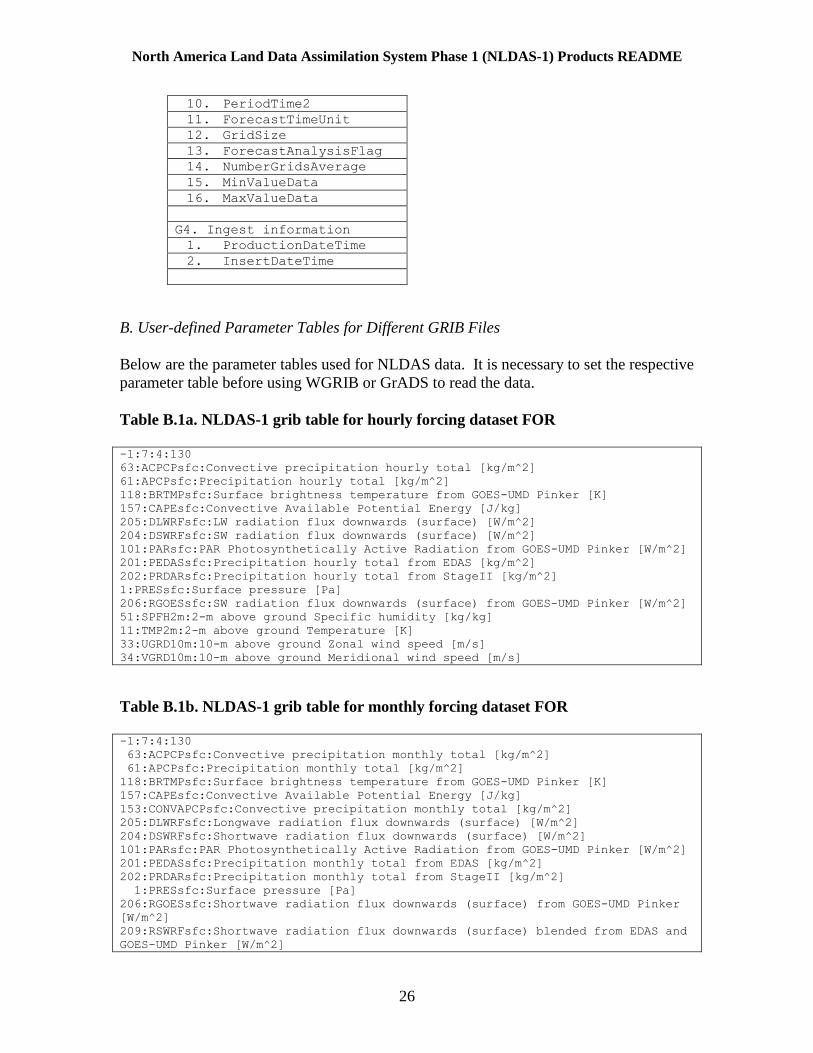
B. User-defined Parameter Tables for Different GRIB Files
Below are the parameter tables used for NLDAS data. It is necessary to set the respective
parameter table before using WGRIB or GrADS to read the data.
Table B.1a. NLDAS-1 grib table for hourly forcing dataset FOR
-1:7:4:130
63:ACPCPsfc:Convective precipitation hourly total [kg/m^2]
61:APCPsfc:Precipitation hourly total [kg/m^2]
118:BRTMPsfc:Surface brightness temperature from GOES-UMD Pinker [K]
157:CAPEsfc:Convective Available Potential Energy [J/kg]
205:DLWRFsfc:LW radiation flux downwards (surface) [W/m^2]
204:DSWRFsfc:SW radiation flux downwards (surface) [W/m^2]
101:PARsfc:PAR Photosynthetically Active Radiation from GOES-UMD Pinker [W/m^2]
201:PEDASsfc:Precipitation hourly total from EDAS [kg/m^2]
202:PRDARsfc:Precipitation hourly total from StageII [kg/m^2]
1:PRESsfc:Surface pressure [Pa]
206:RGOESsfc:SW radiation flux downwards (surface) from GOES-UMD Pinker [W/m^2]
51:SPFH2m:2-m above ground Specific humidity [kg/kg]
11:TMP2m:2-m above ground Temperature [K]
33:UGRD10m:10-m above ground Zonal wind speed [m/s]
34:VGRD10m:10-m above ground Meridional wind speed [m/s]
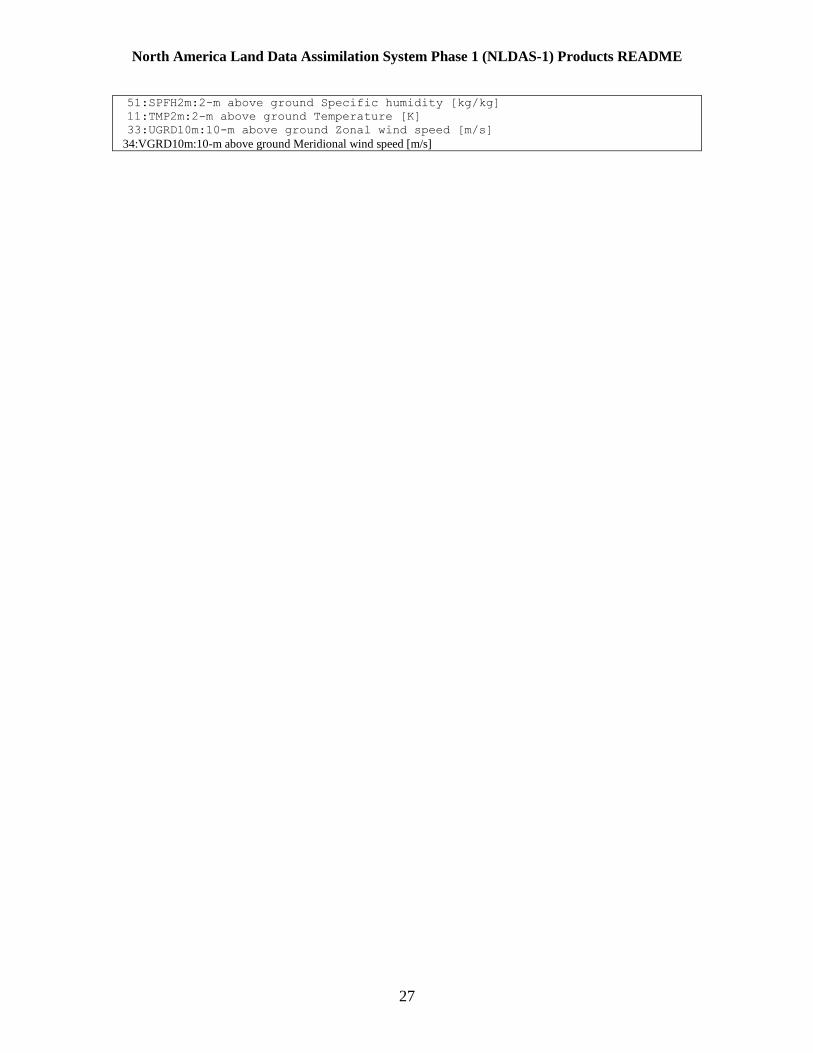
Table B.1b. NLDAS-1 grib table for monthly forcing dataset FOR
-1:7:4:130
63:ACPCPsfc:Convective precipitation monthly total [kg/m^2]
61:APCPsfc:Precipitation monthly total [kg/m^2]
118:BRTMPsfc:Surface brightness temperature from GOES-UMD Pinker [K]
157:CAPEsfc:Convective Available Potential Energy [J/kg]
153:CONVAPCPsfc:Convective precipitation monthly total [kg/m^2]
205:DLWRFsfc:Longwave radiation flux downwards (surface) [W/m^2]
204:DSWRFsfc:Shortwave radiation flux downwards (surface) [W/m^2]
101:PARsfc:PAR Photosynthetically Active Radiation from GOES-UMD Pinker [W/m^2]
201:PEDASsfc:Precipitation monthly total from EDAS [kg/m^2]
202:PRDARsfc:Precipitation monthly total from StageII [kg/m^2]
1:PRESsfc:Surface pressure [Pa]
206:RGOESsfc:Shortwave radiation flux downwards (surface) from GOES-UMD Pinker
[W/m^2]
209:RSWRFsfc:Shortwave radiation flux downwards (surface) blended from EDAS and
GOES-UMD Pinker [W/m^2]
North America Land Data Assimilation System Phase 1 (NLDAS-1) Products README
27
51:SPFH2m:2-m above ground Specific humidity [kg/kg]
11:TMP2m:2-m above ground Temperature [K]
33:UGRD10m:10-m above ground Zonal wind speed [m/s]
34:VGRD10m:10-m above ground Meridional wind speed [m/s]
North America Land Data Assimilation System Phase 1 (NLDAS-1) Products README
28
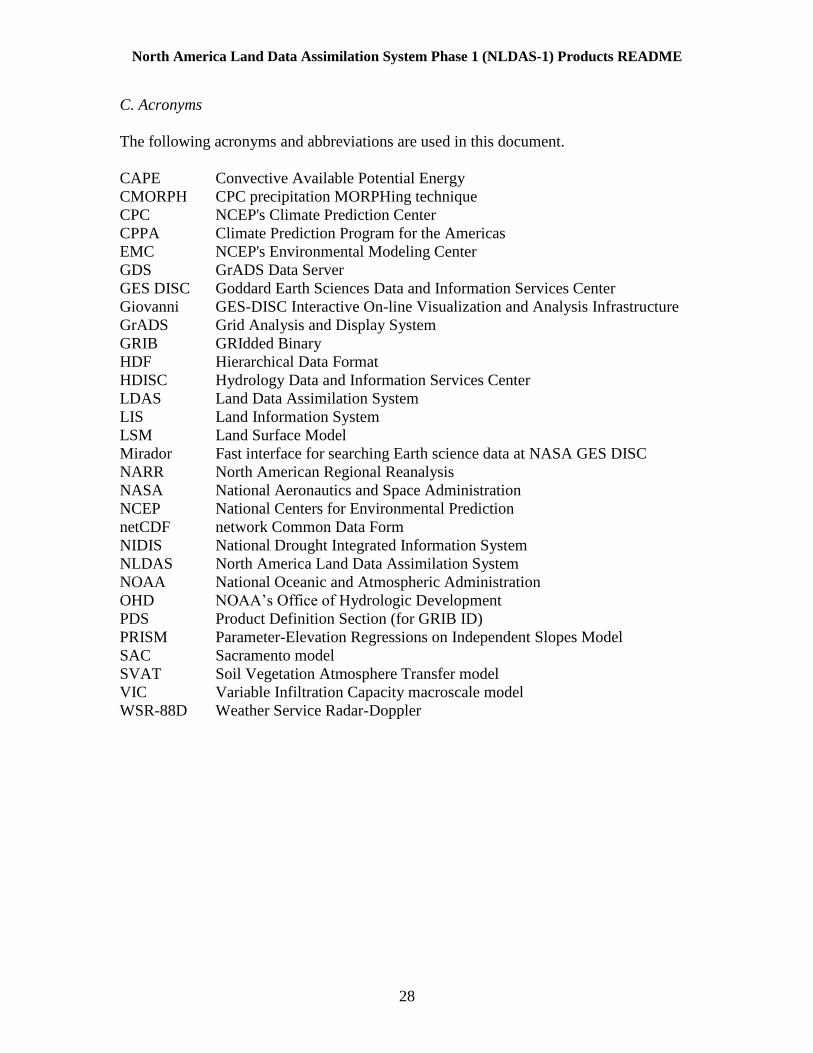
C. Acronyms
The following acronyms and abbreviations are used in this document.
CAPE Convective Available Potential Energy
CMORPH CPC precipitation MORPHing technique
CPC NCEP's Climate Prediction Center
CPPA Climate Prediction Program for the Americas
EMC NCEP's Environmental Modeling Center
GDS GrADS Data Server
GES DISC Goddard Earth Sciences Data and Information Services Center
Giovanni GES-DISC Interactive On-line Visualization and Analysis Infrastructure
GrADS Grid Analysis and Display System
GRIB GRIdded Binary
HDF Hierarchical Data Format
HDISC Hydrology Data and Information Services Center
LDAS Land Data Assimilation System
LIS Land Information System
LSM Land Surface Model
Mirador Fast interface for searching Earth science data at NASA GES DISC
NARR North American Regional Reanalysis
NASA National Aeronautics and Space Administration
NCEP National Centers for Environmental Prediction
netCDF network Common Data Form
NIDIS National Drought Integrated Information System
NLDAS North America Land Data Assimilation System
NOAA National Oceanic and Atmospheric Administration
OHD NOAA’s Office of Hydrologic Development
PDS Product Definition Section (for GRIB ID)
PRISM Parameter-Elevation Regressions on Independent Slopes Model
SAC Sacramento model
SVAT Soil Vegetation Atmosphere Transfer model
VIC Variable Infiltration Capacity macroscale model
WSR-88D Weather Service Radar-Doppler
Top Related