


![NIH Public Access 1 Peter Gehlbach [Member, IEEE] James ... · The contraction of an ERM over time can result in the distortion of the *Research supported in part by NIH BRP grant](https://static.fdocuments.us/doc/165x107/5e4a8b9bfadeff6b4e45a5c9/nih-public-access-1-peter-gehlbach-member-ieee-james-the-contraction-of-an.jpg)


Languages
Pages
Legal


1
NIH-Supported Research Training NIH-Supported Research Training at the Post-Doctoral Career Stageat the Post-Doctoral Career Stage
Rod Ulane, PhD
NIH Research Training
4 October 2011
National Academy of Sciences
Washington, DC

2
ApproximateApproximate Numbers of Individuals in Research Training Numbers of Individuals in Research Training Supported with NIH Funds 2010Supported with NIH Funds 2010
Career Stage of Students, Trainees, Fellows, or Scholars
NIH Formal Training,
Fellowship or Career Programs
Research Project Grants
NIH's Own Laboratories
High School Students 500+ 450+
K-12, Community College, and College Science Teachers 400+
College Students and Post-Baccalaureate Students 3,000+ 2,100+ 700+
Pre-Doctoral Students 10,000+ 28,000+ 500+
Post-Doctoral Fellows 6,800+ 15,000+ 3,800+
Early Career Investigators 5,000+ 50+
Mid-Career and Senior Faculty 50+
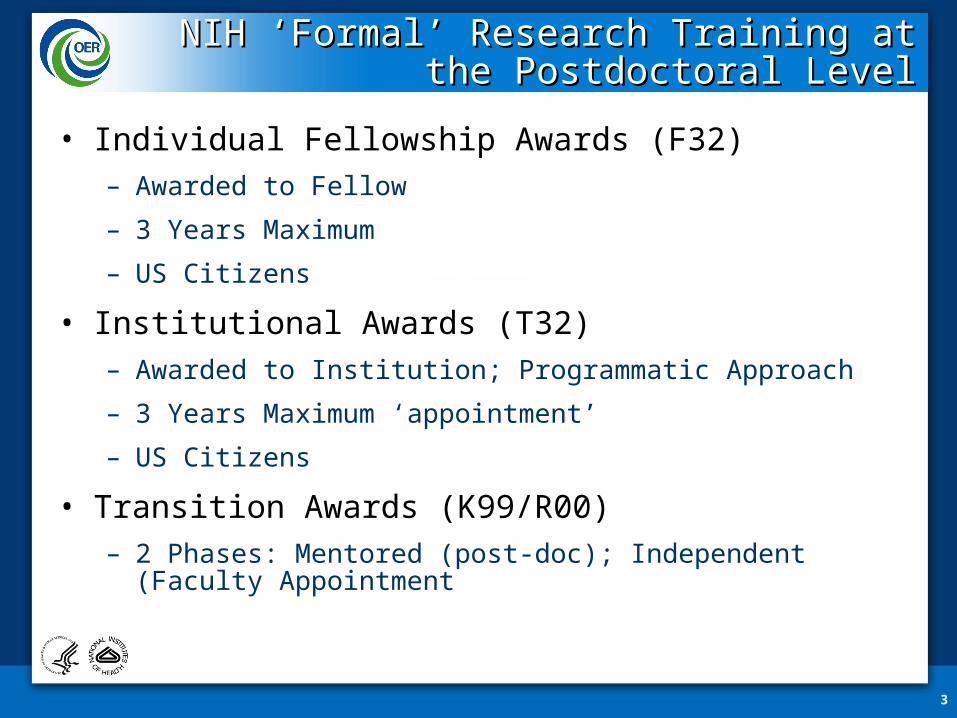
NIH ‘Formal’ Research Training at the NIH ‘Formal’ Research Training at the Postdoctoral LevelPostdoctoral Level
• Individual Fellowship Awards (F32)– Awarded to Fellow
– 3 Years Maximum
– US Citizens
• Institutional Awards (T32)– Awarded to Institution; Programmatic Approach
– 3 Years Maximum ‘appointment’
– US Citizens
• Transition Awards (K99/R00)– 2 Phases: Mentored (post-doc); Independent (Faculty
Appointment
3

Kirschstein-NRSA training grants and fellowshipsKirschstein-NRSA training grants and fellowships
Pre- and Post-Doctoral full-time training positions awarded

Demographics of NIH-Supported PhD Demographics of NIH-Supported PhD Recipients Recipients
• Median Time to Degree for Trainees 6.3 years
•
• Trainees Completing Their Degrees Within Ten Years 74.9%
•
• Median Age at Ph.D. 30
•
• Gender
• Female 54.6%
• Male 45.4%
•
• Race/Ethnicity
• American Indian/Alaska Native 0.6%
• Asian/Pacific Islander 10.5%
• African American 7.0%
• Hispanic 6.8%
• White 71%
• Other (including multi-race) 3.2%
• Unknown 1.0%
5
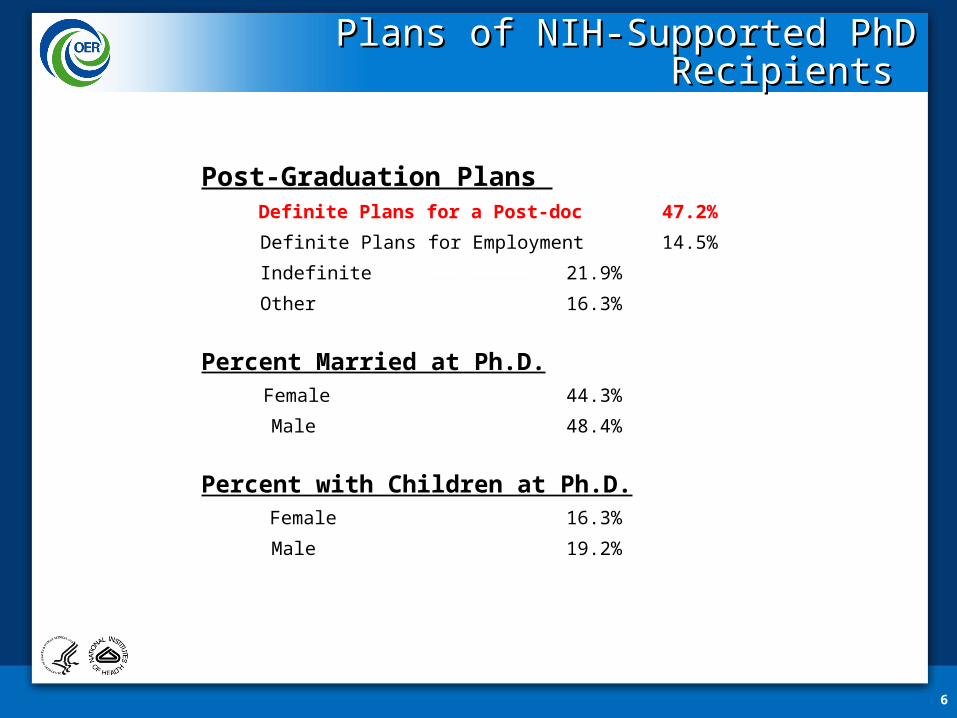
Plans of NIH-Supported PhD Recipients Plans of NIH-Supported PhD Recipients
Post-Graduation Plans Definite Plans for a Post-doc 47.2%
Definite Plans for Employment 14.5%
Indefinite 21.9%
Other 16.3%
Percent Married at Ph.D. Female 44.3%
Male 48.4%
Percent with Children at Ph.D. Female 16.3%
Male 19.2%
6

Kirschstein-NRSA post-doctoral fellowships (F32s)Kirschstein-NRSA post-doctoral fellowships (F32s)
Applications, awards, and success rates
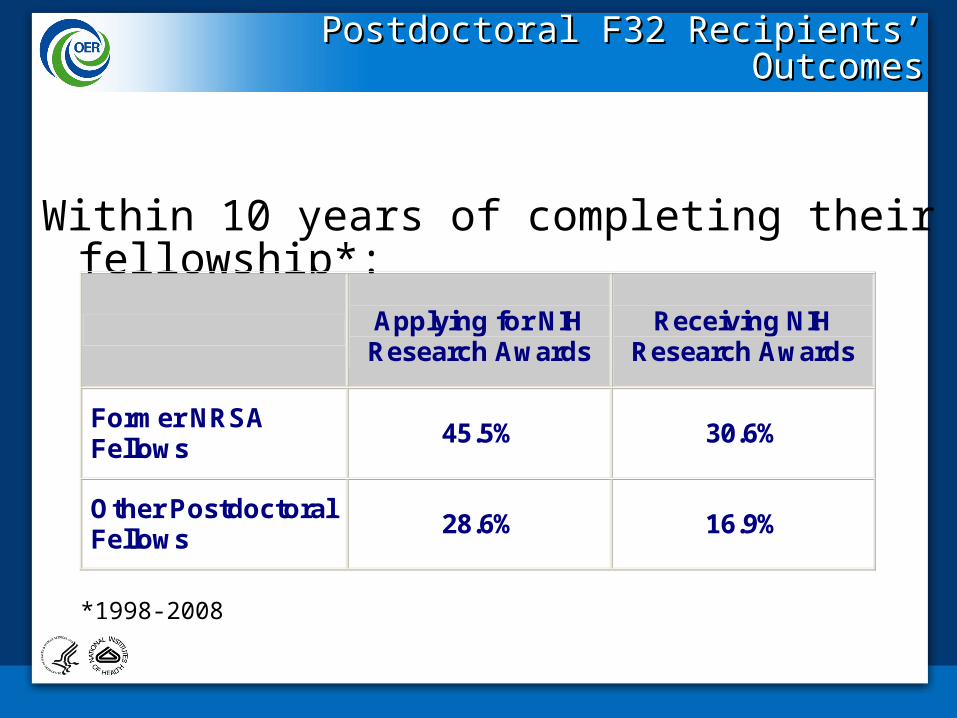
Postdoctoral F32 Recipients’ OutcomesPostdoctoral F32 Recipients’ Outcomes
Within 10 years of completing their fellowship*:
Applying for NIH Research Awards
Receiving NIH
Research Awards
Former NRSA Fellows
45.5% 30.6%
Other Postdoctoral Fellows
28.6% 16.9%
*1998-2008

9
The K99/R00 Award Since Its InceptionThe K99/R00 Award Since Its Inception
Year K99 Awards R00 Awards
2006 1
2007 (20%)* 183 4
2008 (23%) 180 64
2009 (29%) 204 157
2010 (24%) 194 166
*Success Rate

K99/R00 Awards in 2010 K99/R00 Awards in 2010
FY 2010 AwardeesNumber 194
Degree (% of Total) PhD
MD
MD/PhD
Other
88.1
3.6
6.7
1.5
Median Age (for those reporting)
PhD
MD
MD/PhD
34
36
35.5
Citizenship (% of total) U.S. citizen
Permanent resident
Non-citizen
55.2
17.5
27.3

Early Analysis of K99 ProgramEarly Analysis of K99 Program
• The median age at the time of K99 application was 34 years; MD and MD/PhD awardees were 1-3 years older.
• The median years from degree at the time of K99 application was 4 reflecting the large percentage of K99 awardees who have PhDs.
• For FY2007 and 2008 awardees, the median duration of the K99 phase was 22 months (defined as the time from start of the K99 award to the issuance of the R00 award). The committee recognizes that this definition probably overestimates the true duration because it is likely to include delays at the NIH in issuing R00 awards. The range of K99 duration was 6-50 months for FY2007 awards and 5-31 months for FY2008 awards.
• The vast majority of FY2007 (93%) and 2008 (82%) K99 awardees transitioned to the R00 phase. Most K99s transitioned to the R00 phase at an institution different from the K99 institution (FY2007, 75%; FY2008, 64%). However, MD and MD/PhD K99 awardees were less likely to move to a different institution for the R00 phase.
• R01s: 51% of the FY2007 K99 awardees had applied for R01s as of April 2011 when the data set was generated, and 14% had been awarded R01s. The median age at receipt of the R01 was 37 years, with a median of 7 years from terminal degree at the time of R01 receipt. 21% of the FY2008 K99 awardees had applied for R01s as of April 2011 when the data set was generated, and 4% had been awarded R01s. The median age at receipt of the R01 was 37 years, with a median of 7 years from terminal degree at the time of R01 receipt.
• We compared the median age and median years from degree for NIH R01 equivalent (R01 and DP2) awards for early-stage investigators in FY2010. Overall the median age for ESIs was 39 years, and these ESIs were 8 years from their terminal degree at the time of award.
11

Postdoctorates, by citizenship and degreePostdoctorates, by citizenship and degree

Primary source of support for postdoctoratesPrimary source of support for postdoctorates

Primary source of support for postdoctorates in the biomedical sciencesPrimary source of support for postdoctorates in the biomedical sciences

Recent Developments
15

NIH Director's Early Independence Award NIH Director's Early Independence Award
• Highly selective for PhDs, MD/PhDs, or MDs who are ready for independent work upon completion of the doctorate degree or residency
• $250,000 per year
• Independent Position
• Institution Must Provide Outstanding Supportive Environment
• Candidates/Institution Must Represent Excellent Match
• Only 2 applications per Institution
16
The All Personnel Report: Getting a better picture of The All Personnel Report: Getting a better picture of the Biomedical Research Workforcethe Biomedical Research Workforce
• NIH adopted a new approach to reporting on research personnel two years ago
• The Senior/Key Personnel component in the Progress Report became the All Personnel Report and:– Collects information on all personnel involved in a
research project for one month or more of effort
– Requires User ID numbers for PD/PIs and post-docs in the NIH ‘Commons’ master registry

Issues of ConcernIssues of Concern
• Diversity in the Biomedical Workforce
19
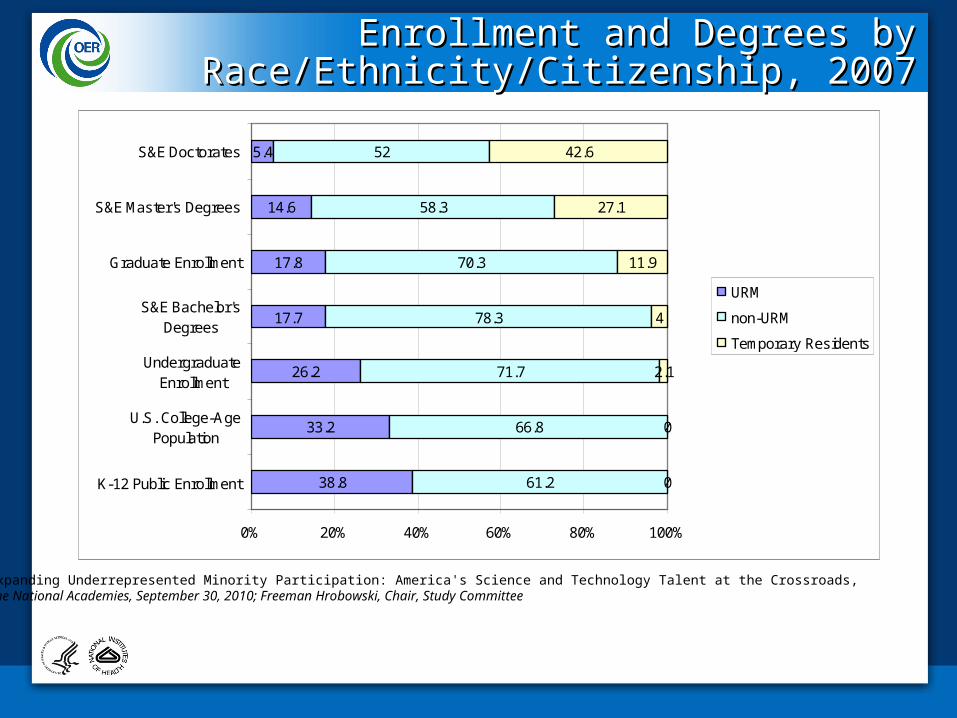
Enrollment and Degrees by Enrollment and Degrees by Race/Ethnicity/Citizenship, 2007Race/Ethnicity/Citizenship, 2007
38.8
33.2
26.2
17.7
17.8
14.6
5.4
61.2
66.8
71.7
78.3
70.3
58.3
52
0
0
2.1
4
11.9
27.1
42.6
0% 20% 40% 60% 80% 100%
K-12 Public Enrollment
U.S. College-AgePopulation
UndergraduateEnrollment
S&E Bachelor'sDegrees
Graduate Enrollment
S&E Master's Degrees
S&E Doctorates
URM
non-URM
Temporary Residents
Expanding Underrepresented Minority Participation: America's Science and Technology Talent at the Crossroads, The National Academies, September 30, 2010; Freeman Hrobowski, Chair, Study Committee

Primary source of federal support for full-time graduate students in the Primary source of federal support for full-time graduate students in the biomedical sciencesbiomedical sciences

Diversity: K-12Diversity: K-12
Status and Trends in the Education of Racial and Ethnic Groups
July 2010
National Center for Education Statistics
U.S. Department of Education
22

Educational Disparities Among Racial and Educational Disparities Among Racial and Ethnic GroupsEthnic Groups
Reading Achievement Levels by NAEP*
Percentage Scoring Below Basic**
23
4 th Grade 8th Grade 12th Grade
White 22% 16% 21%
AA/Hisp/Am Ind >50% 45% 45%
Asian-American 23% 20% 26%
*National Assessment of Educational Progress Exam**Data from: Status and Trends in the Education of Racial and Ethnic Groups,P 57, July, 2010.

Educational Disparities Among Racial and Educational Disparities Among Racial and Ethnic GroupsEthnic Groups
Percent of ACT Test-Taking Population Meeting ‘College Readiness’ Benchmark Scores in the areas of English, Math, Reading, and Science*:
White 27%
African Americans 3%
Hispanics 10%
Asian-Americans 33%
American Indians 11%
24
*Data from: Status and Trends in the Education of Racial and Ethnic Groups,P 87, July, 2010.
Other Issues of ConcernOther Issues of Concern
• Sustainability of ‘the system’
• Purpose and Outcomes of Research Training in 2010 and Beyond
• Retention of Clinician and Physician Scientists in Academic Medicine
• What Disciplinary, and what inter-, cross- and trans-disciplinary Training Should Be Initiated and how
• Who’s in Charge?
25
26
The GREAT GroupThe GREAT GroupNew OrleansNew Orleans
October 23October 23, , 20102010
Thank You
Rod Ulane

Primary mechanisms of graduate support in the biomedical sciencesPrimary mechanisms of graduate support in the biomedical sciences

Graduate enrollment among U.S. citizens and permanent residents, by Graduate enrollment among U.S. citizens and permanent residents, by race/ethnicityrace/ethnicity

Predoctoral Individual NRSA (F31)Predoctoral Individual MD/PhD NRSA
(F30)Postdoctoral Institutional Training (T32)Postdoctoral Individual NRSA (F32)
Small Grant (R03)
Research Project Grant (R01)
Independent Scientist Award (K02)
Senior Scientist Award (K05) )
Career StageCareer Stage Formal Training/Career AwardsFormal Training/Career Awards
GRADUATE/MEDICALSTUDENT
POSTDOCTORAL
EARLY
MIDDLE
SENIOR
CA
RE
ER
Predoctoral Institutional Training Grant (T32))
NIH Pathway to Independence (PI) Award (K99/R00)Mentored Research Scientist Development Award (K01)Mentored Clinical Scientist Development Award (K08)Mentored Patient-Oriented RCDA (K23)Mentored Quantitative RCDA (K25)
Midcareer Investigator Award in Patient-Oriented Research (K24) Exploratory/Develop-
ment Grant (R21)
Pre-Bac Pre-Bac Institutional Training Grant (T34)
Research Training and Career Development Support 2010
29
Training and CareerDevelopment on RPGs and Supplements
Research AwardsResearch Awards
$783M$688M

Postdoctorates, by citizenship and genderPostdoctorates, by citizenship and gender

Primary source of support for postdoctorates in the behavioral and social Primary source of support for postdoctorates in the behavioral and social sciencessciences

Research Project GrantsResearch Project Grants
Applications, awards, and success rates
Top Related