


Languages
Pages
Legal


NIGERIAN JOURNAL
OF
SOIL SCIENCE
VOLUME 22 (1)
2012
ISSN – 1597 – 4488
Published by the Soil Science Society of Nigeria.
FUNDED BY EDUCATION TRUST FUND

NIGERIAN JOURNAL OF SOIL SCIENCE
Members of the Editorial Board
Editor-in-Chief Prof. S. O. Ojeniyi
Deputy, Editor-in-Chief Prof. T. A. Okusami
Deputy, Editor-in-Chief Prof. D. O. Asawalam
Editor Dr. J. A. Odofin
Business Manager Prof. Akin Olayinka
Other Members Prof. U. C. Amalu
Dr. (Mrs.) F. I. Oluwatoyinbo
Prof. J. D. Kwari
Prof. A. S. Fasina
Editorial Assistants/ICT Prof. L. B. Taiwo
Dr. B. S. Ewulo
Ayo Ojeniyi
Officers of the Soil Science Society of Nigeria 2010-2012
President Prof. V. O. Chude
Vice President Prof. O. O. Agbede
General Secretary Prof. J. A. Adediran
Assistant General Secretary Prof. D. O. Asawalam
Treasurer Prof. B. A. Raji
Financial Secretary Prof. M. A. N. Anikwe
Editor-in-Chief Prof. S. O. Ojeniyi
Business Manager Prof. Akin Olayinka
Ex-officio Members Prof. I. E. Esu
Mr. C. O. Ezendu
Dr. (Mrs.) O. T. Ande
The Soil Science Society of Nigeria, founded in 1968, is a registered member of the
International Union of Soil Science.
The Society is responsible for the publication of the Nigerian Journal of Soil Science.
Membership of the Society is open to all persons (ordinary), institutions, private firms and
companies (Corporate) and Students interested in Soil Science.
Application forms and subscription for membership can be obtained from the Treasurer;
Prof. B. A. Raji, c/o Department of Soil Science, Ahmadu Bello University, Zaria, Nigeria.
Make all cheques payable to Soil Science Society of Nigeria. Purchase and payment for
journal should be directed to Business Manager at Department of Soil Science, Obafemi
Awolowo University, Ile – Ife, Osun State. Manuscripts should be sent to: The Editor-in-
Chief, Prof. S. O. Ojeniyi, Nigerian Journal of Soil Science, Department of Crop, Soil and
Pest Management, Federal University of Technology, Akure, Nigeria.
The Journal is Abstracted in: African Journal on line (ajoi) http//www.inasp.infolajoi.
ii

GUIDE TO CONTRIBUTORS
Contributors are invited from all parts of the world in any field of Soil Science and
should be original works which have not been published, accepted or submitted for
publication in any other journal.
Manuscripts should be written and typeset (in Ms Word) in English, typed in
quarto-size paper, double spaced and with wide margins. Three copies, the original and
two carbon copies should be sent to the Editor-in-Chief. In addition, diskette of the
accepted paper in MS Word will be required.
The major headings to use when preparing the manuscript should be Abstract,
Introduction, Materials and Methods, Results, Discussion, (or Results and Discussion) and
Acknowledgement, if any. Abstracts should be fully intelligible without reference to the
body of text and should not exceed 300 words. Sub-headings should be in italics.
Title headings and sub-headings should be concise and should be typed in small
letters. Titles should be followed by name(s) of author(s) and institutions. Tables should be
numbered in Arabic numerals and titles in small letters. Vertical lines should be avoided
and horizontal lines kept to a minimum,.
All lettering on diagrams and figures must be of good quality. Insert tables and
figures at appropriate places in text.
Reference should be arranged in alphabetical order of authors’ names at the end of
the paper. Each should be given in the following form: author’s name, year of publication,
title of paper, title of journal in full, volume number, first and last page e.g.
Braimah, A.K. (2000): Land evaluation for sorghum. Nigerian Journal of Soil
Science 12:4-11.
Kilmer V. J. (1990). Handbook of Soils and Climate in Agriculture. CRC Press,
Boca Ratio. In the text, reference should be given by the name of the author followed by the
year of publication in brackets. The letters, a, b, etc. should be used to distinguish between
papers published by the same author in a single year.
Authors are advised to consult latest issue of Nigerian Journal of Soil Science.
As a result of high cost of printing, the cost of publications of articles is borne by
contributors.
iii

NIGERIAN JOURNAL OF SOIL SCIENCE
VOLUME 22 (1), 2011
TABLE OF CONTENTS
Officers of the Soil Science Society of Nigeria/Subscription……………………….......... ii
Guide to Contributors……………………………………………………………............ iii
Table of Contents…………………………………………………………………............ iv
Acknowledgement………………………………………………………………….......... vi
Land Suitability Evaluation for Maize (Zea Mays) Cultivation in a Humid Tropical
Area of South Eastern Nigeria by Udoh, B. T and Ogunkunle, A. O. ..............................
1
Characterization and Classification of Soils of Ideato North Local Government Area by Onyekanne, C. F., Akamigbo, F. O. R. and Nnaji, G. U. .......................................
11
Degradation Effect of Palm Oil Mill Effluent (POME) on Physical and Chemical
Properties of the Soils of Uga, South Eastern Nigeria by Patience. O. Umeugochukwu,
Victor O. Chude and Ezeaku, P.............................................................................................
18
Impact of Soil Erosion on Land Degradation in Uga Southeastern Nigeria by O. P
Umeugochukwu, P. I. Ezeaku, V. O Chude, and G. U. Nnaji........................................
26
Characterization of Phosphorus Status in Soils of the Guinea Savanna Zone of
Nigeria by S.O. Amhakhian and I.O.Osemwota...................................................................
37
Physical and Chemical Properties of Soils in Kogi State, Guinea Savanna of Nigeria
by S.O. Amhakhian and I.O. Osemwota................................................................................
44
Oyster Shell Compost Effect on some Physical and Chemical Properties of an Inland
Valley Soil by Eneje, R.C. and Ukut, Asuama N...................................................
53
Effects of Rice Mill Waste and Poultry Manure on some Soil Chemical Properties
and Growth and Yield of Maize (Zea mays L.) by Eneje, R.C., and Uzoukwu, I. ..........
59
Assessment of some Soil Fertility Characteristics of Abakaliki Urban Flood Plains of
South-East Nigeria, for Sustainable Crop Production by Ogbodo, E.N. ..................
65
Effect of Tillage and Crop Residue on Soil Chemical Properties and Rice Yields on an
Acid Ultisol at Abakaliki Southeastern Nigeria by Ogbodo, E.N. and P.A.
Nnabude................................................................................................................................
73
Effect of Tillage and Crop Residue on Soil Physical Properties and Rice Yields on an
Acid Ultisol at Abakaliki Southeastern Nigeria by Ogbodo, E.N. and P.A.
Nnabude................................................................................................................................
86
iv

Soil Fertility Evaluation of Selected Aquic Haplustalfs in Ebonyi State, Southeast Nigeria by Ogbodo, E. N. and G. O. Chukwu......................................................................
97
Growth and Yield of Okra and Tomato as Affected by Pig Dung and other Manures Issue for Economic Consideration in Benue State by Olatunji, O and V.U. Oboh......................................................................................................................................
103
Effect of NPK and Poultry Manure on Cowpea and Soil Nutrient Composition by Olatunji, O., S. A. Ayuba, B.C. Anjembe and S. O. Ojeniyi...................................................
108
Suitability of Extractants for the Determination of Available Sulphur for Groundnut Production in Some Soils of Benue State, Nigeria by Bemgba Anjembe and M.T Adetunji....................................................................................................................................
114
Evaluation of Nutrient Restorative Ability of some Selected Crop and Soil Management Practices in Makurdi, Southern Guinea Savanna, Nigeria by Agber, P.I. and M.E. Obi............................................................................................................................
122
Shear Strength and Compaction Characteristics of Termite Mound Soil (TMS) by Manuwa, S.I. and Olawolu, O.E...........................................................................................
128
Testing the Goodness of Fit of Infiltration Models for Soils Formed on Coastal Plain Sands in Akwa Ibom State, Southeastern Nigeria by Ogban, P. I., Obi, J. C., Anwanane, N. B., Edet, R. U., and Okon, N. E..........................................................................................
134
Contaminant Limit (C/P Index) of Heavy Metals in Spent Oil Contaminated Soil Bioremediated With Legume Plants and Organic Nutrient by Udom B.E., Ano A. O. and Chukwu L. I. ..................................................................................................................
141
Characterization, Classification and Management of Olokoro Soils Umuahia, Abia State Nigeria for Increased Dioscorea dumetorum Yields. Onyekwere, I.N., Nwosu, P O., Ezenwa, M . I. S. and Odofin, A. J. ..................................................................................
150
Rheological Properties of Soil Groups in Central South-Eastern Nigeria in Relation to other Physical Properties by E.U. Onweremadu, B.N. Ndukwu, G.E. Osuji and M.A. Okon.........................................................................................................................................
158
Responses of Melon (Collocynthis citrullus ) and Soil Chemical Properties to Different N - Sources In Ado – Ekiti, Southwestern Nigeria by B. Osundare...................................
162
Assessment of Degradation Status of SoilS in Selected Areas of Benue State Southern Guinea Savanna of Nigeria by A.O. Adaikwu, M.E. Obi and A. Ali ..................................
198
Effects of Land Use Types on Soil Quality in A Southern Guinea Savanah, Nasarawa State of Nigeria by Amana, S. M; Jayeoba, O. J and Agbede, O. O. ....................................
178
Soil Properties and Response of Yam to Ash Application at Akure, Nigeria by Kayode, B.O., Ojeniyi, S. O and Odedina, S. A.…………………………………………..
183
Use of Agricultural Wastes for Improving Soil Crop Nutrients and Growth of Cocoa Seedlings by Akanni, D.; Odedina, S.A and Ojeniyi, S. O……………………….................
187
v
ACKNOWLEDGEMENT
The Editor-in-Chief acknowledges the contributions of the following colleagues,
researchers and scientists who reviewed papers submitted to the Nigerian Journal of Soil
Science.
Prof. M. T. Adetunji - UNAAB
Prof. F. K. Salako – UNAAB
Dr. J. K. Adesodun - UNAAB
Dr. J. O. Azeez - UNAAB
Dr. G. A. Ajiboye – UNAAB
Prof. O. O. Ajayi – FUTA
Prof. M. A. K. Smith – FUTA
Dr. S. O. Agele – FUTA
Prof. M. O. Alatise – FUTA
Dr. O. P. Aiyelari – FUTA
Prof. L. L. Lajide – FUTA
Dr. Ayodele Ajayi – FUTA
Dr. B. S. Ewulo – FUTA
Dr. M. A. Awodun – FUTA
Prof. A. O. Ogunkunle – UI
Dr. S. O. Oshunsanya – UI
Prof. A. S. Fasina – UNAAD
Dr. B. Osundare – UNAAD
Dr. O. J. Ayodele – UNAAD
Dr. L. B. Taiwo – IART Ibadan
Prof. T. Ibia – Uni Uyo
Dr. P. Ogban – Uni Uyo
Prof. O.O. Agbede – Nasarawa S. U.
Prof. V.O. Chude – NPFS Abuja
Prof. A. Olayinka – OAU
Prof. J. A. Adediran – IART Ibadan
Prof. O. Osonubi – UI
Dr. A. J. Odofin – FUT Minna
vi

LAND SUITABILITY EVALUATION FOR MAIZE (ZEA MAYS) CULTIVATION IN A
HUMID TROPICAL AREA OF SOUTH EASTERN NIGERIA
Udoh, B. T1* and Ogunkunle, A. O.2
1Department of Soil Science, University of Uyo, Uyo Akwa Ibom State, Nigeria
E-mail:[email protected]
GSM: 08032630790
*Corresponding Author 2Department of Agronomy, University of Ibadan, Nigeria
ABSTRACT
The land of Akwa Ibom State of Nigeria, under the humid tropical climate, was evaluated for
maize (Zea mays) cultivation by the FAO system. Data were obtained by field soil survey from
29 pedons in four major land types, covering about 40% of the state’s land mass. The result
showed that although certain land qualities/characteristics (e.g. mean annual temperature,
relative humility, topography, soil depth and total nitrogen), were optimum for maize cultivation,
there was no S1 (highly suitable) land for maize cultivation in the area. When assessed by the
non-parametric method (potentially), 76% of the pedons were moderately suitable (S2), 14%
were marginal (S3) and 10% were not suitable (N) for maize cultivation. But currently, 62% of
the pedons were marginal (S3) while 38% were not suitable (N). However, by the parametric
method (potentially and currently), there was neither S1 nor S2 land for maize cultivation in the
area. Potentially 93% of the pedons were marginally suitable (S3) while 7% were not suitable
(N); whereas currently 59% were marginal while 41% were not suitable. The most severe
constraints to maize cultivation in the area were climate (excessive annual rainfall) and soil
fertility (low exchangeable K).
INTRODUCTION
Maize (Zea mays), is the most efficient plant
for capturing the energy of the sun and
converting it to food. Maize provides a major
source of calories not only for humans but also
for animals in Nigeria as well as other parts of
the world. Use of maize for direct human
consumption as roasted cob, breakfast cereal,
pudding, soup, fermented paste, couscous, etc.,
has remained stable at about 100 million tones
per annum since 1988. About three quarters of
maize is transformed into meat, milk, eggs and
other animals products (Idem and
Showemimo, 2004). Thus, maize more than
any other crop offers the promise of meeting
Africa’s food needs in this millennium.
Climate and soil are the main environmental
factors that determine crops yields (Udoh et
al., 2006). Although maize is found to grow
throughout Nigeria under a wide range of
agro-climatic conditions, three broad agro-
ecological zones can be distinguished for
maize production. These are the forest, the
moist (or Guinea) savanna and the
forest/savanna transition zone (Idem and
SHowemimo, 2004). The Guinea savanna is
the most important maize growing zone in
1
Idoh and Ogunkunle NJSS/22(1)/2012

Nigeria. High insolation during the brief maize
growing season, relatively high rainfall
amount, high radiation, long dry season which
limits the incidence of pests and diseases, and
low night temperature characteristic of the
Northern Guinea Savanna, make this zone the
most favourable ecology for maize, provided
adverse soil conditions do not limit
production. This indicates that climate is the
most important factor in maize cultivation in
Nigeria.
In farming, risk is minimized by matching the
requirements of land use to land qualities. This
is the role of land evaluation and it implies a
process of prediction (Alves and Nortcliff,
2000). Application of the FAO Framework for
Land Evaluation (FAO, 1976), can identify the
most limiting land qualities and provide a
good basis for advising farmers on appropriate
management practice, for optimum production
in a particular agroecological zone (Chinene,
1992). Therefore, the present study was
designed to assess the potentials and
limitations of some climatic factors and soil
properties in the suitability of the land of
Akwa Ibom State, Southeastern Nigeria, for
maize cultivation under the humid tropical
climate.
MATERIALS AND METHODS
The study was carried out in Akwa Ibom State
located in the extreme south eastern Nigeria. It
lies within latitudes 4030’ and 5030’ N and
longitudes 7030’ and 8020’E. It covers an area
of 8,412Km2.
The climate is humid tropical with annual
rainfall varying from 3,000mm along the coast
to about 2250 mm at the extreme north, with 1
– 3 dry months in the year. Mean annual
temperature varies between 26 and 280C while
the relative humidity is 75 – 80%. The natural
vegetation comprises the lowland rainforest,
mangrove forest and coastal vegetation
(SLAK, 1989). The soils are formed mainly
from coastal plain sands and alluvial rich
sediments.
Field Survey
Four of the mapping units (M.Us) of Akwa
Ibom State soil map, called land types (LTs),
each covering 581 – 858km2, were selected for
the study. They were Essene, Etinan, Uyo and
Alluvial (LTs, I, II, III and IV, respectively).
Two study sites were located in each of the
M.Us. Soil identification was carried out by
detailed (rigid grid) soil survey of each study
site. Soil properties examined included colour,
texture, consistence, drainage, effective soil
depth, presence or absence of plinthite or
concretions and presence or absence of
mottles. Similar soils with respect to the above
properties were grouped into mapping units
which were represented by a standard profile
pit. The pits were described according to the
FAO (1990) guidelines, soil samples were
collected from each horizon in each soil
profile pit for laboratory analysis.
Laboratory Analysis and Soil Classification
Laboratory analyses of soil samples were
carried out using appropriate standard
procedures (Udo and Ogunwale, 1986; IITA,
1979; 1981). From the results of the laboratory
analysis and field morphological properties,
the 29 pedons encountered in the study area
were classified, following the USDA Soil
Taxonomy (Soil Survey Staff, 1999), from the
order level to subgroups and correlated with
FAO/UNESCO Legend (FAO, 1990).
Land Evaluation
The suitability of the 29 pedons for maize
cultivation was evaluated both by the
conventional (non-parametric) (FAO, 1976)
and the parametric method (Ogunkunle, 1993,
Udo et al., 2006).
For the non-parametric evaluation, pedons
were first placed in suitability classes by
matching their characteristics (Table 1) with
the established requirements (Table 2). The
final (aggregate) suitability class in Table 4 is
that indicated by the most limiting
characteristics of the pedon.
2
Land suitability for maize

For the parametric method each limiting
characteristic was rated (Table 3). The index
of productivity (IP) for each pedon was
calculated using the equation:
IP = A x B x C x…x F
100 100 100
Where: A is the overall lowest characteristic
rating and B, C…F are the lowest
characteristic ratings for each land quality
group (Udoh et al., 2006).
Both the potential index of productivity (IPP)
and current or actual index of productivity
(IPc) were calculated for each pedon using the
established class scores in Table 2. In each
pedon only one member of each of the five
land quality groups (climate (c); topography
(t); wetness (w); soil physical characteristics
(s) and soil fertility (f), was used in the
calculation because there are usually strong
correlation among members of the same group
(e.g. texture and structure in group ‘s’)
(Ogunkunle, 1993).
The basic difference between IPP and IPC, is
that while calculating IPP, exchangeable K,
available phosphorus and total nitrogen which
are easily altered, are not part of the ‘f’ group.
Whereas in calculating IPc, properties that are
easily altered, listed above, are taken into
consideration as well as the requirements for
potential fertility, i.e. those ‘f’ group members
which are not easily altered, e.g. cation
exchange capacity (CEC), base saturation, pH
and organic matter content.
RESULTS AND DISCUSSION
Land Qualities/Characteristics of the Study
Area and Land Use Requirements for
Maize Cultivation
The determination of land suitability classes,
using the FAO framework (1976), involves the
matching of land qualities/characteristics with
the land use requirements. The five land
quality groups used in this study are shown in
Table 1, and the land requirements for the four
suitability classes (S1, S2, S3 and N) for maize
cultivation, are shown in Table 2.
Climate (c)
Climatic parameters considered were annual
rainfall, length of dry season, mean annual
temperature and relative humidity. In Akwa
Ibom State, annual rainfall is a limiting factor
to maize cultivation. The result of matching
the land characteristics (Table 1) with the
requirements for maize cultivation (Table 2)
rated the land as being only 60% suitable for
maize cultivation as shown by the first seven
of the 29 pedons, presented in Table 3. This is
because annual rainfall amount (2,100mm) is
excessively higher than the requirement –
850mm (Sys, 1985).
Length of dry season (3 months or 90 days) is
good but is sub optimal (95%), compared to
the requirement (150 days). However, the
mean annual temperature and relative
humidity (Table 3) are optimum (rated 100%)
for maize cultivation.
3
Idoh and Ogunkunle NJSS/22(1)/2012

Table 1: Land qualities/characteristics of pedons from the study sites ----Climate (c) --------- Topog
(t)
Weth
(w)
Soil physical charact
(s)
…………………………………….….. Soil fertility
(f)
………………..………………….
LTa PNb RFc
(mm)
LDSd
(mon)
MTe
(0C)
RHf
(%)
Slope
(%)
Drainage Soil Dept
(Cm)
Coarse frag.
(Vol.%)
Tc Ex
Ca
Ex
Mg
Ex
K
CEC K
Mole
Frac
Mg:
K
B/s
(%)
Total
N
Org.
C
Avail P
Mgkg-1
pH
(KCI)
….(Cmol kg-1)... …..gkg1….
I 1 2100 3 26.8 79 0-2 Good >200 NIL SL .009 0.23 0.012 5.94 .002 2.0 12.6 0.36 1.8 9.2 4.2 2 2100 3 26.8 79 2-6 Good >200 NIL SL .12 .016 .010 5.83 .002 1.6 12.4 0.38 2.1 2.7 4.1
3 2100 3 26.8 79 6-13 Poor 73 NIL SL .06 .014 .013 6.28 .002 1.1 12.0 0.35 1.8 4.0 4.3
4 2100 3 26.8 79 2-6 Good >200 NIL SL .04 .011 .030 5.25 .006 0.4 9.9 0.69 2.8 20.7 4.2 5 2100 3 26.8 79 2-6 Good >200 NIL SL .08 .021 .006 5.41 .001 3.5 15.6 0.57 3.2 43.7 4.4
6 2100 3 26.8 79 6-13 Good >200 NIL SL .07 .029 .008 7.0 .001 3.63 8.5 0.82 4.0 11.0 4.1
7 2100 3 26.8 79 0-2 Modr >200 NIL SCL .28 .130 .019 6.85 .003 6.8 24.0 0.84 6.7 63.0 4.1 II 8 2100 3 26.8 79 0-2 Good >200 NIL SL .15 .030 .010 5.0 .002 3.0 23.0 0.30 1.2 46.7 4.3
9 2100 3 26.8 79 2-6 Good >200 NIL SCL .15 .013 .010 5.23 .002 1.3 7.7 0.48 2.4 58.1 4.0
10 2100 3 26.8 79 6-13 Poor >200 NIL S .05 .015 .013 2.6 .005 1.2 26.0 0.23 0.6 5.3 4.4 11 2100 3 26.8 79 0-2 Good >200 NIL LS .09 .024 .035 6.62 .005 0.7 23.1 0.58 1.2 60.0 4.0
12 2100 3 26.8 79 2-6 Modr 173 NIL S .15 .050 .051 12.7 .004 1.0 40.5 0.36 1.3 39.3 4.1
III 13 2100 3 26.8 79 0-2 Good >200 NIL SL .03 .070 .003 1.06 .003 2.3 9.3 0.40 2.5 6.8 4.0 14 2100 3 26.8 79 13-25 Good >200 NIL SCL .02 .009 .002 2.2 .002 2.25 6.3 0.51 2.2 2.0 4.0
15 2100 3 26.8 79 6-13 Good >200 NIL LS .02 .007 .004 8.5 .004 0.23 17.0 0.42 2.0 16.1 4.0
16 2100 3 26.8 79 2-6 Good >200 NIL SL .05 .010 .002 5.0 .002 1.25 11.0 0.23 1.5 6.0 4.1 17 2100 3 26.8 79 6-13 Good >200 NIL SL .05 .009 .002 4.75 .002 1.13 11.2 0.40 1.7 6.3 4.2
18 2100 3 26.8 79 13-25 Good >200 NIL LS .05 .013 .001 7.05 .001 1.3 11.5 0.50 1.3 3.0 4.0
19 2100 3 26.8 79 2-6 Modr 105 NIL LS .12 .020 .012 3.6 .003 1.7 28.3 0.60 2.2 5.5 4.2
IV 20 2100 3 26.8 79 0-2 Good >200 NIL LS .05 .013 .02 11 .002 0.65 12.6 0.72 2.8 64.6 3.9
21 2100 3 26.8 79 2-6 Good >200 NIL SL .07 .030 .008 4.2 .002 3.75 14.1 0.44 2.0 71.4 4.1
22 2100 3 26.8 79 2-6 Good >200 NIL SL .07 .020 .009 4.0 .002 2.2 11.1 0.62 2.7 75.0 4.0 23 2100 3 26.8 79 6-13 Good >200 NIL SL .04 .30 .02 6.4 .003 1.5 9.2 0.41 2.0 76.5 4.1
24 2100 3 26.8 79 2-6 Good >200 NIL SCL .08 .025 .012 5.0 .002 2.1 9.5 0.45 1.6 35.2 4.1
25 2100 3 26.8 79 6-13 Good >200 NIL SL .01 .030 .010 7.6 .001 3.0 20.0 0.38 1.6 40.3 4.1 26 2100 3 26.8 79 2-6 Good <200 NIL LS .15 .067 .012 7.4 .002 5.6 29.0 0.68 2.7 87.0 4.5
27 2100 3 26.8 79 0-2 Good 134 + 25 SCL .09 .040 .010 7.0 .001 4.0 13.6 0.30 1.1 3.6 4.0
28 2100 3 26.8 79 6-13 Imp. . 125 + 25 SCL .11 .053 .011 6.5 .002 4.8 15.1 0.51 3.0 7.2 3.9 29 2100 3 26.8 79 0-2 v. POOR 15 NIL C .020 .800 .020 6.2 .003 40.0 45.0 0.51 2.6 22.0 3.9
a = Land type; b=Pedon no.; c= Rainfall; d=Length of dry season; e=Mean temperature; f=Relative humidity; g=Topography;
h=wetness; i = Textural class; j = Base Saturation; Ex=exchangeable
4
Land suitability for maize

Table 2: Land Use Requirements*for Maize
Ratings (%) According to Severity of Limitations
Land Quality and Characteristics 100 – 95 (SI)
94 – 85 (S2)
84 – 40 (S3)
39 – 20 (NI)
19-0 (N2)
1. Climate (c): Annual rainfall (mm)
850 – 1250
850 – 750 1250-1600
750 – 600 1600-1800
600 – 500 >1800
- -
Length of dry season (days) 150 – 220 130 – 150 110 – 130 90 – 110 Mean annual maximum temp. (0C) 22 – 26 22 – 18
26 – 32 18 – 16 32+
36-30
Relative humidity (%) 50 – 80 50 -42 >80 2 Topography (t):
Slope (%) 0-2 0 – 4
2 – 4 4 – 8
4 – 8 8 – 16
8 – 16 16 – 30
>30 – 50
Wetness (w)*: Flooding Drainage
FO Good
Moderate Moderate
F1 Good
Aeric Poor
Poor Drainable
Soil Physical Characteristics (s): Texture / structure+
CL, L
SL, LS
LCS
CS, S
S
Coarse fragments (Vol.%), 0-10cm <3 3 – 15 15 – 35 35 – 55 - Fertility (f):
Cation exchange capacity (cmol.kg-1 clay) Base saturation (%) pH* organic carbon (%), 0 -15cm
<24 <50 5.5-7.0 >2
16 – 24 35 – 50 5.5-7.0 1.2 -2
<16(-) 20 – 35 5.0-8.0 0.8 -1.2
<16(+) <20 5.0-8.0 <0.8
- - - -
Av. P. (mg.kg-1) Total N. (%) Extr. K (cmol.kg-1)
>22 >0.15 >0.05
13-22 0.10-15 0.3 -0.5
7.13 0.08-01 0.2-0.3
3 -7 0.04-0.08 0.1-0.2
>3 >0.4 >0.1
Key: FO: No Flooding; F1: Seasonal flooded, CL: Clay loam; SL: Sandy Loam; LS: Loamy Sand, LCS: Loamy Coarse Sand; SCL: Sandy Clay Loam; S: Sand. Source: *Modified from Sys (1985).
5
Idoh and Ogunkunle NJSS/22(1)/2012

Topography and Soil Wetness (t and w)
The topography of Akwa Ibom State is
generally suitable for maize cultivation.
However, only eight (28%) of the 29 pedons
evaluated were optimum (slope = 0 – 4%) for
maize cultivation, 19 pedons (65%), were
rated as good (95%) to moderate (85%) while
two (or 7%) of the pedons were rated marginal
(60%) for maize cultivation.
In terms of soil wetness (drainage), 21 (or
72%) of the 29 pedons were rated as optimum
for maize cultivation, four pedons (or 14%)
were good to moderate; three pedons (or 10%)
were marginal; while one pedon (or 3%) was
not suitable for maize cultivation.
Soil Physical Characteristics (s)
Soil physical characteristics evaluated were
texture/structure, volume of coarse fragments
and soil depth. Matching the land qualities
(Table 1) with the requirements for maize
cultivation (Table 2), the land of Akwa Ibom
is optimum for maize cultivation in terms of
volume of coarse fragments and soil depth.
Only two (or 7%) of the 29 pedons (pedons 27
and 28) in terms of volume of coarse
fragments and 3 and 29 in terms of soil depth,
respectively (Table 1), were sub-optimal or not
suitable for maize cultivation.
However, soil texture is generally sub-
optimum for maize cultivation in the study
area. Whereas soil texture for optimum maize
performance is clay loam or loam (Sys, 1985),
most soils – 19 (or 66%) of the 29 pedons
were sandy loam or loamy sand and were rated
moderately (85%) suitable. Seven pedons
(24%) were sandy clay loam, rated as nearly
optimal (95% suitable); while three pedons
(10%) were sand and rated as not suitable for
maize cultivation.
Soil Fertility (f)
Both the potential and current soil fertility
were assessed. Under potential fertility are
chemical properties which are not easily
altered. These include cation exchange
capacity (CEC), base saturation and organic
matter content which was optimum (>2%) or
nearly so (0.8 – 1.2%) (Table 1). In almost all
the pedons, CEC and base saturation imposed
serious limitations on the suitability of the
soils for maize. Most of the soils were
marginal for maize cultivation in terms of
CEC (< 16cmolkg-1) and base saturation (<
20%) (Sys, 1985).
Current (or actual) soil fertility refers to
chemical fertility when properties that are
easily altered (exchangeable K, total N and
available P) are taken into consideration as
well as the requirements for potential fertility
already listed above (Ogunkunle, 1993).
The result of matching the land
qualities/characteristics (Table 1) with the
requirements for maize (Table 2) showed that
exchangeable K is one of the most serious
constraints to maize cultivation in Akwa Ibom.
Ninety percent of the soils are marginal and
10% are not suitable for maize cultivation (K
<0.02 cmolkg-1) (Enwezor et al., 1989,
Oluwatosin, 1991). Available P is optimum
(>22mg/kg) for over 50% of the soils, about
10% of the pedons were sub-optimum – 85%
suitable, while 40% of the pedons ranged from
marginal to not suitable due to available P
deficiency.
In terms of total nitrogen, about 90% of the
study area was optimum for maize cultivation
(total N > 0.15%) (Enwezor et al., 1989); 7%
of the soils were marginal while 3% was not
suitable for maize cultivation due to N
deficiency.
Land Suitability Classes in the Study Area
In Table 3 are the individual scores of the land
characteristics (seven of the 29 pedons
evaluated are presented here). This is the result
of matching the land qualities (Table 1) with
the land requirements (Table 2). Table 4 shows
a summary of the suitability aggregate scores
and suitability classifications under the
potential and current evaluation by the
parametric and non-parametric methods, for all
the 29 pedons identified in the study area.
6
Land suitability for maize

Table3: Suitability Class Scores of some of the pedons in the study area
Pedon
1
Pedon
2
Pedon
3
Pedon
4
Pedon
5
Pedon
6
Pedon
7
Climate (C)
Annual rainfall
Length of dry season
Mean annual temperature
Relative humidity
S3(60)
S1(95)
S1(100)
S1(100)
S3(60)
S1(95)
S1(100)
S1(100)
S3(60)
S1(95)
S1(100)
S1(100)
S3(60)
S1(95)
S1(100)
S1(100)
S3(60)
S1(95)
S1(100)
S1(100)
S3(60)
S1(95)
S1(100)
S1(100)
S3(60)
S1(95)
S1(100)
S1(100)
Topography (t):
Slope (%)
S1(100)
S1(100)
S2(85)
S1(95)
S1(95)
S2(85)
S1(100)
Wetness (w):
Drainage
S1(100)
S1(100)
S3(60)
S1(100)
S1(100)
S1(100)
S2(85)
Soil physical characteristics(s)
Texture and structure
Volume of coarse fragments
Soil depth
S2(85)
S1(100)
S1 (100)
S2(85)
S1(100)
S1 (100)
S2(85)
S1(100)
S1 (100)
S2(85)
S1(100)
S1 (100)
S2(85)
S1(100)
S1 (100)
S2(85)
S1(100)
S1 (100)
S2(95)
S1(100)
S1 (100)
Soil fertility (f):
Cation exchange capacity
Base saturation
Organic matter content
Exchangeable K
Available phosphorus
Total nitrogen
S3 (60)
S3 (60)
S1(95)
S3 (40)
S2 (85)
S1(100)
S3 (60)
S3 (60)
S1(100)
S3 (40)
N1 (20)
S1(60)
S3 (60)
S3 (60)
S1(100)
S3 (40)
N1 (20)
S3(60)
S3 (60)
S3 (60)
S1(100)
S3 (40)
S1 (100)
S1(100)
S3 (60)
S3 (60)
S1(100)
S3 (40)
S2 (100)
S1(100)
S3 (60)
S3 (60)
S1(100)
S3 (40)
S2 (85)
S1(100)
S3 (60)
S3 (85)
S1(100)
S3 (40)
S1 (100)
S1(100)
Aggregate suitability+:
Potential
Actual (current)
S3 (43)
S3 (29)
S3(42)
N2(14)
S3 (31)
N2(10)
S3(42)
S3(28)
S3(42)
S3(28)
S3(40)
S3(26)
S3(40)
S3(28)
+: Aggregate suitability class scores: 100-75 = S1, 74 – 50 = S2; 49 – 25=S3, 24-15 = N1; 0 = 12.
7
Idoh and Ogunkunle NJSS/22(1)/2012

Table 4: Suitability aggregate scores and suitability classifications of pedons for maize,
indicating limiting characteristics
Pedon
Potential Current
Parametric1 Non-Parametric1 Parametric1 Non-Parametric2
1 S3 (43) S2cf S3(29) S3f
2 S3 (42) S2cf N2(14) N1f
3 S3 (31) S2cwf N2(10) N1f
4 S3 (42) S2cf S3(28) S3f
5 S3 (40) S2cf S3(28) S3f
6 S3 (40) S2cf S3(26) S3f
7 S3 (40) S2cf S3(28) S3f
8 S3 (45) S2cf S3(30) S3f
9 S3 (42) S2cf S3(28) S3f
10 N2 (11) N1s N2(11) N1s
11 S3 (42) S3cf S3(28) S3f
12 S3 (28) N1s N2(13) N1s
13 S3 (29) S3f N2(14) N1f
14 N1 (23) S3f N2 (13) N1f
15 S3 (40) S2cf S3(28) N1f
16 S3 (42) S2cf S3(28) S3f
17 S3 (40) S2cf S3(26) N1f
18 S3 (33) S2cft N2(11)) N1f
19 N1 (22) S3f N1 (23) S3f
20 S3 (42) S2cf S3(28) S3f
21 S3 (42) S2cf S3(28) S3f
22 S3 (42) S2cf S3(28) S3f
23 S3 (40) S2cf S3(28) S3f
24 S3 (44) S2cf S3(26) S3f
25 S3 (42) S2cf S3(29) S3f
26 S3 (42) S2cf N1(14) S3f
27 S3 (43) S2cf S3(24) N1f
28 S3 (26) S2cf N1(14) S3f
29 N2 (9) N1sw N2(6) N1sw
1: Aggregate suitability class scores: 100-75 = S1; 74 – 50 = S2; 49 – 25 = S3; 24 – 15 = N1;
14 – 0 = N2.
2: C = Climatic limitation; f = Fertility limitation; w = wetness limitation; S=Soil physical
characteristic limitation.
Parametric Evaluation The result in Table 4 shows that by the parametric method, potentially, up to 86% (25 out of 29 pedons) of the soils in the study area is only marginally (S3) suitable while 14% (pedons 10, 14, 19 and 29; Table 4), are not suitable (N) for maize cultivation. However, currently (by the same parametric method), up to 41% (12 out of 29) of the pedons are not
suitable (N) while 59% (17 out of 29) of the pedons are only marginally suitable (S3) for maize cultivation. Non-Parametric Evaluation By the non-parametric evaluation, the area is shown to be more favourable to maize cultivation than the parametric method. However, none of the soils is in optimum (S1)
8
Land suitability for maize

condition for maize cultivation. Potentially, 76% (22 out of 29) of the pedons were moderately suitable (S2), 14% (4 out of 29 pedons) were marginal (S3); while 10% (pedons 10, 12 and 29; Table 4) were not suitable (N1 or N2) for maize cultivation. However, currently (by the non-parametric method), the situation is not as favourable as there was neither SI nor S2 land class for maize. About 62% (18 out of 29) of the pedons were only marginally suitable (S3) while 38% (11 out of 29) of the pedons were not suitable (N1 or N2) for maize cultivation. Major Limitations to Land Suitability for Maize The above analysis has shown that in Akwa Ibom State two of the five land qualities – topography (slope) and wetness (drainage) are optimum or nearly so for maize cultivation. Also mean annual temperature and relative humidity as aspects of climate are optimum for maize cultivation in the State. Furthermore, soil depth and volume of coarse fragments under soil physical characteristics are optimum for maize cultivation in the State. One of the most serious limiting characteristics to maize cultivation in the State is annual rainfall. The annual rainfall amount in the area of study is up to 2100 mm (Table 1) which is in excess of 850 – 1250 mm recommended as the optimum requirement for maize cultivation (Sys, 1985). This has rendered the entire State marginal for maize cultivation. Soil texture is another serious limitation to maize cultivation in the State. For optimum performance of maize crop, clay loam or loam texture is required (Sys, 1985). But in the area of the study, most of the pedons have sandy loam or loamy sand texture. Although the limitation is not very severe, it is of a general nature thereby rendering the entire area sub-optimal for maize cultivation. Furthermore, soil fertility is another land quality that severely limits maize production in the State. Both the potential fertility (e.g. CEC and base saturation), and current fertility,
particularly exchangeable K are serious constraints to maize cultivation in the State. Exchangeable K is generally below the critical level (0.2cmol/kg-1) (Enwezor, et al., 1989) in the entire State thereby rendering the land marginal for maize cultivation. With heavy rainfall and coarse soil texture – having poor nutrient holding capacity, as expressed by low CEC, the rate of leaching is high. This explains the low exchangeable bases, particularly K observed in these soils. Climate (excessive annual rainfall) is also a serious constraint to maize cultivation in the State because excessive moisture would encourage incidence of pests and diseases as well as hamper grain maturity and ripening. CONCLUSION The result of the study shows that inspite of the optimal or near optimal mean annual temperature, relative humidity, soil drainage and depth and total nitrogen, there is no highly suitable (S1) land for maize in the State. The State is mostly moderately to marginally suitable for maize. The most severe limitations to maize cultivation in the State are excessive annual rainfall, soil texture and chemical fertility – particularly CEC, base saturation and exchangeable K. In order to raise the productivity of the land to optimum for maize cultivation, management techniques to be adopted should enhance the nutrient and moisture holding capacity of the soil. Application of organic fertilizers/materials would enhance land productivity. Finally, in order to avoid yield reduction arising from incidence of pests and diseases, as a result of excessive rainfall during the growing season, appropriate drainage facilities should be put in place to take care of the excessive moisture and check the rising water table, while provision of irrigation facilities would make dry season farming possible. This would ensure optimum land productivity as a result of high insolation, relatively dry environment and therefore a favourable ecology for maize production.
9
Idoh and Ogunkunle NJSS/22(1)/2012

REFERENCES Alves, H. M. R. and Nortcliff S., 2000.
Assessing potential production of maize using simulation models for land evaluation in Brazil. Soil Use and Management, 16:49 – 55.
Chinene, V. R. N. 1992. Land evaluation using
the FAO Framework: An example from Zambia. Soil Use and Management, 8:130 – 139.
Enwezor, W. O., Udo, E. J. Usoroh, N. J.,
Ayotade, K. A., Adepetu, J. A.. Chude, V. O. and Udegbe, C. I. 1989. Fertilizer Use and Management Practices for Crops in Nigeria (eds), FMAWRRD, Lagos, 163pp.
FAO, 1976. A Framework for Land
Evaluation. FAO Soils Bull, 32: FAO, Rome, 87pp.
FAO. 1990. Guidelines for Soil Desriptions,
3rd Ed., FAO, Rome. FAO-UNESCO-ISRIC. 1990. Soil Map of the
World. Revised Legend Reprinted with Corrections. World Soil Resources Report. 60, FAO, Rome, 119p.
Idem, N. U. A. & Showeminmo, F. A. (eds)
2004. Cereal Crops of Nigeria: Principles of Production and Utilization, IAR, ABU, Zaria, xxii 337
IITA, (International Institute of Tropical
Agriculture). 1979. Selected Methods for Soil and Plant Analysis. IITA Manual Series, I, IITA, Ibadan, Nigeria, 60pp.
IITA, 1981. Automated and Semi-automated Methods for Soil and plant Analysis. Manual Series No.7, IITA, Ibadan, 33p.
Ogunkunle, A. O. 1993. Soil in Land
suitability evaluation: An example with oil palm in Nigeria. Soil Use and Management, 9(1): 35 – 40.
Oluwatosin, G. A. 1991. Land evaluation for
maize production in the basement complex area of the savanna zone of Western Nigeria. Ph.D. Thesis. Department of Agronomy, Univ. of Ibadan, Ibadan.
SLAK (Soil and Land Use Survey of Akwa
Ibom State). 1989. Technical Report. Govt. Printers, Uyo, 602pp.
Soil Survey Staff. 1999. Soil Taxonomy; a
basic system of soil classification for making and interpreting soil surveys. USDA Agric. Handbook. No. 436, Second edition. U. S. Govt. Printing Office, Washington D. C. 868pp.
Sys, C. 1985. Land Evaluation. Part I, II, III.
247pp. Publication No. 7 of the General Administration of Cooperation Development. Place de Champs de Mars 5, boite 57, 1050 Bruxelles.
Udo, E. J. and Ogunwale, J. A. 1986.
Laboratory Manual for the Analysis of Soil Plant and Water Samples. Dept. of Agronomy, Univ. of Ibadan, Nigeria.
Udoh, B. T., Ogunkunle, A. O. and Olaleye,
A. O. 2006. Land Suitability evaluation for banana/plantain (Musa spp.) cultivation in Akwa Ibom State of Nigeria. Journal of Research in Agriculture, 3(3): 1-6.
10
Land suitability for maize

CHARACTERIZATION AND CLASSIFICATION OF SOILS OF
IDEATO NORTH LOCAL GOVERNMENT AREA.
ONYEKANNE, C. F., AKAMIGBO, F. O. R. AND NNAJI, G. U1
Department of Soil Science, University of Nigeria, Nsukka. 1coressponding author - [email protected]
ABSTRACT
The soils of Ideato North local government Area in Imo State, Nigeria were mapped,
characterized and classified in order to provide information necessary for good land use
planning. Topographic map was used for the reconnaissance survey of the area and nine villages
within the local government area were selected for the study. They were Urualla, Akpulu,
Ndiuche, Ndiadimoha, Obodoukwu, Akokwa, Ndiawa, Umualoma and Osina, Nine profile pits
were dug and a total of 47 samples were collected from these locations. Selected soil physical
and chemical properties were determined. Soil textural classes identified in the area were sandy
loam, loamy sand, sand, sandy clay loam, and sandy clay. However dominant soil texture is
sandy clay loam. The soils were extremely acidic to strongly acidic ranging from pH of 4.0-5.4.
The base saturation of the soils ranged from low to moderate with values ranging from 9.48-
58.50 %. The CEC was generally low ranging from 4.00-18.00cmol./kg soil. The exchangeable
bases were low. The soils were classified as Arenic kandiudults, Plinthic kandiudults, Arenic
kandiudults, Aquic kandiudults, Arenic kandiudults, Arenic kandiudults, Typic kandiudults,
plinthic kandiudults, Arenic kandiudults for Urualla, Akpulu, Ndiuche, Ndiadimoha,
Obodoukwu, Akokwa, Ndiawa, Umualoma and Osina profiles respectively. Application of
mineral and organic fertilizers, liming and good management practices are necessary for
maximum productivity of these soils.
INTRODUCTION
Soils are very important natural resource. They
are the bases for most development projects it
is the foundation material for houses, roads
and buildings. They also, serve as purification
system for septic tank effluent, media for
establishment of lawn and the growth of
shrubs and garden. In order to ensure that the
soil is put to the most appropriate and
sustainable use there is every need for
characterization and classification of the soil.
Soil survey paves a way to soil
characterization, classification and evaluation.
Soil characterization, soil classification and
soil mapping, provide a powerful resource for
the benefit of mankind especially in the area of
food security and environmental sustainability
(Esu, 2004). Soil classification is the
systematic arrangement of soil into groups or
categories on the basis of their characteristics.
Soil characterization studies are major
building block for understanding the soil,
classifying it and getting the best
11
Onyekanne, Akamigbo and Nnaji NJSS/22(1)/2012

understanding of the environment. Soil
characterization provides the information for
our understanding of the physical, chemical,
mineralogical and microbiological properties
of soil. Each soil, based on its characteristics
has a predictable response to management or
any kind of manipulation (Ogunkule, 2004).
A sustainable land management system is the
one that does not degrade the soil or
significantly contaminate the environment
while providing necessary support to human
life (Greenland, 1994) and can only be
recommended after characterization,
classification and evaluation of the soil. There
is dearth of information on soils of Ideato
North Local government area in these regards.
Therefore, the objective of this study is to
characterize and classify the soils of Ideato
North Local Government Area of Imo State.
MATERIALS AND METHODS
Description of the study area
The study area falls within the humid tropical
zone. Jungerius, (1964) noted that the area has
uniformly high temperature and a seasonal
distribution of precipitation with humidity
being generally high except during the
desiccating weather of harmatan. Two major
seasons are the wet and dry seasons with the
former lasting for eight months (March –
October) and latter for four months (November
– February). Total annual rainfall ranges from
1,500 – 1800mm while the maximum
temperature ranges from 290C to 330C and
minimum temperature ranges from 20.80C to
22.80C
Field work The field work commenced on 29th July, 2010
and the following materials were used; spade,
machete, hoes, pike axe, sampling bags,
masking tape, permanent marker, digital
camera, munsell colour chart, hand-held global
positioning system tool (GPS), measuring
tapes, 4 pegs, dilute hydrochloric acid, (HCl).
A reconnaissance survey of the area was
carried out and with the aid of topographic
map and nine villages were chosen for the
study. They are Urualla, Akpulu, Ndiuche,
Ndiadimoha, Obodoukwu, Akokwa, Ndiawa,
Umualoma and Osina, all in Ideato North
Local Government Area of Imo State, South
Eastern Nigeria. The villages traversed the
entire local government area. From the field
assessment of auger soil samples one profile
pit was prepared and studied in each village. A
total of nine profile pits were studied. The
profiles were described following the guide
lines outlined in USDA-SCS (1974). Also, the
soils were classified according to the
comprehensive soil classification system (Soil
Taxonomy).
Laboratory analysis
Soil samples were air dried and sieved with
2mm sieve. Particle size analysis was
determined by Bouyoucos hydrometer method.
The pH was determined using glass electrode
digital consort pH meter. Organic carbon
content was determined by the wet dichromate
method and organic matter was calculated by
multiplying organic carbon with 1.724. Cation
exchange capacity (CEC) was determined by
using ammonium acetate method, calcium and
magnesium were determined by the
complexometric titration method. Sodium and
potassium were determined in the 1N
ammonium acetate leachate using the flame
photometer. Exchangeable hydrogen and
aluminum were determined by the titrimetric
method using 1N KCl extract. Percentage base
saturation was calculated as follow- total
exchangeable bases/CEC X 100. Available
Phosphorous was determined by the Bray II
Method. Total N was determined by the
kjeldahl wet oxidation method. Boron was
determined by Carmine method. Lead was
determined by calorimetric determination
using Sulphide method. Iron was determined
by calorimetric determination using
12
Characterization and classification of Ideato soils

Orthorphenanthroline. Cadmium was also
determined using spectrophotometer
RESULTS AND DISCUSSION
Soil physical properties.
The physical properties of soils are presented
in Tables 1-3. Most of the soils are dominated
by sand fraction, with sand content being
higher than 50% in all soil horizons. The sand
content decreased down the profile for most
profiles. The texture of the soils falls within
these textural classes – sand, sandy clay loam,
sandy loam, sandy clay and loamy sand.
Generally, the texture of the soil did not
change for a relatively short time (Brady and
Weil, 1999) hence the parent material from
which soils form has significant influence on
soil texture (Nnaji et al., 2002). The soils of
the study area might have developed from
sandstone and quartzite parent material. Such
parent materials are capable of impacting
coarse texture to the soil. High and intense
rainfall experienced in the area might have
resulted in clay illuviation down the profile.
Table 1: Particle size distribution of soils from Urualla, Akpulu and Ndiuche
Profiles depth Clay
(%)
Silt
(%)
Fine sand
(%)
Coarse
sand (%)
Total sand
(%)
Texture
P1
Urualla 0 – 15
12.76
8.56
25.12
53.56
78.68
sandy loam
15 – 70 5.76 4.56 36.12 53.56 89.68 loamy sand
70 – 90 5.76 2.56 20.88 70.80 91.68 Sand
90 – 160 17.76 6.56 27.38 48.30 75.68 sandy loam
160 – 180 11.76 8.56 28.62 51.06 79.68 sandy loam
P2
Akpulu 0 – 20
17.76
10.56
32.56
38.82
71.68
sandy loam
20 – 50 25.76 8.56 30.50 35.18 65.68 sandy clay loam
50 – 10 25.76 18.56 17.16 38.52 55.68 sandy clay loam
100 – 120 25.76 8.56 20.18 45.50 65.68 sandy clay loam
P3
Ndiuche 0 – 20
5.76
4.56
29.08
60.60
89.68
loamy sand
20 – 49 13.76 2.56 39.04 44.64 83.68 loamy sand
49 – 90 25.76 2.56 24.06 47.62 71.68 sandy clay loam
90 – 140 25.76 2.56 28.32 43.36 71.68 sandy clay loam
140 – 190 29.76 6.56 18.52 45.16 63.68 sandy clay loam
13
Onyekanne, Akamigbo and Nnaji NJSS/22(1)/2012

Table 2: Particle size distribution of soil Ndiadimoha, Obodoukwu and Akokwa Profiles depth (cm) Clay
(%)
Silt
(%)
Fine sand
(%)
Coarse sand
(%)
Total sand
(%)
Texture
P4
Ndiadimoha 0 – 20
20 – 50
50 – 70
70 – 100
100 – 140
140 – 180
5.76
11.76
11.76
35.76
41.76
35.76
8.56
12.56
12.56
8.56
6.56
14.56
74.40
63.46
64.44
48.1
42.68
41.80
11.28
12.22
11.24
7.58
9.00
7.88
85.68
75.68
75.68
55.68
51.68
49.68
loamy sand
sandy loam
sandy loam
sandy clay
sandy clay
sandy clay loam
P5
Obodoukwu 0 – 20
20 – 30
30 – 65
65 – 80
80 – 130
130 – 200
25.76
33.76
21.76
25.76
27.76
29.76
11.28
11.28
5.28
5.28
7.28
5.28
15.40
11.24
11.22
12.42
9.92
12.24
47.56
43.70
61.74
60.54
55.04
52.72
62.96
54.96
72.96
72.96
64.96
64.96
sandy clay loam
sandy clay loam
sandy clay loam
sandy clay loam
sandy clay loam
sandy clay loam
P6
Akokwa 0 – 25
25 – 80
80 – 120
120 – 155
155 – 200
15.76
9.76
21.76
21.76
17.76
5.28
11.28
3.28
3.28
3.28
6.66
14.46
11.72
15.48
17.96
72.30
64.50
63.24
59.48
61.00
78.96
78.96
74.96
74.96
78.96
sandy loan
sandy loam
sandy clay loam
sandy clay loam
sandy loam
Table 3: Particle size distribution for soils from Ndiawa, Umualoma and Osina Profile depth Clay
(%)
Silt
(%)
Fine sand
(%)
Coarse sand
(%)
Total sand
(%)
Texture
p7
Ndiawa 0 – 18
11.76
13.28
64.60
10.36
74.96
sandy loam
18 – 40 11.76 17.28 63.80 7.16 70.96 sandy loam
40 – 80 11.76 13.28 67.74 7.22 74.96 sandy loam
80 – 110 19.76 9.28 67.82 3.14 70.96 sandy clay loam
110 – 143 25.76 19.28 48.42 6.54 54.96 sandy clay loam
143 – 186 29.76 5.28 53.72 11.24 64.96 sandy clay loam
p8
Umualoma 0 – 20
9.76
15.28
65.62
9.34
74.96
sandy loam
20 – 40 25.76 9.28 53.62 11.34 64.96 sandy clay loam
40 – 90 35.76 9.28 46.18 8.78 54.96 sand clay
90 – 140 43.76 5.28 40.92 10.04 50.96 sandy clay
140 – 180 37.76 7.28 48.88 6.08 54.96 sandy clay
p9
Osina 0 – 23
13.76
7.28
16.50
62.46
78.96
sandy loam
23 – 49 29.76 5.28 15.64 49.32 64.96 sand clay loam
49 – 85 31.76 11.28 13.44 43.52 56.96 sand clay loam
85 – 120 29.76 5.28 24.14 40.82 64.96 sand clay loam
120 – 200 33.76 11.28 18.56 36.40 54.96 sand clay loam
Soil Chemical Properties The chemical properties of the soils are given
in Tables 4, 5 and 6. The soils were acidic with
pH ranging from 4.0-5.4. The high acidic
nature of the soils may be due to high intensity
rainfall in the area, which leaches basic cations
down the profile. Enwezor et al (1981) stated
that leaching of Ca and Mg is largely
14
Characterization and classification of Ideato soils
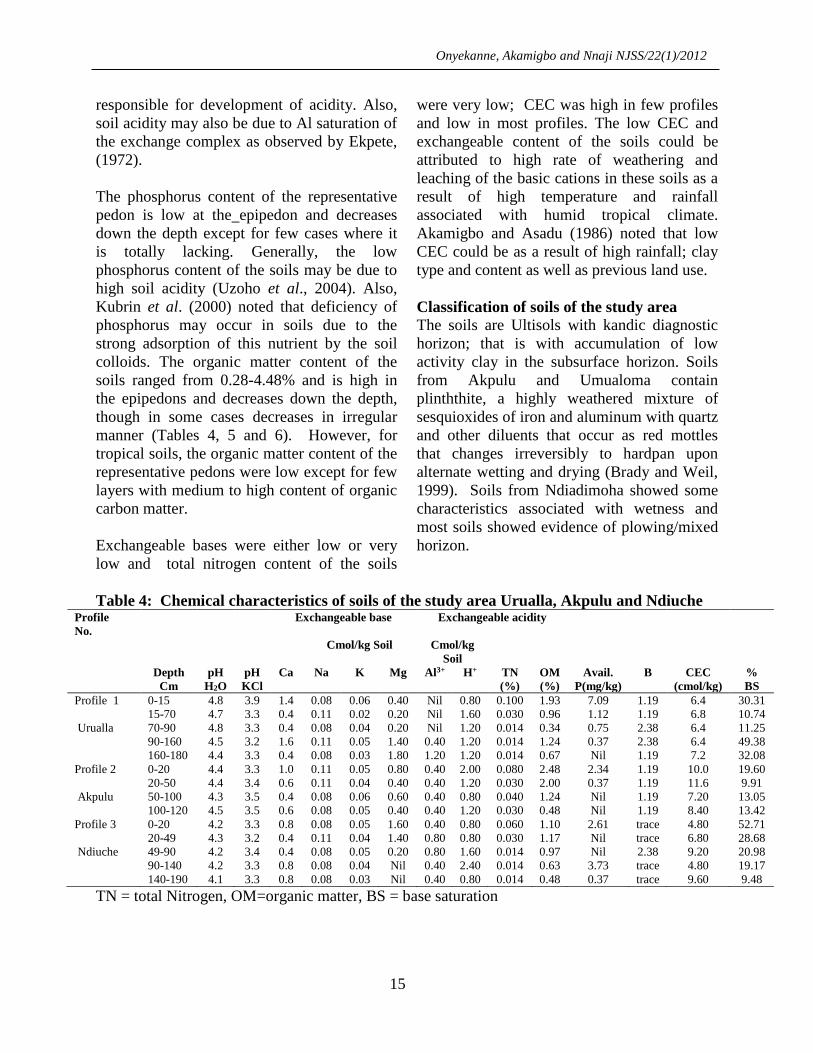
responsible for development of acidity. Also,
soil acidity may also be due to Al saturation of
the exchange complex as observed by Ekpete,
(1972).
The phosphorus content of the representative
pedon is low at the epipedon and decreases
down the depth except for few cases where it
is totally lacking. Generally, the low
phosphorus content of the soils may be due to
high soil acidity (Uzoho et al., 2004). Also,
Kubrin et al. (2000) noted that deficiency of
phosphorus may occur in soils due to the
strong adsorption of this nutrient by the soil
colloids. The organic matter content of the
soils ranged from 0.28-4.48% and is high in
the epipedons and decreases down the depth,
though in some cases decreases in irregular
manner (Tables 4, 5 and 6). However, for
tropical soils, the organic matter content of the
representative pedons were low except for few
layers with medium to high content of organic
carbon matter.
Exchangeable bases were either low or very
low and total nitrogen content of the soils
were very low; CEC was high in few profiles
and low in most profiles. The low CEC and
exchangeable content of the soils could be
attributed to high rate of weathering and
leaching of the basic cations in these soils as a
result of high temperature and rainfall
associated with humid tropical climate.
Akamigbo and Asadu (1986) noted that low
CEC could be as a result of high rainfall; clay
type and content as well as previous land use.
Classification of soils of the study area
The soils are Ultisols with kandic diagnostic
horizon; that is with accumulation of low
activity clay in the subsurface horizon. Soils
from Akpulu and Umualoma contain
plinththite, a highly weathered mixture of
sesquioxides of iron and aluminum with quartz
and other diluents that occur as red mottles
that changes irreversibly to hardpan upon
alternate wetting and drying (Brady and Weil,
1999). Soils from Ndiadimoha showed some
characteristics associated with wetness and
most soils showed evidence of plowing/mixed
horizon.
Table 4: Chemical characteristics of soils of the study area Urualla, Akpulu and Ndiuche Profile
No.
Exchangeable base Exchangeable acidity
Cmol/kg Soil Cmol/kg
Soil
Depth
Cm
pH
H2O
pH
KCl
Ca Na K Mg Al3+ H+ TN
(%)
OM
(%)
Avail.
P(mg/kg)
B CEC
(cmol/kg)
%
BS
Profile 1 0-15 4.8 3.9 1.4 0.08 0.06 0.40 Nil 0.80 0.100 1.93 7.09 1.19 6.4 30.31
15-70 4.7 3.3 0.4 0.11 0.02 0.20 Nil 1.60 0.030 0.96 1.12 1.19 6.8 10.74
Urualla 70-90 4.8 3.3 0.4 0.08 0.04 0.20 Nil 1.20 0.014 0.34 0.75 2.38 6.4 11.25
90-160 4.5 3.2 1.6 0.11 0.05 1.40 0.40 1.20 0.014 1.24 0.37 2.38 6.4 49.38
160-180 4.4 3.3 0.4 0.08 0.03 1.80 1.20 1.20 0.014 0.67 Nil 1.19 7.2 32.08
Profile 2 0-20 4.4 3.3 1.0 0.11 0.05 0.80 0.40 2.00 0.080 2.48 2.34 1.19 10.0 19.60
20-50 4.4 3.4 0.6 0.11 0.04 0.40 0.40 1.20 0.030 2.00 0.37 1.19 11.6 9.91
Akpulu 50-100 4.3 3.5 0.4 0.08 0.06 0.60 0.40 0.80 0.040 1.24 Nil 1.19 7.20 13.05
100-120 4.5 3.5 0.6 0.08 0.05 0.40 0.40 1.20 0.030 0.48 Nil 1.19 8.40 13.42
Profile 3 0-20 4.2 3.3 0.8 0.08 0.05 1.60 0.40 0.80 0.060 1.10 2.61 trace 4.80 52.71
20-49 4.3 3.2 0.4 0.11 0.04 1.40 0.80 0.80 0.030 1.17 Nil trace 6.80 28.68
Ndiuche 49-90 4.2 3.4 0.4 0.08 0.05 0.20 0.80 1.60 0.014 0.97 Nil 2.38 9.20 20.98
90-140 4.2 3.3 0.8 0.08 0.04 Nil 0.40 2.40 0.014 0.63 3.73 trace 4.80 19.17
140-190 4.1 3.3 0.8 0.08 0.03 Nil 0.40 0.80 0.014 0.48 0.37 trace 9.60 9.48
TN = total Nitrogen, OM=organic matter, BS = base saturation
15
Onyekanne, Akamigbo and Nnaji NJSS/22(1)/2012

Table 5: Chemical characteristics of soils from Ndiadimoha, Obodoukwu and Akokwa Profile
No. Exchangeable base Exchangeable acidity
Cmol/kg Soil Cmol/kg Soil
Depth
Cm
pH
H2O
pH
KCl
Ca Na K Mg Al3+ H+ TN
(%)
OM
(%)
Avail.
P(mg/kg)
B
CEC
(cmol/kg)
%
BS
Profile 4 0-20 4.0 3.2
0.4 0.11 0.05 1.00 Nil 1.20 0.070 1.03 1.87 trace 8.00 19.50
20-50 4.1 3.2 1.0 0.08 0.03 0.80 0.40 0.80 0.040 0.90 Nil trace 6.00 31.83
Ndiadim 50-70 4.3 3.2 1.0 0.08 0.02 0.40 0.80 1.20 0.040 0.28 Nil 1.19 6.00 25.00
Oha 70-100 4.3 3.2 1.2 0.11 0.05 0.60 3.20 1.20 0.030 0.84 Nil 1.19 10.4 18.85
100-140 4.2 3.2 1.6 0.08 0.04 0.80 2.80 1.20 0.030 1.93 Nil trace 10.0 25.20
140-180 4.4 3.2 1.0 0.11 0.04 0.40 2.40 0.80 0.040 0.34 Nil trace 10.4 14.90
Profile 5 0-20 4.5 3.8 1.8 0.08 0.03 1.00 Nil 2.80 0.100 3.80 2.60 2.38 10.8 26.94
20-30 4.2 3.4 1.2 0.08 0.01 1.80 0.80 1.20 0.040 4.48 0.37 1.19 18.0 17.17
Obodo 30-65 4.4 3.5 1.0 0.08 0.02 3.98 0.40 0.80 0.040 4.31 0.75 4.75 10.0 58.80
Ukwu 65-80 4.5 3.5 1.2 0.08 0.02 2.80 0.40 1.60 0.040 2.90 0.37 3.56 12.0 34.17
80-130 4.5 3.4 1.0 0.11 0.01 1.20 0.80 1.20 0.040 1.72 0.37 1.19 12.0 19.33
130-200 4.4 3.4 1.6 0.08 0.01 1.00 0.80 0.80 0.030 1.03 Nil trace 10.0 26.90
Profile 6 0-25 4.5 3.6 1.4 0.08 0.02 0.60 Nil 1.60 0.060 2 .14 4.48 2.38 5.60 37.50
25-80 4.6 3.4 1.0 0.08 0.01 0.40 0.40 1.60 0.030 1.45 0.37 1.19 8.00 18.63
Akokwa 80-120 4.6 3.3 0.8 0.08 0.008 1.40 2.00 Nil 0.014 0.89 0.37 3.56 4.00 57.20
120-155 4.6 3.4 0.6 0.05 0.003 1.60 0.80 1.20 0.014 0.67 3.73 1.19 7.20 31.29
155-200 4.6 3.3 0.8 0.08 0.01 0.60 1.20 0.80 0.014 0.33 0.37 trace 4.80 31.04
Table 6: Chemical Characteristics of soils from Ndiawa, Umualoma and Osina Profile
No. Exchangeable base Exchangeable acidity
Cmol/kg Soil Cmol/kg Soil
Depth
Cm
pH
H2O
pH
KCl
Ca Na K Mg Al3+ H+ TN
(%)
OM
(%)
Avail.
P(mg/kg)
B
CEC
(cmol/kg)
%
BS
Profile 7 0-18 4.9 4.2 2.0 0.11 0.05 0.80 0.40 3.20 0.100 1.31 1.87 1.19 5.20 56.92
18-40 5.1 3.9 1.8 0.08 0.03 0.40 0.40 1.60 0.040 1.02 0.37 1.19 6.00 38.50
Ndiawa 40-80 4.9 3.6 1.8 0.08 0.03 1.00 0.40 1.20 0.040 1.10 Nil 1.19 7.20 40.42
80-110 4.3 3.2 1.2 0.08 0.03 0.80 1.20 0.80 0.040 0.28 Nil 1.19 6.40 32.97
110-143 4.6 3.1 1.8 0.11 0.06 1.00 6.00 0.40 0.040 0.41 0.75 3.56 13.2 22.50
143-186 4.9 2.9 2.0 0.08 0.07 0.40 4.40 0.40 0.030 0.33 0.37 1.19 17.2 14.83
Profile 8 0-20 4.8 3.5 0.6 0.11 0.06 1.00 0.40 1.60 0.070 0.97 1.87 2.37 4.80 36.88
20-40 4.7 3.1 1.8 0.08 0.04 0.40 1.60 0.80 0.040 0.55 2.61 2.37 8.00 29.00
Umualoma 40-90 5.1 3.4 2.0 0.08 0.03 1.60 1.80 0.40 0.020 0.28 0.37 trace 13.2 28.11
90-140 5.4 3.4 2.2 0.08 0.04 1.40 1.20 0.40 0.020 0.62 Nil 1.19 14.0 26.57
140-180 5.2 3.3 2.6 0.11 0.03 1.60 1.40 0.20 0.030 0.67 Nil 1.19 10.8 40.19
Profile 9 0-23 4.2 3.2 1.0 0.08 0.02 0.60 0.60 1.20 0.060 1.90 2.61 1.19 5.20 32.69
23-49 4.4 3.4 0.8 0.08 0.01 1.40 0.40 1.60 0.040 1.20 0.37 1.19 7.30 31.36
Osina 49-85 4.3 3.6 0.4 0.11 0.01 1.00 0.80 1.10 0.014 0.69 Nil 1.19 4.00 38.00
85-120 4.1 3.2 1.6 0.08 0.02 0.60 0.80 1.20 0.014 0.53 Nil 1.19 6.00 38.33
120-200 4.3 3.2 0.4 0.11 0.02 1.20 0.80 1.20 0.014 0.29 0.37 1.19 4.10 42.20
CONCLUSION
Most soils of Ideato North in Imo state Eastern
part of Nigeria are highly weathered Ultisols,
acidic, and low in most nutrient elements.
However, with adequate management
practices such as application of organic and
inorganic fertilizers, liming and inoculation of
some nitrogen fixing organisms and
earthworm, they may become very productive.
16
Characterization and classification of Ideato soils

REFERENCES
Akamigbo, F. O. R and Asadu, C.L. A
(1986).The influence of Soil Parameter
in selected area of Anambra state
Nigeria. Nigeria Journal of Soil
Science
Brady, N. C. and Weil, R.R. (1999). The
Nature and Properties of Soil.
Macmillan Publishers, New York. Pp
77.
Ekpete, D.M. 1972. Assessment of Lime
Requirement of Eastern Nigeria Soils.
Soil Science 113: 363 – 372.
Enwezor, W. O., E. J. Udo and R. A. Sobulo
(1981). Fertility status and the
productivity of the acid sands P. 56 –
73: In Acid Sand of South Eastern
Nigeria. Soil Science Society of
Nigeria Special Publ. Monograph.1.
Esu, I. E. (2004). Soil Characterization and
Mapping for Food Security and
Sustainable in Nigeria. In Proceeding
of the 29th Annual Conference of the
Soil Science Society of Nigeria. pp 9-
12
Esu I.E. (2004). Soil Characterization and
Mapping for food Security and
Sustainable Environment in Nigeria: In
Proceeding of the 29th Annual
Conference of the soil Science Society
of Nigeria. Pp 10-17
Greenland, D J. (1994) Soil Science and
Sustainable Land Management. In:
Syres, J.K and D.L.Rimmer (Ed) Soil
Science and Sustainable Land
Management in the Tropics. CAB
International, 1-15
Jungerius, P. D. (1964). The Soil of Eastern
Nigeria Publication.
Jubrin, J. M., Chude , V. O., Host, W. J., I Y.
Amagu (2000) The response of 10
leguminous cover crop and mage
native and applied phosphate.
Proceeding 26th Annual Conf Soil Sc.
Society of Nigeria. Nigeria
Nnaji, G. U., Asadu, C. L. A and Mbagwu, J.
S. C. (2002). Evaluation of the physic-
chemical properties of soils under
selected agricultural land utilization
types. Agro-Science Journal of
Tropical Agriculture, Food,
Environment and Extension. 3:27-33.
Ogunkunle, A.O. (2004). Soil Survey and
Sustainable Land Management: In
Proceedings of 29th Annual Conference
of The Soil Science Society of Nigeria.
Pp19-24.
USDA-SCS. (1974). Definition and
Abbreviations for Soil Description.
West Technical Service Center, Port
land, Oregun, USA.
Uzoho, B.U and N. N .O. T. (2004).
Phosphorus Adsorption characteristics
of Selected South Eastern Nigeria
Soils: In proceeding of the 29th Annual
conference of the Soil Science Society
of Nigeria pg 121 – 131.
17
Onyekanne, Akamigbo and Nnaji NJSS/22(1)/2012

DEGRADATION EFFECT OF PALM OIL MILL EFFLUENT (POME) ON PHYSICAL
AND CHEMICAL PROPERTIES OF THE SOILS OF UGA,
SOUTH EASTERN NIGERIA.
PATIENCE. O. UMEUGOCHUKWU1, VICTOR O. CHUDE2 AND EZEAKU P.1
1Department of Soil Science University of Nigeria, Nsukka. 2National Programme for Food Security (NPFS)
Email: [email protected], [email protected], [email protected]
08033945009, 07066725984
ABSTRACT This study investigated the impact of long term application of palm oil waste on physical and
chemical properties of a sandy Ultisols (Arenic Kandiustult) in Uga, Nigeria. Soil samples were
collected from the surface (0-10cm) and subsurface (15-25cm) of palm oil polluted site. Another
surface (0-10) and subsurface (15-25) samples were collected 15 meters away in the palm oil
unpolluted (control site). Core samples were from both soils. All the samples were analyzed for
selected physical and chemical properties. The result showed that both soils were loamy sand but
varied in the other physical properties as bulk density and total porosity. The two soils were
strongly acidic, but had more carbon, nitrogen and phosphorus in the palm oil polluted soils than
in the unpolluted soils. The result indicated that the area affected with the palm oil mill effluent
(POME) had more nutrient status but reduced plant growth due to clogging of water and
restricted aeration. The other forms of land degradation identified in the area were erosion,
deforestation, bush burning, and sand quarrying. Efforts at combating land degradation by the
Uga indigenes in order to protect their land from environmental devastation should be
intensified. Knowledge of the component and proper disposition of these pollutants should be
made known to the people of Uga.
Keywords: Keywords: Degradation; Palm oil mill effluent; food security; Environmental
hazards
INTRODUCTION Palm oil processing is carried out in mills where oil is extracted from palm fruits. Large quantities of water are used during the extraction of crude palm oil from the fresh fruits and about 50% of the water results in palm oil mill effluents (POME). It is estimated that for 1 tonne of crude palm oil produced, 5-7.5 tonnes of water will end up as POME (Ahmed et al., 2003). It has been observed that most of the POME produced by the small scale traditional operators in Uga undergo no
treatment and is discharged into the agricultural land that is used for arable farming (Umeugochukwu, 2001). This effluent is a serious land and aquatic pollutant when discharged immediately into the environment. Besides the presence of lipids and volatile compounds, the inhibitory effects of POME on living tissues, could also be due to presence of water-soluble phenolic compounds (Radzia 2001; Perez et al., 1992).
18
Effect of palm oil effluent on soils

Soil is a fundamental base for agricultural production system and therefore deserves to be seriously conserved. The relationship between the cropland degradation and food production deserves to be looked at very well. Land degradation problem is a serious problem confronting the people of Uga, in Anambra State. Land degradation is the diminution of soils current or potential capacity to produce food, feed and fiber as a result of one or more degradative processes. Understanding soil degradation, causes and processes are essential for better management of the soil. The importance of maintaining or improving the soil physical and chemical properties in agriculture has been reported by many researchers. Lal and Greenland (1977) stated that the development of stable and viable system of soil management in tropical region with a harsh climate or environment must be based on a thorough understanding of the soil physical and chemical condition, if it were to be meaningful. Ahn (1974) considered that the physics of the soil was as important as its chemistry and that any chemical shortcoming might be made good simply by adding the necessary fertilizer; but no amount of nutrient would make up for poor soil physical properties. Soil structural conditions are important if, for example, yield responses of agricultural crops to fertilizer inputs are to be optimized (Smith et al, 1989). POME is the most polluted organic residue generated from palm oil. It is composed of high organic content. Untreated POME contains high concentration of free fatty acids, proteins and plant tissues but it is non toxic (Ngan et al., 1996). It has a high biological oxygen demand BOD which makes it more polluting than other domestic sewage (Okwute et al, 2007). Palm oil mill effluents had been discovered by the people of Malaysia as better organic compost for agricultural production than chemical fertilizer after treatment to remove the oil in the effluent ( APOC, 2004). The situation at Uga is contrary as no plant was found growing on the area where the effluents were disposed. This study is to
investigate the effect of POME on soil physical and chemical properties and suggest a better way of disposing the effluent to enhance food production and security.
MATERIAL AND METHODS The area under investigation is located within longitude70 4’E and latitude 63 56’N. It is about 32km south of Awka, Anambra state capital. The study area falls within humid tropical zone. The two major seasons in the area are wet and dry season with the former lasting for 8 months (April- October) and the latter for 4 months (November-March). The average annual rainfall is 1485.2mm with maximum temperature of 350 C. The temperature is generally high and rarely falls to 210 C throughout the year. The mean annual temperature ranges from 270C-350C (Badiane, 2009). The relative humidity ranges from 40%-92%. The vegetation of the area is rain forest with mainly grassland and savannah vegetation. The dominant land uses are cereal and arable cropping systems. The soils are classified as an ultisol (Arenic Kandiustult) bases on USDA soil classification system (Umeugochukwu, 2010). Soils of areas affected with palm oil effluents and another area not affected by the effluent were collected and analyzed.
Soil sampling method Soil sampling: Soils of the two sites (polluted and unpolluted) were collected from 0-15 and 15-25cm depth. For purposes of analysis, the surface samples were composite separately from the sub surface samples. Undisturbed core samples were collected from the surface (0-10cm) and subsurface (15-25cm) of palm oil polluted and unpolluted site. The unpolluted samples were collected 15 meters away from the palm oil polluted site and all were analyzed for selected physical and chemical.
Laboratory Analysis Methods The samples were taken to the laboratory in well labeled polyethene bags. They were air
19
Umeugochukwu, Chude and Ezeaku NJSS/22(1)/2012

dried and sieved to pass through 2mm sieve. The fine earth fraction was analyzed for the following physical and chemical properties; physical properties selected include: Particle size distribution- Sand, Silt and Clay; Bulk Density, Porosity. Chemical properties were pH, Organic Carbon, Total Nitrogen, Available P, C.E.C, and Exchangeable Cations (Ca2+, Mg2+84 , Na+ and K+85). Particle size analysis was determined by Gee and Bauder (1986) method. The textural classes were determined from the USDA soil textural triangle. Bulk density was obtained by the method of Blake and Hartge (1986). Total Porosity was calculated from the values of the bulk density using the method described by Vomicil (1965). Soil pH was obtained in 1:25 soil/water extract of the composite samples according to Mclean (1982) method. Available P was determined by the Bray 2 extract Olsen and Sommers (1982). Cation Exchange Capacity (CEC) was determined by the NH4OAC displacement method and exchangeable acidity by titrimetric method after extraction with 1.0N KCl (McLean, 1982). Total exchangeable bases (Ca2+, Mg2+, Na+ and K+92 ) were determined using 1N NH4OAC extrantant method ( Thomas, 1982), where Ca2+ and Mg2+ 93 were obtained on an Atomic Absorption Spectrometer; Na+ and K+ 94 by flame photometer. Base saturation was calculated from TEB/CEC x 100, where TEB = total exchangeable bases. Soil organic carbon (OC) was determined by Nelson and Sommer (1982) method. Soil organic matter was obtained by multiplying percentage carbon by 1.724. Total nitrogen was determined by the macro-Kjeldhal method of Bremmer and Mulvaney, (1982).
Statistical Analysis The statistical analysis consists of descriptive statistics and paired sample T-test. Descriptive statistics shows the means of the chemical and physical properties of the different soils (polluted and unpolluted soils.) The paired t-test compared the differences in mean among the two sites.
RESULTS AND DISCUSSION
Impact of the POME on the Soil. Preliminary observation shows that pollution of the soil with palm oil waste and other domestic wastes was prominent in the study area. It affected land use in terms of plant growth. There was little or no plant seen growing on the area polluted with POME even though it contained more nutrients than the unpolluted site. There was more siltation on the polluted site which was as a result of clogging of the pore sizes which of course restricted aeration. The lack of air in these area as predicted could possibly result to lack of plant growth despite the nutrients contained in the POME. The impact of this pollution is mostly felt in wet season when it forms a suitable breeding ground for most vectors of diseases.
Physical properties The particle size distribution results in table 1 indicated that the fine earth fractions were dominated mainly by sand followed by clay and silt in both soils. The textural classification of the two soils was loamy sand. The mean values of the clay (11.0%), total sand (81.5), and coarse sand (32.0) collected from both soils indicated that the highest values were obtained from the unpolluted soils. The polluted soil had higher mean silt content of (7.5) than the unpolluted soil of (1.5). The top soil of the polluted site recorded more sand fraction than its sub layer which is the same trend with the unpolluted site. The subsurface layers in both soils had more clay content. Their clay mean values were 11.0 and 12.5 in the polluted and the unpolluted soils respectively. The trend of the silt content varied. It was more in the top soil of the polluted site than the unpolluted site (Table 1).
Bulk Density, Total Porosity and Pore size distribution: The bulk density values were obtained from both top and sub soils of the two soils. The bulk density value obtained from the top soil of the polluted site ( 1.2 g/cm3) was lower than that of the top soil of the unpolluted soil (1.4 g/cm3). The bulk densities and total porosity, values averaged
20
Effect of palm oil effluent on soils

1.2 g/cm3, 52%, 35%, 17% respectively and the unpolluted soil values were 1.45 g/cm3, 45%, 35%, 10% respectively. The mean bulk density of the polluted soil is lower than the mean bulk density of the unpolluted soil Table 2. The polluted soil with lower bulk density recorded higher total porosity than the unpolluted soil with higher bulk density.
Chemical properties The soil pH was generally low. It ranged from 4.8-4.9 H20 for all the soils. The mean value of the pH for the two soils was the same (4.3) (table 3). The soils were extremely acidic. There was no significant difference in the pH of the two soils. The mean values of soil organic matter (1.82%) was higher in the palm oil polluted soil than in the unpolluted soil (0.86%). The values increased with depth in the palm oil polluted soil and decreased with depth in the unpolluted soil (Table 1). The topsoil of the palm oil polluted soil had 1.72% and 1.93% organic matter in the sub layer while the unpolluted soil had 0.97% in the topsoil and 0.76% in the subsurface. The differences in mean was significant (P>0.05). the values of the polluted soil and the unpolluted soils were statistically different. The two soils had high amounts of available phosphorus. The mean values of the two soils were 62ppm and 56ppm for polluted and unpolluted soils respectively. The polluted had more P than the unpolluted soil. There was no difference in the trend of distribution of phosphorus in the top soil and the sub soil of the polluted and unpolluted soils. There was no significant difference in the available phosphorus of the two soils. The mean values of the ACEC and ECEC in the polluted soil was 1.15, 2.3 and 1.47,2.5 in the unpolluted sample respectively. The differences were not significant at P>0.05. The base saturation had mean value of 73% in the polluted soil than in the unpolluted soil (57%). The exchangeable acidity mean value for the both soils was of the same value (2.0).
For both soils in the polluted and unpolluted sites, mean exchangeable Na was 0.15meq/100g and 0.10meq/100g, 0.45 meq/100g and 0.35 meq/100g of K, 0.5 meq/100g and 0.4 of Ca, in polluted and unpolluted soils respectively. Mg had mean value of 0.3 in both soils. Na, K and Ca had higher mean values in the polluted soils than in the unpolluted soils.
DISCUSSION The relatively high sand content in the area is the reflection of the effect of the sandy parent material. The dominance of sand size particles would have emanated from the presence of such particles in the parent material of the soils. The parent materials of the soils of eastern Nigeria have been noted to influence the texture of the soils derived from them (Akamigbo and Asadu cited in Asadu and Agudosi (1994). The relatively higher clay content in the subsurface layers in each site may have resulted from the process of eluviation from the upper horizons. The low clay content observed in the upper layers of these soils may further indicate the degree of weathering and leaching that the soil has undergone (Asadu et al; 2008). The higher silt content observed in the upper layer of the polluted soils may be due to the effect of palm oil mill effluent. This can be attributed to reduced floatation of silt particles in runoff and hence reduced carting away of silt particles by overland flow. However the soils of these areas are inherently low in silt content (Akamigbo, 1984) essentially due to low content of these particles in the original parent material. A test of mean difference carried out to compare the mean values of the particles size analysis data between the two soils, however showed that the mean clay, silt and sand contents were significantly different at P>0.05. Thus the palm oil mill effluent (POME) influenced the particle size distribution in the soil significantly. Salimon (2007) noted that the impact of POME on the physical properties of soil depends on the method of application.
21
Umeugochukwu, Chude and Ezeaku NJSS/22(1)/2012

POME retards growth of cowpea at the early stage, enhances nodulation when applied in a controlled manner and inhibits nodulation when applied in a large quantity. He also noted that it can be used as organic fertilizer material to improve degraded sandy and low organic matter soils. The lower bulk density in the palm oil polluted soil can be attributed to the accumulation of palm oil effluent in this soil. The bulk density value was lowest on top of the polluted site showing that the effect is more at the zone of application. As you go down the sub layers, the effect reduced. Palm oil mill effluent contains a lot of organic materials of low bulk density (Harrison, 1995) and so impacts this property to the soil. There was increase in the values of the bulk density down the layers both in the polluted and the unpolluted soils. Increase in total porosity is often correlated with decrease in bulk density. This was observed in the samples of the polluted and unpolluted soils where the mean total porosity was lower in the polluted soil than the unpolluted soil. The paired t-test showed significant difference in the samples from polluted and unpolluted soils. The mean t-test of porosity was significantly higher in the unpolluted soil than in the polluted soil at P>0.05. It has been reported that when raw POME is discharged, the pH is acidic (Hemming, 1977) but seems to gradually increase to alkaline as biodegradation takes place. Soil acidity is one of the principal factors affecting nutrient availability, therefore availability of major nutrients (N,P,K) cannot effectively promote high yields of crops if soil pH is not correct. The uniformity in the soil pH indicated that the POME had started undergoing degradation. The low pH noticed in the POME could be as a result of presence of phenolic acids and oxidation of the organic acid compounds (Nwoko, 2010). The higher values of organic matter in the polluted soil confirms the report of ( Falodun et al, (2010). He observed that POME contains
relatively high amount of plant nutrients. This may also be due the accumulation of the effluent on the soil. This is the reason POME can be used for growing crop and amending soil fertility depletion. Nwoko (2010) reported that POME amended plots gave higher maize height that significantly differed from that of control. Similarly, POME application with resultant positive yields may be attributed to the ability of the pome to stimulate the activity of micro organism in the subsisting soil/plant environment. The available phosphorus is more in the polluted soil than in the unpolluted soil. The palm oil mill effluent affected the availability of phosphorus in the polluted soil. The higher mean value of phosphorus in the polluted soil is in line with the work of Haun (1987) which suggest possibly high absorption in the soil or a possible precipitation of phosphate. He also said that there is a good evidence that suggests that phosphorus is the dominant element controlling carbon and Nitrogen immobilization. The uniformity in the pH reflected in the available P as acid soils tend to fix phosphorus. According to Rhodes (1982) CEC usually expressed in meq/100g is a measure of quantity of readily exchangeable cations neutralizing negative charges in the soil. The high values of the CEC in the POME showed that the soil is enriched with the following exchangeable bases: Ca, Mg, Na and K due to the presence of POME in the soils. Increase in CEC could be attributed to increase in pH dependent charges as well as addition of organic matter from the effluent as observed by Okwute (2007). The CEC and the exchangeable acidity had no difference in the two soil but the base saturation showed significant difference at p>0.05 in the two soils. The base saturation average value of more than 50% confirms the reason the soil is fertile. The higher value of B.S in the polluted soil is an evidence of higher fertility than the unpolluted soils.
22
Effect of palm oil effluent on soils

CONCLUSION The first impression that could be got from POME soil environment was that of bareness and a wasted land. The absence of vegetation was not surprising since the POME soil’s ability to retain water could cause clogging of soil pores and hence water logging of the soil (Chan et al, 1980). Excess water in the soil restricts micro-organisms and their activities by preventing oxygen movement into and
through the soil in sufficient quality to meet the oxygen demand of the organism. From the data generated in the study, it is obvious that the physical and chemical properties of the POME soils is different from that of the non POME. Since the POME has been shown to be acidic in nature, it is advisable to be treated before application to the soil. Proper use of POME could lead to improved soil fertility and soil structure.
Table 1: The selected physical properties of the polluted and unpolluted soils Designation Depth
(cm)
Clay
(%)
Silt
(%)
T.sand
(%)
F.S C.S B.D T.P T.C
Polluted Soil Top polluted 0-10 10 8 82 48 36 1.2 54 Loamy
Sub polluted 15-15 12 7 81 40 28 1.3 50 Sand
Unpolluted Soil Top unpolluted 0-1 11 1 88 44 36 1.4 47 Loamy
Sub unpolluted 15-25 14 2 84 40 32 1.5 43 Sand
Table 1.2: The chemical properties of the polluted and unpolluted soils. Depth
(Cm)
pH C
(g/kg)
O.M
(g/kg)
N
(g/kg)
Av.P
(mg/kg)
Exchangeable Bases
(cmol/kg)
C.E.C
(cmol/kg)
B.S
(%)
Exch.
Acidity
(cmol/kg)
Na+ K+ Ca2+ Mg2+ ACEC ECEC AL3+ H+
Polluted soil
0-10 4.9 1.12 1.72 0.08 62 0.02 0.06 0.6 0.4 1.3 2.66 83 0.2 0.1
15-25 4.9 1.00 1.93 0.06 62 0.01 0.03 0.4 0.2 1.0 1.94 64 0.2 0.1
Unpolluted soil
0-10 4.8 0.57 0.97 0.09 56 0.01 0.04 0.4 0.3 1.05 2.10 75 0.2 0.1
15-25 4.8 0.44 0.76 0.05 56 0.01 0.03 0.4 0.3 1.9 2.94 39 0.2 0.1
Table 2: Mean value and T value/significant levels of soil physical properties of polluted
and unpolluted soils in Uga.
Parameter Mean Std. Dev. Std. Error M.D T-Value
Clay P1
P2
T. Sand P1
P2
C.S P1
P2
Silt P1
P2
11.0
12.50
81.50
86.00
32.00
34.00
7.50
1.5
1.41
2.12
0.71
2.83
5.66
2.83
0.71
0.71
1.00
1.50
0.50
2.83
4.00
2.00
0.50
0.50
-1.50
-4.50
-2.00
6.00
-3.00
-3.00
-1.00
6.00
B.D P1
P2
T.P P1
P2
1.25
1.45
52.00
45.00
7.07
7.07
2.83
2.83
5.00
5.00
2.00
2.00
Legend: T. Sand = total sand, C.S = coarese sand, B.D = Bulk Density, T.P = Total porosity.
23
Umeugochukwu, Chude and Ezeaku NJSS/22(1)/2012

Table 3: Mean value and T value/significant levels of soil chemical properties of polluted and unpolluted soils in Uga. Parameter Mean Std. Dev. Std. Error M.D T-Level -Value/sig pH P1 P2 Carbon P1 P2 Av.p P1 P2 Exch. Mg P1 P2 Nitrogen P1 P2 Org. M P1 P2 Exch. Ca P1 P2 Exc. Na P1 P2 B.S P1 P2
4.9 4.8 1.06 0.51 62.00 56.00 3.00 3.00 0.07 0.07 1.82 0.86 5.00 4.00 0.015 0.010 73.50 57.00
0.00 0.00 8.48 9.19 0.141 0.00 0.11 0.23 0.12 0.12 1.41 0.00 0.005 0.000 10.97 20.70
0.00
6.00 6.50
1.00 0.00 0.05 0.11 0.06 0.06 1.00 0.00 0.002 0.000 5.48 10.39
0.55
5.55
0.00
0.96
1.00
0.005
16.50
111.00
0.00
0.00
7.918
1.00
1.732
3.362
REFERENCES Ahmad A, Ismail S, Bhatia S. (2003). Water
recycling from palm oil mill effluent (POME) using membrane technology. Desalination, 157:87-95.
Ahn, P.M (1974). West African Soils, Oxford
University Press, London. Akamigbo, F.O.R (1984). The accuracy of
field textures in a humid tropical environment.’ Soil Survey and land Evaluation, Vol. 4
American Palm Oil Council (APOC), 2004.
Sustainable palm oil practices, palm oil mill effluent (POME) and Empty Fruit Bunch Application as a nutrient Source in oil palm.
Asadu C.L.A, and Agudosi, H.C (1994). A
comparative study of soils inside and outside ogbunike cave in Eastern Nigeria; Discovery and Innovation Vol.6 no 4. Pp367-371.
Asadu, C.L.A, Ucheonye-Oliobi, B. and
Agada, C. (2008). Assessment of sewage application in south-eastern
Nigeria: Impact on soil morphological and physical properties, outlook on Agriculture Vol 37, No 1.Pp 63-69.
Bremmer, J.M and C.S. Mulvaney, (1982).
Total N,P.895-926. In Page et al (eds) Methods of Soil Analysis. Part 2. 2nd ed. Agron. Monog. 9 ASA and SSSA, Madison WI.
Chan, K.W, Watson, I., Lim, K.C (1980). Use
of Palm oil waste material for increased production. Paper presented at the Conference on Soil Science and agricultural development in Malaysia, Kuala Lumpur.
Falodun E.J, Osaigbovo A.U and Remison
S.U. (2010). Effect of Palm oil mill Effluent and NPK15:15:15 fertilizer on the growth and yield of soya bean.
Gee, G.W and Bauder, J.W (1986). Particle
size Analysis.P.383-411. In: Klute, A (ed). Methods of Soil Analysis part 2, 2nd ed Agronomy Monograph No 9,ASA and SSSA, Madison, WI.
24
Effect of palm oil effluent on soils
Haun, K.C. (1987). Trials on long term effect of application of POME in soil properties, oil palm nutrition and yield. In; proceedings of the international oil palm, palm oil conferences (eds) 575-598.
Lal, R,and Greenland, D.J. (1977). Soil
Physical properties and Crop Production in the tropics, John Wiley, New York, pp 7-9.
Mclean, E.O (1982). Soil pH and Lime
Requirement. P. 199-224. In: Page et al (eds) Method of Soil Analysis part 2. Chemical and microbial properties. 2nd 288 ed. Agron. Monog. 9 ASA and SSSA, Madison WI.
Nelson, D.W., and Sommers, L.E (1982).
Total Carbon, organic carbon and organic matter, in page, et al ed, method of soil Analysis, part 2, 2nd 291 ed Agronomy Monograph No 9,ASA and SSSA, Madison, WI, pp 539-579.
Ngan, M.A, Zajima, Y. Asahi M.,and Junit H
(1996). A novel treatment process for palm oil mill effluent. PORIM TECHNOLOGY, October 1996.
Nwoko, C.O (2010). Evaluation of Palm oil
mill effluent to maize (Zea mays. L) crop: yields, tissue nutrient content and residual soil chemical properties, Australian Journal of Crop Science.
Okwute, O.L and Isu, N.R (2007). Impact
analysis of palm oil mill effluent in aerobic bacterial density and ammonium oxidizers in a dump site in Anyamgba, Kogi State. African Journal of Biotechnology Vol 6 (2) pp 116-119.
Olsen, S.R and Sommers, (1982). Phosphorus.
P 403-434. In page et al (eds), method of soil Analysis, part 2, 2nd ed Agronomy Monograph No 9,ASA and SSSA, Madison, WI.
Perez J, de la Rubia T, Moreno J, Martinez J
(1992) Phenolic content and antibacterial activity of olive oil waste
waters. Enviro. Toxicology Chem. 11: 489-495.
Radziah O (2001) Alleviation of Phytotoxicity
of Raw POME by microorganism retrieved Sept, 2005, fromwww.agri.upm.edu.my/agrosearch/v3n2/irpa3.htm
Rhodes, J.O. (1982). CEC in A.L page R.H
Miller and D.R keeney (eds) methods of soil analysis, part 2, Chemical and microbial properties. Madison Wisconsin: pp 149-157.
Salimon, B.O, (2007). ‘The effect of palm oil
mill effluent (POME) on soil properties, growth, Nodulation and yield of cowpea (Vigna Unguiculata) in palm oil producing zone of Nigeria’ paper presented at the annual meeting of the Soil and Water Conservation Society, Saddlebrook Resort, Tampa, Florida <Not Available>. 2010-06-04 from http://www.allacademic.com/meta/p174308_index.html
Smith, S. R, Hail, J. E, and Hadley, P. (1989).
Composting Sewage sludge wastes in relation to their suitability for use as fertilizer material for vegetable crop production. International Symposium of Compost Recycling of wastes, 4-7 October, Athens.
Thomas, G.W. (1982). Exchangeable cations,
Pp 159-165. In page et al (eds) Method of soil Analysis, part 2, 2nd ed Agronomy Monograph No 9,ASA and SSSA, Madison, WI
Umeugochukwu, O.P and Akamigbo, F.O.R.
(2010). Soil Degradation as a prelude to Land degradation and Environmental Reserves in Uga, Aguata L.G.A of Anambra State. Nigeria. Proceedings of the 44th annual conference of Agricultural Society of Nigeria, ‘LAUTECH,ogbomosho, 2010’ pp1390-1393.
Vomicil, J. A. (1965). Porosity, In Black, C.A
ed, methods of Soil Analysis Part 1, Agronomy Monograph 9, ASA and SSSA, Madison, WI, pp 299-314.
25
Umeugochukwu, Chude and Ezeaku NJSS/22(1)/2012

IMPACT OF SOIL EROSION ON LAND DEGRADATION IN UGA
SOUTHEASTERN NIGERIA
*O. P UMEUGOCHUKWU1, P. I. EZEAKU1, V. O CHUDE2, and G. U. NNAJI1 1 Department of Soil Science, University of Nigeria, Nsukka.
2National Programme for Food Security (NPFS)
*Corresponding author: [email protected], [email protected]
ABSTRACT
This study was to investigate the causes and hazard of soil erosion in Uga, Anambra State as the
area is always having the problem of erosion. This study was carried out in some selected
erosion sites in Uga. The study investigated the impact of soil erosion on land degradation and its
environmental hazards in Uga Southeastern Nigeria. Two profile pits were prepared, one on
severely degraded (eroded) sites and the other on less severely degraded (eroded) sites. They
were morphologically described and sampled. Surface soil samples were collected from the
erosion sites that were controlled at the depth of (0-25cm) and (25-50cm) to check the effect of
the control on the soils. Some physical and chemical properties of the soil were determined.
Morphologically, the soils were deep and well drained with no concretions or mottles. The
colour variations ranged from brown (7.5YR 4/4) to dark reddish brown 7.5 R 3/3 for the profile
pits. The soils varied in texture from fine loamy sand to sandy clay loam. The structures varied
from hard to weak coarse crumb to friable. The Bulk Density values (B.D) were relatively high
1.4g/cm2 – 1.6g/cm3. The infiltration was rapid ranging from 10cm – 150cm/2. Chemically they
were strongly acidic and low in nutrient status. The pH was low between 3-9-5.1. Nitrogen
ranged from 0.01 – 0.12%. Erosion affected significantly the phosphorus, pH and Al3+ Heavy
metals values were low. Other forms of land degradation identified in the area were bush
burning, sand quarrying, deforestation etc. Management practices such as use of organic
amendments, minimum tillage and crop rotation could help in the conservation of the soils and
ensure food security for further generations.
Keywords: Degradation, erosion, food security, hazards, sustainability.
INTRODUCTION
Soil degradation is the temporary or permanent
lowering of the productive capacity of the soil.
Soil erosion process is a serious problem
confronting Uga people in Anambra State. Soil
erosion by water is a major type of soil
degradation, not just in Nigeria but in the
tropics. It occurs most often as a result of human
activities like deforestation, overgrazing,
building orientations and/or natural activities
like soil types, topography, climate etc. The
major causes of land degradation are as a
result of land misuse and poor land
management practices. Land degradation
which has been defined as the loss of utility or
potential utility of land or the decline in soil
quality caused through misuse by humans
(Barrow, 1992) is posing more threat to our
future than military aggression.
26
Impact of soil erosion on land

The impact of environmental problems in
Anambra State is very severe and needs
adequate attention (Akamigbo, 1996). They
have soil types and climate which accelerate
erosion processes. Erosion may dissect the
land by forming deep gullies. The scenario is
typical in Nanka and Ekwulobia of Anambra
state. (Akamigbo, 1996). Gully erosion not
only reduces the land area for agricultural
purposes but also threatens the buildings of the
inhabitants of the area where it occurs. In
Anambra state, studies by the task force on
soil erosion control revealed that 10% of the
land area is occupied by gully erosion of all
types. This must have increased by now. Soil
erosion affects agriculture by selective
removal of plant nutrient and removal of
organic matter by wind or water.
Efforts made in the past to combat the
problem even by the state government and the
village people could not make much meaning.
The erosion sites are still on the increase. The
investigation carried out in the study area
revealed that the most severe site studied
started developing like six years back.
There is need not only to investigate the causes
of the problems of land degradation but also to
investigate the effect of soil erosion on
agricultural production and make
recommendations on how to ameliorate them
in order to secure food and sustain the
environment. This study is aimed at examining
the nutrient status of the severely eroded, less
severely eroded sites and also the controlled
site.
MATERIALS AND METHODS
Study Site.
This study was conducted on two different
types of erosion sites. One site was located on
erosion site that was very severely eroded and
the second site was on a less severely eroded
site. Surface samples were collected from an
erosion site that has been controlled. The area
is located between latitude 50 56’N and 50 57’N
and between longitude 70 4’E and 70 06'E. The
area falls within the humid tropical zone of
southeastern Nigeria with average annual
rainfall of about 1485mm and mean annual
temperature that ranges from 27 to 350C and
rarely falls to 210C throughout the year. The
relative humidity ranges from 40 to 92%
(Badiane 2009). The vegetation of the area is
rainforest with mainly grasslands. The natural
vegetation of the area consists mainly of
secondary forest. The major land use types in
the study area are arable crop production, cash
crop production and non agricultural uses such
as residential, commercial and local roads.
Two profile pits were sited. One pit each on
the severely eroded site and less severely
eroded site respectively. Auger samples were
collected at the depth of 0 - 25cm and 25 -
50cm depth to check the effect of the control
measures on the soil, physical and chemical
properties. Core samples were collected from
around the profile pits for physical property
analysis.
Laboratory Analysis
The samples were air dried and sieved to pass
through 2mm sieve. The fine earth fraction
was analyzed for the following parameters.
Particle size analysis was carried out by
hydrometer method.
The textural classes were determined from the
USDA soil textural triangle. Bulk density was
obtained by CORE method. Total Porosity was
calculated from the values of the bulk density
using the method described by Vomicil
(1965). Soil pH was obtained in 1:25
soil/water extract of the composite samples
according to Mclean (1965) method.
Available P was determined by the Bray 2
extract. Cation Exchange Capacity (CEC) was
determined by the NH4OAC displacement
method and exchangeable acidity by titrimetric
method after extraction with 1.0N KCl
(McLean, 1965). Total exchangeable bases
(Ca2+, Mg2+, Na+ and K+) were determined
using 1N NH4OAC extractant method, where
Ca2+ and Mg2+ were obtained on an Atomic
Absorption Spectrometer; Na+ and K+ by
flame photometer. Base saturation was
27
Umeugochukwu, Chude and Nnaji NJSS/22(1)/2012

calculated from TEB/CEC x 100, where TEB
= total exchangeable bases. Soil organic
carbon (OC) was determined by dichromate
method. Soil organic matter was obtained by
multiplying percentage carbon by 1.724. Total
nitrogen was determined by the macro-
Kjeldhal method (Bremmer 1965).
Infiltration rates were determined in the field
using the double ring cylinder infiltrometer
method. Heavy metals Pb, Zn, Cu and Fe were
also determined. The determination was done
on the top layers of each site since that is
where the concentrations of the heavy metals
are more and the surface sample is where
arable farming is done. The concentration of
individual metals was measured with atomic
absorption spectrometer (AAS) after wet
digestion with HNO3 for Pb and a mixture of
HNO3 and HCL for iron (Bruce and White
side, 1984).
Statistical Analysis
The statistical analysis consists of descriptive
statistics and ANOVA with Duncan multiple
range test. Descriptive statistics show the
means of the chemical properties of different
eroded soil (severely eroded, less severely
eroded and eroded but controlled soil). The
ANOVA compared the differences in mean
among the three sites.
RESULTS AND DISCUSION
Causes of Soil Erosion in the Area.
When a man tries to modify the land for his
own use, he changes and upsets the natural
balance thereby resulting to erosion. One of
the major causes of erosion in this place is
indiscriminate building orientation which is a
result of land tenure system. Land tenure
system is a system of land ownership by
individual which means that people are forced
to use the land to build based on the shape of
their land and not based on whether it will
cause erosion. Other causes identified were
indiscriminate removal of vegetative cover.
Akamigbo (1986) said that major factors of
soil erosion in Anambra state are bush burning
together with indiscriminate removal of
vegetative cover. The people are involved in
bush burning, overgrazing, deforestation,
quarrying of sand and intensive cropping. This
is to combat the teeming population density of
about 1500-2200 which is too much for an
area of 1sqkm. The soil type of the area which
is sandy soil derived from sand stone parent
materials and the climate of the area explains
why the area is prone to erosion. The
topography of the area is another reason why
the study area had erosion. The entire area is
located on a slope. The people irrespective of
the slope still carry out their continuous
cropping on the land. Akamigbo (1996)
observed that 75% of gullies in Anambra State
had their origin in poorly executed civil works
with direct or indirect concentrated runoff.
This is similar to the case of the eroded but
controlled site that was examined. Agricultural
methods of controlling erosion should be
encouraged as it enhances soil structure and
also more sustainable
Soil Morphology.
The erosion had minimal effect on the
morphology of the soils. The soils were
derived from sandstones and are generally
deep and well drained. The colour variation
ranging from deep brown (7.5YR 4/4) dry to
dark reddish brown (7.5 R 2/2) on the top soils
and orange (2.5YR 6/6) in the sub layers in the
severely eroded sites. In the less severely
eroded site the colour ranged from dark
reddish brown (7.5YR 3/3) in the top soil to
reddish brown (10R 4/4) in the sub soil. The
difference in colours of top soil and sub soil in
the two sites was as a result of erosion that has
washed off some soil particles. The structures
of the severely eroded site ranged from
medium crumb structure at the top layer to
strong moderate sub-angular blocky structure
in the sub layer. The less severely eroded site
had weak coarse crumb on the top layer and
strong moderate sub angular blocky in the sub
layers. The structures of the sub layers were
virtually the same but that of the top soils were
different because erosion has affected it. The
major differences were due to slope of the area
which was 12% and 2% in the severely and
28
Impact of soil erosion on land

less severely eroded soil. Akamigbo (1986)
noted that erosion deposits detached soils in
the lower area. The consistency was generally
non sticky to friable in the top layers and
sticky to plastic in the sub layers.
Physical Properties
Particle Size Distribution.
The particle size distribution indicated that the
two profile pits and the auger samples have
fine sand dominant over coarse sand. Textural
classifications are Sandy clay loam, Sandy
loam, and Loamy sand. This could be
attributed to the type of parent material of the
area (Akamigbo and Asadu, 1983). The clay
content of the soils ranged from 8% to 34%
(Table 1). The upper horizons had lower clay
content which could be attributed to the runoff
of the surface caused by high rainfall and
slope. The coarse sand was decreasing with
depth at 50cm in the first profile but was not
so in the other samples. This could be
attributed to the nature of lithology of the
parent material. The samples have low silt
content indicating the extent of weathering
(Akamigbo, 1984). They also have higher
quantity of fine sand which is due to the age of
those areas as attested by their weathering
index f.s/c.s (fine sand/coarse
sand=73/16=4.56). In AP of UG/02 profiles,
the fine sand ranges from 40-73 while the
coarse sand ranges from 14-36 and it is
decreasing with depth. The findings further
confirm the observation of Obi and Asiegbu
(1980) that the low clay and silt content of
surface soil horizons in this area were
attributed to the high detachability and
transportability of these lighter soil materials.
The low content of silt and clay is essentially
due to the low content of these properties in
their parent materials (Akamigbo and Asadu,
1983)
Bulk Density and total porosity The bulk density values are relatively high. It
ranged from 1.2g/cm3-1.6g/cm3. The value
obtained from the top soils of the severely
eroded soil was (1.4 g/cm3) lower than the
bulk density values of the top soil of less
severely eroded site (1.6g/cm3). This could be
due to agricultural activities going on at the
less severely eroded site and again as a result
of soil and structure degradation. Mbagwu et
al (1985) observed that high B.D which tends
to loosen the structures is as a result of soil and
structure degradation. The top soil of severely
eroded soil had more O.M and so the reason
for lower B.D because O.M has the tendency
of reducing B.D. Increases in total porosity are
often correlated with decreased bulk density.
This was observed in these samples. The total
porosities of the samples are moderate ranging
between 39% and 54% and the values
decreased with depth due to little compaction
by overburden pressure of the materials on the
surface. The pore space in UG/02 of 39% is
less than that in UG/01 of 54%. This could be
attributed to the resultant effect of intensive
cultivation which leads to compaction.
Compaction reduces the pore spaces and void
spaces making it difficult for water to enter the
soil or for plant to grow resulting to erosion.
Infiltration Rates.
The infiltration rates are rapid and moderately
high in the two pedons investigated ranging
from 60cm/hr to 150cm/hr (Table 1) in the two
pedons. In all, the steady states were reached
in about one hour. In the two cases, the
infiltration rates decreased with time. The
infiltration rates, as a function of time is an
indication of the observed textural pattern of
the soil encountered. The infiltration rates are
moderate to high, which could be as a result of
the nature of the parent materials, which is
sandstone.
Chemical Properties
Table 2 shows that all the chemical properties
were generally low in both sites and even in
the auger samples. The values obtained from
the less severely eroded site were higher than
the ones obtained from the severely eroded site
indicating that erosion has really affected the
site more than the other.
Soil pH
The soil pH was generally extremely low
ranged from extremely acidic to strongly
29
Umeugochukwu, Chude and Nnaji NJSS/22(1)/2012

acidic for both the less severely eroded site
and the eroded but controlled site with their
values ranging from 3.9-5.1 in the both sites.
The pH in the severely eroded site is extremely
acidic with the values ranging from 4.0 - 4.1.
The pH values in the less severely eroded site
and the eroded but controlled site are lower
than that in the severely eroded site showing
that they are less acidic than the severely
eroded site. The acidic level of the severely
eroded soil is significantly greater than the
acidic levels of the eroded but controlled and
less severely eroded soil (Table 3). The high
acidic level of the less severely eroded soil
than that of the eroded but controlled soil
could be attributed to farming activities, since
there is bound to be addition of inorganic
fertilizers. The high acidity in the eroded sites
could also be in accordance with the findings
by Akamigbo and Igwe (1990) that high
acidity is recorded in many eroded soils which
facilitates erosion process because the basic
elements which usually influence aggregation
are lost when soil reaction is in the strongly to
extremely acidity of these soils. This could be
responsible for high aluminum saturation and
very low calcium and magnesium content of
the soils (Table 2). There is equally significant
difference in the aluminum and hydrogen
content of these soils (Table 3). The
implication is that it will take a longer time to
increase the pH if a crop that is not tolerant to
low pH is to be planted there. The control also
helped in increasing the pH of the area.
The Organic Carbon and Total Nitrogen
The organic carbon was higher especially in
the top layer of the severely eroded soil than in
the less severely eroded site. It ranged from
very low to high in all. The values ranged from
0.21% - 2.01% in the severely eroded site and
0.37 – 1.16% in the less severely eroded site. It
was decreasing with depth except in the less
severely eroded site, where may be illuviation
or leaching has taken place. The rainfall
intensity and cultivation have contributed to
leaching of the organic carbon deeper to the
last layer where the plants cannot access it.
The Ap horizon of the severely eroded site
recorded higher organic carbon because the
place was left fallow since erosion was almost
claiming the place and accumulation of plant
debris increased organic matter content.
Morgan (1979), regarded soils with less than
2% organic matter as erodible. The severely
eroded site had more than 2% organic content
on its top layer yet more severely eroded. This
indicates that organic matter is not the only
factor that determines erodibility. The reason
for this very site being much eroded could be
majorly due to slope of 12%, the soil type and
the farming activities going on there.
Total nitrogen values ranged from very low to
moderately low in the two soils. The values
ranged from 0.01 – 0.12%. The highest value
was recorded in the severely eroded soil. The
values were decreasing with depth due to
mineralization by high temperature and
leaching since nitrogen is soluble. No
significant difference between the less
severely eroded soil and eroded but controlled
soil because of the parent material of the area
is same. This is so because the effect of the
erosion on the control site is more on
recovering the lost nutrients. There is the
tendency that it will increase with time when it
must have been fully recovered.
Exchangeable Bases, Exchangeable Acidity,
C.E.C and Base Saturation.
For both soils, the severely eroded, less
severely eroded and eroded but controlled
sites, the exchangeable bases were generally
low. Na ranged from 0.01- 0.03meq/100g of
soil, K ranged from 0.01-0.12meq/100g of
soil, Ca ranged from 0.1- 1.6meq/100g of soil,
and Mg ranged from 0.2- 1.0meq/100g of soil.
The eroded but controlled site recorded higher
Mg2+ content than the rest of the soils. This
could be the effect of the control given to the
place. The low levels of this could be
attributed to the texture and structure together
with the environment of the study area. The
control reduced the erodibility of the bases.
Low exchangeable bases in erosion prone area
have been confirmed by Mbagwu (1986). The
exchangeable acidity is low ranging from 0.1 -
0.4 cmol/kg the values could be due to parent
30
Impact of soil erosion on land

material of the area. The effective cation
exchange capacity (ECEC) and apparent
cation exchange capacity (ACEC) of the
studied soils are very low and may be due to
clay composition of the area. Kang and Juo
(1981) referred to such soils as low activity
clay soils (LAC).
The percentage base saturation values are
generally low to high and ranged from 14%-
73%. The high base saturation values of the
soils could be attributed to properties inherited
from the local parent material. Akamigbo and
Asadu (1986) showed that parent materials
have a strong influence on total exchangeable
bases and total acidity of soils.
Available Phosphorus.
The values of available P from severely eroded
site ranged from 34-53mg/kg and 42-87mg/kg
in the less severely eroded soil. The values are
moderate to high which could be attributed to
the element being present in the parent
material. The high values could be attributed
to the result of inorganic fertilization by
farmers in the less severely eroded and organic
deposits in the severely eroded sites. The
profile at the less severely eroded site had
significantly higher phosphorus than the others
probably due to fertilizations. However,
available phosphorus is usually low in high
acid soils which tend to fix phosphorus by
forming insoluble aluminum phosphate
(Unamba – Opara, 1990).
Heavy Metals.
Lead was only identified in the severely
eroded site and the value was 8.89ppm with
AAS. The value is below hazardous level. Iron
value was 11.7ppm for both the severely and
less severely eroded site. The type of iron
analyzed was Fe2+. Zinc value was 5.2ppm in
the severely eroded site and 4.16ppm in the
less severely eroded site and 5.85ppm in the
eroded but controlled site. Copper value in the
severely eroded site was 1.64ppm and
0.82ppm in the less severely eroded site (Table
2). There was no cadmium identified in the
area. Heavy metal components of the samples
were low and these values may be influenced
by the content in parent material as well as the
human activities of the area. The highest
concentration of these metals (Pb, Fe, Zn, Cu,
Cd) are recorded in the Ap horizon of the
UG/01 pedon. The higher values of these
metals in the area could be attributed to the
higher organic matter content of that area:
because Wild (1996) said that organic matter
absorbs cadmium, copper, and lead but more
of lead and copper than cadmium which is
evident in the study area. Soil pH generally
plays an important role in the availability of
metals, toxicity and leaching capability to
surroundings (Chimuka et al 2005). Heavy
metals are mostly more soluble and leached in
acidic soils.
Erosion Control Measures
So far efforts are in progress to see that the
area is rescued from the incidience of erosion
hazards. Local materials like bamboo trees,
elephant grasses (Pennisetum purpurem ),
diversion ditches and sand bags are used to
construct barriers in the area prone to erosion.
Government efforts through the Task Force on
soil Erosion Control have contributed to
erosion control by constructing culverts and
other measures to see that erosion is combated
some sites have been controlled before but due
to the type of soil and topography of the area
aided by anthropogenic activities of man in the
area, the gully is increasing despite all the
efforts to control it.
CONCLUSION
Erosion was identified as the major land
degradation problem in Uga town of Anambra
State. There are differences in physical and
chemical properties and also the heavy metal
in the soils of severe degradation and less
severe degradation. The soils of severe erosion
recorded higher values of exchangeable
acidity, %clay, %silt, heavy metals than the
site with less severe erosion. The bulk density
is lower than that of the less severe
degradation. It must be borne in mind that the
soils are naturally poor in chemical attributes
and degradation of land is prominent in Uga
31
Umeugochukwu, Chude and Nnaji NJSS/22(1)/2012

and the degradation potentials are high loss of
nutrients, poor structures e.t.c. If nothing is
done to it now, one day the whole land may be
lost to erosion. To ensure continuous usage of
the land and at the same time derive maximum
returns from the land and preserve it for future
use, sound conservation measures are very
essential. So every Uga indigene should be
encouraged to participate in the restoration of
the land to avoid these stated hazards.
RECOMMENDATIONS
Government and the village should enact a law
that will mandate the indigenes to use the
correct building orientation to build houses
and also stop quarrying of sands.
Rural Policy on agricultural land uses should
be made and enforced so that there would be
reduced misuse of the land.
Creation of awareness through mass education
about the soils of the area will help to let the
people know the implications of using it
wrongly.
Soil conservation should be made a
multidisciplinary course involving every
discipline
Conservation team should form a monitoring
team that will be visiting all corners of the
town and report any case that needs urgent
attention. Defaulters of conservation rules
should be sanctioned. An effective engineering
construction must be preceded by appropriate
environmental impact assessment studies. The
existing gullies should be reforested.
32
Impact of soil erosion on land
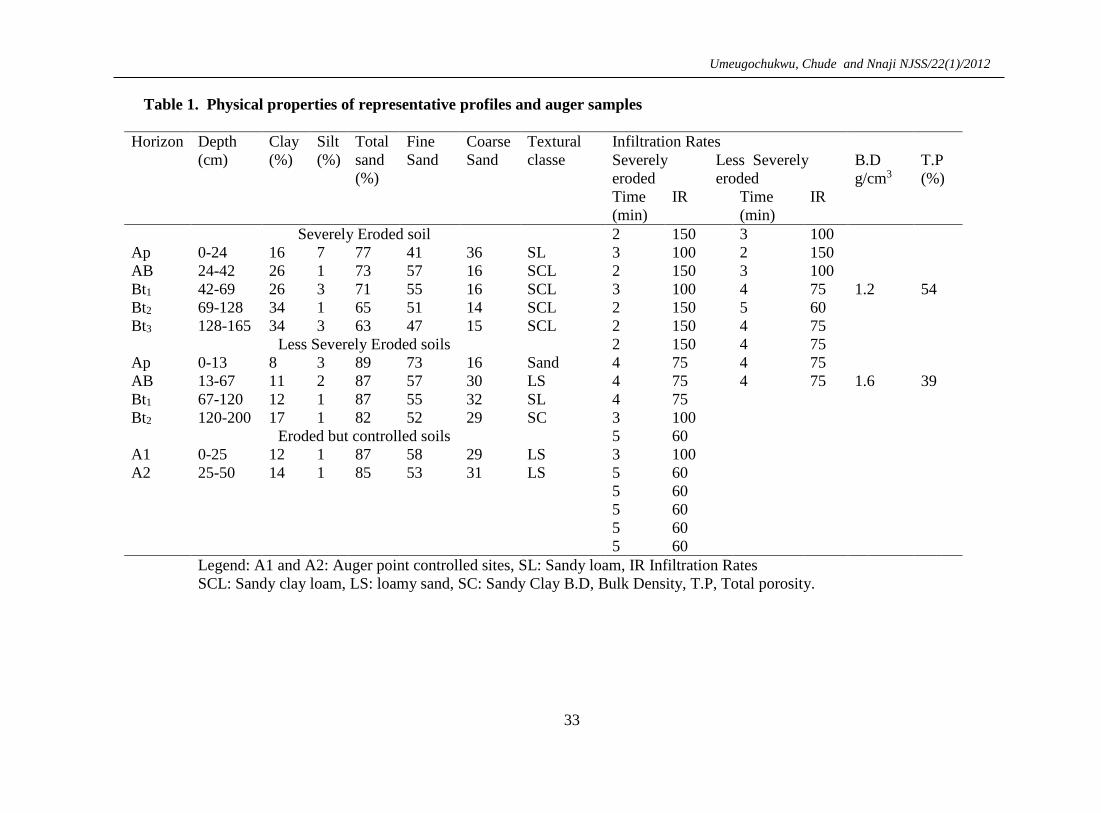
Table 1. Physical properties of representative profiles and auger samples
Horizon Depth
(cm)
Clay
(%)
Silt
(%)
Total
sand
(%)
Fine
Sand
Coarse
Sand
Textural
classe
Infiltration Rates
Severely
eroded
Less Severely
eroded
B.D
g/cm3
T.P
(%)
Time
(min)
IR Time
(min)
IR
Severely Eroded soil 2 150 3 100
Ap 0-24 16 7 77 41 36 SL 3 100 2 150
AB 24-42 26 1 73 57 16 SCL 2 150 3 100
Bt1 42-69 26 3 71 55 16 SCL 3 100 4 75 1.2 54
Bt2 69-128 34 1 65 51 14 SCL 2 150 5 60
Bt3 128-165 34 3 63 47 15 SCL 2 150 4 75
Less Severely Eroded soils 2 150 4 75
Ap 0-13 8 3 89 73 16 Sand 4 75 4 75
AB 13-67 11 2 87 57 30 LS 4 75 4 75 1.6 39
Bt1 67-120 12 1 87 55 32 SL 4 75
Bt2 120-200 17 1 82 52 29 SC 3 100
Eroded but controlled soils 5 60
A1 0-25 12 1 87 58 29 LS 3 100
A2 25-50 14 1 85 53 31 LS 5 60
5 60
5 60
5 60
5 60
Legend: A1 and A2: Auger point controlled sites, SL: Sandy loam, IR Infiltration Rates
SCL: Sandy clay loam, LS: loamy sand, SC: Sandy Clay B.D, Bulk Density, T.P, Total porosity.
33
Umeugochukwu, Chude and Nnaji NJSS/22(1)/2012

Table 2. The Chemical properties of the representative profiles and auger samples and the heavy metal contents
Hori Depth
(Cm) Ph C
(g/kg)
N
(g/kg)
Av.P
(mg/kg)
Exchangeable Bases
(Cmol/Kg)
C.E.C
(Cmol/kg)
B.S
(%)
Exch, acidity
(Cmol/Kg)
Na+ K+ Ca2+ Mg2+ ACEC ECEC AL3+ H+ Pb Fe Zn Cu Cd
Severely Eroded Soil
Ap 0-24 4.0 2.01 0.12 53 0.01 0.06 1.6 0.4 2.8 5.4 73 0.3 0.2 8.89 11.7 5.2 1.64 trce
AB 24-42 4.0 0.87 0.07 37 0.01 0.03 0.4 0.2 2.2 3.44 29 0.2 0.4
Bt1 42-69 4.0 0.50 0.04 39 0.01 0.03 trace 0.2 1.7 2.54 14 0.2 0.4
Bt2 69-128 4.1 0.25 0.02 47 0.01 0.01 trace 0.6 1.8 2.92 33 0.1 0.4
Bt3 128-
165
4.1 0.21 0.01 41 0.01 0.03 trace 0.2 1.2 1.84 20 0.2 0.2
Less severely eroded soil
Ap 0-13 4.2 1.08 0.09 87 0.01 0.12 0.2 0.4 1.8 2.83 40 0.1 0.2 trace 11.70 4.16 0.82 trace
AB 13-67 3.9 0.62 0.05 59 0.02 0.03 0.2 0.2 1.8 2.62 24 0.2 0.2
Bt1 67-
120
4.1 0.37 0.03 42 0.01 0.03 0.4 0.2 2.0 3.04 32 0.1 0.3
Bt2 120-
200
4.0 1.16 0.01 76 0.01 0.02 0.4 0.2 1,5 2.43 42 0.1 0.2
Eroded but controlled soil
A1 0-25 5.1 0.87 0.08 51 0.01 0.06 0.4 1.0 1.9 3.57 32 0.1 0.1 trace 5.85 5.85 1.23 trace
A2 25-50 4.5 0.62 0.05 42 0.01 0.04 0.1 0.2 1.6 2.25 22 0.1 0.2
34
Impact of soil erosion on land

Table 3: Statistical table showing the F-values and significant values of the chemical
properties analyzed.
Variable F-Value Eroded but
controlled
Less severely
eroded
Severely eroded
pH 15.444** 4.80a 4.05b 4.04b
Carbon 0.009NS 0.745 0.768 0.808
Nitrogen 0.001NS 0.45 0.45 0.052
Phosphorus 3.525* 46.50b 66.00a 43.40b
Sodium 0.845NS 0.01 0.125 0.01
Potassium 0.437NS 0.05 0.05 0.032
Calcium 0.081NS 0.250 0.30 0.40
Magnesium 1.417NS 0.60 0.25 0.32
ACEC 0.206NS 1.750 1.775 1.940
ECEC 0.272NS 2.91 2.73 3.23
B.S 0.141NS 27.00 34.50 28.04
Al3+ 2.876* 0.100 0.125 0.200
H+ 3.092* 0.150 0.225 0.320
Legend: * and ** = P< 0.05 and 0.01 percent significant levels, NS= not significant,n=2,4,5
for eroded but controlled, less severely eroded and severely eroded respectively. D.f=1.
REFERENCES Akamigbo, F.O.R and Asadu, C.L.A, 1983.
The accuracy of field textures in a
humid tropical environment. Soil
Survey and land Evaluation 4(3); 63-
70.
Akamigbo, F.O.R and Asadu, C.L.A. 1986.
The influence of toposequence some
soil parameters in selected areas of
Anambra state, South-Eastern Nigeria.
J. of Soil Science 6: pp 35-46.
Akamigbo, F. O. R 1984. The accuracy of
field textures in the humid tropical
environment. Soil Survey and Land
Evaluation, 4(3) 63-70.
Akamigbo (1986) Guide on erosion control.
Star printing publishing co; Uwani Enugu
1:21pp
Akamigbo, F.O.R 1996. Major Environmental
problems and their impacts in Anambra
State. An invited paper presented at the
1st stakeholder workshop on
Anambra State environmental action
plan, Ikenga, Hotel, Awka, Anambra
State. Organized by Santon
Consultants, Lagos.
Badiane A. 2009. Executive Summary of
Structure Plans For Awka, Onitsha And
Nnewi And Environs 2009-2027. United
Nations Human Settlements Programme
publications can be obtained from un-
habitat Regional Information Offices or
directly from Nairobi Kenya.
http://www.unhabitat.org/pmss/getElec
tronicVersion.asp?nr=2684&alt =1
Barrow, C. J. 1992. Land Degradation.
Cambridge Univ. Press, New York.
Bouyoucos, C. J. 1951. Direction for making
mechanical analysis by the hydrometer
method. Soil Sci. 42; 25-229.
Bray, R. H. and L. T Kurtz 1945.
Determination of total organic
carbon and available forms of
phosphorus in soils. Soil Sci. 59; 39-
45.
Bremmer, J.M 1965; Total Nitrogen in C.A.
Black methods of soil analysis, part I. Am Soc. Argron.9; 1149-2278.
35
Umeugochukwu, Chude and Nnaji NJSS/22(1)/2012

Bruce, A M and Whiteside, P. J 1984.
Introduction to Atomic Absorption
Spectrophotometer, 3rd ed, Pye Unicam
limited, England. 150pp.
FAO 1977. Guidelines on profile description
Rome.
Jackson, M. C. 1958: Soils Chemical
Analysis. An advance Course
University of Wisconsin, U. S. A.
Kang, B. T. and Juo, A.S.P. 1981.
Management of low acidity clay (LAC)
soils in tropical Africa for food crop
production workshop, Kigali, Kwanza.
June 2nd -12th.
Mbagwu, J.S.C 1986. Effects of soil erosion
on the productivity of agricultural
lands in Humid tropics Beitrage trop.
Landwritch.Verterinarmeat.24:H.2 161
-175
Mclean, E. O. 1965. Aluminum. Methods of
Soil analysis part 2. Ed. C. A. Black.
Am. Soc. of Agronomy.
Morgan, R.P.C 1979. Tropic in applied
Geography. Soil erosion.Longman
Group ltd, London pp.39-41.
Obi, M. E. and Asiegbu, J. O. 1980. The
physical properties of some eroded
soils of south-eastern Nigeria’, Soil
Science, Vol 130, pp 39 – 48.
Soil Survey Staff, 2010 Keys to Soil
Taxanomy. United States Department
of Agriculture (USDA), 9th ed. P 263-
285.
Unamba-Opara, I. 1990, 1988. Lecture
discussion Department of Soil Science,
University of Nigeria, Nsukka.
Vomicil, T. A. 1965. Porosity. In C. A. Black
(ed.), Methods of Soil Analysis Part 1.
American Soc. of Agron. 9:299-314.
Walkley, A. and I. A. Black 1934.
Determination of organic carbon in
soil. Soil Sci 7; 29-38.
Wild, A. A 1996. Soils and the environmental:
An introduction. Cambridge
University press U.K.
36
Impact of soil erosion on land

CHARACTERIZATION OF PHOSPHORUS STATUS IN SOILS OF THE GUINEA
SAVANNA ZONE OF NIGERIA.
S.O. AMHAKHIAN1 AND I.O.OSEMWOTA2 1Department of Soil and Environmental Management, Kogi State University,
Anyigba. Kogi State
08064469673: email [email protected] 2Department of Soil Science, Ambrose Alli University, Ekpoma, Edo State
ABSTRACT This study was undertaken in Kogi State of Nigeria to determine: the various phosphorus forms in the soils; Twenty composite surface soil samples (0-15cm depth) drawn from two distinct geological formations (Cretaceous sediments and Basement complex) were used for the study. These soils were collected from different sites with varying cropping history. The soils were analysed for physical and chemical properties. Total and organic P were determined by standard laboratory procedure while inorganic P forms by fractionation. Available p ranged from 1.57 to 23.52mg/kg with a mean of 7.58mg/kg while Organic P content ranged from 18.94 to 171.00mg/kg and from 24.31 to 485.93mg/kg with means of 56.56 and 134. 94.mg/kg for Cretaceous Sediments and Basement complex Soils, respectively. Total P content ranged from 28.94 to 320mg/kg with mean of 188.36mg/kg. Eighty five percent of the soils were deficient in available Bray P1 extractable P based on established critical level of 15mg/kgP for Nigerian soils. Total P and organic P were a bit high in these soils and were in the following order: Ca-P>Fe-P> Saloid-P>A1-P. INTRODUCTION Phosphorus is one of the major elements and it is second in importance to nitrogen in terms of nutrient requirement for increased crop production in most tropical soils. Phosphorus determination is an important factor to be considered in the evaluation of soil fertility. The quantity and relative distribution of various forms of P are of great importance to soil genesis and fertility studies. Enwezor and Moore (1966) worked on some savanna and forest soils and provided the first phosphorus fractionation of Nigerian soils using Change and Jackson’s procedure. They found that over half of the extractable phosphorus was present as iron phosphorus, the remainder being made up of approximately equal quantities of aluminum and calcium phosphates. Klleinman et al. (1999), noted that the distribution of P
was closely related to the pedogenetic evolution of soils with the more matured soil having low P status. They observed that the distribution of the active fraction (Al-P, Fe-P and Ca-P) and their abundance in soil are dependent on pH, the solubility product of the different phosphate, the cations present and the degree of weathering.
Loganathan and Sutton (1987) and Ibia and Udo (1993) in their work reported the influence of parent material on the forms and distribution of P in southern Nigeria and concluded that soils formed on coastal plain sands and sandstones parent materials were more weathered than those on alluvium, beach sands and shale parent materials. Udo (1985) observed a wide variation in the abundance of
37
Amhakhian and Osemwota NJSS/22(1)/2012

total P ranging from 68 mgkg - 1 in some acid coastal plain sands to over 2000mgkg-1 in soils derived from basaltic rocks and detail deposits. Also Uzu et al. (1985), Udo and Dambo (1987), Loganathan and Sutton (1987) and Ibia and Udo (1993) found that the relative abundance of the active inorganic P fractions decreased in the order Fe-P> AI-> Ca – P in most Nigeria Soils. There is paucity of information as regards P status in soils of Guinea Savanna of Kogi State. Hence, the first objective of this study was to study the distribution of phosphorus status in some soils of guinea savanna of Kogi State of Northern Nigeria and the second objective was to determine the various forms of P in the soils of the area under study,.
MATERIAL AND METHODS The study area, Kogi State, lies between latitude 50 151 to 70 451 North and Longitude 50 451 and 80 451 east of the equator. Twenty surface soil samples (0-15cm) were collected from pre-classified sites. The twenty composite soil samples were used for the physical and chemical properties (routine analysis) determination and the contents of various forms of phosphors in the soils. Total P was extracted by the perchloric acid digestion method (Jackson, 1994) and the organic form by the ignition method as described by Legg and Black (1955). Inorganic P was sequentially fractionated using the procedure outlined by Chang and Jackson (1957) as modified by IMPHOS (1980) to exclude the occluded and reductant-soluble forms. Available P was extracted with acid fluoride using the Bray P-1 and Bray P-2 method (Bray and Kurtz, 1945). Phosphorus in each extract was determined colorimetrically by the blue colour method of Murphy and Riley (1962). RESULTS AND DISCUSSION Forms and Distribution of P. The results of phosphorus distribution in soils of Guinea savanna of Kogi State are shown in Table 1. Available Phosphorus The content ranged from 1.57 to 23.52 mg/kg with an average of 7.58 mg/kg. Based on the critical level of 15mg/kg, 85 percent of the soils were deficient in available phosphorus
(table 1). Available phosphorus was generally low, thus indicating the poor phosphorus fertility of the guinea savanna soils. Apart from soils of Ganaja, Eni (Ogori-Mangogo), Abejukolo and Idah all other soils were generally below the critical level of 15mg/kg established for Nigerian Soils. Effective cation exchange capacity and pH were positively and significantly correlated with available P with “r” values of 0.551* and 0.452*, respectively (Table 2). Available P and Saloid P were positively and significantly correlated with “r” value of 0.992***. Organic Phosphorus. This varied within each geological formation and between the geological formations based on their parent materials. The mean values of organic phosphorus forms were calculated to be 76.94. Organic P constituted between 87 to 93% of the total phosphorus, the least content was obtained in Ikanekpo (18.94 mg/kg P) while the highest organic P in soils formed on the Basement complex was obtained from Eni (485.50 mg/kg P). Effective cation exchange capacity and pH were positively and significantly correlated with organic P (Table 2). Total Phosphorus. In Table 1 total phosphorus contents of the soils were generally low indicating the poor phosphorus fertility of the soils. Generally total P content ranged from 28.94 to 320 mg/kg P with a mean of 188.36 mg/kg P. The low phosphorus content of some tropical soils has been attributed to low apatite content of the soil forming minerals (Guzel and Ibrika, 1994). Parent rocks of the soils studied consisted mainly of schists, granite gneisis and sandstones, all of which have low apatite inclusion; parent material may also offer an explanation for the observed differences in total P values between the soils since matured soils possess low P values (Enwezor, 1977), the low P content of these savanna soils, in addition to the low apatite content, may be due to their maturity. Inorganic Phosphorus. The distributions of various forms of inorganic phosphorus in the soils studied are shown in Table1. The content of Al-P was low; it varied from 0.06 to 0.60 mg/kg P in the soils with a mean of 0.18mg/kg. Al-P was positively and
38
Phosphorus status in soil
significantly correlated with clay (r = 0.534*). Saloid P (part of total active P) was generally low, it ranged from 0.06 to 44.28 mg/kg P with a mean of 3.39mg/kg P. Saloid P contributed little to total P and was positively and significantly correlated with pH and ECEC (r = 0.505* and0.668** respectively). The Fe–P content was higher than that of Al–P in all the soils. Fe–P content ranged from 0.06 to 33.25 with a mean of 3.94mg/kg P. Fe-P was positively and significantly correlated with clay and Fe2O3 contents (r = 0.833** and 0.487* respectively). The higher amount of Fe-P of all the other active fractions is expected since the soils were essentially slightly acidic. Ca-P content was generally low, except in soils of Ikanekpo, Idah, Ofunene, Ihima and Ehika as would be expected in soils of the savanna regions. Ca–P content was higher than Fe-P and Al-P. The low amount of Ca-P found in these soils may be due to possible conversion of Al-P and Fe-P in the acidic to slightly matured soils of these ecological zones. The preferential formation of Ca-P relative to Al-P neutral in acidic soils has been reported by Lindsay and Moreno (1960). The contribution of this fraction to total extractable inorganic P ranged from 0.66 to 25.27 mg/kg P with a mean of 6.71mg/kg in the soil. Ca-P was positively and significantly correlated with clay (r = 0.534*). Occluded Fe and Al-P content of the soils ranged from 0.13 to 8.11 with a mean of 1.31. It contributed very little to total P. It was positively and significantly correlated with clay and Fe2O3 with “r” values of 0.685** and 0.596**, respectively. Reductant P content for the soils ranged from 0.19 to 9.71 mg/kg P with means of 0.50mg/kg P. It was positively and significantly correlated with organic matter and Fe2O3 (r = 0.531* and 0.527*, respectively). Although residual P formed a dominant proportion of inorganic P, it was still very low. The low fraction of residual P in some soils may be attributed to lack of factor
responsible for retaining P in the non-extractable form. The relative amounts of inorganic P fractions had been used to assess the extent of pedogenetic processes. On the Chang and Jackson (1958) scale, the observed distributions of the inorganic P forms indicated that all the soils were moderately weathered and are capable of fixing reasonable proportion of the existing small amounts of the native soil phosphorus in relatively unavailable form. The Ca-P was more in amount than Fe-P, which in turn were greater than Saloid P, occluded P and Al-P. The abundance were in the following order: Ca-P = Fe-P > Saloid-P > Occluded Fe > Al-P. This sequence of abundance of the inorganic fraction was also observed by Uzu et al., (1975). Correlation coefficients among the phosphorus forms and between soils physio-chemical properties are shown in Table3. Saloid P. was positively and significantly correlated with active-P, Organic-P and available-P (r = 0.537*, 0.794** and 0.992***, respectively). Fe-P was positively and significantly correlated with active-P and reductant-P (r = 0.681* and 0.862** respectively). Ca-P had a positive and significant correlation with active-P (r = 0.615**). Active-P was also positively and significantly correlated with reductant-P, organic-P and available-P (Table3). CONCLUSION The result shows that soils in guinea savanna of Kogi State differ in their phosphorus status in relation to the parent materials. Various P forms correlated with available P indices. 85% of the soil in the zone were deficient in available P. This means that the area will require P fertilizer for cropping, thus justifying the need for routine soil test for P in order to achieve fertilizer best practice for crop production.
39
Amhakhian and Osemwota NJSS/22(1)/2012

Table 1 Phosphorus forms in Soils of Kogi State. S/N Location Saloid P Al – P Fe – P Ca – P Active – P Red –P Occlu. Occlu
P Fe&AlP
Res. P
Org. P Total P Avail Bray
P1Extra Table
1. Anyigba 0.46 0.13 1.13 1.58 2.87 0.53 0.53 0.26 293.46 53.91 351.10 2.86
2. Abejukolo 7.19 0.13 4.85 0.85 13.02 0.59 0.59 2.30 65.18 171.00 244.90 20.42
3. Ajaka 0.39 0.06 1.33 1.98 3.76 0.71 0.71 0.26 241.76 61.06 307.16 9.00
4. Ikanekpo 1.32 0.13 1.59 16.49 19.53 0.66 0.66 0.59 278.30 18.94 316.70 10.01
5. Umomi 0.52 0.26 0.06 1.12 1.96 0.39 0.39 0.13 310.09 63.41 386.46 8.00
6. Ochaja 0.52 0.13 1.79 0.79 3.23 0.39 0.39 0.19 230.44 36.39 270.12 7.57
7. Idah 1.71 0.33 33.25 22.30 57.57 0.73 0.73 8.11 44.77 48.02 157.5 19.00
8. Odenyi 0.39 0.06 2.19 3.63 6.93 0.66 0.66 1.32 164.84 104.32 277.02 3.50
9. Okpo 0.19 0.19 1.59 2.64 4.61 0.53 0.53 1.25 472.11 24.09 502.40 9.29
10. Kontokarfi 1.10 0.13 1.46 3.72 6.41 0.62 0.62 1.20 297.93 30.06 335.12 6.24
11. Ofunene 0.33 0.13 1.59 25.27 27.32 0.79 0.79 0.59 50.95 81.29 108.61 2.86
12. Obehira 2.17 0.19 1.66 0.85 4.87 0.19 0.19 0.13 31.38 52.62 87.52 3.14
13. Ihima 0.39 0.13 2.19 22.57 25.28 0.53 0.53 0.13 99.73 51.58 176.86 2.21
14. Ishanlu 0.39 0.13 2.32 8.64 11.48 0.66 0.66 0.92 18.81 63.85 95.33 3.00
15. Ayetorogbede 0.72 0.13 3.12 0.66 4.63 0.53 0.53 0.06 07.14 24.31 98.94 10.36
16. Mopa-Moro 0.06 0.19 3.15 1.45 5.15 0.19 0.19 0.26 33.39 86.37 125.52 5.14
17. Ganaja 5.08 0.13 4.98 1.32 11.51 0.99 0.99 4.75 86.28 320.05 418.56 17
18. Ofere 0.33 0.60 4.65 2.04 7.68 0.73 0.73 0.72 48.88 81.57 140.19 1.57
19. Eni(OgoriMangogo) 44.28 0.14 3.12 1.05 48.59 0.86 0.86 1.45 102.99 485.93 595.54 23.52
20. Ehika 0.65 0.23 2.31 15.25 18.44 0.95 0.95 1.12 58.59 101.85 180.30 2.16
40
Phosphorus status in soil

Table 2: Correlation Coefficient between P Forms and Soil Physcio-chemical Properties Total P Org P Sal. P Ca-P Al-P Fe-P Occ.Fe&A
l-P
Act. P Red. P Bray P1-
P
Clay -0.145 -0.044 -0.211 0.290 0.534* 0.830** 0.685** 0.545* 0.139 -0.044
Silt -0.335 0.323 0.296 0.128 0.144 0.285 0.185 0.397 0.810 0.323
pH -0.314 0.452* 0.505* -0.256 0.103 -0.153 0.007 0.111 0.036 0.452*
OM -0.380 0.375 0.185 0.188 0.202 0.325 0.385 0.373 0.531* 0.375
Al2O3 -0.122 -0.247 -0.194 0.333 -.089 0.367 0.266 0.229 -0.181 -0.247
Fe2O3 -0.081 0.271 0.167 0.001 0.380 0.487* 0.596** 0.335 0.527* 0.271
ECEC -0.196 0.551* 0.668** 0.342 0.185 0.142 0.079 0.685** 0.268 0.551*
* = Significant at 5% level of probability.
** = Significantly at 1% level of probability.
Table 3: Correlation Coefficient among forms of Phosphorus. Saloid-P Al-P Fe-P Ca-P Act-P Occl-P Red-P Total-P Organ-P Avail-P Resid.P
Saloid-P - - 0.095 0.004 - 0.187 0.537* 0.304 0.304 0.029 0.794** 0.992*** -0.130
Al-P - 0.351 0.033 0.126 0.044 0.147 - 0.309 - 0.0650 - 0.085 -0.209
Fe-P - 0.388 0.681** 0.186 0.862** - 0.176 - 0.172 0.033 -0.297
Ca-P - 0.615** 0.325 0.246 - 0.108 - 0.079 -0.165 -0.243
Act-P - 0.462 0.589* - 0.125 0.543* 0.568* -0.358
Occl-P - 0.467 0.168 0.523* 0.292 -0.187
Red-P - 0.0661 0.410 0.087 -0.325
Total-P - - 0.065 0.059 0.393
Organ-P - 0.748** -0.341
Avail-P - -0.083
Residual-P -
* = Significantly at 5% level of probability.
** = Significantly at 1% level of probability.
*** = Significantly at 0.1% level of probability.
41
Amhakhian and Osemwota NJSS/22(1)/2012

Table 4 Physico-chemical properties of soils used for study Location % % % Textural
Class
pH(H2O) g/kg g/kg Mg/kg
Cmol/kg
Al203 Fe203
Kg
Clay Silt Sand OM N Ca Mg Na K H+ AL ECEC
Anyigba
Abejukolo
Ajaka
Ikanekpo
Umomi
Ochaja
Idah
Odenyi
Okpo
Kotokarfi
Ofunene
Obehira
3.40
4.40
4.40
3.40
2.40
3.40
15.40
5.40
4.40
3.50
9.40
2.40
6.50
4.50
3.50
4.00
3.50
3.00
10.50
14.50
6.50
4.40
5.00
6.50
90.10
90.10
92.10
92.10
94.10
93.66
74.10
80.10
89.10
92.10
85.60
91.10
Sand
Sand
Sand
Sand
Sand
Sand
Sandy Loam
Sandy Loam
Sandy Loam
Sand
Loamy Sand
Sand
5.88
5.45
4.63
6.00
5.35
6.42
5.34
6.30
6.62
5.01
5.60
6.90
17.20
13.20
4.90
5.50
3.30
7.10
2.50
12.20
15.00
6.10
11.80
6.70
6.20
5.60
2.00
2.00
1.00
2.20
6.60
5.20
66.60
3.00
6.00
4.00
5.51
0.54
1.28
0.54
0.55
7.73
24.50
12.8
0.92
1.32
0.54
0.54
4.08
2.72
1.92
4.16
2.72
2.40
6.96
5.66
5.04
2.72
10.16
2.96
2.00
0.56
1.20
1.84
1.52
1.08
3.44
1.60
1.76
0.56
3.52
2.24
2.84
0.84
0.66
0.78
0.84
0.72
0.91
0.84
0.97
0.84
0.66
0.84
0.35
0.84
0.08
0.05
0.15
0.11
0.54
0.17
0.19
0.84
0.13
0.19
0.20
0.50
0.30
0.60
0.20
0.60
0.50
0.20
0.60
0.50
0.30
0.70
0.20
0.50
0.40
0.20
0.60
0.10
0.30
0.50
0.40
0.80
0.20
0.70
7.63
5.99
4.56
7.66
5.54
4.88
12.65
8.92
9.96
6.27
14.98
7.64
45.50
34.00
25.60
36.70
31.00
43.50
52.00
23.70
34.50
46.60
32.50
49.00
6.50
2.50
1.50
7.50
6.00
2.65
26.50
11.00
16.50
18.00
5.50
4.10
Ihima
Ishanlu
Ayetorogbede
Mopa-Moro
Ganaja
Ofere
Eni
Ehika
3.40
3.40
3.90
6.90
3.90
5.90
1.90
3.10
84.50
5.50
9.00
10.00
6.00
10.00
12.00
6.80
48.10
91.10
87.10
83.10
90.10
84.10
86.10
90.10
Loamy Sand
Sand
Loamy Sand
Sandy loam
Sand
Loamy Sand
Loamy Sand
Sand
5.40
5.60
5.50
5.99
6.69
5.89
7.32
6.25
11.70
13.20
2.60
12.20
18.80
14.50
18.20
31.70
5.00
6.00
5.00
6.00
6.00
1.00
1.30
6.90
0.54
10.95
1.60
0.54
7.07
10.31
11.21
11.95
13.81
5.04
3.60
5.28
8.64
10.40
19.38
8.64
4.96
2.24
0.64
2.08
0.32
3.30
5.40
0.32
0.97
0.48
0.84
0.84
0.78
0.84
0.91
0.77
0.14
0.17
0.45
0.33
0.30
0.18
1.14
0.20
0.30
0.20
0.46
0.80
0.70
2.20
0.30
0.20
0.90
0.50
0.50
0.30
0.20
0.20
0.40
0.60
21.11
8.63
6.44
9.64
7.14
15.19
27.57
7.39
45.00
21.20
37.00
16.00
74.50
18.50
24.00
37.50
3.20
2.50
14.50
7.50
23.20
21.50
17.90
21.30
42
Phosphorus status in soil

REFERENCES
Agbenin, J.O. and Agboola, A.A. (1986). Phosphorus Sorption by Three Cultivated Savanna Alfisols as Influenced by pH. Fertilizer. 37-42.
Bray, R.H. and Kurtz, L.T., 1945.
Determination of total, organic and available forms of phosphorus in soils. Soil Sci., 591: 39-45.
Chang, S.G. and Jackson, M.L., 1957.
Fractionation of phosphorus. Soil Sci., 84: 133-144.
Enwezor, W.O. and Moore, A.W. (1966).
Phosphorus Status of Nigerian Soils Science 102(5) 31 312-328.
Enwezor, W.O., 1977. Soil testing for
phosphorus in some Nigerian soils. 3. Forms of phosphorus in soils of southeastern Nigeria and their relationship to plant available phosphorus. Soil., 124: 27-33.
Guzel, N.N and Ibrika, H. (1994). Distribution
Fractionation of soil phosphorus in
particle size separation in soils of Western Turkey. Communication Soil
science and Plant Analysis. 25 (17 & 18) 2945-2958.
IMPHOS, 1980. Phosphorus in tropical soils:
assessing deficiency levels and phosphorus requirements. Scientific Publ. No. 2., World phosphate Institute, Paris.
Ibia, T. O. and Udo, E. J. 1993. Phosphorus
forms and fixation capacity of representative soils in Akwa Ibom State of Nigeria. Geoderma. 58: 95-106.
Jackson, M.L., 1964. Soil Chemical Analysis.
Prentice Hall, Englewood Cliffs, NY, 498 pp. Juo, A.S.R. and Ellis, B.G., 1968. Chemical and physical properties of iron and aluminum phosphates and their relationship to phosphorus availability. Soil Sci. Soc. Am. Proc., 32: 216-221.
Kleinman, P.J..A; Bryant, R.B. and Rad, W.S.
(1999). Development of Pedotransfer Functions to quantity Phosphorus Saturation of Agricultural Soil. Journal of Environmental Quality. 28: 2026-2030.
Legg, J.O. and Black, C.A., 1955.
Determination of organic phosphorus in soils. 11: Ignition method. Soil Sci. Soc Am. Proc., 19: 139-142.
Lindsay, W.L. and Moreno, E.C (1960).
Phosphate phase equilibria in soils. Soil Science Society of America proceedings. 24: 177-182.
Loganathan, P. and Sutton, P.M., 1987.
Phosphorus fractions and availability in soils formed on Different ecological deposits in the Niger Delta area of Nigeria. Soil Sci., 143: 16-25.
Murphy, J. and Riley, J.P., 1962. A modified
single solution method for the determination of phosphorus in natural waters. Anal. Chim. Acta., 27: 31-36.
Udo, E.J. 1985. Phosphorus status in major
Nigeria soils. In: Soil Testing, Soil Tilth and Post Clearing Land Degradation in the Humid Tropics. Proceedings of International Society of Soil Science (Commission IV and VI). Soil Science Society of Nigeria, Ibadan. Pp 90-103.
Udo, E.J. and Dambo, V.I., 1979. Phosphorus
status of the Nigerian Coastal Plain sands. J. Agric. Sci., 93: 281-289.
Udo, E.J. and Ogunwale, J.A., 1977.
Phosphorus fractions in selected Nigerian Soils. Soil Sci. Soc. Am. J., 41: 1146.
Uzu, F.O., Juo, A.S.R. and Fayemi, A.A.A.,
1975. Forms of phosphorus in some important agricultural soils of Nigeria. Soil Sci., 120: 212-218.
43
Amhakhian and Osemwota NJSS/22(1)/2012

PHYSICAL AND CHEMICAL PROPERTIES OF SOILS IN KOGI STATE,
GUINEA SAVANNA ZONE OF NIGERIA
S.O. AMHAKHIAN1 AND I.O. OSEMWOTA2 1Soil and Environmental Management Department, Kogi State University, Anyigba
2Soil Science Department, Ambrose Alli University, Ekpoma, Edo State
ABSTRACT
This experiment was conducted in Kogi State. Twenty composite surface soil samples (0.15cm
depth) drawn from two distinct geological formations (Cretaceous sediments and Basement
complex) were used for study. These soils were collected from different sites with varying
cropping history. Particle size analysis of the soils used indicated a high proportion of sand, the
texture of the soils ranged from sand to loamy sand. All the soils used had very low organic
matter contents. Available P ranged from 1.57 to 23.52mg/kg with a mean of 7.58mg/kg while
organic P content ranged from 18.94 to 171.00mg/kg and from 24.31 to 485.93mg/kg with
means of 56.56 and 134.94mg/kg for Cretaceous Sediments and Basement complex soils
respectively. Total P content ranged from 28.94 to 320mg/kg with a mean of 188 36mg/kg.
Eighty five percent of the soils were deficient in available Bray P1 extractable P based on
established critical level of 15mg/kg P for Nigerian soils. Total P and organic P were a bit high
in these soils. Residual P was more in abundance of all the inorganic fractions. The levels of
micronutrients in most of the soils used were moderately high.
INTRODUCTION The study area which is Kogi State, lies
between latitutde 50 151 to 70 451 N and
longitude 50 451 and 80 451 East of the equator.
The mean annual rainfall ranges from
1.560mm at Kabba in West to 1.808mm at
Anyigba in the East. The dry season generally
extends from November to March. During this
period, rainfall drops drastically to less than
12.0 mm in any of the months. The
temperature shows some variation throughout
the years. Average monthly temperature varies
from 17oC to 36.2oC. The state has two main
vegetations; the forest savanna mosaic zone
and the southern guinea zone. The State has
two main geological formations; they are the
Basement complex rocks to the west while the
other half is on Cretaceous sediments, to the
North of the confluence and east of River
Niger. The state is known for cultivation of
arable crops such as yam, cassava, maize,
groundnut cowpea, but its soils like the most
soils in north central agricultural zone of
Nigeria have high erodibility, are structurally
weak, coarse textured with low organic matter
status. Specifically there is dearth of
information on the physical and chemical
properties of the soils in different agro-
ecological zones of Kogi State, specifically
with reerence to availability of phosphorus and
micro-nutrients, which are known to limit
performance of arable crops and are often not
supplied by chemical fertilizer. The objective
of this work is to evaluate the chemical
properties of soils in different locations of
Kogi State of Nigeria.
44
Properties of soil in Kogi State

MATERIALS AND METHODS Twenty surface soil samples (0-15cm) were collected from pre-classified sites (FDALR 1985). A composite surface soil sample constituted ten cores taken randomly from each of the sampling sites with the aid of auger and mixed into a bag. Two composite samples were taken from places indicated in Table 1. Samples were air dried, crushed with the aid of wooden roller and sieved through 2mm sieve and stored in plastic container with covers. Particle size was determined by hydrometer method. Soil pH was measured in a soil: water ratio of 1:1 with the aid of glass electrode pH meter, organic matter was determined by wet dichromate acid oxidation method, exchangeable bases (Ca, Mg, K and Na) were extracted with 1N NH4OAC buffered at pH7. The Ca and Mg were determined using atomic absorption spectro photometer, K and Na were read on flame photometer, exchangeable acidity was extracted with 1N KCL (Thomas, 1982) and determined by fitration with 0.05N NaOH using phenolphthalein as indicator. Nitrogen was determined by Macro Kjedahl method, effective cation exchange capacity (ECEC) was calculated by the summation of exchangeable bases (Ca, Mg. K and Na) and exchange acidity (Carter, 1993). Percentage
base saturation (PBS) was calculated by multiplying total exchangeable bases by 100 and dividing by ECEC. Extractable micronutrients (Mn, Fe, Zn and CU) were determined by double acid method. Dithionate extractable Fe and Al (Free Fe and Al oxides soils) were determined by method of Mehra and Jackson (1960). Total phsphorus was determined by perchloric acid (HCLO4) digestion method and organic phosphorus was determined by ignition method. Available P was estimated by Bray P-1 method.
RESULTS AND DISCUSSION Properties of the Experimental Soils: The physical and chemical properties of the soils used for the experiments are showed in Table 2 while the mean, range and coefficient of variation values of the properties are presented in Table 3. The micronutrient contents are shown in table 4. The texture of the two geological formations:- Basement complex soils and Cretaceous sediments ranged from sand to loamy sand. The clay, silt and sand contents ranged from 19.00 to 154.00g/kg, 30.00 to 145.00g/kg and 741.00 to 941.00g/kg with a mean of 45.00, 68.00 and 835.00g/kg respectively. They also have co-efficient of variations of 64.50g/kg, 46.70g/kg and 5.70g/kg, respectively (Table 3).
Table 1: Land use and Soil classification of sampling and experimental soils S/N Sampling
locations
Coordinates Land use Soil taxonomy
(USDA)
1 Anyigba 7o30’N/7o09’E Oil palm, cassava, mango, maize, yams and cashew
Typic Tropustult
2 Abejukolo 7o40’N/7o16’E Shrub, melon, oranges and groundnut Typic Hyplustult 3 Ajaka 7o09’N/6o49’E Bambara nut, tomatoes and yam Arenic paleustult 4 Ikanekpo 7o22’N/7o36’E Oil palm, yam and cassava Psammentic Haplustalf 5 Umomi 7o19’N/7o00’E Cashew, oranges, cassava and oil palm Rhodic Eutrustox 6 Ochaja 7o25’N/7o14’E Cashew, oranges, mango, coffee and cassava Typic Tropustult 7 Idah 7o06’N/6o43’E Pepper, cassava, yam and rice Typic Tropaqualf 8 Odenyi 7o47’N/7o02’E Sugarcane, cassava and mango Typic Hapludult 9 Okpo 7o12’N/7o31’E Cassava, oil palm and yam Arenic Paleustult 10 Kontokarfi 8o05’N/6o48’E Cashew, cassava and mango Typic Hapludult 11 Ofunene 7o27’N/6o40’E Grasses, cassava and yam Aquic Kandiustalf 12 Obehira 7o30’N/6o11’E Yam, cassava and melon Typic Haplustalf 13 Ihima 7o36’N/6o12’E Tomatoes, maize and oranges Typic Paleustalf 14 Ishanlu 8o16’N/5o48’E Cassava, maize and oranges Aquic Tropopsamment 15 Ayetoro-gbede 7o58’N/5o59’E Iroko tree, yams, and maize Kandic Ustropept 16 Mopa-Moro 8o05’N/5o54’E Fallow land consisting mainly of grasses Typic Haplaquept 17 Ganaja 7o46’N/6o44’E Cassava, maize and cashew Rhodic Ustropept 18 Ofere 7o25’N/5o46’E Yam, cassava, maize and iroko trees Typic Plinthustalf 19 Eni 7o26’N/6o10’E Cassava, yam and oranges Typic Haplaquepts 20 Ehika 7o40’N/6o25’E Cassava and maize Typic Haplustalf
Source: 1: Kogi State Agricultural Development Project Zonal Office Anyigba
Amhakhian and Osemwota NJSS/22(1)/2012

2: College of Agriculture, Kabba, Kogi State.
The pH of the soils ranged from slightly
alkaline (7.32) to strongly acidic (5.01) in
reaction with a mean of 5.9 and coefficient of
variation (CV) of 11.35%. Kontokarfi location
recorded the lowest pH (5.01) while Eni
(Ogori Mangogo) the highest pH (7.32). The
pH was positively and significantly correlated
with Ca (r = 0.65**), ECEC (r = 0.584*) and
Mn (r = 0.510*). It was negatively and
significantly correlated with Bo (r = 0.567*).
The pH of most agriculture soils in the tropics
has been reported to range from 5.0 to 6.8
(Udo and Dambo, 1979). Organic matter
content ranged from 3.3g/kg to 31.7g/kg with
a mean of 13.8g/kg and coefficient of variation
of 51.77%. These values of organic matter are
low when compared to values reported by
Enwezor et al. (1990). The critical level of
organic matter for optimum crop production
was given as 30g/kg (Agboola and Corey,
1972). The low value of organic matter
coupled with the sandy texture of the soil
would encourage a rapid leaching of cations
into the subsoil from the surface soils. The
soils were therefore low in ECEC and tended
to be low in available P and total nitrogen.
This is in agreement with earlier evaluation of
Balasubramanian, et al. (1984). Organic matter
was positively and significantly correlated
with Ca, Bo, extractable Mn and Cu with (r)
values of 0.644**, 0.681** 0.581** and
0.578* respectively. It was also negatively and
significantly correlated with Mg and
extractable Mn with (r) values of -0.644* and -
0.404* respectively (Table 5). Total nitrogen
content of both soils (Basement complex soil
and Cretaceous sediments) was low. Total
nitrogen content was below the critical level of
1.50g/kg for optimum maize production in
Nigeria (Agboola and Corey, 1972). The total
nitrogen content ranged from 0.01 to 1.20g/kg
with a mean of 0.06g/kg and co-efficient of
variation of 383.67% (Table 3). The soils are
deficient in total nitrogen. It has been
documented that temperature and moisture
have profound effects on nitrogen availability
through their effect on nitrogen mineralization,
transformation and movement (Adepetu and
Corey, 1985). Total nitrogen content of the
soil, was positively and significantly correlated
with ECEC, Mn and Fe with r values of
0.410*, 0.416* and 0.525* respectively. It was
negatively and significantly correlated with Ca
(r = -0.554*). Exchangeable calcium ranged
from 1.92 to 19.34 cmol/kg with a mean of
6.39 cmol/kg and a coefficient of variation of
70.52%. Exchangebale calcium was the
principal saturating cation being the mostly
abundant exchange cation in these soils and
occupied an average of 75% of the exchange
site. The critical level of exchangeable Ca was
given as 2.6 cmol/kg (Agboola and Corey,
1972). Based on this level, 20% of the soils are
deficient in exchangeable Ca Exchangeable Ca
was positively and significantly correlated
with ECEC, Al2O3. Zn and Mn contents with r
values of 0.836**, 0.475*, 0.585* and 0.508*
respectively. It was also negatively and
significatly correlated with Al2O3 content with
(r) values of -0.475* (Table 5).
Exchangeable sodium content of the soils
ranged from 0.48 to 0.94 cmol/kg with a mean
of 0.81 cmol/kg and conefficient of variationof
14.04% (Table 3). Exchangeable Na was
positively and significantly correlated with
copper contents with ‘r’ value 0.578*. It was
also negatively and significantly correlated
with Mo content with ‘r’ values of -0.495*
(table 3). Exchangeable magnesium content of
the soils ranged from 0.32 to 5.44 cmol/kg
with a mean of 2.03 cmol/kg and coefficient of
variationof 71.77% (Table 3). Exchangeable
Mg was positively and significantly correlated
with ECEC, Zn. Zn, Mn and Cu with ‘r’ values
of 0.449*, 0.553*, 0.451* and 0.460*,
45
46
Properties of soil in Kogi State

respectively (Table 5). Exchangeable
potassium content of the soils ranged from
0.05 – 0.84 with a mean of 0.34 cmol/kg
(Table 2). It had a coefficient of variation of
90.35%. Exchangeable K was positively and
significantly correlated with ECEC and Zn
with ‘r’ values of 0.499* and 0.716**
respectively. It was also negatively and
significantly correlated with Bo, and Fe with
‘r’ values of -0.642** and -0.479**
respectively. The critical level of exchangeable
K for most crops was given as 0.20 cmol/kg.
Based on the value, 60% of the soils were
deficient in exchangeable K. The
exchangeable bases were in order to
abundance in the soils studied. They were of
the order Ca > Mg > Na > K. The soil
exchangeable acidity comprises of
exchangeable H+ and exchangeable Al3+,
exchangeable H+ ranged from 0.20 to 0.80
cmol/kg with a mean of 0.41 cmol/kg and
coefficient of variation of 48.07% (Table 3).
Exchangeable H+ was positively and
significantly correlated with Mn (r = 0.485*).
It was negatively and significantly correlated
with Zn and Cu contents (r = -0.557* and -
0.630* respectively. Exchangeable Al3+ values
ranged from 0.10 to 0.90 cmol/kg with a mean
of 0.45 cmol/kg. Effective cation exchange
capacity (ECEC) ranged from 4.56 to 27.57
cmol/kg with a mean of 12.85 cmol/kg and a
coefficient of variation of 58.28% (Table 3).
47
Amhakhian and Osemwota NJSS/22(1)/2012

Table 2: Physico-Chemical properties of soils used for study Fe203
Location
% % % Textural
Class
pH(H2O) g/kg g/kg Mg/kg
Cmol/kg
Al203 Kg
Clay Silt Sand OM N Ca Mg Na K H+ Al ECEC
Anyigba
Abejukolo
Ajaka
Ikanekpo
Umomi
Ochaja
Idah
Odenyi
Okpo
Kotokarfi
Ofunene
Obehira
3.40
4.40
4.40
3.40
2.40
3.40
15.40
5.40
4.40
3.50
9.40
2.40
6.50
4.50
3.50
4.00
3.50
3.00
10.50
14.50
6.50
4.40
5.00
6.50
90.10
90.10
92.10
92.10
94.10
93.66
74.10
80.10
89.10
92.10
85.60
91.10
Sand
Sand
Sand
Sand
Sand
Sand
Sandy Loam Loamy Sandy
Loam Sand
Sand
Loamy Sand
Sand
5.88
5.45
4.63
6.00
5.35
6.42
5.34
6. 30
6.62
5.01
5.60
6.90
17.20
13.20
4.90
5.50
3.30
7.10
2.50
12.20
15.00
6.10
11.80
6.70
6.20
5.60
2.00
2.00
1.00
2.20
6.60
5.20
66.60
3.00
6.00
4.00
5.51
0.54
1.28
0.54
0.55
7.73
24.50
12.8
0.92
1.32
0.54
0.54
4.08
2.72
1.92
4.16
2.72
2.40
6.96
5.66
5.04
2.72
10.16
2.96
2.00
0.56
1.20
1.84
1.52
1.08
3.44
1.60
1.76
0.56
3.52
2.24
2.84
0.84
0.66
0.78
0.84
0.72
0.91
0.84
0.97
0.84
0.66
0.84
0.35
0.84
0.08
0.05
0.15
0.11
0.54
0.17
0.19
0.84
0.13
0.19
0.20
0.50
0.30
0.60
0.20
0.60
0.50
0.20
0.60
0.50
0.30
0.70
0.20
0.50
0.40
0.20
0.60
0.10
0.30
0.50
0.40
0.80
0.20
0.70
7.63
5.99
4.56
7.66
5.54
4.88
12.65
8.92
9.96
6.27
14.98
7.64
45.50
34.00
25.60
36.70
31.00
43.50
52.00
23.70
34.50
46.60
32.50
49.00
6.50
2.50
1.50
7.50
6.00
2.65
26.50
11.00
16.50
18.00
5.50
4.10
Ihima
Ishanlu
Ayetorogbede
Mopa-Moro
Ganaja
Ofere
Eni
Ehika
3.40
3.40
3.90
6.90
3.90
5.90
1.90
3.10
84.50
5.50
9.00
10.00
6.00
10.00
12.00
6.80
48.10
91.10
87.10
83.10
90.10
84.10
86.10
90.10
Loamy Sand
Sand
Loamy Sand
Sandy loam
Sand
Loamy Sand
Loamy Sand
Sand
5.40
5.60
5.50
5.99
6.69
5.89
7.32
6.25
11.70
13.20
2.60
12.20
18.80
14.50
18.20
31.70
5.00
6.00
5.00
6.00
6.00
1.00
1.30
6.90
0.54
10.95
1.60
0.54
7.07
10.31
11.21
11.95
13.81
5.04
3.60
5.28
8.64
10.40
19.38
8.64
4.96
2.24
0.64
2.08
0.32
3.30
5.40
0.32
0.97
0.48
0.84
0.84
0.78
0.84
0.91
0.77
0.14
0.17
0.45
0.33
0.30
0.18
1.14
0.20
0.30
0.20
0.46
0.80
0.70
2.20
0.30
0.20
0.90
0.50
0.50
0.30
0.20
0.20
0.40
0.60
21.11
8.63
6.44
9.64
7.14
15.19
27.57
7.39
45.00
21.20
37.00
16.00
74.50
18.50
24.00
37.50
3.20
2.50
14.50
7.50
23.20
21.50
17.90
21.30
48
Properties of soil in Kogi State

Table 3: Correlation coefficient matrix of the relationships among soil variables Clay %silt %sand pH Om N pH Ca Mg Na K H Al ECEC Al2O3 Fe2O3 Mo Bo Zn Mn Fe
%Clay 0.25 -0.118 0.246 0.200 0.023 0.510* 0.050 0.234 0.065 0.030 0.097 0.329 0.118 0.152 0.322 -0.209 0.109 0.109 0.152 0.959*** -0.359
%Silt -0.007 0.269 0.397 0.041 0.433 0.209 0.159 0.201 0.200 0.180 0.179 0.637** 0.224 0.230 -0.517* -0.224 0.224 0.632*** 0.220 0.123 %sand 0.001 0.383 0.044 0.588* -0.522 0.201 0.378 0.149 0.054 0.080 -0.490 0.057 -0.334 0.476* 0.040 -0.039 0.479** 0.078 0.135
P%om 0.283 0.260 0.117 0.650** 0.178 0.238 0.108 0.279 0.230 0.584* -0.088 0.039 -0.004 .0567* 0.298 0.510* 0.078 0.017
N 0.076 0.532 0.644** 0.644* 0.151 0.231 0.175 0.082 0.227 -0.328 0.394 -0.404* 0.681** -0.066 0.581** -0.019 0.578* P -0.161 0.554* -0.036 0.338 0.097 0.211 0.226 0.410* -0.025 0.525* 0.416* 0.332 0.076 0.416** 0.525* -0.190
Ca 0.303 0.215 0.021 0.271 0.235 0.234 0.064 0.226 -0.124 0.045 0.080 0.495** -0.508 0.525* -0.315
Mg 0.363 0.274 0.307 0.278 0.014 0.836** 0.475* 0.241 -0.508* -0.330 0.585* 0.508* 0.025 0.253 Na 0.266 0.149 0.253 0.026 0.449* -0.041 0.686 -0.230 -0.050 0.553* 0.451* 0.246 0.460*
K 0.344 0.213 0.252 0.361 0.258 -0.094 -0.495* -0.139 0.203 0.031 0.006 0.578*
H 0.077 0.299 0.499* 0.078 0.479* -0.157 0.642* 0.716*** 0.221 0.159 0.078 Al 0.170 -0.243 0.740 -0.073 0.087 0.174 -0.557* 0.485* 0.475* 0.630*
ECEC 0.132 0.227 -0.350 0.179 -0.089 0.233 0.154 0.118 0.193
Al2O3 0.155 0.169 -0.315 -0.241 0.667* 0.475* 0.057 0.499* Fe2O3 -0.224 0.206 0.303 -0.080 0.554** 0.156 -0.339
Exch. 0.989*** 0.118 0.096 -0.376 -0.024 -0.054
Mo 0.149 -0.001 0.131 -0.251 -0.079 Exch.
Bo -0.385* 0.174 0.089 -0.198
Exch. Zn
Exch. 0.321 0.479** 0.509* Mn
Exch.
Fe 0.321* -0.078 Exch
Ca
0.301
*, ** and *** Significant at 5%, 1% and 0.1% level of probability.
49
Amhakhian and Osemwota NJSS/22(1)/2012

The ECEC was positively and significantly
correlated with extractable Zn, Mn and Cu (r =
0.667**, 0.475* and 0.499* respectively).
However, ECEC had a non significant
negative correlation with Mo and Bo (r =
0.315 and -0.241 respectively) Available
phosphorus content ranged from 1.57 to 23.52
mg/kg with an average of 7.58 mg/kg. Based
on the critical level of 15 mg/kg, 85 percent of
the soils were deficient in avaialable P.
Available P had a very low coefficient of
variability of 7.15%. Available phosphorus
was generally low, thus indicating the poor
phosphorus fertility of the guinea savanna
soils. Apart from soils of Ganaja, Eni (Ogori-
Mangogo), Abejukolo and Idah all other soils
were generally below the critical level of
15mg/kg established for Nigerian Soils.
Effective cation exchange capacity and pH
were positively and significantly correlated
with available P with ‘r’ values of 0.551* and
0.452*, respectively (Table 3). Organic
phosphorus varied within each geological
formation and between the geological
formations based on their parent materials.
The mean values of organic phosphorus forms
were least in soils formed on Cretaceous
sediments when compared to that of the
Basement complex. The content of organic P
of Cretaceous sediments ranged from 18.94 to
171.00 mg/kg P with a mean of 56.56 mg/kg P
while that of the Basement complex soils
ranged between 24.31 to 485.93 mg/kg P with
a mean of 134.94 mg/kg P. Organic P
constituted between 87 to 93% of the total
phosphorus, the least content was obtained in
Ikanekpo (18.94 mg/kg P) while the highest
organic P in soils formed on the Basement
complex was obtained from Eni (485.50
mg/kg P). Total phosphorus contents of the
soils were generally low indicating the poor
phosporus fertility of the soils. Generally total
P content ranged from 87.52 to 595.79 mg/kg
P with a mean of 258.79 mg/kg P. The low
phosphorus content of some tropical soils has
been attributed to low apatite content of the
soil forming minerals. Parent rocks of the soils
studied consisted mainly of schists, granites,
granite gneisis and sandstones, all of which
have low apatite inclusive parent material.
This may also offer an explanation for the
observed differences in total P values between
the soils. Variation in total P in respect of
parent material has been demonstrated by
Rhodes (1977); Matured soils possess low P
values. The low P content of these savanna
soils, in addition to the low apatite content,
may be due to their maturity. Extractable Zn,
Mn, Fe, Cu, Bo and Mo ranged from 1.93 to
19.03, 6.69 to 26.95, 6.54 to 19.65, 1.91 to
3.98, 0.67 to 8.57 and 10.13 to 43.60 mg/kh
with a mean of 5.07, 16.02, 14.28, 2.71, 4.50
and 24.41mg/kg respectively (Table 4). They
had coefficient of variation of 72.00%,
39.73%, 25.08%, 21.03%, 48.08% and
86.23%, respectively. In terms of
micronutrients abundance in the soils, they
were in the following order: Mo > Mn > Fe >
Zn > Bo > Cu. Copper was sufficient in the
soils when compared to the critical level of 2 –
3mg/kg with the exception of Ehika soils
(Typic haplustalf) which was lower than
2.00mg/kg. With a critical level of 5.0mg/kg
for extractable Fe, the soils are said to be
adequate since all the soils used for the studies
were above critical level of 5.00mg/kg; except
Ayetorogbede (Kandic ustropept) in the
basement complex soil, the soils were
sufficient in available Zn (Table 4). The
contents of free Fe2O3 and Al2O3 ranged from
0.25 to 2.65%, 1.600 to 5.20% with a mean of
1.17 and 3.33%, respectively, (Table 2).
50
Properties of soil in Kogi State

Table 4: Extractable micronutrient contents of soils studied
S/N Location Mo Bo Zn Cu Mn Fe
Mg/kg
1.
2.
3.
4.
5.
6.
7.
8.
9.
10.
11.
12.
13.
14.
15.
16.
17.
18.
19.
20.
27.86
35.94
43.60
29.62
120.10
112.34
25.96
19.96
40.66
36.36
26.98
18.03
18.48
10.13
12.19
12.72
15.98
16.43
28.25
36.65
8.06
2.69
3.02
7.69
3.70
3.53
6.55
4.37
7.36
4.03
3.51
5.04
4.37
8.57
3.03
4.70
4.37
0.67
1.68
2.89
2.30
7.27
4.44
3.60
6.01
2.87
4.86
4.02
3.71
7.27
5.12
6.01
5.96
5.23
1.93
3.29
3.34
2.87
19.03
2.34
20.52
8.31
6.82
6.69
12.01
8.70
20.00
23.44
26.95
8.31
14.14
12.01
13.34
20.65
18.12
16.62
19.48
20.97
25.50
16.48
17.71
17.17
17.05
13.95
15.07
12.78
12.76
10.28
6.54
17.17
16.08
15.07
15.71
7.97
18.59
19.65
18.15
12.19
21.19
17.51
2.40
2.49
3.27
3.24
3.28
2.18
2.16
2.03
2.29
2.55
2.20
3.28
3.18
2.99
3.09
3.27
2.18
3.22
3.98
1.19
Table 5: Mean, range values and coefficient of variability of the physical and chemical
properties of soil studied
Properties Range
(%)
Mean
(%)
CV
(%)
pH (H2O)
Organic matter (g/kg)
Total N (g/kg)
P (mg/kg)
Ca (cmol/kg)
Mg (cmol/kg)
Na (cmol/kg)
K (cmol/kg)
H (cmol/kg)
Al3+ (cmol/kg)
ECEC (cmol/kg)
Fe2O3 (%)
Al2O3 (%)
Clay (g/kg)
Silt (g/kg)
Sand (g/kg)
5.01 – 7.32
03.3 – 31.7
0.01 -1.20
0.54 – 24.80
1.92 – 19.34
0.32 – 5.44
0.48 - 0.94
0.05 – 0.84
0.20 – 0.80
0.10 – 0.90
4.56- 27.57
0.25 – 2.65
1.60 – 5.20
19.00 – 154.00
30.00 – 145.00
741.00 – 941.00
5.91
13.8
00.6
5.95
6.39
2.03
0.81
0.34
0.41
0.45
12.85
1.17
3.33
45.50
68.90
835.10
11.35
51.77
383.67
116.42
70.52
71.77
14.04
90.35
48.07
51.71
58.28
64.54
31.59
64.51
46.70
5.70
51
Amhakhian and Osemwota NJSS/22(1)/2012

CONCLUSION Particle size analysis of the soils used
indicated a high proportion of sand, the texture
of the soils ranged from sand to loamy sand.
Since these soils were coarse grain in nature,
they may likely have low water and nutrient
retention capacities. All the soils used had very
low organic matter contents. The low organic
matter content might be due to rapid
mineralization of organic matter. Soils with
less than 2% organic matter are erodible. The
low level of organic matter content may
probably be responsible for the low ECEC and
nitrogen content of these soils. The levels of
micronutrients in most of the soils used were
moderately high. Organic matter was
positively and significantly correlated with Bo,
extractable Mn and Cu with “r” values of
0.681**, 0.578* respectively. Total P content
of the soils on average basis appeared to be
higher than what was reported for some native
rangeland soils of Northern Nigeria.
REFERENCE
Adepetu, J.A. and Corey, R.B. (1985).
Changes in N and P availability
fraction in Iwo soils from Nigeria,
under intensive cultivation. Plant and
Soil. 46: 309-316 Fertilize.
Agboola, A.A. and Corey, R.B. (1972). Soil
test calibration for N.P.K. for maize in
the soils derived from metamorphic
and igneous rocks of Western State of
Nigeria. Journal of West Africa Science
Association, 19(2): 93-100. Resources
6: (1) 65.
Balasubramanian, V., Nnadi, L.A. and
Mokwunye, A.U. (1984). Fertilizing
Sole crop maize for high yields.
Samaru Miscellaneous paper. 76, 14.
Cater, M.R. (1993). Soil Sampling and
Methods of Analysis. Lewis
Publishers. London. Page 23.
Enwezor, W.O.; Ohira, A.C., Opuwaribo,
E.E. and Udo, E.J (1990). A review of
fertilizer use on crops in southeastern
zones of Nigeria. In literature review
on soil fertility investigation in
Nigeria: pp 49-100.
FDALR (1985). Soil Map of Nigeria Federal
Department of Agricultural Land
Resources. Gee, G.W. and Bauder,
J.W. (1986). In Particle Size Analysis
Part 1. Physical and Microbiological
methods Second edition. Agronomy.
Series No 9. Soil Science Society of
America. America Society of
Agronomy. Madison, Wiscoson,
U.S.A.
Mehra, J. And Jackson, M.L. (1960). Iron
oxide removal from soils and clay by a
Dithioriate citrate system. Buffered
with sodium carbonate Clay Mineral.
7: 317-327.
Rhodes, ER. (1977). Phosphorus in Serra
Leone soils. Trop. Agric. (Trinidad).
54: 77-85.
Thomas, G.W. (1982). Exchangeable cation.
In A 1 page R.H. Moller and
D.R/Keeney (eds); methods of soil
analysis part 2 Second Edition.
America Society of Agronomy,
Madison pp. 157-164.
Udo, E.J. and Dambo, V.I. 1979. Phosphorus
status of the Nigeria coastal plain
sands. Journal of Agricultural Science,
(Cambridge) 93: 281-289.
52
Properties of soil in Kogi State

OYSTER SHELL COMPOST EFFECT ON SOME PHYSICAL AND CHEMICAL
PROPERTIES OF AN INLAND VALLEY SOIL
ENEJE, ROSETA C.1 AND UKUT, ASUAMA N.1 1Department of Soil Science and Agro-climatology, Michael Okpara University of Agriculture
Umudike, Nigeria. Email: [email protected]
ABSTRACT An experiment was conducted in the Soil Science laboratory of Michael Okpara University of Agriculture, Umudike to investiage the effect of oyster shell composted with goat and poultry droppings on some physical and chemical properties of an inland valley soil. The experiment was 4X3 factorial in completely randomized design. Soil samples were collected from 0-30cm depth. The treatments applied were compost of combinations of goat (G) droppings, poultry (P) droppings and oyster shell (OY) (G+P+OY, P+OY, G+OY, G+P) and the amendment rates were 0%, 10% and 20% respectively. Each treatment was replicated three times. The results show that the application of the manure composts improved soil pH, ECEC, available phosphorus, total nitrogen organic carbon, exchangeable acidity, and aggregate stability of the soil. The improvements in soil properties were relative to the rate of application of these amendments and sampling duration, G+P+OY treatments influenced total nitrogen, ECEC, available P most while P+OY was most effective on aggregate stability, exchangeable calcium and pH of the soil. Keywords: Oyster shell, goat dung, aggregate stability, manure compost, ECEC INTRODUCTION Soils and their potentials differ appreciably from location to location depending on the nature of the parent material and other environmental factors. Adequate knowledge of their characteristics is needed before proper management practices can be applied to ensure sustainable productivity. In Nigeria, the pressure from a rapidly expanding population and the concomitant increasing demand for food necessitate a rational exploitation of the limited land resources for the production of more food. Soils in waterlogged environment are part of the land resources that can be made available for such a purpose. Research reports indicate that waterlogged soils, because of their fluctuating water tables and periodical flooding, in most cases show fluctuation in their acidity level (Udo, 2001). Soil pH is
regarded as a very important property since it influences such properties as the degree of base saturation and control the availability of all plant nutrients. Thus in soils with low pH, iron, aluminum and manganese are present in their toxic levels while other basic cations like calcium and potassium are fixed in the soil. However, according to Mullins, (2002) livestock manure contains nutrient elements that can enhance the chemical and physical properties of soils and support crop production. These amendments do not drastically alter soil chemical properties over a short term, but promote and build up organic matter, thereby improving soil physical properties; they also improve soil tilth and water holding capacity through improved soil structure, biological activity and aggregate
53
Eneje and Ukut NJSS/22(1)/2012
stability. In addition, Sobulo and Jayeola (1977), reported that organic amendments incorporated into the soil, greatly improved texture, loosened heavy/compacted soils and bound together light textured ones making the soil more friable, warmer, more retentive of moisture and more congenial to plant in every way. It is therefore important to investigate the possibility of using organic amendments under the prevailing structurally and chemically limiting conditions of waterlogged soils to increase the potentials of this scarce resource (land) for crop production. The objectives of the study therefore, are to; (i) determine the effect of organic
amendments on the physico-chemical properties of waterlogged soils;
(ii) provide information on interactive effects of organic amendments on soil fertility and structural stability of waterlogged soils.
MATERIALS AND METHODS Study site The soil sample used for the experiment was collected from an inland valley created by Ibakwa River, after the Ibakwa Military Barracks in Abak Local Government Area of Akwa Ibom State. This area lies between latitutes 4o33’N and 5030’N and longitude 7035’E and 8025’E and is characterized by heavy rainfall (2500-4000mm), high relative humidity (79%) and heavy cloud cover. The temperature of the area is generally high and changes slightly during the year (UNIUYO Consult Limited, 2002). The area is located within the South-South geo-political zone (Niger Delta Region) of Nigeria. Sample Collection and Preparation The soil samples were collected with soil auger to a depth of 0-30cm, air-dried and sieved using 2mm mesh. Oyster is a sea food with the fleshy part eaten as meat and the shells are discarded in dumping sites near market places in Uyo Local Government Area of Akwa Ibom State. The oyster shells were collected dried, ground and sieved through a 2mm mesh. Poultry and goat droppings were collected from the University Livestock Farm,
air-dried, crushed and passed through 2mm mesh. Incubation and Composting of Material The organic materials were mixed in the ratio of 1:1 in the following manner; Poultry dropping + Goat dropping + Oyster shell (P+G+OY) or (OYM) Poultry dropping + Oyster shell (P+OY) Goat dropping + Oyster shell (G+OY) Goat dropping + poultry dropping (G+P) The mixed organic materials were incubated under shade for 10 days. During this period of incubation, adequate moisture and aeration were ensured by the addition of water and turning with a stick every two days to encourage microbial activities. At the end of the incubation period, these organic materials were used as soil amendment. Incorporation of Amendment The composted materials were mixed with the soil samples in 8-litre capacity buckets perforated at the bottom. The treatment rates were 0kg, 0.2kg and 0.4kg per 2kg of soil equivalent to 0%, 10% and 20% respectively. The treatment soils were watered at two-week intervals and samples taken at 2, 4 and 6 weeks. All the treatments were replicated three times. Soil Analysis The soil pH was determined in 1:2.5 soils to water ratio using pH meter (Mclean, 1965), the organic carbon was determined using the Walkley and Black (1934) dichromate wet oxidation method as modified by Piper (1942). Total nitrogen (N) was determined using the macro Kjeldahl method described by Jackson (1958) while available phosphorus (P) was determined using Bray II method as described by Bray and Kurtz (1945). The available phosphorus in the soil extract was determined colorimetrically using molybdate blue colour method of Murphy and Riley (1962). Exchangeable acidity was determined by the method of Mclean (1965). Exchangeable K, Ca, Mg and Na were determined by extracting soil samples in 1N NH4OAc. Effective cation exchangeable capacity was computed as the
54
Effect of oyster compost on soil

sum of exchangeable properties and percent base saturation (BS %) computed as: % BS = Ca + Mg + k + Na x 100 ECEC 1 Aggregate stability was determined using the mean weight diameter method as described by Kamper (1965). Bulk density was determined usig the core method, while particle size distribution was determined using the method of Bouyoucos (1962). Data Analysis Data were analyzed using the analysis of variance (ANOVA) as outlined by Steel and Torrie (1980) using a 4 x 3 factorial in CRD. The factors were; factor A = Type of
amendment (G+P+OY, P+0Y, G+OY and G+D) factor B = Amendment rates (0%, 10% and 20%). The Fisher’s Least Significant difference (FLSD) as 5% probability level was used to separate the means. RESULT AND DISCUSSION The properties of the soil used are shown in Table 1. The soil used was a slightly acidic clay loam with medium organic carbon, low exchangeable cation content and high availale P. The oyster shell had high neutralizing equivalent value (CaCO3 = 116) suggesting that it is a good liming material. The Mg content of poultry dropping was very low (0.46%), but highest in the oyster shell (2.71%), while K and Na were low in all the materials.
Table 1: Physico-chemical properties of soil studies Characteristics Value Sand (%) Silt (%) Clay (%) Textural class pH H2O (1:2.5) Calcium (cmol/kg) Magnesium (cmol/kg) Potassium (cmol/kg) Sodim (cmol/kg) Exchangeable acidity (cmol/kg) Organic carbon (g/kg) Total Nitrogen (%) Effective cation exchange capacity (ECEC) cmol/kg) Available phosphorus (mg/kg) % Base saturation
68.52 5.17 26.31 Sandy clay loam 5.27 6.52 2.13 0.16 0.08 0.99 13.17 0.04 9.88 23.34 89
Table 2: Characteristics of materials used for composting Properties Materials Poultry Manure Goat Dropping Oyster Shell
Available phosphorus (ppm) Calcium (cmol/kg) Magnesium (cmol/kg) Potassium (cmol/kg) Sodium (cmol/kg) Nitrogen (%) CaCO3 equivalent
0.18 1.25 0.46 0.37 0.09 1.35
-
0.72 0.97 1.03 0.29 0.07 1.25
-
0.06 37.3 2.71 0.01 0.01
- 116
The effects of the composts on the Mean
Weight Diameter (MWD) of the soil show that
aggregate stability (AS) increased as the
compost rate increased and with the duration
55
Eneje and Ukut NJSS/22(1)/2012

of incubation. The values were highest with
OY+P treatment and least in the control soil
(Table 3). The effects of treatment, rate and
treatment and rate interaction effects
(P<0.001) on aggregate stability, were
significant at all sampling times. The increase
can be attributed partly to improvements in
organic carbon content. Mullins (2002)
observed that the incorporation of organic
residue increased organic carbon and its
various fractions which contribute to the
formation and stabilization of soil aggregates.
In addition, Mbagwu and Piccolo (1990)
reported that organic manure application
improved the degree of soil aggregation and
aggregate stability. In this study, compost-
treated soils performed better than the control
in affecting the physicochemical properties
studied. The G+P+OY treatment was most
effective in improving the exchangeable
cations and ECEC with the largest increase
obtained at the sixth week of improving the
exchangeable cations and ECEC with the
largest increase obtained at the sixth week of
sampling, with highest rate of compost
application. The improvement in ECEC is
attributable to the decomposition of organic
matter contained in the composts. Base
saturation increased with G+OY treatment in
line with the liming ability of oyster shell.
Exchangeable calcium was high in the material
which explains the significant increase in
treated soils compared to the control. Edem et
al (1998) and Mullins, (2002) had reported
increases in exchangeable magnesium,
calcium and potassium content of soil, with
application of poultry and goat manures which
is enhanced by the addition of oyster shell.
Therefore, the results from this study confirm
these observations and agree that organic
manure with oyster shell has positive effect on
soil exchangeable properties.
56
Effect of oyster compost on soil

Table 3: Physico-chemical properties of compost amended soils at different sampling ‘times Rate OC
(%)
Total N
(%)
Avail. P
PPM
Soil activity
Exchangeable cations (Cmol/kg) BS(%) AS
H2O CaCl2 Ca Mg Na K EA ECEC
Two Weeks
Control (0%)
Oym(10%)
G+P(10%) Oy+p(10%)
Oy+g(10)
Oym(20%) G+P(20%)
Oy+p(20%)
Oy+g(20%) FLSD(0.05)T
FLSD(0.05)R
FLSD(0.05)TR
1.03
1.61
1.56 1.86
1.82
1.92 1.69
1.62
1.53 0.136
0.118
0.237
0.04
0.07
0.06 0.09
0.08
0.08 0.29
0.07
0.07 0.01
ns
ns
0.24
0.29
0.26 0.39
0.58
0.26 0.39
0.61
0.45 0.052
0.045
0.091
6.54
7.53
7.62 7.64
6.83
7.72 7.63
7.54
7.77 0.309
0.268
0.536
4.25
6.96
6.64 6.80
6.17
7.00 6.75
6.47
6.78 0.237
0.205
0.411
6.48
25.36
37.12 28.81
15.44
38.64 33.92
21.12
42.40 8.16
7.07
14.13
2.10
5.17
9.36 7.52
4.35
9.69 7.35
6.42
9.57 2.581
2.235
4.47
0.05
0.07
0.06 0.07
0.07
0.07 0.07
0.09
0.07 0.006
0.005
0.010
0.13
0.20
0.09 0.16
0.29
0.11 0.21
0.35
0.23 0.021
0.018
0.037
0.96
1.36
2.15 1.60
1.16
1.56 1.68
1.52
1.32 0.255
0.221
0.441
9.72
28.08
48.79 38.15
21.31
50.07 43.23
29.50
53.60 10.09
8.74
17.48
90.12
94.95
94.74 95.74
94.28
96.09 96.11
94.83
97.48 1.04
0.90
1.80
0.25
0.72
0.40 0.84
0.33
0.44 0.87
0.36
0.81 0.015
0.014
0.027
Four weeks
Control (0%)
Oym(10%) G+P(10%)
Oy+p(10%)
Oy+g(10) Oym(20%)
G+P(20%) Oy+p(20%)
Oy+g(20%)
FLSD(0.05)T FLSD(0.05)R
FLSD(0.05)TR
1.03
1.65 1.60
1.95
1.83 1.97
1.73 1.58
1.66
0.144 0.124
0.249
0.04
0.07 0.07
0.37
0.08 0.08
0.09 0.07
0.08
0.129 0.112
0.224
0.24
0.29 0.26
0.39
0.58 0.26
0.39 0.45
0.61
0.05 0.05
0.09
6.54
7.54 7.64
7.66
6.83 7.74
7.65 7.79
7.54
0.309 0.268
0.535
4.25
6.98 6.65
6.82
6.18 6.98
6.77 6.90
6.48
0.241 0.209
0.418
6.48
25.59 37.18
28.86
15.45 38.76
33.98 43.21
21.13
8.20 7.10
14.2
2.10
5.22 9.37
7.54
4.36 9.70
7.36 9.59
6.44
2.577 2.232
4.463
0.05
0.07 0.07
0.08
0.08 0.08
0.08 0.08
0.08
0.007 0.006
0.011
0.13
0.21 0.13
0.18
0.31 0.17
0.25 0.26
0.37
0.025 0.022
0.044
0.96
1.40 2.19
1.65
1.19 1.60
1.25 1.36
1.55
0.375 0.325
0.649
9.72
28.27 48.94
38.31
21.39 26.31
43.38 50.52
29.56
9.17 7.94
15.89
91.12
95.16 94.96
95.64
94.28 96.04
96.01 97.46
94.83
1.01 0.87
1.75
0.40
0.76 0.50
0.88
0.40 0.55
0.89 0.94
0.43
0.019 0.017
0.034
Six Weeks
Control (0%)
Oym(10%)
G+P(10%) Oy+p(10%)
Oy+g(10)
Oym(20%) G+P(20%)
Oy+p(20%)
Oy+g(20%) FLSD(0.05)T
FLSD(0.05)R
FLSD(0.05)TR
1.03
1.71
1.57 2.06
1.85
2.01 1.78
1.67
1.60 0.151
0.131
0.262
0.40
0.08
0.08 0.11
0.07
0.08 0.09
0.08
0.08 0.012
0.009
0.019
0.24
0.30
0.26 0.39
0.58
0.27 0.39
0.61
0.45 0.052
0.045
0.089
6.54
7.57
7.65 7.73
6.84
7.75 7.67
7.55
7.79 0.301
0.260
0.521
4.25
7.01
6.68 6.85
6.49
7.17 6.78
6.50
6.93 0.245
0.212
0.424
6.48
25.59
37.23 28.93
15.50
39.22 34.04
21.18
43.21 8.32
7.20
14.41
2.10
5.26
9.38 7.77
4.38
9.74 7.41
6.49
9.62 2.55
2.21
4.43
0.05
0.08
0.07 0.08
0.08
0.08 0.09
0.08
0.08 0.005
0.004
0.009
0.13
0.25
0.13 0.22
0.28
0.17 0.26
0.30
0.24 0.05
0.044
0.089
0.96
1.42
2.22 1.67
1.22
1.62 1.74
1.57
1.35 0.261
0.226
0.453
9.92
29.10
49.18 38.68
22.38
50.83 43.52
29.62
54.51 10.27
8.89
17.78
90.12
95.21
95.63 94.24
94.24
96.01 94.71
94.71
97.45 0.571
0.494
0.988
0.52
0.76
0.56 0.92
0.46
0.62 0.96
0.53
0.95 0.202
0.017
0.034
The composted materials affected total N,
avaialble P percent, organic carbon and soil
acidity, and there were increases in the
strength of relationships between these
properties with time. The trend of effect of the
treatment on total N, available P and percent
organic carbon relative to the control,
irrespective of application rate, indicates that
the improvements were highest with the
combinations of G+P+OY. The pH (H2O) of
the treated soil was raised from moderately
acidic to neutral (7.54) which showed that the
composts were effective in eliminating the soil
acidity, with highest value obtained at the sixth
week. Mullins (2002) had attributed these
changes to the neutralizing effect of oyster
shell and poultry droppings stressing that the
liming effect is due to calcium carbonate in
poultry feed. Generally, the relationship
between selected properties with the compost
type and rate of application indicated that the
rate and type of compost amended soil was
responsible for only about 38% and 17% of Na
and organic carbon after two weeks of
incubation. However, after four to six weeks
of compost incorporation with the soil, this
effect on available P was diminished by half
while the exchangeable Na became higher.
This study has shown that composted organic
materials from poultry manure, goat manure
and oyster shell improved the pH, CEC,
available P, total N, organic carbon,
exchangeable acidity and aggregate stability of
57
Eneje and Ukut NJSS/22(1)/2012

soil from an inland valley. The improvements
increased with the rate of the amendments and
sampling time. Specifically, the G+P+OY
treatment influenced total N, cation exchange
capacity and available P the most, while P+OY
treatment was most effective in improving
aggregate stability, pH, and exchangeable
calcium content of the soil.
REFERENCES Bouyoucos, G.J. (1962): Hydrometer Method
Improved for making Particle Size
Analysis of Soils, Soil Science Society
America Proc. Vol. 26, 464-465.
Bray, R.H. and Kurtz, L.T. (1945):
Determination of total organic and
available Phosphorus in the soil. Soil
Science 59: 39-45.
Edem, S.O Effiong, G.S and Umoh, G.A.
(1998): The Wetlands of Akwa Ibom
State Utilization and present Land Use
Practices. Nigerian Journal of
Agricultural Technology 7: 13-24.
Jackson, M.L. (1958): Aggregate Stability. In:
method of Soil Analysis (ed). C.D.
Black Agron; No. 9, American Society
Agron, Madison.
Kemper, W.D. (1965): Aggregate stability: In
Method of Soil analysis (ed) C.D.
Black. Agron. No. 9 American Society
of Agron. Madison.
Murphy, J. and Riley, (1962): A modified
simple solution method for the
determination of phosphorus in Natural
waters Anal. Chimi Acta 27: 31-36.
McLean, I.O. (1965): Aluminium in L.A.
Black (ed) Methods of Soil Analysis.
Part II Am. Soc. Agron. Madison N1pp
976-985.
Mbagwu, J.S.C. and Piccolo, A. (1990): Effect
of Humic Substances and Surfactants
on the Stability of Soil Aggregates.
Soil Science, Vol. 6 pp. 10.
Mullins, G.L. (2002): Poultry Litter as a
Fertilizer and Soil Amendment;
Agriculture and Natural Resource.
Virginia Tech. Organic Research-
http;/www.organic-research.com/2002.
Piper, C.S. (1942): Soil and Plant Analysis.
Intern Science Publication Inc. NY. Pp
368. Steel, R.G.D. and Torrie, J.H.
(1980). Principles and procedures of
statistics: A biometrical approach (2nd
Ed. M.C. Graw Hill, New York) Pp
257-259.
Sobulo, R.A., and Jayeola, E.K. (1977):
Influence of soil organic matter on
plant nutrition in Western Nigeria.
Ecprint, “Soil Organic Matter Studies”.
Intern Atomic Energy. Vienna pp 105-
115.
Udo, E.J. (2001). Nutrient status and
agricultural potentials of wetland soils
In: Proceedings 27th Annual
Conference of Soil Science Society of
Nigeria, Calabar: 1-10.
Uniuyo Consult Limited (2002). Soil
Potentials of Akwa Ibom State: Soils of
the Coastal Zone Akwa Ibom. Nigeria.
Pp. 3-97.
Walkley A. and Black I.A. (1934). An
examination of the different methods
for determining soil organic matter and
proposed modification of the chromic
and digestion method. Soil Science 37:
29-338.
58
Effect of oyster compost on soil

EFFECTS OF RICE MILL WASTE AND POULTRY MANURE ON SOME
SOIL CHEMICAL PROPERTIES AND GROWTH AND YIELD OF MAIZE
ENEJE, R.C.1, AND UZOUKWU, I.1 1Department of Soil Science and Agro-climatology, Michael Okpara University of Agriculture
Umudike, Nigeria, Email: [email protected]
ABSTRACT
An experiment was conducted at the Michael Okpara University of Agriculture, Umudike
Western Farm, to investigate the effect of rice mill waste and poultry manure on some soil
chemical properties and growth and yield of maize (Zae mays L.). The study was laid out in a
randomized complete block design (RCBD) with three replicates. Soil amendments were applied
at the rates of 0, 2, 4 and 8 t/ ha-. The results showed that the addition of the organic materials
improved the soil chemical properties with the poultry manure alone giving the highest value for
all the parameters analyzed, which included soil pH, available phosphorus and organic carbon.
However, total nitrogen was highest when the mixture of rice mill waste and poultry manure was
applied. Growth and yield parameters of maize were significantly increased by the application of
the organic materials. Rate of application at the different times was statistically significant, in
affecting all the chemical characteristics of the soil, and the growth and yield parameters
investigated.
Keywords: Maize yield, organic carbon, soil pH, available P, rice mill waste.
INTRODUCTION The soil is the most important source of wealth
of any agrarian state, when a soil is cultivated
continuously its productivity gradually
decreases, due to depletion of organic matter
which is believed to be a reservoir of plant
nutrients.
Soil fertility is dynamic as it is subject to the
influence of climate and cultural practices
(Allison and Moodie, 2004). Nowadays,
mineral fertilizers are the major soil
amendments used for the maintenance of soil
fertility. The use of mineral fertilizers and
some bad farming practices, such as burning
have greatly contributed to the reduction in the
organic matter content of soils. Besides, the
physical, chemical, and biological properties
of soils are adversely affected. For this reason,
issues of agricultural sustainability and
environmental hazard minimization should be
addressed simultaneously. The application of
organic source of nutrient such as animal
manure, crop residues, sewage sludge, city
refuse, and compost manure to soils is a
current environment and agricultural practice
for maintaining soil and supplying plant
nutrient (Francis et al, 1990).
It is evident that soils under cultivation are
gradually depleted in organic matter and the
methods of farming commonly practiced are
neither maintaining the content of organic
matter nor the productivity of the soil.
Therefore, different types of experiments on
the use of organic sources of nutrients such as
animal manure, crop residues, sewage sludge,
59
Eneje and Uzoukwu NJSS/22(1)/2012

city refuse and compost manures have been
reported. However, information on the extent
of nutrient release, when combinations of
organic matter sources are used as
amendments for certain crops are not
adequate. This had become a necessity today
where emphasis is on agricultural
sustainability and food security, especially in
the tropics and subtropics. Therefore, the aim
of this work is to assess the effect of different
rates of application of rice mill waste and
poultry manure on the growth and yield of
maize.
MATERIALS AND METHOD
Experimental Site The experiment was conducted at Michael
Okpara University of Agriculture Research
Farm in Umudike (Longitude 070 33`E,
Latitude 050 29’N, altitude 122m). The climate
is essentially tropical humid climate; the area
has a total rainfall of 2177mm per annum,
annual average temperature of about 26oC.
The rainfall pattern is bimodal; a long wet
season from April to July is interrupted by a
short “August brake” followed by another
short rainy season from September to October
or early November. Dry season stretches from
early November to March. (Speccini et al,
2001). Stumps in the field were removed using
cutlass, before harrowing and ploughing with
tractor then the plots were demarcated into
beds of plot sizes 3m x 2.5m, with furrow size
of 0.5m.
Experimental Layout The total experimental area was 336.6m2, four
rates of rice-mill waste (RMW), poultry
manure (PM) and an equal mixture of rice-mill
waste and poultry manure (RMW+PM),
namely 0, 2 tons, 4 tons and 8 tons per hectare
were applied to the demarcated plots in a
sandy loam soil. The experimental design was
a randomized complete block design (RCBD)
with three replicates.
Planting and Weeding
The maize variety used was Oba super 2
planted at a spacing of 1m by 1m, with two
seeds sown per hole, giving a population of
20,000 maize plants per hectare. Weeding was
done manually at four weeks after planting.
Collection and Preparation of Soil Sample Soil samples were collected at one month and
two months after amendment application using
a soil auger at 0 to 15 cm depth in each plot.
The soil samples were air dried at room
temperature for 3 days and sieved through a 2
mm sieve. The samples were then analysed for
physical and chemical parameters.
The soil pH was determined in 1:2.5 soils to
water ratio using pH meter (Maclean, 1965),
the organic carbon was determined using
dichromate wet oxidation method (Walkley
and Black, 1934) as modified by Piper (1942).
Total nitrogen was determined using the macro
Kjaldahl method described by Jackson (1958),
while available phosphorus was determined
using Bray II method as described by Bray and
Kurtz (1945).
Collection of growth and yield Data Data were collected on height and stem
diameter of maize at 2 and 6 weeks after
planting. Also at harvest data were collected
on cob length and weight of 100 seeds.
Data Analysis All the data were subjected to analysis of
variance (ANOVA) as outlined by Steel and
Torrie (1980). Treatment means were
compared, using the Fisher’s Least Significant
Difference (FLSD) at 5% probability.
60
Effect of rice waste and manure on soil

RESULTS AND DISCUSSION
Table 1:Physical and chemical properties of soil samples used for the study before cropping
Characteristics Value
Sand %
Silt %
Clay%
Textural class
pH H2O (1:2.5)
pH CaCl2 (1:2.5)
Total N (%)
K (cmol/kg)
OM (%)
OC (%)
Avail. P. (mg/kg)
Mg (cmol/kg)
Ca (cmol/kg)
Na (cmol/kg)
85.00
20.00
15.00
Sandy loam
5.25
4.73
0.098
0.194
14.44
8.30
20.23
1.82
2.53
0.106
Table 2: Chemical properties of organic amendments used for the study
Properties Poultry manure (PM) Rice mill waste (RMW)
Avail. P (ppm)
Ca2+ (cmol/kg)
Mg2+ (cmol/kg)
K+ (cmol/kg)
Na+ (cmol/kg)
Nitrogen (%)
0.78
1.26
0.43
0.29
0.81
1.05
0.29
2.10
1.02
0.47
0.22
0.671
Table 3: Organic manure effect on soil chemical properties at one month after manure
application Rates OC(%) Total N(%) pH(H2O) Avail. P(mg/kg)
PM+RW PM RW PM+RW PM RW PM+RW PM RW PM+RW PM RW
0t/ha
2t/ha
4t/ha
8t/ha
8.48
19.05
23.68
26.49
8.48
19.95
25.10
28.26
8.48
15.77
16.23
16.96
0.127
0.182
0.202
0.227
0.127
0.178
0.183
0.203
0.127
0.177
0.172
0.177
5.77
5.91
6.08
7.02
5.77
5.99
6.45
7.34
5.77
6.26
6.12
6.3
25.50
30.51
33.42
41.39
25.50
33.93
43.12
70.41
25.50
25.56
30.50
35.69
SED T=0.174
SED R=0201 SEDIR=0.348
SED T=0.0025
SED R=0.0029 SED TR=0.005
SEDT=NS
SEDR = 0.240
SEDT=0.648
SEDR=0.749 SEDTR=1.296
Two months after manure application in the field
Rates OC(%) Total N(%) pH(H2O) Avail. P(mg/kg)
PM+RW PM RW PM+RW PM RW PM+RW PM RW PM+RW PM RW 0t/ha
2t/ha
4t/ha 8t/ha
9.33
20.70
23.48 20.16
9.33
25.04
27.1 23.16
9.33
26.83
29.15 24.44
0.140
0.248
0.200 0.195
0.140
0.263
0.220 0.204
0.140
0.282
0.237 0.215
5.193
6.233
6.490 5.877
5.193
6.487
6.903 6.460
5.193
7.177
7.437 6.583
23.57
36.90
44.90 28.99
23.57
48.84
56.86 37.86
23.57
56.21
78.50 39.81
SED T=0.334
SED R=0.289 SEDIR=0.578
SED T=0.0046
SED R=0.00403 SED TR=0.00806
SEDT=0.0595
SED R=0.0515 SEDR = 0.103
SEDT=1.144
SEDR=0.9991 SEDTR=1.982
61
Eneje and Uzoukwu NJSS/22(1)/2012

The results above show that the application of
organic amendments increased the pH level of
the soil, because the amendments were
effective in reducing the soil acidity. The pH
increased as the rate of amendment and
sampling duration increased with the highest
value obtained at the rate of 8 t/ ha- and two
months sampling time. The result also showed
that the application of poultry manure alone
gave the highest pH value, onemonth after
application. However the reverse was the case
after two months when rice mill waste alone
gave the highest pH values (Table 3). The
ANOVA showed that the treatment (PM +
RW, PM, RMW), at the different application
rates (2, 4 and 8 t/ ha- significantly (P<0.001),
affected soil pH after two months of sampling.
Similarly, type and rates of organic manure
significantly affected the carbon and nitrogen
status of the soil. This observation agrees with
the report of Nwadialo (1991), that increasing
rates of poultry manure resulted in increasing
values of exchangeable bases. In addition, Obi
and Ebo (1995) reported a significant increase
in soil organic matter content (p=0.05) with
the application of poultry manure. This effect
of poultry manure irrespective of the
application rate on carbon content, and total
nitrogen in 20 cm sampling depth compared to
the other manure suggests that the poultry
manure is superior to other organic manure
with respect to nitrogen and phosphorus. This
further corroborates the observation of Darra
and Ussaman (1998), that organic manure is an
excellent soil amendment, providing both
organic matter and nitrogen, even though the
effects of organic manure, especially poultry
droppings on soil chemical properties and crop
yield depends on the type of feed the animal
consume, type of bedding materials used (if
any) and the state in which the manure is
applied i.e. a solid or liquid form. Moreso, the
effects of organic manure is also attributable to
the reactions initiated in the soil on its
application as reported by Heck (2001).
Animal and green manure are relatively bulky
materials, which are added mainly to improve
the physical structures of the soil, to replenish
and keep up its humus status, to maintain the
optimum condition for the activities of soil
micro-organisms and replenish part of the
plant nutrients removed by crops or other wise
lost through leaching and soil erosion.
Generally, the high response of crops to
poultry manure compared to the other
amendments is attributed to both the inherent
nutrient content of poultry manure, and the
effect of the manure on soil physical
properties, such as improvement of
aggregation, porosity and aggregation stability
(Musgrave, 1995). This advantage is also
attributed to the ease of decomposition of
poultry manure and subsequent mineralization
compared to the other amendments. The ease
of mineralization of poultry manure makes it
preferable to crop residues in situations where
plant nutrients are deficient and requires
immediate replenishment (Dara and Ussaman,
1998). This observation also explains the
higher effect of single application of poultry
manure on stem height and diameter of maize
crop as indicated in Table 4. However, the sole
effect of rice mill waste was enhanced by
admixture of poultry manure because crop
residues such as rice mill waste, maize husk,
groundnut husk, are abundant sources of
organic carbon, although, slow in
decomposition and release of plant nutrients,
(Eneje, et al, 2007).
62
Effect of oyster compost on soil

Table 4: Effect of organic manure on growth and yield of maize at sampling times
Plant height after two weeks Plant height after six weeks
Treatments 0t/ha 2t/ha 4t/ha 8t/ha 0t/ha 2t/ha 4t/ha 8t/ha
PM+RW
PM
RW
3.2
3.2
3.2
6.8
6.0
4.2
8.0
9.13
5.0
12.0
10.0
7.0
6.0
6.0
6.0
20
23
10.5
21.1
26.1
13.2
52.0
40.0
25.0
SED T = 0.0136
SED R = 0.01571
SED TR = 0.0277
SED T = 0.0471
SED R = 0.0544
SED TR = 0.0943
Cob length at harvest 100 Seed weight at harvest
Treatments 0t/ha 2t/ha 4t/ha 8t/ha 0t/ha 2t/ha 4t/ha 8t/ha
PM+RW
PM
RW
4.468
4.468
4.468
5.767
6.100
5.633
6.067
8.822
5.933
12.667
13.433
10.733
15.24
15.24
15.24
21.37
23.15
19.31
27.92
31.97
25.95
32.01
35.05
23.76
SED T = 0.1562
SED R = 0.1803
SED TR = 0.3123
SED T = 0.357
SED R = 0.412
SED TR = 0.713
In this study, PM also gave the highest value for 100 seed weight and the effect increased with increasing rate of application (Table 4), suggesting a linear relationship between maize seed weight and increasing rate of PM. This obervation agrees with that of Reeds et al (2002), who reported shoot dry matter increase of about 7% in maize when N rate was increased from 0 to 200 kg ha-1. Moreover, Ma et al (2004), reported a linear increase in the weight of 1000 grains in varieties of maize used for trial and attributed this to increases in nitrogen which plays very important roles in several physiological processes in plants. The effect of the ricemill waste on the growth parameters can be explained by the observation of Rajcan (1999), that the RW was carbonaceous, and when applied to the soil, does not decompose with ease, and this normally results in low rates of mineralization. However, the poor performance of maize in terms of growth and yield parameters can be attributed to loss of carbon in the form of CO2. CONCLUSION AND RECOMMENDATION The results of this study have shown that the addition of organic materials, such as poultry manure and rice mill waste solely or in combination improved the chemical properties of the soil. The improvement relative to control increased as the rate of application and sampling duration increased. The organic materials also improved plant height and yield of maize. The use of rice mill waste in
combination with poultry manure is recommended for improvement of soil pH to the optimum value required by most tropical crops, especially maize. Furthermore, though the combinations of the organic manure supply practically all the elements of fertility which crops require, it is not in adequate proportion. Therefore proper organic manuring requires admixtures of the sole manures that will encourage maximum microbial activity to enhance the release of soil nutrients in available forms and reduce nutrient loss through fixation or downward movement in the soil. Generally, the best soil amendment is the mixture of poultry manure and rice mill wastes. Additions of woody materials such as wheat straw, sawdust, rice husk, wood shavings etc, should be accompanied by addition of nitrogen sources, to minimize the fast decomposition of soil organic matter. REFERENCES Allison, L.E. and Moodie, M.O. (2004),
Carbonate. In: Black, C.A. et al (ed) Methods of Soil Analysis. Part II. Agron Monogr No. 9 ASA Madison, W.I. 1379-1396.
Bray, R.H. and Kurtz, L.T. (1945).
Determination of total organic and available phosphorus in soils, Soil Science 59: 39-45.
63
Eneje and Uzoukwu NJSS/22(1)/2012

Darra, B.L., Jain, S.V. and Ussaman, O. (1998). The influence of different green manure crops on soil structure and wheat yield. Indian J. Agron. 13: 162-164.
Eneje, R.C., Mbagwu, J.S.C. and Insam, H.
(2007). Community Level Physiological Profile (CLPPS) in the rhizosphere of cassava and forested agroecosystems. International Journal of Agricultural Science, Science and Environmental Technology Series A7 (1) 100-117.
Francis, C.A., Comelia, B.F. and Lary, D.K.
(1990). Sustainable Agriculture in Temperate Zone. John Wiley and sons Inc. New York. 437 pp.
Heck, A.F. (2001), Conservation and
availability of the nitrogen in form of manure. Soil Science 31: 335-364.
Ma, B.L., Dwyer, L.M. and Gregeriah, E.G.
(1991). Soil nitrogen amendment effects on nitrogen uptake and grain yield of maize. Agron. J. 9: 650-656.
Musgrave, G.E. (1965). The infiltration
capacity of soils in relation to control of surface runoff and erosion Agron: J. 57: 336-346.
Nwadialo, B.E. (1991). The effect of poultry
manure on the productivity of a Kandic-Paleustult. Nig. Agric. J. 26: 29-35.
Obi, M.E. and Ebo, P.O. (1995). The effect of
organic and inorganic amendments on soil physiological properties and maize production in a severely degraded sandy soil in southern Nigeria. Bioresource Tech 51; 117-123.
Piper, C.S. (1942). Soil and Plant Analysis. Int. Sci. Publ. Inc. N.Y. p. 368. Steel, R.C.D. and Torrie, J.H. (1980).
Principles and Procedures of Statistic: A Biometric Approach. 2nd ed.,
McGraw-Hill Book Company, Inc. N.Y. Toronto, London.
Maclean, I.O. (1965). Aluminum. In: Black C.
A. (ed.) Methods of Soil Analysis. (Part II) Am. Soc. Agron. Madison, WI, 976-998.
Reed, A.J., Singletaery G.W., Schussler, J.K.,
Willianson O.R. and Christy A.C. (2002). Shading effects on dry matter and nitrogen partitioning, kernel number and yield of maize crops. Soil Science. 28:819-825.
Robbins, C.W., Freeborn, L.L. and
Westernman, O.T. (2000). Organic phosphorus source affects calcareous soil phosphorus and organic carbon J. Environ Qual. 29: 973-978.
Rajcan, I. and Tollen, M. (1999). Source: Sink
ratio and leaf sensescense in maize I: Organic. Matter accumulation and partitioning during grain filling. Field Crops Research, Amsterdam, 60 (2) 245 – 253.
Spaccini R., Zena, A., Igwe, C.A., Mbagwu,
J.S.C. and Piccolo, A. (2001). Carbohydrates in water-stable aggregates and particle size fractions of forest and cultivated soils in two contrasting tropical ecosystems. Biogeochemistry, 53:1-22.
Tejada, M. and Gonzalez, J.C. (2001). Waste
management. American Society of Agronomy. U.S.A.
Lannoji, M., Whalen, J.K. and Change C.
(2001). Phosphorus accumulation in cultivated soil from long-term annual application of cattle feedlot manure J. Environ. Qual. 30: 229-237.
Walkley, A. and Black C.A. (1934). An
examination of the Degtjareff methods for determining soil organic matter and proposed modification of the chromic acid digestion method. Soil Science 37: 29-38.
64
Effect of oyster compost on soil
ASSESSMENT OF SOME SOIL FERTILITY CHARACTERISTICS OF ABAKALIKI
URBAN FLOOD PLAINS OF SOUTH-EAST NIGERIA, FOR SUSTAINABLE CROP
PRODUCTION
OGBODO, E.N. Department of Soil Science and Environmental Management,
Faculty of Agriculture and Natural Resources Management, Ebonyi State University, P.M.B. 053
Abakaliki, Nigeria.
ABSTRACT
There is lack of adequate information on the fertility status of the soils of Abakaliki urban flood
plains. Farming activities have therefore been carried out on the surrounding uplands only. This
study was therefore conducted in 2009 rainy season, to evaluate the fertility status of the flood
plains and compare it with the fertility of the uplands with a view to making recommendations
for sustainable agricultural production. Soil samples were obtained from the Iyiudene floodplain,
Iyiokwu floodplain, Ebonyi river basin and the surrounding upland and subjected to physical and
chemical analysis. The soil texture ranged from loam in the upland areas to clay loam in the
flood plains and the river basin. Soil bulk density of the upland soils was significantly higher
than the flood plains. The bulk density of the flood plains was respectively suitable for crop
production. The soil water holding capacity of the upland was rather too low, whereas the
floodplains had adequate water holding capacity for crop production purposes. The soil organic
matter was generally low for both the upland and the flood plains. However, the floodplains and
the river basin soils contained significantly (p<0.05) higher organic matter than the upland. The
upland soil was very acidic whereas the soils of the floodplains were acidic. The available
phosphorus was low, however, the floodplains had significantly (p<0.05) higher soil available P
than the upland. Total N, soil pH and exchangeable acidity were significantly (p<0.05) higher in
the upland soils than in the soils of the floodplains whereas the floodplains had significantly
(p<0.05) higher exchangeable Ca, Mg, Na, CEC and base saturation. The overall soil fertility
status of the floodplains was therefore superior to the upland soils.
Key words: Soil Fertility, Soil Characteristics, Urban Floodplains, Sustainable Crop Production,
Southeastern Nigeria
*Corresponding author. Tel.: +234 8037465495; e-mail:[email protected]
INTRODUCTION
In most derived savannah like in Abakaliki,
streams channels do not accommodate stream
flow at certain periods of the raining season.
Most of the year, the water levels maybe well
below the stream bank height, but at certain
periods heavy rains can deliver more water
than the stream can carry. Such excess water
that overflow stream banks and covers
adjacent land is considered as flood. The
changes in land use associated with urban
development affect flooding in the study area
65
Ogbodo NJSS/22(1)/2012

in many ways – removing vegetation and soil,
grading the land surface, constructing road
networks and building of houses increase
runoff to stream from rainfall. As a result, the
peak discharge, volume and frequency of
floods increase in nearby steams. Changes to
stream channels during urban development can
limit the capacity of these streams to convey
flood waters (Sauer et al., 1992). Intensity of
rainfall in short period in the study area during
raining seasons also leads to extremely high
runoffs, reduced infiltration and eventual flood
resulting from the impervious layer, high bulk
density and crusting (FDALR, 1985). Many
human activities increase the severity and
frequency of the floods including dumping of
domestic wastes into the streams which leads
to channel suffocation by these wastes
resulting into channel interference.
Under normal condition, floods are mitigated
by flood plains lowland that is periodically
inundated during normal flood. These
floodplains are usually very fertile, flat and
easily farmed. In most of the developed world,
floodplains are widely farmed, and cleared of
vegetation. Farmers go to flooded areas for
their activities because flooded areas are
usually very fertile for farming; there is
availability of water and nutrient for crop
growth in these areas. Flooded areas support
variety of ecosystem; different species of crop
grow in flooded areas (floodplains). However,
reports on the effect of flooding on soil
properties of the Abakaliki flood plains are
rather few, necessitating this study; to evaluate
the effect of flooding on the soil properties and
compare the nutrient content of the flooded
plains with that of adjacent arable land with
the intention of ascertaining whether the
floodplains could be put to agricultural uses.
MATERIALS AND METHODS
Study Area
The study area is Abakaliki municipality
which lies within latitude 16o 04’N and
longitude 18o 65’E, south east of Nigeria. It
has a bimodal rainfall pattern from April to
November. The total amount of rainfall
recorded within this period range from 1,900-
2,600mm annually while the maximum mean
daily temperature hovers around 27-31oC
through the year. The mean relative humidity
is 65-80%. The soil classification is Ultisol,
which is hydromorphic, of shale parent
material with underlying impervious layer at
about 40cm depth. It is characterized by
rampant flooding and water logging which is a
precipitate of poor drainage resulting from the
impervious layer, high soil bulk density and
crusting (FDALR, 1985), and recently by poor
urban settlement and human activities. The
flooding is experienced about the peaks of the
rainy season (July and September) and covers
the basins and floodplains around the middle
and lower courses of the river and the streams.
Field Method
A reconnaissance survey was carried out on
the study area, traversed by two streams called
lyiudene and Iyiokwu. The streams flow
through an undulating course with the main
sources at Mgbabor and Nkaliki respectively,
with other tributaries and terminating at where
they converge and empty into Ebonyi River.
Random method was used to collect soil
samples from the study area. Ten auger
samples were collected from each sampling
area at 0-20cm depth at the middle and lower
courses of the streams at both East and west
sides of the banks. Core samples were also
collected respectively from the same areas, for
determination of bulk density and total
porosity, while six other auger samples were
collected at 0-10cm depth from the respective
sampling areas for determination of soil
moisture holding capacity. The auger samples
were stored in labeled polythene bags. They
were dried under shade for three days,
crushed, sieved with a 2mm sieve and taken to
the laboratory for the determination of particle
size distribution and chemical properties.
Laboratory Methods
Particle size distribution was determined using
hydrometer method. Available water at field
capacity by the method of Klute (1986) and
bulk density by Blake and Hartge (1986).
66
Soil fertility characteristics of Abakaliki plains
Ogbodo NJSS/22(1)/2012

Total porosity was calculated from the bulk
density values assuming a particle density of
1.65gcm-3. Soil pH was determined using glass
electrode pH meter in water using 1:2:5 soil;
water ratios. Total nitrogen was determined
using macro – kjeldahl methods. Available
phosphorus was determined using Bray 11
methods. Organic carbon was measured by the
Walkey – Black procedure. Exchangeable
bases (K, Ca, Mg and Na) and Exchangeable
acidity (H+ and Al+) were determined as
described by Tel and Rao (1982). Cation
exchange capacity was determined by the
summation of exchangeable bases (K, Ca, Mg
and Na) and exchangeable acidity (H+ and
AL3+) by IITA (1979).
Data obtained were analyzed using one tailed
analysis of variance (ANOVA).
RESULT
Soil particle size distribution
Table 1 shows the particle size distribution of
the soils. The upland had higher values of sand
fraction than the flooded areas, whereas the
floodplains had higher values of silt, and clay
fractions compared to the arable land. The
textural class of the soils ranged from clay
loam for both flood plains and the river basin
to loam for the upland.
Table 1: Particle size distribution of the soils.
Treatment % Sand % Silt % Clay Textural class
Iyiudene
floodplain
36.40 36.80 26.80 Clay loam
Iyiokwu floodplain 32.40 36.80 30.80 Clay loam
Ebonyi River basin 32.40 34.80 32.80 Clay loam
Upland 44.40 34.80 20.80 Loam
Soil Physical Properties
The physical properties of the soil are
presented in Table 2. The bulk density values
for the floodplains and the river basin were
significantly lower than that of the upland,
whereas the soil densities of the floodplains
were statistically comparable with the river
basin soil. The soil total porosity of the
Iyiokwu and Iyiudene flood plains and the
Ebonyi river basin were correspondingly
higher than the soil total porosity of the
upland, owing to the lower soil density of the
areas. It was also observed that the soil water
retention capacity was higher with the
floodplains and the Ebonyi river basin than the
upland. The soils of the Iyiudene flood plain
and Ebonyi river basin areas also had higher
moisture retention capacity than the Iyiokwu
floodplain.
Table 2: Some Soil Physical Properties of the Soils. Treatment Bulk Density
(kg) Percentage Moisture
Retention Porosity
(%) Iyiudene floodplain 1.20 22.48 54.5 Iyiokwu floodplain 1.30 19.34 51.1 Ebonyi river basin 1.24 24.78 53.3 Upland 1.61 9.88 39.2 FLSD (0.05) 0.13 2.89 3.92
Chemical Properties of the Soil
Soil pH, Organic matter, N and P
Table 3 shows the soils chemical properties.
The result shows that the floodplains and the
river basin had higher pH values than the
upland. The pH values of the Iyiudene
floodplain and the Ebonyi river basin were
also significantly (p<0.05) higher than the pH
values of the Iyiokwu floodplain and the
upland. Soil pH was also significantly
67

(p<0.05) higher with the Iyiudene floodplain
than the Ebonyi river basin, whereas the pH of
the upland and the Iyiokwu floodplain were
comparable. The floodplains and the river
basin soils had significantly (p<0.05) higher
organic matter levels than the upland, whereas
the Ebonyi river basin had significantly
(p<0.05) higher organic matter levels
compared to the organic matter levels of the
Iyiudene and Iyiokwu floodplains. The upland
soils had significant (p<0.05) higher N values
than the floodplains and the river basin. The
result also indicated that the floodplains and
the river basin had significantly (p<0.05)
higher values of available phosphorus than the
upland.
Table 3. The Soil Chemical Properties Treatment Organic
matter
Ph Nitrogen Available
Phosphorus
K Ca Mg Na ECEC Exchangeable
Acidity
Base
Saturation
(%) (H2O) (%) (PPM) (Cmol/Kg) (%)
Iyiudene floodplain 2.93 6.15 0.13 28.20 0.15 11.20 5.20 0.09 18.72 2.08 88.89
Iyiokwu floodplain 3.11 5.39 0.12 29.20 0.13 10.40 5.60 0.09 18.18 1.96 89.22
Ebonyi river basin 2.65 5.95 0.13 34.80 0.13 12.00 5.20 0.13 19.67 2.16 88.76
Upland 2.06 4.38 0.15 18.50 0.17 8.40 3.60 0.04 15.09 2.88 80.91
FLSD (0.05) 0.14 10 0.02 4.40 0.03 0.170 0.11 0.02 0.53 0.63 1.40
Exchangeable Bases
The floodplains and the river basin had
significantly (p<0.05) higher soil
exchangeable Ca, Mg and Na content
compared to the upland, whereas significantly
(p<0.05) higher levels of exchangeable K was
detected on the upland than the Iyiudene
floodplain, Iyiokwu floodplain and the Ebonyi
river basin. The soil of the Iyiokwu floodplain
also had significantly (p<0.05) higher Mg
content than the Iyiudene floodplain and the
soil of the Ebonyi river basin, whereas the
Ebonyi river basin contained significantly
(p<0.05) higher exchangeable Na than the
Iyiudene and Iyiokwu floodplains.
Exchangeable Acidity, Effective Cation
Exchange Capacity and Base Saturation
The upland had significantly (p<0.05) higher
exchangeable acidity values compared to the
floodplains, whereas soil cation exchange
capacity was significantly (p<0.05) higher in
the soils of the Iyiudene, Iyiokwu floodplains
and Ebonyi river basin than the upland. The
soils of the Ebonyi river basin also had
significantly higher CEC than the Iyiudene and
Iyiokwu floodplains Base saturation was
significantly (p<0.05) higher in the floodplains
and river basins than the upland, whereas the
floodplains and the river basin had comparable
levels of base saturation.
DISCUSSION
The upland had higher percentage of sand
fraction. Ordinarily, soil textural composition
rarely changes, but in this case it was believed
that the different land uses; the arable
cultivated upland and flooded fallow lowland
over a long time could have led to the
transportation of dislodged lighter soil
particles (silt and clay) to the lower plains
where they accumulated on the topsoil
influencing the texture of the top soil layer.
Anikwe et al. (1999) had observed changes in
soil properties owing to changing land uses in
Abakaliki area.
The higher soil bulk density of the upland was
anticipated. The soil of the study area had been
noted by many researchers to have high bulk
density and to suffer from compaction
problems (FDALR, 1985). This situation was
however ameliorated by the flooding on the
flood plains and the river basin. The runoff
from the upland and flooding from the river
and streams deposited layers of alluvial
materials on the floodplains and the river basin
which had not yet consolidated unlike the soils
of the upland. However, the decayed organic
residue of the vegetation of the floodplains and
the basin areas produced higher levels of
organic matter which reduced the soil density.
The organic matter acting as the soil binding
materials created higher soil porosity and
68
Soil fertility characteristics of Abakaliki plains

reduced soil density. The low level of moisture
retention in the upland was rather very severe,
and could constitute a serious impediment to
crop production. The soil cultivation practices
normally distort the continuity of pores leading
to increased water runoff and reduced water
infiltration. It was believed that the improved
soil water retention of the flooded lands was
an attribute of reduced density, improved
porosity and higher organic matter content,
and reduced water runoff compared to the
cultivated upland. These properties reflect
improved soil structure for the floodplains and
the river basin.
The higher levels of organic matter detected
on the flood plains and river basin soils were
attributable to the accumulation of residues of
the fallow vegetation over a long term and the
deposits brought by the flood water. The
clearing and cultivation of the upland led to
organic residue decomposition and loss of
organic materials to seasonal water runoff and
erosion. The soil of the study area is however
noted to have low organic matter levels
(Asadu and Akamigbo, 1990) which
drastically affected the organic matter status of
the soils generally.
The various soil areas are rather acidic.
Several researchers had earlier reported that
the soils of the area are acidic and of low
fertility (Ogbodo and Nnabude, 2004). The
low organic matter levels of the soil were
assumed to have contributed in part to the low
soil pH. The higher pH values of the
floodplains were attributed to the higher Ca
and Mg levels. These elements naturally
displaced H+ ion from the exchange complex
into the soil solution, where they are leached.
This situation is even more intensive under
strongly acidic soil conditions as obtained in
the study area.
The lower N values of the floodplains could be
as a result of losses of N through various
sources. Nitrogen being a very mobile
element, is prone to be lost easily through
leaching and percolation under flooded
situation, and volatilization once the flood
water recedes. This could account for a
reasonable depletion of the element in the
floodplains, which could adversely affect crop
production. Nelson and Terry (1996) observed
drastic loss of soil nitrogen after flooding. The
low total N of the floodplains also conforms to
the observations of Valiela and Teal (1974)
that estuarine wetlands tend to have N
limitations.
The significantly higher soil available P on the
flooded soils was understandable. This is
because the easiest way to increase soil P is to
improve soil moisture content. Nathan (2002)
also observed that flooding generally increases
the availability of P to crops. The higher pH of
the flood plain and the river basin soils could
also have encouraged the solubilization of
organic P which might have led to the release
of inorganic P bound in soil minerals. The
decay and mineralization of the vegetation
residues could have in turn led to the release of
organic P in residues in the floodplain areas.
Ukpong (2006) reported high available P
levels in the Creek / Calabar River swamps.
The generally low level of available P
indicates that P may be chemically bound as
phosphates of Fe and Al owing to the observed
high acidity of the soils of the study area. This
observation is in agreement with the findings
of Ibia and Udo (1993).
Significantly higher soil Ca, Mg and Na levels
were observed in the flooded soils than the
unflooded upland. Some of these elements
could have been eroded from the upland
during runoff and deposited on the floodplains
by the flood water. On the other hand nutrient
mining by crops could have contributed to the
reduction of these elements in the upland. The
release of the organic forms of Ca and Mg
from the organic matter increased their levels
in the flooded soils which had higher organic
matter deposits. In addition, the higher soil
moisture of the flooded soils could have
assisted the release of the inorganic Ca and Mg
from the soil minerals. The levels of soil K
content varied among the floodplains. The
69
Ogbodo NJSS/22(1)/2012

inconsistency of the soil K content among the
study areas could be as a result of the variation
in soil minerals and constituents amongst the
different sites of the study area. The higher
exchangeable K found in the upland than the
floodplain soils could be attributed to small
content in the organic matter and the flood
water supply. There could also have been
losses of K through leaching and percolation
in the floodplains. Higher rates of K losses
have been reported to occur in Wetlands
(IFPRI, 1999), whereas Ambeager (2006)
reported losses of K through erosion and
leaching. The soil Na content was higher on
the flooded areas than the Na content of the
upland. Naturally flood water carries along
salts which are deposited on the soil as the
flood water recedes, and as evaporation takes
place leaving salt crusts and crystals. This
situation was adduced for the higher Na
content of the flood plains and the river basin
areas.
Exchangeable acidity was significantly
(p<0.05) higher in the upland than the
floodplains and river basin. The levels of
exchangeable acidity of the study soils were
such that could cause serious problems to crop
production. The variability in soil cation
exchange capacity was in response to variation
in vegetation residue type and soil organic
matter levels. Organic matter is the store of
essential elements, hence the higher the soil
organic matter levels, the higher the soil CEC
and buffer capacity. The transportation of
elements, in the flood water and runoff from
the streams and arable land increased the
element contents of the river flood plains and
the basin thus increasing their CEC. Percent
base saturation was high in both upland and
the floodplains. Base situation was above 50%
in all the cases which forms the separating
index between fertile soils and less fertile
soils. This was surprising considering the low
CEC of the soils in the study area.
Some important soil chemical characteristics
that influence the rating of soils suitability for
crop production include pH, organic matter
total N, available P, and exchangeable bases
and physical properties including texture,
structure, temperature, bulk density, porosity,
moisture and drainage. The soils have
particularly low organic matter content.
However, the observed higher organic matter
values of the flood plains reflect higher
productivity and reduced decomposition and
mineralization rates in wetland environments.
Kyuma (1985) and Patrick (1990) reported that
such situations result in accumulation of
organic matter.
Based on the result of the soil chemical
analysis, it is apparent that the soils are
generally acidic, low in organic matter, total
N, available P and cation exchange. According
to the ratings capacity of Landon (1984) and
Enwezor et al. (1988), the soils are low in
fertility and cannot sustain optimum crop
production.
For improved crop yields on short term basis,
mineral fertilizers are recommended as a stop-
gap to promote higher crop yields. However,
for a long-term sustainable crop production,
soil fertility restoration measures affordable
for farmers should be adopted. Among these
measures are the use of organic manure and
burnt rice husk which is abundant in the area
to improve the soils physical and chemical
constraints. Alternatively, green maturing
practices (e.g. groundnut and other non-food
legumes) should be introduced as a very
economic measure for soil fertility
improvement and regeneration. This measure,
according to Yadav et al. (2001), increases
crop yields by 20-30%, improves soil chemical
N and P by 25%, restores natural fertility and
stimulates plant growth.
CONCLUSION
The result of this study confirms that the soils
of Abakaliki; the study area, has low fertility
and suffers major productivity constraints. The
inhabitants engage the upland soils in crop
production, predominantly root crops and
grain crops, while the flood plains had been
abandoned over the years as unsuitable for
70
Soil fertility characteristics of Abakaliki plains

agricultural purposes. There has been recent
rapid urbanization of the area, which has led to
the flood plains being choked with houses
aggravating the flooding problem. This study
has revealed that the flood plains are even of
higher fertility than the uplands, and could be
put to better crop production activities.
However, in order to ensure optimum crop
production, there is the need to alleviate the
inherent fertility constraints of the soils. The
use of organic residues to solve the soils
physical and chemical constraints is
recommended, to improve the fertility and
crop yields. The inhabitants could utilize this
ameliorative measure to produce rice in the
flood plains during the rainy seasons.
REFERENCES
Ambeager, A., 2006. Soil fertility and plant nutrition in the tropics and subtropics IFAV IPI. Pp. 96.
Anikwe, M.A.N., C.I. Okonkwo and N.L.
Aniekwe, 1999. Effect of Changing Land use in selected soil properties in Abakaliki Agroecoloigcal Zone South-East Nigeria. Environmental Education and Information 18, pp. 79-89.
Asadu, O.L.A. and F.O.R. Akamigbo, 1990.
Relative contribution of organic matter and Clay fractions to Cation Exchange Capacity of Soils in Southeastern Nigeria. Samaru Journal of Agricultural Research 7:17 - 23.
Blake, G.R. and K.H. Hartge, 1986. Bulk
density. In: methods of soil analysis, part 1. Physical and Mineralogical methods. A. Klute (ed) American Society of Agronomy, Madison, WI USA: 365-375.
Enwezor, W.O., A.C. Ohiri, E.E. Opuwaribo
and E.J. Udo, 1988. A review of soil fertilizer use of crops in Southeastern zone of Nigeria. Fertilizer procurement and Distribution Department, Lagos, Nigeria.
Federal Department of Agriculture Land
Resources (FDALR), 1985. Agriculture Land Resources Technical Bulletin. Vol 5.
IFPRI, 1999. Nurturing the soil in Sub-saharan
Africa. International Food Policy Research Institue. A 2020 vision for Food, Agriculture and the Environment.
IITA, 1979. Selected Methods for Soil and
Plant Analysis. Manual series No. 1 International Institution of Tropical Agriculture, Ibadan, Nigeria.
Klute, A. 1986. Water Retention: Laboratory
Methods. In: Klute, A. (ed). Methods of Soil Analysis, Part I: Physical and Mineralogical Methods, 2nd ed. ASA, SSSA, Madison USA: 635-660.
Landon, J.R., 1984. Booker Tropical Manual.
A handbook for soil Survey and agricultural land evaluation in the tropics and subtropics. Booker Agricultural International Ltd. UK.
Nathan S., 2002. Effect of soil flooding on
phosphorus reactions. Crop, soil and Environmental sciences Department. 115 plant science Bldg; University of Arkansas, Fayetteville, AR 72701.
Nelson S.D. and R.E. Terry, 1996. The effects
of soil physical Properties and irrigation method on denitrification. Soil science vol. 161 No. 4, Lippibcott Williams and Wilkins press, Baltimore. Pp. 242-249.
Ogbodo, E.N. and P.A. Nnabude 2004.
Evaluation of the performance of three varieties of upland Rice in degraded acid soil at abakaliki, Ebonyi State. Journal of Technology and Education in Nigeria. Vol. 9(1) 2004 1 – 7.
71
Ogbodo NJSS/22(1)/2012

Sauer, V.I.B., W.O. Thomas, V.A. Sticker and
K.V. Wilson, 1992. Flood
characterization of urban watershed in
The United States “U.S Geological
survey water-supply paper 2007, pp.
63.
Tel, D. and F. Rao, 1982. Automated and
semi-auto-mated methods for soil and
plant analysis, IITA manual series No.
17:15-25.
Valiela, L. and J.M. Teal, 1974. Nutrient
limitation in salt marsh vegetation. In:
Vegetation Reimold, R. J and W.H
Queen (Eds) Ecology of halophytes.
Academic press, New York, pp. 547-
563.
Yadav, A.K.; S.R. Chaudhari and M.R.
Motsara, 2001. Recent Advances in Biofertilizer Technology. Society for Promotion and Utilization of Resources and Technology, pp. 526.
72
Soil fertility characteristics of Abakaliki plains

EFFECT OF TILLAGE AND CROP RESIDUE ON SOIL CHEMICAL PROPERTIES
AND RICE YIELDS ON AN ACID ULTISOL AT ABAKALIKI SOUTHEASTERN
NIGERIA
OGBODO, E.N1. AND P.A. NNABUDE2 1Department of Soil Science and Environmental Management, Faculty of Agriculture and
Natural Resources Management, Ebonyi State University, P.M.B. 053 Abakaliki, Nigeria. 2Department of Applied Biological Sciences, Nnamdi Azikiwe University, Awka, Nigeria.
ABSTRACT
A study was conducted in 2008 and 2009 rainy seasons, to evaluate the possibility of alleviating
the degraded soil conditions at Abakaliki. The measures employed were combination(s) of
different tillage methods [ No-Tillage (NT), Hoe Tillage (HT), Ploughing (PL) and Ploughing
and Harrowing (PH)] and crop residues [No Residue (NR), Rice Straw (RS), Burnt Rice Straw
(BRS) and Legume Residue (LR)] treatments. Improved rice cultivars (ITA 257, Ex-China and
ITA 315) were the test crops. The design of the experiment was a 4 x 4 x 3 factorial in a
randomized complete block design replicated three times. Data on soil chemical properties, rice
growth and yield were collected and subjected to statistical analysis. The results obtained showed
that soil organic matter, pH, available P, exchangeable K, Ca, Mg and CEC significantly
(p<0.05) improved in the plots that received crop residue across the four tillage methods
compared to where crop residues were not applied. The soil chemical properties were also
significantly (p<0.05) superior with the application of BRS across the four tillage methods
compared to the application of the other residue treatments. Rice growth and grain yield were
significantly (p<0.05) higher on the plots that received the combination of the different tillage
methods and crop residues respectively than the combination of the different tillage methods
without crop residues. There were grain yield increases of 1.47, 1.21 and 1.20 t/ha in the first
year and 2.05, 1.64 and 1.53 t/ha in the second year with the application of NT+BRS, NT+RS
and NT+LR respectively compared to the application of NT+NR. The application of HT+BRS,
HT+RS and HT+LR brought about significant (p<0.05) grain yield increases of 1.65, 1.20 and
1.16 t/ha and 2.67, 2.45 and 2.42 t/ha in the first year and second year respectively. Grain yield
significantly (p<0.05) increased by 1.91, 1.68 and 1.62 t/ha in the first year and 2.44, 1.95 and
1.91 t/ha in the second year respectively as a result of PL+BRS, PL+RS and PL+LR treatments
compared to PL+NR. PH+BRS, PH+RS and PH+LR treatments led to significant (p<0.05) grain
yield increases of 2.55, 1.54 and 1.52 t/ha respectively in the first year and 2.74, 1.72 and 1.71
t/ha respectively in the second year compared to the application of PH+NR treatment. The ITA
315 and Ex-China produced 0.55 and 0.47 t/ha, and 0.62 and 0.50 t/ha significantly (p<0.05)
higher grains than ITA 257 in the first and second years respectively. The highest grain yield of
4.87 t/ha in the study was obtained from ITA 315 grown on soil that received PH+BRS
treatment.
Key words: Tillage and Crop Residue, Soil Chemical Properties, Rice Yields, Acid Ultisol,
Southeastern Nigeria
Ogbodo and Nnabude NJSS/22(1)/2012

*Corresponding author. Tel.: +234 8037465495; e-mail:[email protected]
INTRODUCTION
Most tropical soils are known to suffer
structural and fertility constraints. The soils of
the Abakaliki Agro-ecological zone of
southeastern Nigeria, which falls under the
tropical environment, have specifically been
reported by several researchers to be very
acidic, low in organic matter content and that
consequently the soils have low levels of
exchangeable bases, cation exchange capacity
and buffer capacity (Enwezor et al., 1985;
FDALR, 1985 and Asadu and Akamigbo,
1990). The soils are therefore of low fertility
leading to low crop productivity. The use of
minimum tillage and crop residue has been
advanced as minimumpart of the measures that
could be used to manage the soil productivity
problems and increase the yield of crops.
Rice production in Abakaliki area has been
severely affected by the degraded soil
conditions. The average yield of 2.5 t/ha
normally obtained from the area is rather low
compared to yields from other rice producing
areas of the world. Efforts had been made to
resolve the productivity constrains of the soil
through the use of different tillage methods, or
various organic manure sources and
management methods (Nnabude and Mbagwu,
1999; Ogbodo, 2004; Ogbodo, 2005ab;
Ogbodo, 2009 and Ogbodo, 2010).
The present study is a combination of different
tillage methods and crop residue sources to
resolve the soil and crop productivity problems
in the study area, using improved rice cultivars
as the test crop.
MATERIALS AND METHODS
The experiments were carried out in the 2008
and 2009 rainy seasons at the Research and
Teaching Farm of the Faculty of Agriculture,
Ebonyi State University, Abakaliki. The area
is located within longitude 080 03/ E and
latitude 060 25/ N in the derived savanna zone
of Nigeria. The mean monthly temperatures
ranged between 24 0C and 28 0C. The rainfall
pattern was bimodal, with peaks in the months
of July and September. Annual amounts of
rainfall ranged between 1800 and 2000 mm.
Rainfall stabilized around May and stopped
around October, leaving a dry period between
November and April during the study seasons.
The soil is hydromorphic and has an
isohypothermic soil temperature regime and
belongs to the order ultisol derived from shale
and classified as typic haplustult (FDALR,
1985). The description of the surface soil
physical and chemical characteristics is shown
in Table 1. The experimental site was
previously used for rice cultivation, before it
was used for the experiment.
Table 1: Pre-Planting Soil Texture and Chemical Properties
Soil Texture Sand (%) Silt (%) Clay (%) Textural Class Chemical Properties pH (H2O) Organic Matter (%) Total N (%) Available P (gm/kg) K (cmol(+)kg) Ca (cmol(+)kg) Mg (cmol(+)kg) CEC (cmol(+)kg)
44.80 34.40 20.80 Sandy Clay Loam 4.80 2.00 0.12 6.00 0.19 2.10 2.20 4.60
73
Effect of tillage and crop residue on ultisol

Experimental Design and Field Layout
The experimental design used was 4 x 3 x 4
split-split plot factorial in a Randomized
Complete Block Design. The area of land
used for the experiment measured 769.5 m2.
Each replicate measured 256.5 m2 and
comprised of four tillage methods, three rice
cultivars and four crop residue sources. There
were three blocks within each tillage treatment
(made up of twelve treatment units) measuring
54 m2. Each block comprised of 4 treatment
units, each measuring 16 m2. The replicates
and tillage methods were separated by one
another by 1m alleys respectively, whereas the
individual plots were separated by 0.5 m
alleys.
Treatments
Tillage methods were the main treatment, the
rice cultivars were the sub treatment whereas
crop residues were the sub-sub treatment. Each
treatment was replicated three times. The
tillage methods were: No – tillage (NT), Hoe –
tillage (HT), Ploughing (PL) and Ploughing
and harrowing (PH). The three rice cultivars
were ITA 315, Ex-china and ITA 257, whereas
the crop residue treatments were no residue
(NR), Rice Straw (RS), Burnt Rice Straw
(BRS) and legume residue (LR). The dry rice
straw was from the previous year’s harvest,
whereas Centrocema pubensis was harvested
from the ones growing widely in the
surrounding bush. The improved rice cultivars
used for the trials were foundation seeds
sourced from the International Institute of
Tropical Agriculture (IITA), Ibadan, Nigeria.
Treatment Applications
The ploughing was carried out once for the PL
plots, while the PH plots were ploughed once
and harrowed twice. For the HT plots, the
vegetation was slashed with a matchet and
removed, while the soil was tilled manually
with a hoe. A non-selective herbicide,
glyphosate (360g a.i) was sprayed on the
vegetation on the NT plots at the rate of 5
liters per hectare two weeks before sowing the
seed. The crop residues were applied as
surface mulch on the appropriate plots. 5 ton
per hectare (t/ha) equivalent of dry rice straw,
freshly harvested Centrosema pubensis and
burnt rice straw were applied on the
appropriate plots respectively. For the NR
plots, no crop residue was applied while the
existing plant residues were removed. The rice
seeds were directly seeded by dibbling; using
sticks to create opening and the seeds covered
after sowing. Three seeds were planted per hill
at a spacing of 25 cm x 25 cm, and later
thinned down to two seedlings per stand at 21
days after planting (DAP), giving a plant
population of 320,000 stands per hectare.
Cultural Practices
Fertilizer was applied at the rate of 40 kg P /
ha as single super phosphate, 40 kg K / ha as
muriate of potash and 80 kg N / ha as urea to
all the plots. One third of the N fertilizer was
applied alongside the P and K basally before
residue application; 4 days before planting the
seeds, whereas the remaining two thirds of N
were applied at 75 DAP.
Data Collection
Six soil auger samples were randomly
collected from the experimental area at 0-20
cm depth for pre-planting soil analysis. At the
end of each season’s experiments, six auger
samples were taken from each plot, mixed and
a sub-sample taken for post harvest chemical
analysis. Plant height and tiller number were
measured at 75 DAP. Plant height was taken
as the height from the base of the plant and the
tip of the tallest tiller using a meter rule. At
dry maturity, the rice panicles were harvested
from a net plot of 2 m x 2 m in the middle of
each plot, dried, threshed and the grain yield
data adjusted to 14% moisture, and converted
to t/ha.
Laboratory Methods
The pre-planting composite soil sample (taken
at 0 – 20cm depth) was analyzed in the
laboratory for the texture and chemical
properties. The soil particle size distribution
was determined by the hydrometer method
74
75
Ogbodo and Nnabude NJSS/22(1)/2012

(Gee and Bouder 1986). The post harvest soil
samples taken from each plot were subjected
to chemical analysis. Total nitrogen was
determined by the Macro Kjeldahl method
(Bouycous, 1951). Available P was
determined using Bray II method as outlined
in Page et al. (1982). Organic carbon was
determined by the Walkley and Black method
(Nelson and Sommers, 1982). Soil pH (2:1 in
water) was determined by the glass electrode
pH meter (Maclean, 1982). Exchangeable
bases were extracted using the ammonium
acetate method (Tel and Rao, 1982)
DATA ANALYSIS
Analysis of variance and mean separation was
done using least significant difference test for
P≤0.05 procedure as described by SAS (2006).
RESULTS
Soil chemical properties The effect of tillage methods and crop residue
treatments on soil chemical properties are
presented in Tables 2a – b. Significantly
(p<0.05) higher organic matter levels were
detected on the rice straw and legume residue
treated plots than on the no-residue and burnt
rice straw treated plots across the four tillage
methods. Application of the various crop
residues raised the soil pH levels across the
four tillage methods compared to where the
soil was not treated with crop residue. Treating
the soil with burnt rice straw significantly
(p<0.05) increased soil pH compared to the
other residue treatments across the tillage
methods.
Significantly (p<0.05) higher N, P, K, Ca and
Mg levels were also detected on the soils
treated with crop residue than where crop
residue treatment was not applied across the
four tillage methods. The concentrations of
exchangeable Ca and Mg were significantly
(p<0.05) higher on the soils that received burnt
rice straw treatment across the four tillage
methods than where the soil was treated with
rice straw and legume residue across the
tillage treatments.
The soils that received tillage and crop residue
treatments had significantly (p<0.05) higher
cation exchange capacity than the soils that
were treated with the various tillage methods
but without crop residue application. The soils
that specifically received burnt rice straw
treatment across the various tillage treatments
had significantly (p<0.05) higher cation
exchange capacity compared to the ones that
were treated with rice straw or legume residue
across the four tillage methods.
76
Effect of tillage and crop residue on ultisol

Table 2a: Effect of Tillage and Crop Residue on Organic Matter, pH, Total Nitrogen and Available Phosphorus
T
a
b
l
e
2
.
NT = No-Tillage; HT= Hoe Tillage; PL = Ploughing; PH = Ploughing and Harrowing; NR = No Residue; RS = Rice Straw;
BRS = Burnt Rice Straw and LR = Legume Residue
First Year
Residue
Type
Organic Matter
(%)
pH
(H20)
Total Nitrogen
(%)
Available Phosphorus
(mg/ gm)
NT HT PL PH NT HT PL PH NT HT PL PH NT HT PL PH
NR 2.00 1.00 2.00 2.02 4.80 4.70 4.70 4.50 0.12 0.12 0.11 0.14 6.00 5.80 5.50 6.60
RS 2.90 2.00 2.94 2.93 5.70 5.70 5.90 5.10 0.22 0.20 0.26 0.20 11.70 10.80 11.40 10.10
BRS 2.46 1.21 2.22 2.20 6.40 6.40 6.30 6.40 0.25 0.20 0.20 0.20 10.70 11.40 11.70 10.10
LR 2.87 2.00 2.63 2.62 5.70 5.80 5.70 5.60 0.22 0.22 0.24 0.21 9.50 8.10 9.70 8.50
LSD(0.05) 0.40 0.65 0.09 2.53
Second Year
Residue
Type
Organic Matter
(%)
pH
(H20)
Total Nitrogen
(%)
Available Phosphorus
(mg/ gm)
NT HT PL PH NT HT PL PH NT HT PL PH NT HT PL PH
NR 2.03 0.95 2.08 2.06 4.40 4.00 4.50 4.70 0.17 0.12 0.15 0.16 5.50 5.10 4.80 8.20
RS 2.99 2.00 2.92 2.94 5.60 5.80 6.00 5.40 0.24 0.19 0.22 0.23 11.20 11.00 10.20 11.10
BRS 2.36 1.26 2.00 2.20 6.90 6.30 6.60 6.60 0.24 0.22 0.24 0.24 10.60 10.10 11.00 10.10
LR 2.97 1.98 2.82 2.82 5.40 5.70 5.70 6.20 0.27 0.25 0.25 0.24 7.90 9.00 8.00 10.70
LSD(0.05) 0.36 0.68 0.06 2.26
77
Ogbodo and Nnabude NJSS/22(1)/2012

Table 2b. Effect of Tillage and Crop Residue on Exchangeable K, Ca, Mg and Soil CEC
N
T
= No-Tillage; HT= Hoe Tillage; PL = Ploughing; PH = Ploughing and Harrowing; NR = No Residue; RS = Rice Straw;
BRS = Burnt Rice Straw and LR = Legume Residue
First Year
Residue
Type
Exchangeable K
(Cmol / kg)
Exchangeable Ca
(Cmol / kg)
Exchangeable Mg
(Cmol / kg)
Soil CEC
(Cmol / kg)
NT HT PL PH NT HT PL PH NT HT PL PH NT HT PL PH
NR 0.19 0.15 0.16 0.17 2.10 1.10 2.00 2.10 2.20 1.00 2.10 2.10 4.49 2.25 4.26 4.37
RS 0.43 0.34 0.51 0.50 4.10 3.70 4.80 4.60 4.00 2.50 4.10 4.40 8.53 6.54 9.41 9.50
BRS 0.45 0.42 0.46 0.48 6.00 5.70 6.00 4.10 5.20 3.90 5.60 5.80 11.65 10.02 12.06 10.38
LR 0.37 0.30 0.46 0.47 4.10 4.40 4.70 4.80 3.30 3.00 3.50 3.60 7.77 7.70 8.66 8.87
LSD (0.05) 0.18 1.06 1.10 2.43
Second Year
Residue
Type
Exchangeable K
(Cmol / kg)
Exchangeable Ca
(Cmol / kg)
Exchangeable Mg
(Cmol / kg)
Soil CEC
(Cmol / kg)
NT HT PL PH NT HT PL PH NT HT PL PH NT HT PL PH
NR 0.17 0.16 0.19 0.17 2.40 2.20 2.30 2.30 2.20 1.90 2.20 2.20 4.77 4.26 4.69 4.67
RS 0.45 0.34 0.42 0.40 4.40 4.10 4.90 4.80 4.20 3.20 4.00 4.90 9.05 7.64 9.32 10.10
BRS 0.46 0.47 0.47 0.40 6.70 6.30 5.80 6.30 5.80 4.90 5.60 5.60 12.96 11.67 11.87 12.30
LR 0.34 0.30 0.40 0.42 4.00 3.80 4.40 4.80 3.90 3.20 3.80 3.60 8.24 7.30 8.60 8.82
LSD (0.05) 0.17 1.02 1.08 2.38
78
Effect of tillage and crop residue on ultisol

Rice Crop Growth The growth response of the rice cultivars to
soil tillage and crop residue treatments are
shown in Tables 3 and 4. Generally rice
growth was significantly (p<0.05) better on the
soil treated with the combination of crop
residues and tillage method than on the soil
tilled or untilled without crop residue
treatment for the two years study. The growth
of the crops was superior on tilled soil treated
with crop residue than on the tilled soil
without crop residue treatment. Growth was
also superior on the untilled plots with crop
residue treatment than untilled plots without
residue treatment. The three rice varieties were
significantly (p<0.05) taller when the soil was
treated with crop residue than where the soil
had no crop residue treatment across the four
tillage methods. Ploughing, ploughing and
harrowing the soil with crop residue
significantly (p<0.05) increased plant height
than when the soil was not tilled, or hoe –
tilled with or without crop residue treatment.
There were no significant differences in plant
heights of the three varieties when under the
same treatments. Tillering was significantly
(p<0.05) higher in ITA 315 and Ex-china than
in ITA 257. The three varieties produced
significantly (p<0.05) higher number of tillers
when the soil was tilled and treated with crop
residue than when not; and when the soil was
untilled with crop reissue treatment than when
not. Ploughing, ploughing and harrowing the
soil with crop residue treatment significantly
(p<0.05) increased tillering compared to where
the soil was not tilled or hoe-tilled with or
without crop residue treatment. Tillerings of
the three varieties were statistically
comparable when the soil received rice straw,
legume residue and burnt rice husk treatments
across the four tillage methods.
Specifically, the influence of the No-tillage
method and residue treatment on the tillering
of the three varieties for the two years was in
the order: NT+BRS = NT+RS = NT+LR >
NT+NR. The application of Hoe-tillage
method and residue treatments to the soil led
to significant differences in tillering of the
three varieties in the order HT+BRS = HT +
RS = HT+LR > HT+NR in the first year, and
HT + BRS>HT+RS = HT+LR> HT+NR in the
second year. When the soil was treated with
ploughing and crop residue the rice tillering
was in the order: PR > PL + RS > PL +LRI>
PL+NR whereas in the second year it was in
the order: PL+BRS>PL+LR>PL+RS>PL+NR.
The influence of ploughing and harrowing
with crop residue treatments on the rice
tillering showed that in the first year
PH+RS>PH+BRS>PH+LR>PH+NR in the
first year, while in the second year the tillering
was in the order PH + BRS = PH + LR = PH +
LR > PH + NR.
The pooled result of the influence of the
various tillage and different residue treatments
on the tillering ability of the three varieties
was in the order ITA 315 > Ex-China>ITA
257 in the first year and ITA 315 = Ex-China
> ITA 257 in the second year.
The combination of the No-tillage and the
different crop residues did not produce
significant differences in plant height in both
years of the study. Plant height was however
significantly (p<0.05) higher where HT+BRS
treatment was applied compared to HT+NR
treatment in both years of the study. For
ploughing and crop residue combinations, the
rice plants were significantly (p<0.05) taller
where PL+BRS was applied to the soil
compared to the application of PL+NR in the
first year, while heights were comparable
among the plants on soils treated with
ploughing and the different crop residues in
the second year. The rice crops were taller on
soils treated with PH+BRS in the first year,
whereas in the second year, the rice plants
were taller on soils treated with PH+BRS and
PH+RS compared to the plants grown on soil
treated with PH+NR.
79
Ogbodo and Nnabude NJSS/22(1)/2012

Table 3. Effect of tillage and crop residue on rice plant height
First Year Second Year
Rice Varieties Rice Varieties
Tillage and Residue ITA 257 Ex-China ITA 315 Mean ITA 257 Ex-China ITA 315 Mean
NT+NR 52.53 42.33 55.67 50.18 42.23 47.33 45.67 45.10
NT+RS 45.67 52.33 55.33 51.11 47.67 52.33 56.67 52.22
NT+BRS 49.33 56.67 66.67 57.56 54.33 60.00 61.33 58.55
NT+LR 47.33 54.33 50.67 50.78 50.00 61.33 62.00 57.78
HT+NR 47.33 49.33 52.33 50.60 45.67 47.33 47.67 46.89
HT+RS 56.33 59.00 62.33 59.22 55.33 56.00 66.00 59.11
HT+BRS 52.67 63.33 74.33 63.44 56.67 64.67 69.33 63.56
HT+LR 50.67 60.67 62.00 57.78 50.33 61.33 68.00 59.89
PL+NR 52.33 52.33 50.55 51.74 49.67 52.67 52.33 51.56
PL+RS 54.33 60.00 61.33 58.55 55.33 66.00 71.00 64.11
PL+BRS 56.33 64.67 73.00 64.67 60.00 66.00 72.67 65.67
PL+LR 52.33 60.00 69.67 60.67 56.33 63.00 68.67 62.67
PH+NR 54.33 55.33 56.00 54.22 50.67 52.67 56.00 53.11
PH+RS 61.33 63.00 68.67 64.33 66.00 68.67 74.67 69.78
PH+BRS 66.00 71.00 72.67 69.89 71.00 78.67 84.67 78.21
PH+LR 61.00 66.00 68.67 65.22 64.33 69.33 70.67 68.11
Mean 53.74 58.98 62.50 54.70 60.46 64.21
FLSD (0.05)
Tillage and residue 4.12 6.15
Varieties 5.00 9.26
NT+NR = No-Tillage + No Residue; NT+RS = No-Tillage + Rice Straw; NT+BRS = No-Tillage+ Burnt Rice Straw;
NT+LR = No-Tillage + Legume Residue; HT+NR = Hoe Tillage + No Residue; HT+RS = Hoe Tillage + Rice Straw
HT+BRS = Hoe Tillage + Burnt Rice Straw; HT+LR = Hoe Tillage + Legume Residue; PL+NR = Ploughing + No
Residue; PL+RS = Ploughing + Rice Straw; PL+BRS = Ploughing + Burnt Rice Straw; PL+LR = Ploughing +
Legume Residue; PH+NR = Ploughing and Harrowing + No Residue; PH+RS = Ploughing and Harrowing + Rice
Straw; PH+BRS = Ploughing and Harrowing + Burnt Rice Straw; PH+LR = Ploughing and Harrowing + Legume
Residue
Table 4. Effect of tillage and crop residue on number of rice tillers First Year Second Year Tillage and Residue Rice Varieties Rice Varieties ITA 257 Ex-China ITA 315 Mean ITA 257 Ex-China ITA 315 Mean
NT+NR 4.00 11.00 11.00 9.00 6.00 8.00 8.00 9.00 NT+RS 6.00 14.00 13.00 12.00 11.00 12.00 12.00 11.00 NT+BRS 7.00 15.00 16.00 13.00 10.00 13.00 13.00 12.00 NT+LR 7.00 15.00 17.00 14.00 8.00 12.00 11.00 11.00 HT+NR 6.00 11.00 15.00 11.00 7.00 11.00 12.00 10.00 HT+RS 12.00 14.00 16.00 14.00 12.00 15.00 17.00 15.00 HT+BRS 10.00 16.00 17.00 14.00 13.00 21.00 18.00 17.00 HT+LR 11.00 10.00 13.00 13.00 12.00 17.00 14.00 14.00 PL+NR 10.00 10.00 13.00 11.00 10.00 12.00 13.00 12.00 PL+RS 15.00 19.00 16.00 17.00 14.00 19.00 18.00 17.00 PL+BRS 16.00 18.00 20.00 18.00 12.00 15.00 17.00 15.00 PL+LR 14.00 16.00 15.00 15.00 13.00 15.00 18.00 15.00 PH+NR 12.00 15.00 14.00 14.00 14.00 14.00 15.00 14.00 PH+AS 15.00 18.00 20.00 18.00 19.00 18.00 16.00 18.00 PH+BRS 13.00 19.00 18.00 17.00 14.00 18.00 20.00 17.00 PH+LR 14.00 15.00 19.00 16.00 15.00 18.00 20.00 18.00 Mean 10.00 16.00 16.00 12.00 15.00 15.00 LSD (0.05) Tillage and residue 2.71 2.00 Varieties 2.75 3.00
NT+NR = No-Tillage + No Residue; NT+RS = No-Tillage + Rice Straw; NT+BRS = No-Tillage+ Burnt Rice
Straw;
NT+LR = No-Tillage + Legume Residue; HT+NR = Hoe Tillage + No Residue; HT+RS = Hoe Tillage + Rice Straw
HT+BRS = Hoe Tillage + Burnt Rice Straw; HT+LR = Hoe Tillage + Legume Residue; PL+NR = Ploughing + No
Residue; PL+RS = Ploughing + Rice Straw; PL+BRS = Ploughing + Burnt Rice Straw; PL+LR = Ploughing +
Legume Residue; PH+NR = Ploughing and Harrowing + No Residue; PH+RS = Ploughing and Harrowing + Rice
80
Effect of tillage and crop residue on ultisol

Rice grain yield
The effect of tillage and crop residue treatment
on rice grain yield is presented in Table 5.
Generally, there was significant increase in
grain yield for the three varieties when the soil
was tilled and treated with crop residue than
when the soil was not tilled and without crop
residue treatment. Grain yield was also
significantly (p<0.05) higher when the soil
was tilled and treated with crop residue than
when tilled without crop residue treatment.
Grain yield was also significantly (p<0.05)
higher when the soil was treated with crop
residue than when not across the four tillage
methods. Ploughing, ploughing and harrowing
the soil with crop residue treatment led to
significantly (p<0.05) higher grain yield than
when the soil was not tilled or hoe-tilled, with
or without crop residue treatments. The
combination of burnt rice straw and ploughing,
and burnt rice straw and ploughing and
harrowing operations led to significantly
(p<0.05) higher grain yield than when the soil
was not tilled or hoe-tilled with residue
treatment. Generally, grain yield of ITA 315
and Ex-China were significantly (p<0.05)
higher than grain yield of ITA 257. The
highest grain yield of 4.87 t/ha was obtained
from ITA 315 when the soil received
combination of ploughing and harrowing with
burnt rice straw treatment.
Specifically, the influence of the different
tillage methods and crop residue treatments on
the grain yields of the three rice varieties
showed that under No tillage methods and
residue management, grain yields were
significantly higher in the order NT + BRS =
NT + RS = NT+LR>NT+NR in the first year
and NT+BRS > NT+RS= NT+LR> NT+NR in
the second year, whereas under Hoe-tillage
and crop residue combination treatments the
order was: HT + BRS > HT + RS = HT + LR
>HT+NR in the first year and HT + BRS = HT
+ RS = HT+LR>HT+NR in the second year.
The order of influence of ploughing and
residue combination treatments on grain yield
was in the order: PL+BRS = PL + LR = PL +
RS>PL+NR in the first year, and PL + BRS >
PL + RS=PL+LR>PL+NR in the second year,
while the order of influence for applying
ploughing and harrowing with crop residue
treatment to the soil on rice grain yield was
PH+BRS>PH+RS=PH+LR>PH+NR in both
years of the study.
The pooled result of the yield response of the
different varieties to the treatments were in the
order ITA 315 =Ex-China >ITA 257.
Quantitatively, grain yield significantly
increased by 147, 1.21 and 1.20 t/ha as a result
of the application of NTBRS, NT+LR and
NT+RS in the first year compared to NT+ NR
treatment. In the second year, there were 2.05,
1.64 and 1.53 t/ha significantly higher grain
yields as a result of the application of NT +
PRS, NT + LR and NT + RS treatments
compared to NT + NR, whereas NT+BRS also
led to 0.52 and 0.41 t/ha significantly (p<0.05)
higher grain yield than NT+ RS and NT + LR.
When the soil was tilled with hoe and treated
with crop residues, significantly (p<0.05)
higher grain yields of 1.65, 1.20 and 1.16 t/ha
were obtained by the application of HT+BRS,
HT+LR and HT+RS than HT+NR treatment,
while grain yield significantly increased by
0.45 and 0.49 t/ha as a result of the application
of HT + BRS compared to HT + LR and HT +
RS respectively. In the second year, HT +
BRS, HT + LR and HT + RS treatments
brought about 2.67, 2.45 and 2.42 t/ha
significantly (p<0.05) higher grain yields
compared to the application of HT+ NR.
Ploughing the soil and applying crop residues
brought about significant grain yield increases
of 1.91, 1.68 and 1.62 t/ha as a result of
PL+BRS, PL+LR and PL+RS treatments
respectively, compared to PL+NR in the first
year. In the second year subjecting the soil to
PL+BRS, PL+LR and PL+RS treatments
significantly increased grain yield by 2.44,
1.95 and 1.91 t/ha respectively compared to
PL+NR, whereas PL+BRS also significantly
improved grain yield by 0.53 and 0.49 t/ha
compared to PL+RS and PL+LR respectively.
When the soil was ploughed and harrowed,
and treated with the different crop residues,
81
Ogbodo and Nnabude NJSS/22(1)/2012

significantly (p<0.05) higher grain yields of
2.55, 1.54, 1.52 t/ha were obtained as a result
of PH+BRS, PH+LR and PH+RS respectively
compared to PH+NR in the first year.
PH+BRS treatment also increased grain yield
by 1.03 and 1.01 t/ha compared to treating the
soil with PH+RS and PH+LR respectively.
The Second year result showed that applying
PH+BRS, PH+RS and PH+LR to the soil
significantly increased rice grain yields by
2.74, 1.72 and 1.71 t/ha respectively than
PH+NR treatment, whereas PH+BRS also
brought about 1.03 and 1.02 t/ha significantly
higher grains than treating the soil with
PH+LR and PH+RS respectively.
The variety effect on grain yield valued across
tillage methods and residue managements
showed that in the first year, ITA 315 and Ex-
China had 0.55 and 0.47 t/ha significantly
higher grain yields respectively than ITA 257,
while in the second year ITA 315 and Ex-
China had 0.62 and 0.50 t/ha significantly
higher grain yield than ITA 257. There were
no significant differences in the grain yields of
ITA 315 and Ex-China owing to variety effect
in the two years.
Table 5. Effect of tillage and crop residue on rice grain yield First Year Second Year
Tillage and Residue Rice Varieties Rice Varieties
ITA 257 Ex-China ITA 315 Mean ITA 257 Ex-China ITA 315 Mean
NT+NR 0.40 0.55 0.60 0.52 0.46 0.45 0.50 0.47
NT+RS 1.65 1.75 1.77 1.72 1.87 2.00 2.13 2.00
NT+BRS 1.75 2.23 2.00 1.99 2.40 2.53 2.63 2.52
NT+LR 1.70 1.75 1.75 1.73 2.00 2.10 2.23 2.11
HT+NR 0.50 0.68 0.67 0.62 0.60 0.67 0.68 0.65
HT+RS 1.68 1.80 1.85 1.78 2.40 3.30 3.53 3.07
HT+BRS 1.95 2.40 2.46 2.74 2.67 3.63 3.67 3.32
HT+LR 1.67 1.80 1.98 1.82 2.46 3.34 3.50 3.10
PL+NR 0.80 1.27 2.00 1.36 0.94 1.18 1.10 1.07
PL++RS 2.46 3.38 3.10 2.98 2.60 3.00 3.34 2.98
PL+BRS 2.60 3.58 3.63 3.27 3.00 3.62 3.92 3.51
PL+LR 2.59 3.34 3.20 3.04 2.68 3.10 3.28 3.02
PH+NR 1.42 1.69 1.87 1.66 1.28 1.77 1.83 1.63
PH+RS 2.68 3.34 3.53 3.18 2.83 3.56 3.67 3.35
PH+BRS 3.34 4.62 4.66 4.21 3.63 4.60 4.87 4.37
PH+LR 2.64 3.30 3.67 3.20 2.77 3.62 3.64 3.34
Mean 1.87 2.34 2.42 2.16 2.66 2.78
FLSD (0.05)
Tillage and residue 0.42 0.40
Varieties 0.43 0.45
NT+NR = No-Tillage + No Residue; NT+RS = No-Tillage + Rice Straw; NT+BRS = No-Tillage+ Burnt Rice
Straw;
NT+LR = No-Tillage + Legume Residue; HT+NR = Hoe Tillage + No Residue; HT+RS = Hoe Tillage + Rice Straw
HT+BRS = Hoe Tillage + Burnt Rice Straw; HT+LR = Hoe Tillage + Legume Residue; PL+NR = Ploughing + No
Residue; PL+RS = Ploughing + Rice Straw; PL+BRS = Ploughing + Burnt Rice Straw; PL+LR = Ploughing +
Legume Residue; PH+NR = Ploughing and Harrowing + No Residue; PH+RS = Ploughing and Harrowing + Rice
Straw; PH+BRS = Ploughing and Harrowing + Burnt Rice Straw; PH+LR = Ploughing and Harrowing + Legume
Residue
DISCUSSION
The higher organic matter levels on the
surfaces of residue treated plots were a product
of the decomposed crop residue. The hoe-tilled
soil had lower organic matter level than the
soils with the other tillage methods with or
without residue treatment because of the
removal of the existing vegetation during land
clearing. The lower organic matter on the
burnt rice straw treated soils occurred because
much of the organic carbon was lost during
burning. The reduction in the acidity of residue
treated soils was more of a result of organic
matter level than the effect of tillage. The
significantly higher pH of the burnt rice straw
treated soils was also specifically because of
82
Effect of tillage and crop residue on ultisol

the influence of Ca and Mg which are the
major constituents of the burnt rice straw, and
which had liming effect on the soil acidity.
These elements displaced H ions in the
exchange site which were leached down the
soil profile, hence reducing the H ion
concentration of the soil. Biederbeck et al.
(1980) also reported that organic residue
particularly the burnt type had liming effect on
the soil. The improvement in soil chemistry in
the study was very encouraging considering
the poor fertility status of the soil reported
earlier (FDALR, 1985) and the pre-planting
chemical properties of the study site.
The differences in the basic cations between
where residues were applied compared to
where there was no residue application across
the tillage methods was accounted for by the
release of the organic elements in the residues
after decomposition and mineralization. This
might have been made possible by the
increased activities of microbes which must
also have increased in population due to the
conducive environment for their survival
provided by the residue mulch. The lower
acidity on the residue treated soil also
encouraged the mineralization and release of
these elements. The organic residue might also
have increased soil moisture levels and hence
the solubilization and increased organic P
availability. Blevins et al. (1983) equally
reported that the behaviour of P is governed by
soil water, which improves phosphorus
availability in the soil.
The higher organic matter levels equally led to
the increase in the soil nutrient elements and
CEC because of the ones released from the
organic matter reserve . Organic matter is
known to be the natural reserve of the organic
nutrients. The higher pH values on residue
treated soils also encouraged the release of
these elements in the soil exchange complex.
Asadu and Akamigbo (1990) reported that
reduced acidity would encourage the
solubilization and release of the inorganic
forms of nutrient elements into the soil. It is
the reduction in the soils acidity and increased
organic matter and accumulation of nutrients
that brought about higher soil cation exchange
capacity observed in the residue treated plots
in the study.
The improved soil chemical properties under
residue treatment made nutrients more
available for plant growth whether the soil was
tilled or not tilled. The higher levels of these
nutrient elements increased crop productivity .
The reduced acidity under crop residue
treatment made more nutrients available and
reduced the availability of trace elements that
could have hampered crop growth . Also,
improved soil structure and moisture under the
tilled and residue treatment conditions made
mobility of nutrient and gaseous exchange
easier leading to improved nutrient availability
and uptake by plants for growth .
The improved soil chemical properties
resulting from the treatment including reduced
acidity and higher soil organic matter and
availability of nutrients raised the soil fertility
status leading to significant increase in grain
yield. This was accentuated by the
improvement in grain yield tonnage harvested
per hectare among the three varieties. The
highest grain of 4.47 t/ha obtained in the study
is a great improvement in the average yield of
2.5 – 3.5 t/ha reported in earlier studies in the
area ( Ogbodo and Nnabude, 2004; Ogbodo et
al., 2009; Ogbodo, 2010). The reduced acidity
of the plots treated with BRS across the tillage
methods led to increased release of nutrient
into the soil and subsequent uptake by plants
for superior growth and yield compared to the
other treatments. The soil physical
environmental conditions provided by tillage
also improved mobility of nutrients and root
penetration to access the nutrients and water.
The superior plant size particularly the higher
tillering of the plants where the soil was tilled
and treated with crop residue enhanced the
photosynthetic efficiency of the plants, leading
to improved grain yield. The significantly
higher grain yield obtained in ITA 315 and Ex-
China plots across the whole tillage and crop
83
Ogbodo and Nnabude NJSS/22(1)/2012

residue treatments was a product of variety
effect. Ogbodo and Nnabude (2004) had
reported significantly higher yield of ITA 315
and Ex-China compared to ITA 257 which
they attributed to the adaptability of the two
varieties to the inherent environmental
conditions of the study area.
CONCLUSION
The results of the study indicated that it is
possible to bring about improvements in the
fertility status of the soils of Abakaliki area
with adequate tillage and crop residue
management. These combination treatments
provided conducive soil environment for
nutrient availability and uptake by plant for
growth and yield. The treatment combination
of tillage and burnt rice straw provided
particularly superior improvement in soil
chemical properties, because the residue ash
neutralized the soil acidity to a great extent as
well as provided other nutrient needed by the
rice crop for growth and yield, compared to
the other residue sources. Ploughing and
harrowing the soil and treating with burnt rice
straw proved the most adequate measure in the
study to combat the soils chemical constraints.
It is apparent from the study that for a better
improvement in rice grain yield in the study
area that farmers are encouraged to plough and
harrow their soils, and treat with burnt rice
straw.
REFERENCES
Biederbeck, V. O; C. A. Campbell, K. E.
Bowren, M. Skitzer, and R. N. Melver
(1980). Effect of Burning Cereal Straw
on Soil Properties and Grain Yields in
Baskatchewan. Soil Sci. Soc. Amer J.
44: 103 – 111.
Blevins R. L.; G. W. Thomas, M. S. Smith, W.
W. Fyre and P. L. Cornelus (1983).
Changes in Soil Properties after 10
years continuous no tillage and
conventionally tilled corn. Soil tillage
Research: 135 – 146.
Bouyoucus, G.M., (1951). A recalibration of
hydrometer for making mechanical
analysis of soils, Agronomy Journal,
34:434-436.
Federal Department of Agricultural Land
Resources (FDALR), (1985).
Agricultural Land Resources Technical
Bulletin. Vol 5.
Gee, G.W. and J.W. Bauder, 1986. Particles
size analysis. In: Methods of Soil
analysis part 1. A. Klute (ed) Am. Soc.
Agron. Madision 101 USA: 38 - 41
Mclean, E.D. (1982). Soil pH and lime
requirements in page a…ed. Methods
of soil analysis part 2. Chemical and
microbiological properties (2nd Ed.).
Agronomy series No.SSA.Maidison,
Wis. USA.PP.199-234.
Nelson, D.W. and L. E. Sommers, (1982).
Total Organic Carbon and Matter in:
pp A.L.(ed.). Methods of soil analysis.
Part 2 chemical and microbiological
properties (2nd ed.). Agronomy series
No.9, ASA, SSA, Maidison, Wis.USA.
pp. 570.
Ogbodo, E.N. (2004). Effect of Tillage
Methods and Crop Residue Mulch on
Soil Physical Conditions, Growth and
Yield of Irrigation Maize at Abakaliki,
Southeastern Nigeria. Journal of the
Science of Agriculture, Food
Technology and Environment. Vol. 4,
2004: 1 – 9.
Ogbodo, E.N. (2005a). Response of rice
(Oryza sativa) to organic and inorganic
manure in an ultisol at Abakaliki
Southeastern Nigeria. Journal of
Agriculture, Forestry and Social
Sciences. Vol. 3 (1) 2005: 9 – 14.
84
Effect of tillage and crop residue on ultisol

Ogbodo, E.N. (2009). Effect of Crop Residue
on Soil Chemical Properties and Rice
Yields on an Ultisol at Abakaliki,
Southeastern Nigeria. American-
Eurasian Journal of Sustainable
Agriculture, 3(3): 422-447.
Ogbodo, E.N. (2010). Effect of Crop Residue
on Soil Physical Properties and Rice
Yield on an Acid Ultisol at Abakaliki,
Southeastern Nigeria. Res. J. Agric. &
Biol. Sci., 6(5): 647-652.
Ogobodo, E. N. and P. A. Nnabude (2004).
Evaluation of the Performance of
Three Varieties of Upland Rice in
Degraded Acid Soil in Abakaliki,
EbonyI State. Journal of technology
and Education in Nigeria, 9 (2): 1 – 7.
Ogbodo, E.N. I.I. Ekpe, E.B. Utobo (2009).
Use of Organic Amendments to
Improve Chemical Properties and Crop
Yield in Degraded Typic Haplustult in
South Eastern Nigeria. American-
Eurasian Journal of Sustainable
Agriculture, 3(3): 609-614, 2009.
Page, A.L., B.H. Miller and D.R. Keeney
(1982). Methods of Soil Analysis.
Second Edition. American Society of
Agronomy, Madison, Wisconsin
SAS Institute Lac, (2006). SAS/STAT User’s
Guide: Version 6, Fourth Edition, vol
2, Carry, NC., SAS Institute Inc, 2006.
846pp.
Tel, D. and F. Rao (1982). Animated and
Semi-anotamated Methods for Soil and
Plant Analysis pp.201-270.
85
Ogbodo and Nnabude NJSS/22(1)/2012

EFFECT OF TILLAGE AND CROP RESIDUE ON SOIL PHYSICAL PROPERTIES
AND RICE YIELD ON AN ACID ULTISOL AT ABAKALIKI, SOUTHEASTERN
NIGERIA
OGBODO, E.N1. AND P.A. NNABUDE2 1Department of Soil Science and Environmental Management, Faculty of Agriculture and
Natural Resources Management, Ebonyi State University, P.M.B. 053 Abakaliki, Nigeria. 2Department of Applied Biological Sciences, Nnamdi Azikiwe University, Awka, Nigeria.
ABSTRACT
The alleviation of the soil physical constraints at Abakaliki, Ebonyi State Nigeria is a priority
issue. A study was carried out in 2009 and 2010 to evaluate the effect of combinations of
different tillage treatments [(No-tillage (NT); Hoe-Tillage (HT); ploughing (PL); ploughing and
harrowing (PHJ)] and Crop residues treatment [(No Residue (NR); Rice Straw (RS); Burnt Rice
Husk (BRH) and Legume Residue (LR)] on the soils physical properties, and rice growth and
yield . Improved varieties of rice (ITA 257; Ex-china and ITA 315) were used as the test crops.
The soil temperature and bulk density were significantly (p>0.05) reduced on soils treated with
the combinations of the tillage and crop residues compared to the soils that were either tilled or
not tilled but without crop residue treatment. The soils total porosity, water infiltration and
moisture content significantly (p<0.05) improved when treated with combinations of tillage and
crop residue compared to the combination of no-tillage, with or without crop residues
applications. Treating the soil with a combination of tillage and crop residue brought about
significant improvements in rice plant height and tillers, compared to where the soil was not
tilled or hoe-tilled with or without the application of residues. Rice growth on soils treated with
burnt rice husk was superior to the plants grown on soils treated with rice straw or legume
residue across the tillage methods. Rice grain yield was significantly (p<0.05) higher on soils
that received treatment combinations of tillage and residue than on the soil that was not tilled
with-or without residue treatment. Grain yield was also significantly (p<0.05) higher where the
soil was ploughed or ploughed and harrowed and treated with crop residue than when the soil
was hoe-tilled and either treated with crop residue or not. Grain yield was significantly (p<0.05)
higher when the soil was treated with burnt rice husk than with rice straw or legume residue
across the tillage methods. The grain yield of ITA 315 and Ex-china were significantly (p<0.05)
higher than ITA 257 in both years. The highest grain yield of 3.92 t/ha in the study was gotten
from ITA 315 grown on the soil that was ploughed and harrowed and treated with burnt rice
husk. This yield observation was attributed to better soil structure, lower soil temperature, higher
soil moisture, and the fact that the burnt rice husk provided additional benefits of improving the
soil chemical properties.
Key words: Tillage and Crop Residue, Soil Physical Properties, Acid Ultisol, Rice Yields,
Abakaliki, Southeastern Nigeria *Corresponding author. Tel.: +234 8037465495; e-mail:[email protected]
86
Effect of tillage and crop residue on ultisol

INTRODUCTION
The alleviation of the productivity constraints
of the soils of the Abakaliki area has continued
to agitate the minds of many Agriculturists.
The farmers, who are the major inhabitants of
the area, have over the years suffered declining
productivity of their crops owing to the soil
related problems. Many scientists have for this
reason embarked on researches aimed at
resolving these problems in order to achieve
sustainable crop production. Many of these
endeavors were aimed at measures that
improved the soils’ chemical status. There is
the need to emphasize on efforts that could as
well address the physical constraints of the
soils.
The studies that had been carried out in the
recent past towards this problem had achieved
limited results. There is therefore the need to
intensify efforts at finding a lasting solution to
the soils’ physical constraints, in order to
achieve an improved and secured food
production.
The present study centered on the evaluation
of the possibility of employing the
combination of tillage methods and crop
residues to remediate the direct effects of the
soils’ physical problems on crop productivity.
MATERIALS AND METHODS The experiments were conducted in the 2009
and 2010 farming seasons, at the Research and
Teaching Farm of the Faculty of Agriculture,
Ebonyi State University, Abakaliki. The area
is located within longitude 080 03/ E and
latitude 060 25/ N in the derived savanna zone
of Nigeria. The mean monthly temperatures
ranged between 24 oC and 28 oC. The rainfall
pattern was bimodal, with peaks in the months
of July and September. Annual amounts of
rainfall ranged between 1800 and 2000 mm.
Rainfall stabilized around May and stopped
around October, leaving a dry period between
November and April during the study seasons.
The soil is hydromorphic and has an
isohypothermic soil temperature regime and
belongs to the order Ultisol derived from shale
and classified as typic haplustult. The
description of some surface soil physical and
chemical characteristics is shown in Table 1.
The area was previously used for maize
production, before it was used for the
experiment.
Table 1. Pre-Planting Soil Texture and Chemical Properties
Soil Texture
Sand (%)
Silt (%)
Clay (%)
Textural Class
Chemical Properties pH (H2O)
Organic Matter (%)
Total N (%)
Available P (gm/kg)
K (cmol(+)/kg)
Ca (cmol(+)/kg)
Mg (cmol(+)/kg)
CEC(cmol(+)/kg)
44.80
34.40
20.80
Sandy Clay Loam
4.80
2.00
0.12
6.00
0.19
2.10
2.20
4.60
Experimental Design and Treatments
The experimental design used was 4 x 3 x 4
split-split plot factorial in a Randomized
Complete Block Design. Tillage methods was
the main treatment, rice cultivars was the sub
treatment whereas crop residue source was the
sub-sub treatment. Each treatment was
replicated three times. The tillage methods
were no – tillage (NT), Hoe – tillage (HT),
Ploughing (PL) and Ploughing and harrowing
87
Ogbodo and Nnabude NJSS/22(1)/2012
(PH). The three rice cultivars were ITA 315,
Ex-china and ITA 257, whereas the crop
residue treatments were no residue (NR), Rice
Straw (RS), Burnt Rice Husk (BRH) and
legume residue (LR). The dry rice straw was
from the previous year harvest, the burnt rice
husk was collected from the rice mill dump,
whereas Centrocema pubensis was harvested
from the ones growing widely in the
surrounding bush. The improved rice cultivars
used for the trials were foundation seeds
sourced from the International Institute of
Tropical Agriculture (IITA), Ibadan.
Field Layout
The area of land used for the experiment
measured 769.5 m2. Each replicate measured
256.5 m2 and comprised of four tillage
methods, three rice cultivars and four crop
residue sources. There were three blocks
within each tillage treatment measuring 54 m2.
Each block comprised of 12 treatment units,
each measuring 16 m2. The replicates and
tillage methods were separated by one another
by 1m alleys respectively, whereas the
individual plots were separated by 0.5 m
alleys.
Treatment Applications
The ploughing was carried out once for the PL
plots, while the PH plots were ploughed once
and harrowed twice. For the HT plots, the
vegetation was slashed with a matchet and
removed, while the soil was tilled manually
with a hoe. A non-selective herbicide,
glyphosate (360g a.i) was sprayed on the
vegetation on the NT plots at the rate of 5
liters per hectare two weeks before sowing the
seed. The crop residues were applied as
surface mulch on the appropriate plots. 5 ton
per hectare (t/ha) equivalent of dry rice straw,
freshly harvested Centrosema pubensis and
burnt rice husk were applied on the
appropriate plots. For the NR plots, no crop
residue was applied while the existing plant
residues were removed. The rice seeds were
directly seeded by dibbling; using the sticks to
create opening and the seeds covered after
sowing. Three seeds were planted per hill at a
spacing of 25 cm x 25 cm, and later thinned
down to two seedlings per stand at 21 days
after planting (DAP), giving plant population
of 320,000 stands per hectare. Fertilizer was
applied at the rate of 40 kg P / ha as single
super phosphate, 40 kg K / ha as muriate of
potash and 80 kg N / ha as urea to all the plots.
One third of the N fertilizer was applied
alongside the P and K basally before residue
application; 4 days before planting the seeds,
whereas the remaining two thirds of N were
applied at 75 DAP.
Data Collection
Six soil auger samples were randomly
collected from the experimental area at 0-20
cm depth for pre-planting soil analysis. A t 65
days after planting, six auger samples were
taken from 0-10cm depth in each plot for the
determination of soil moisture. Also six
undisturbed soil core samples of 5 cm
diameter were taken from each plot at 30 DAP
for analysis of bulk density. Soil water
infiltration capacity was measured on each plot
at 60 DAP with a single ring infiltrometer. Soil
temperature measurements were taken at 14,
28, 42, 56, 70 and 84 DAP using a centigrade
soil thermometer, and the mean recorded.
Plant height and tiller number were measured
at 75 DAP. Plant height was taken as the
height from the base of the plant and the tip of
the tallest tiller using a meter rule. At dry
maturity, the rice panicles were harvested from
a net plot of 2 m x 2 m in the middle of each
plot, dried, threshed and the grain yield data
adjusted to 14% moisture, and converted to
t/ha.
Laboratory Methods
The pre-planting composite soil samples
(taken at 0 – 20cm depth) were analyzed in the
laboratory for the texture and chemical
properties. The soil particle size distribution
was determined by the hydrometer method
(Gee and Bouder 1986). The post harvest soil
samples taken from each plot were subjected
to chemical analysis. Total nitrogen was
determined by the Macro Kjeldahl method
(Bouycous, 1951). Available P was
88
Effect of tillage and crop residue on ultisol

determined using Bray II method as outlined
in Page et al. (1982). Organic carbon was
determined by the Walkley and Black method
(Nelson and Sommers, 1982). Soil pH (2:1 in
water) was determined by the glass electrode
pH meter (Maclean, 1982). Exchangeable
bases were extracted using the ammonium
acetate method (Tel and Rao, 1982)
DATA ANALYSIS
Analysis of variance and mean separation were
done using least significant difference test for
P≤0.05 procedure as described by SAS (2006).
RESULTS
Soil Physical Properties The effects of the combination of tillage
methods and crop residues on soil physical
properties are presented in Table 2. The
combination of individual tillage and crop
residues significantly reduced soil temperature
compared to the tillage treatment without crop
residue. The combination of tillage and crop
residue application also led to significant
reduction in soil bulk density compared to the
tillage without crop residue treatment. Bulk
density was also significantly lower where the
soil was ploughed or ploughed and harrowed
with residue treatment, than the combination
of hoe tillage and crop residue.
The bulk density values were lower in the
second year where the soil was tilled and
treated with crop residue. Tillage and crop
residue treatments significantly increased the
soil total porosity in both years. Ploughing or
ploughing and harrowing the soil with crop
residue treatments significantly increased the
soil total porosity than hoe tillage and no-
tillage with crop residue treatment. The
application of combination of tillage and crop
residue treatments to the soil led to significant
increase in soil water infiltration compared to
tillage without crop residue treatments.
Ploughing and ploughing and harrowing the
soil with residue treatments significantly
increased infiltration compared to hoe-tillage
and no-tillage in the first year, while in the
second year hoe- tillage, ploughing, and
ploughing and harrowing the soil with crop
residues significantly increased infiltration
compared to where the soil was not tilled with
or without crop residue. Combining the
different tillage methods with rice straw or
legume residues significantly increase water
infiltration than combining the tillage methods
with burnt rice husk or no residue application.
The combination of ploughing or ploughing
and harrowing and Rice straw or legume
residue significantly increased water
infiltration compared to the combination of
burnt rice husk. The combinations of the
residues with ploughing or ploughing and
harrowing the soil increased infiltration
compared to the combinations of the residues
with no-tillage or hoe-tillage.
Soil moisture was significantly higher when
the soil was treated with crop residue than
when there was no residue treatment across the
tillage methods. Soil moisture was
significantly higher when the soil was
ploughed or ploughed and harrowed and
treated with rice husk or legume residue than
when not-tilled or hoe-tilled with Rice straw or
legume residue treatment than burnt rice husk
treatment. The combination of each crop
residue and ploughing or ploughhing and
harrowing the soil significantly increased soil
moisture compared to that of the respective
crop residues and no-tillage treatment. There
were no significant differences in the soil
moisture between where the soil was not tilled
and treated with crop residue and where hoe-
tilled and treated with crop residue.
89
Ogbodo and Nnabude NJSS/22(1)/2012

Table 2. Effect of Tillage and Crop Residue on Soil Physical Properties 1st Year 2nd Year
Crop Residue No Tillage Hoe
Tillage
Plough
Ploughed
&Harrow
Mean
No
Tillage
Hoe
Tillage
Plough
Ploughed
&Harrow
Mean
Temperature (0C) No Residue 30.6 31.3 31.1 30.1 30.6 30.9 30.9 30.5 28.8 30.3
Rice Straw 27.4 28.1 27.7 29.1 28.1 27.7 27.7 27.3 28.4 27.8
Burnt Rice Husk 28.4 28.7 28.1 28.0 29.6 29.4 28.4 28.4 28.7 29.4
Legume Residue 27.9 28.5 28.1 29.0 28.4 28.1 28.1 27.6 28.8 28.15
Bulk Density (g/cm3) No Residue 1.6 1.5 1.4 1.4 1.5 1.6 1.5 1.4 1.3 1.5
Rice Straw 1.5 1.4 1.3 1.3 1.4 1.5 1.4 1.3 1.3 1.4
Burnt Rice Husk 1.5 1.4 1.4 1.4 1.4 1.5 1.4 1.3 1.3 1.4
Legume Residue 1.5 1.4 1.3 1.3 1.4 1.5 1.4 1.3 1.3 1.4
Total Porosity (%) No Residue 39.6 43.0 47.0 47.0 44.2 36.0 43.0 47.0 51.0 42.3
Rice Straw 43.0 47.0 51.0 51.0 48.0 59.0 47.0 51.0 51.0 52.0
Burnt Rice Husk 33.0 47.0 47.0 47.0 46.0 39.6 43.0 51.0 51.0 46.0
Legume Residue 43.0 47.0 51.0 57.0 49.5 43.0 47.0 51.0 51.0 48.0
Infiltration (cm/hr) No Residue 50.6 51.2 54.6 55.8 53.8 50.4 56.1 55.0 55.7 54.3
Rice Straw 59.0 59.0 63.0 65.8 61.7 60.3 59.9 65.2 68.9 63.6
Burnt Rice Husk 49.6 52.9 59.3 61.7 55.9 48.4 57.7 54.4 57.8 54.6
Legume Residue 58.7 60.8 64.3 68.5 63.1 58.7 59.8 63.2 67.9 62.4
Soil Moisture (%) No Residue 19.1 20.5 21.7 24.8 21.6 19.2 20.7 21.5 24.7 21.5
Rice Straw 25.5 28.0 29.3 30.6 28.4 26.9 27.7 28.2 31.5 28.6
Burnt Rice Husk 22.8 24.1 25.4 28.0 25.1 22.4 23.3 26.8 28.6 25.3
Legume Residue 25.8 26.6 29.3 30.1 28.0 25.3 27.9 28.1 31.3 28.2
F-LSD (P < 0.05) Temperature Bulk Density Total Porosity Infiltration Moisture 1st Year 2.00 0.01 4.00 5.29 2.23
2nd Year 1.90 0.01 3.92 6.41 2.92
90
Effect of tillage and crop residue on ultisol

Rice Growth The effects of tillage and crop residue on rice
growth are presented in Tables 3 and 4. The
growth of the crops was superior on soils with
crop residue treatment than on soils without
residue treatment across the four tillage
treatment. The three rice varieties were
significantly (p<0.05) taller when the soil was
treated with crop residue than where the soil
was not treated with crop residue across the
four tillage treatment. The plants were
significantly (p<0.05) taller on ploughed,
ploughed and harrowed plots when treated
with crop residue or not treated with crop
residue than when the soil was not tilled or hoe
– tilled with or without crop residue treatment.
The three varieties produced significantly
(p<0.05) higher number of tillers when the soil
was tilled or not tilled and treated with crop
residue than when the soil was tilled or not
tilled but without crop reissue treatment.
Tillering of the three varieties was
significantly (p<0.05) higher when the soil
was ploughed, ploughed and harrowed with or
without crop residue treatment compared to
where the soil was not tilled or hoe-tilled, with
or without crop residue treatment. Generally,
tillering of ITA 315 and Ex – China were
significantly (p<0.05) higher than that of ITA
257.
Table 3. Effect of tillage and crop residue on number of tillers
NT+NR = No-Tillage + No Residue; NT+RS = No-Tillage + Rice Straw; NT+BRH = No-Tillage+ Burnt Rice Husk;
NT+LR = No-Tillage + Legume Residue; HT+NR = Hoe Tillage + No Residue; HT+RS = Hoe Tillage + Rice Straw
HT+BRH = Hoe Tillage + Burnt Rice Husk; HT+LR = Hoe Tillage + Legume Residue; PL+NR = Ploughing + No
Residue; PL+RS = Ploughing + Rice Straw; PL+BRH = Ploughing + Burnt Rice Husk; PL+LR = Ploughing +
Legume Residue; PH+NR = Ploughing and Harrowing + No Residue; PH+RH = Ploughing and Harrowing + Rice
Straw; PH+BRH = Ploughing and Harrowing + Burnt Rice Husk; PH+LR = Ploughing and Harrowing + Legume
Residue
Year Variety Year Variety
Treatment ITA 257 Ex-China ITA 315 Mean ITA 257 Ex-China ITA 315 Mean NT+NR 6.00 10.00 10.00 9.00 6.00 11.00 10.00 9.00 NT+RS 8.00 12.00 14.00 11.00 8.00 15.00 14.00 12.00 NT+BRH 10.00 14.00 16.00 13.00 11.00 15.00 16.00 14.00 NT+LR 8.00 12.00 14.00 11.00 10.00 13.00 14.00 12.00 HT+NR 8.00 11.00 12.00 10.00 8.00 12.00 11.00 10.00 HT+RS 10.00 14.00 18.00 14.00 10.00 14.00 15.00 13.00 HT+BRH 12.00 16.00 21.00 16.00 14.00 18.00 18.00 17.00 HT+LR 10.00 14.00 18.00 14.00 12.00 15.00 16.00 14.00 PL+NR 8.00 14.00 14.00 12.00 9.00 12.00 11.00 11.00 PL+RS 10.00 16.00 18.00 15.00 11.00 14.00 18.00 14.00 PL+BRH 14.00 19.00 20.00 18.00 14.00 18.00 24.00 19.00 PL+LR 12.00 14.00 15.00 14.00 10.00 14.00 19.00 14.00 PH+NR 9.00 14.00 14.00 12.00 9.00 14.00 12.00 12.00 PH+RS 12.00 18.00 18.00 16.00 12.00 16.00 18.00 16.00 PH+BRH 14.00 24.00 26.00 21.00 16.00 28.00 28.00 24.00 PH+LR 12.00 19.00 16.00 16.00 10.00 15.00 18.00 15.00 Mean 10.00 15.00 17.00 10.00 15.00 16.00 Year 1 Year 2 LSD (0.05) Tillage + Residue 2.00 3.00 Variety 5.00 5.00
91
Ogbodo and Nnabude NJSS/22(1)/2012

Table 4. Effect of tillage and crop residue on plant height (cm) First Year Second Year
Treatment ITA 257 Ex-China ITA 315 Mean ITA 257 Ex-China ITA 315 Mean
NT+NR 52.00 52.00 52.00 52.00 56.00 58.00 57.00 57.00
NT+RS 58.00 64.00 63.00 62.00 57.00 66.00 64.00 62.00
NT+BRH 63.00 69.00 70.00 67.00 66.00 71.00 70.00 69.00
NT+LR 56.00 64.00 67.00 62.00 66.00 63.00 68.00 66.00
HT+NR 56.00 57.00 63.00 59.00 67.00 67.00 62.00 65.00
HT+RS 64.00 66.00 68.00 66.00 66.00 70.00 76.00 71.00
HT+BRH 73.00 70.00 71.00 71.00 70.00 71.00 84.00 75.00
HT+LR 66.00 67.00 74.00 69.00 68.00 72.00 79.00 73.00
PL+NR 59.00 76.00 68.00 67.00 61.00 67.00 66.00 65.00
PL+RS 62.00 73.00 76.00 70.00 74.00 75.00 73.00 74.00
PL+BRH 69.00 78.00 78.00 75.00 80.00 89.00 88.00 86.00
PL+LR 63.00 78.00 77.00 73.00 71.00 73.00 77.00 74.00
PH+NR 62.00 69.00 64.00 65.00 62.00 70.00 73.00 68.00
PH+RS 71.00 74.00 73.00 73.00 74.00 76.00 75.00 75.00
PH+BRH 72.00 73.00 73.00 73.00 72.00 79.00 77.00 76.00
PH+LR 70.00 71.00 70.00 73.00 69.00 77.00 76.00 74.00
64.00 70.00 71.00 68.00 72.00 73.00
First Year Second Year
LSD (0.05) Tillage + Residue 4.00 3.00
Variety 3.00 4.00 NT+NR = No-Tillage + No Residue; NT+RS = No-Tillage + Rice Straw; NT+BRH = No-Tillage+ Burnt Rice Husk;
NT+LR = No-Tillage + Legume Residue; HT+NR = Hoe Tillage + No Residue; HT+RS = Hoe Tillage + Rice Straw
HT+BRH = Hoe Tillage + Burnt Rice Husk; HT+LR = Hoe Tillage + Legume Residue; PL+NR = Ploughing + No
Residue; PL+RS = Ploughing + Rice Straw; PL+BRH = Ploughing + Burnt Rice Husk; PL+LR = Ploughing +
Legume Residue; PH+NR = Ploughing and Harrowing + No Residue; PH+RH = Ploughing and Harrowing + Rice
Straw; PH+BRH = Ploughing and Harrowing + Burnt Rice Husk; PH+LR = Ploughing and Harrowing + Legume
Residue
Rice grain yield The influence of the combination of the various tillage methods and crop residue treatment on grain yield is presented in Table 5. For the ITA 257 variety, in the 1st year NT+BRH, NT+LR and NT + RS treatments led to 1.40, 1.00 and 0.90t/ha significantly higher grains respectively than the application of NT+NR, while HT+BRH, HT + LR and HT +RS led to 1.54, 1.00 and 0.60 t/ha significantly higher grains than HT + NR. Yield increases of 0.82 and 1.40 t/ha were obtained by using PL+LR and PL+BRH compared to PL +NR, whereas, yield increases of 0.51, 0.79 and 1.04 t/ha were attained by employing PH+RS, PH+LR and PH + BRH compared to the application of PH+NR. In the second year, the application of 257, NT + RS and NT + LR increased yield by 1.50 t/ha respectively while NT+BRH brought about 1.70t/ha yield increase than NT + NR. The HT+ RS, HT+LR and HT+ BRH raised yield in the order of 0.70, 1.33 and 1.64t/ha. Compare to HT+NR, whereas the PL+RS and PL+LR treatments each increased grain yield by 1.13 t/ha,
while PL + BRH brought about grain yield increase of 1.90 t/ha than PL + NR treatment. Also, PH + RS, PH + BRH and PH + LR treatments raised yield by 0.60, 1.07 and 1.27 t/ha respectively compared to the PH + NR treatment. The yield of ex-china increased significantly by 1.20, 1.22 and 1.40 t/ha when it was treated to NT+RS, NT+LR and NT+RS compared to NT+NR, while yield increases of 0.83, 1.10 and 1.20 occurred when HT+ LR, HT+RS and HT+BRS were employed compared to HT+NL PL + LR, PL + RS and PL+BRH which led to yield increases of 0.51, 0.62 and 1.59 t/ha compared to PL + NR, while PH + BRS led to yield increase of 0.46 t/ha compared to PH+NR. There was less variation in yield when the soil was ploughed and harrowed and treated with the different residue sources, in the first year. During the second year cropping, treatment of the soil with NT+RS raised yield by 1.50 t/ha, while NT+BRH and NT + LR treatments increased grain yield by 1.80t/ha a piece. The application of HT+LR brought about
92
Effect of tillage and crop residue on ultisol

0.90 yield increase, while the HT+BRH and HT+RS treatments led to 1.210 t/ha yield increase respectively. The treatment of the soil with employing PL+RS and PL + BRH treatments led to 1.16 and 1.40 t/ha significantly higher yield increases respectively whereas PH + LR raised grain yield by 1.20 t/ha compared to RH+NR treatment. The yield increase for ex-china seemed to drop as tillage intensity increased, with the application of legume residue better than other residues, across the tillage methods. The grain yield of ITA 315 in the first year, increased by 0.69, 0.99 and 1.09 t/ha when the soil was treated with NT + LR, NT + RS and NT+ BRH compared to NT+NR, while HT + LR, HT+BRH and HT+ RS treatments increased yield by 1.10, 1.31 and 1.50 t/ha compared to HT + NR. The application of PL + LR, PL + RS and PL +
BRS led to significantly higher yield increases of 0.69, 0.92 and 1.56 t/ha than the application of PL+NR, whereas when PH + RS and PH + BRH treatments were applied to the soil, grain yield increased 3rd by 0.70 and 1.24 tons/ha compared to where PH+NR was applied. For the second year experiment, the application of NT + RS, NT+ LR and NT + BRH treatments to the soil raised grain yield of ITA 315 by 1.20, 1.70 and 1.90 t/ha than NT x NR, while yield increases of 1.20, 1.50 and 1.53 t/ha were achieved by applying HT + RS, HT+BRH and HT + LR treatments to the rice production. On the other hand, employing PL + RS, PL + BRH and PL + LR to the soil increased grain yield by 1.33, 2.07 and 2.47 t/ha than the application of PL + NR treatment, whereas applying PH + BRH and PL + RS treatments led to significantly higher yield of 0.83 and 2.22 t/ha compared to PH + NR treatment.
Table 5. Effect of tillage and crop residue on rice grain yield (t/ha)
First Year Second Year
Treatment ITA 257 Ex-China ITA 315 Mean ITA 257 Ex-China ITA 315 Mean
NT+NR 0.40 0.60 0.91 0.64 0.30 0.60 0.80 0.57
NT+RS 1.30 1.80 1.90 1.67 1.80 2.10 2.00 1.97
NT+BRH 1.80 2.00 2.00 1.90 2.00 2.40 2.70 2.34
NT+LR 1.40 1.88 1.60 1.63 1.80 2.40 2.50 2.23
HT+NR 0.40 0.80 0.90 0.70 0.30 0.80 1.00 0.70
HT+RS 1.00 1.90 2.40 1.77 1.00 2.00 2.20 1.73
HT+BRH 1.94 2.00 2.21 2.10 1.94 2.00 2.50 2.15
HT+LR 1.40 1.63 2.00 1.68 1.63 1.70 2.53 1.95
PL+NR 0.60 1.27 1.31 1.10 0.50 1.47 1.20 1.10
PL+RS 1.00 1.89 2.23 1.71 1.63 2.63 2.53 2.26
PL+BRH 2.00 2.30 2.87 2.39 2.40 2.87 3.27 2.85
PL+LR 1.42 1.78 2.00 1.73 1.63 1.83 2.67 2.04
PH+NR 0.63 1.87 1.63 1.38 0.63 1.63 1.70 1.32
PH+RS 1.14 2.20 2.33 1.89 1.23 1.67 2.00 1.63
PH+BRH 1.67 2.33 2.87 2.29 1.70 1.93 3.92 2.52
PH+LR 1.42 1.78 2.00 1.73 1.93 2.83 2.53 2.36
Mean 1.63 1.77 1.82 1.40 1.93 2.27
First Year Second
year
LSD (0.05) Tillage + Residue 0.49 0.46
Variety 0.42 0.51
NT+NR = No-Tillage + No Residue; NT+RS = No-Tillage + Rice Straw; NT+BRH = No-Tillage+ Burnt Rice Husk;
NT+LR = No-Tillage + Legume Residue; HT+NR = Hoe Tillage + No Residue; HT+RS = Hoe Tillage + Rice Straw
HT+BRH = Hoe Tillage + Burnt Rice Husk; HT+LR = Hoe Tillage + Legume Residue; PL+NR = Ploughing + No
Residue; PL+RS = Ploughing + Rice Straw; PL+BRH = Ploughing + Burnt Rice Husk; PL+LR = Ploughing +
Legume Residue; PH+NR = Ploughing and Harrowing + No Residue; PH+RH = Ploughing and Harrowing + Rice
Straw; PH+BRH = Ploughing and Harrowing + Burnt Rice Husk; PH+LR = Ploughing and Harrowing + Legume
Residue
93
Ogbodo and Nnabude NJSS/22(1)/2012

DISCUSSION
Soil temperature was significantly (p>0.05)
lowered across the four tillage methods when
the soil was covered with crop residue. Soil
temperature was also lower on the no-till soil
than on the ploughed, ploughed and harrowed
or the hoe-tilled soils. Bulk density values
were significantly (p>0.05) reduced when the
soil was treated with rice straw and legume
residue mulch than when treated with burnt
rice straw across the four tillage methods. The
soil water infiltration capacity was
significantly (p<0.05) raised by the crop
residue and tillage treatments in both years of
the study. The soils that received rice straw
and legume residue mulch had significantly
(p<0.05) higher water infiltration than the soils
treated with burnt rice husk mulch across the
four tillage methods. Soil moisture content
was significantly (p<0.05) higher when the
soil was treated with crop residue across the
four tillage treatments. Soil moisture was also
significantly (p<0.05) higher in the soil treated
with rice straw and legume residue
respectively than the soil treated with burnt
rice husk across the whole tillage methods.
The lower temperature on the residue treated
soils irrespective of the tillage treatment was
ascribed to the reduction of the impact of the
direct heat of solar radiation on the soil surface
by the residue cover. This interception of solar
radiation conserved soil moisture which in turn
also moderated soil temperature. Soils with
high moisture content normally require higher
specific heat (Lal, 1986; ). The significantly
(p<0.05) lower temperatures of the no-till plots
without crop residue treatment was as a result
of the residue cover accruing from the natural
vegetation, unlike the other tillage methods
where the vegetation were either slashed and
removed, burnt, or ploughed under during
tillage operations. These results conform to the
report of Perterson and Fenster (1982), and
Bruce et al. (1990) who reported lower
temperature with tillage methods that leave
part or the entire crop residue on the soil
surface.
The lower bulk density of the tilled soils with
crop residue treatment was ascribed to the fact
that the tillage and crop residue treatments
improved the soil structure by increasing the
soil granulation and improved the soil
porosity. The tillage and crop residue
treatments therefore repackaged the soil
leading to the lower soil density per unit
volume. This is in conformity with the
findings of Hulugalle and Palada, (1990) . The
tillage and crop residue treatments improved
the soil structure, reduced compaction and
increased porosity hence improving the soils
water intake. The tillage and crop residue
mulch increased surface roughness, which
reduced runoff and increased time for the soil
to absorb water. The increased infiltration
owing to tillage and residue also improved
water storage capacity of the soil. On the other
hand, the lower soil temperature reduced
evaporation of moisture from the soil surface,
hence increasing water conservation. It was
also possible that the absorptive nature of the
organic material increased the soil water
holding capacity. These results conform to Lal
(1986) who also reported higher infiltration
and moisture on tilled and crop residue treated
soils. The lower water infiltration rate and
water storage capacity of the burnt rice husk
treated soil was ascribed to the clogging of soil
pores by the rice husk ash, which encourage
water run-off compared to the other residue
treatments.
Tillage and crop residue mulch treatment
provided the enabling environment for
superior crop growth. The improved soil
structure and tilth made root penetration and
proliferation easier. The plants therefore had
greater access to water, air and nutrients at the
root zone leading to increased crop
productivity. Hulugalle and Palada (1990) also
reported increase moisture, aeration and
fertility on residue mulched soils, which
transformed into greater crop growth.
The combined effect of tillage and crop
residue treatment, lead to significantly higher
grain yields for the three varieties. The grain
94
Effect of tillage and crop residue on ultisol

yield of the three varieties was significantly
higher on tilled soils with residue treatments
than the untilled soils with residue treatments.
Ploughing and harrowing the soil or ploughing
the soil alone and treating with crop residue
produced significantly higher grain yield than
where the soil was not tilled or hoe-tilled and
treated with crop residue. Treating the soil
with burnt rice husk also gave significantly
higher grain yield than treating with rice straw
or legume residue across the tillage methods.
The grain yield of ITA 315 and Ex-China were
significantly higher than that of ITA 257 when
subjected to the same tillage and crop residue
treatments.
The benefit derived from improved soil
physical properties accruing from tillage and
crop residue treatments such as higher soil
moisture, lower soil temperature, reduced soil
compaction and bulk density, increase aeration
and gaseous exchange, improved mobility of
water and nutrients and improved water and
nutrient conservation as a result of reduced
run-off brought about superior grain yield in
the study. There could have been reduced soil
acidity and improved soil chemical conditions
when the soil was tilled and treated with crop
residue, which improved crop productivity.
These conditions provided improved access of
plants roots to nutrients, leading to increased
grain yield. The superior crop growth observed
on tilled and residue treated plots naturally led
to superior phtotosynthetic efficiency of the
crop. The higher tillering ability of the crops
on the tilled and residue treated plots increased
grain yield compared to the plots that were not
tilled and / or not treated with crop residue.
Generally, the significantly (p<0.05) higher
grain yield of ITA 315 and Ex-China
compared to ITA 257 was attributed to
adaptability of the crops to the study area
(Ogbodo and Nnabude, 2004). These two
varieties showed superior growth particularly
higher tillering ability which transformed into
higher grain yield.
CONCLUSION
The study revealed that the physical
constraints of the soil of the study area could
to a reasonable extent be ameliorated with
tillage and crop residue managements.
Conventional tillage with crop residue
application proved to be superior in
remediation of the soils physical problems
than the no tillage and hoe-tillage methods
either with residue treatment or not. The
combination of ploughing, or ploughing and
harrowing, and burnt rice husk application to
the soil was the best method of resolving the
soils physical constraints among the treatments
used in the study. The growth and yield of ITA
315 and Ex-china were superior to that of ITA
257 in the study. The highest grain yield in the
study was achieved with ITA 315 grown on
soil that was ploughing and harrowed, with the
application of burnt rice husk. The yield
advantage of the crops grown soils treated
with burnt rice husk across the tillage methods
was attributed to the extra benefit of the ash
that neutralized the soil acidity and made other
nutrients available for plant uptake and
productivity compared to the other residues.
REFERENCES Blake, G.R. and K.H. Hartge (1986). Bulk
density. In: Methods of Soil analysis part 1. Physical and Mineralogical Methods. A. Klute (ed) Am. Soc. Agon. Madison, 101 USA: 365 – 375.
Bruce, R. R., G. W. Langdale and A. L. #
Dillard (1990). Tillage and Crop Residue Effect on Characteristics of a Sandy Surface Soil. Soil Science society Am. J. 54 (6):1744 – 1747.
Gee, G.W. and J.W. Bauder (1986). Particles
size analysis. In: Methods of Soil analysis part 1. A. Klute (ed) Am. Soc. Agron. Madision 101 USA: 38 - 41
Hulugalle, N. R. and M. C. Palada (1990).
Effect of Seedbed preparation method and Mulch on soil physical properties and yield of cowpea in a rice fallows of an inland valley swamp. Soil and Tillage research. 1990, 17, 1-2:101 – 113.
95
Ogbodo and Nnabude NJSS/22(1)/2012

Klute, A., 1986. Water Retention: Laboratory
Methods. In: Klute, A (ed). Methods of
Soil analysis, part 1: Physical and
Mineralogical Methods, 2nd ed. ASA,
SSSA, Madison USA: 635 – 660.
Lal, R. (1986). Soil Surface Management in
the Tropics for Intensive Land Use and
High Sustained Production. Adv. Soil
Sci., 7:10 – 15
Maclean, E.O. (1982). Soil pH and lime
requirement. In: methods of soil
analysis part 2 A.L.page (ed) Am. Soc.
Agron. Madison 101 USA: 199 – 234.
Mbagwu, J. S. C. (1991). Mulching an Ultisal
in Southern Nigeria: Effects on
Physical Properties and Maize and
Cowpea Yields. J. Sci. Food Agric. 57:
517 – 526.
Nelson, D.W. and L.E. Sommers (1982). Total
Carbon, Organ Carbon and Organic
Matter: Methods of Soil analysis part
2. Chemical and Microbiological
properties.
Ogbodo, E. N. and P. A. Nnabude (2004).
Evaluation of the Performance of three
varieties of upland rice in degraded
acid soil in Abakaliki, EbonyI State.
Journal of technology and Education
in Nigeria, 9 (2): 1 – 7.
Page, A.L., R. H. Miller and D.R. Keeney,
1982. Methods of Soil Analysis II.
Amer. Soc. Agron. Madison,
Wisconsin, USA.
Perterson, D. A. and C. R. Fenster (1982). No-
till in the Great Plains. Crops and Soil
Magazine, 43: 7 – 9.
SAS Institute Inc. (2006). SAS/STAT user’s
guide: Version 6, Fourth Edition,
Vol. 2, Cary, NC., SAS Institute Inc.,
2006. 846 pp.
Tel, D. and F. Rao, 1982. Animated and semi
–anotamated methods for soil and plant
analysis pp.201-270.
96
Effect of tillage and crop residue on ultisol
SOIL FERTILITY EVALUATION OF SELECTED AQUIC HAPLUSTALFS IN
EBONYI STATE, SOUTHEAST NIGERIA
OGBODO, E. N1. and G. O. CHUKWU2
1. Department of Soil and Environmental Management, Ebony State University,
Abakiliki, Nigeria.
2. National Root Crops Research Institute, Umudike, Nigeria.
ABSTRACT
Soil fertility evaluation of selected Aquic Haplustalfs; Gleyic acrisols in Ebony State, Southeast
Nigeria, was assessed at 0-60 cm depth, as a basis for sustainable soil health management and
increased crop yields. Results showed that they are generally fine loam, extremely acidic, to
moderately acid, eutric soils with base saturation of over 60 %. However, they are low in organic
matter ( < 2 % ), total N ( < 0.15 % ) and exchangeable K ( < 2 Cmol/ kg ), but medium to
moderate in available P ( 17-39 mg/ kg ). The soils require drainage and application of organic
and mineral fertilizers to improve their productivity and boost crop yields.
Key Words: Soil Fertility, Aquic Haplustalfs, Ebony state, Nigeria.
*Corresponding author. Tel.: +234 8037465495; e-mail:[email protected]
INTRODUCTION
Soil fertility evaluation remains the most
veritable tool in assessing soil health, as a
guide to elucidating processes that could lead
to increased soil productivity. Studies have
been carried out on the soils of south eastern
Nigeria in the past (FDALR, 1985; Enwezor et
al., 1990). These were general reports for the
soils of the area. However, these soils have
undergone several transformations owing to
climatic changes, soil uses, agricultural
practices, and other factors including bush
burning. On the other hand, there is the need to
continuously assess soil quality by quantifying
the critical soil attributes. This will help to
establish ranges of value of soil quality
indicators. By this we monitor changes and
variability in soil properties. It has become
necessary to re-evaluate the soils of the study
area with specific details, for the specific soils,
with a view to evaluate the soils for specific
uses and resolving the persistent soil fertility
constraints to crop production in the
agricultural area.
The present study was carried out as site
specific, and targeted at the wetland areas in
particular. This is aimed to assist the various
agricultural change agents in the areas to
device management strategies that will guide
the farmers to improve their crop productivity.
MATERIALS AND METHODS
Location: The investigation covered wetlands
located within Latitude 7o 30/ E and Longitude
5o 40/N and 6o 45/ N. The area lies within the
southeast rainforest and derived Savanna zone
of Nigeria. The soil is characterized by shale
parent materials and of shallow depth
97
Ogbodo and Chukwu NJSS/22(1)/2012

(FDALR, 1985), with intermittent water
logging conditions. The area is characterized
by with high temperature, with mean monthly
atmospheric temperature ranging between 24o
and 28o. The rainfall pattern is bimodal with
peaks in the months of July and September.
Annual rainfall ranges between 1500 mm and
2000 mm. The rainy season begins about May
and ends around November. The dry season
starts about October and ends around April.
Design: The study was a survey exercise
covering the wetlands of Ebonyi state, out of
which 9 major locations were particularly
selected as representative of the wetlands in
the state. Six sampling sites were randomly
chosen at each location for sample collection.
Field Study: Profile pits were dug at each
sampling site, at the depth of 0-60 cm, being
mindful that the area had been reported to have
shallow depth to impervious layer (FDALR,
1985 ). Soil samples were collected at the
walls of the pits with cores, at the intervals of
0-20 cm, 20-40 cm and 40-60 cm depths. The
samples from each pit were bagged
individually, and analyzed separately. The
average values of each parameter measured at
six sites of each location assumed the data for
the location.
Laboratory Methods: The soil samples
collected from the different locations were
analyzed separately in the laboratory for the
physical and chemical properties respectively.
The soil particle size distribution was
determined by the hydrometer method (Gee
and Bouder 1989), whereas bulk density was
determined by the Core method (Blake and
Hartge, 1986). Total porosity was calculated
from the bulk density data as the fraction of
the total volume not occupied by soil,
assuming a particle density of 2.65 g/cm3.
Total nitrogen was determined by the Macro
Kjeldahl method (Bououcous, 1951).
Available P was determined using Bray II
method as outlined by Page et al. (1982).
Organic carbon was determined by the
Walkley and Black method (Nelson and
Sommers, 1982). Soil pH (2:1 in water) was
determined by the glass electrode pH meter
(Maclean, 1982). Exchangeable bases were
extracted using the ammonium acetate method
(Tel and Rao, 1982)
Data analysis: The data on soil properties
were statistically analysed using summary and
descriptive statistics, and coefficients of
variation according to SAS (2006).
RESULTS AND DISCUSSION
Soil Physical Characteristics
The bulk density and total porosity ranged
from 1.21 – 1.47g/cm3 and 44.6 – 54.0%
respectively (Table 1). The bulk density
increased with depth while the total porosity
decreased with depth. Consequently, there is
inverse relationship between the bulk density
and total porosity as one moves from 0 – 20,
20 – 40 to 40 – 60 in depth. (Table 1). The
results showed that the soil is not compacted at
the plough layer, and up to 40cm depth. Taylor
et al (1966) and Ashrad et al (1996) reported
that bulk density ranging from 1.1 – 1.4kg/m3
shows non compacted soil. The implication is
that there will be no hindrances to root
penetration, growth, and elongation to forage
the soil micro environment for nutrients and
moisture. This will also remove destruction for
roots and tubers that usually result in
deformation of tuber shapes that can reduce
eye appeal and market value. Similarly, the
total porosity showed that there is no risk of
compaction in the soils since the total porosity
from 0-60cm is >40% ). According to Harod,
(1975) when total porosity is less than 40% it
shows excess strength indicative of likely risk
of compaction and poor aeration.
98
Soil fertility evaluation in Ebonyi State

Table 1: Bulk Density and Total Porosity of Wetland Soils in Ebonyi State, Nigeria. Location
0-20
Bd
20-40
(kg/m2)
40-60
0-20
Tp
20-40
(%)
40-60
Oso
Akaeze
Amasiri
Isieke
Amachi
Nwida
Ndiagu
Alike
Omaka
Mean
CV (%)
1.17
1.14
1.24
1.26
1.34
1.25
1.10
1.25
1.16
1.21
6.00
1.25
1.33
1.61
1.30
1.38
1.25
1.27
1.26
1.29
1.32
8.00
1.48
1.54
1.56
1.54
1.43
1.43
1.47
1.47
1.32
1.47
5.00
56
57
53
52
48
53
58
53
56
54
5.00
53
50
40
51
48
52
52
51
52
49.8
7.00
44
42
41
42
46
46
45
45
50
44.6
6.00
Where Bd = bulk density, Tp = Total porosity.
Soil Texture
Table (2) shows particle size distribution, the
silt content is generally higher than sand and
clay contents at the epipedon (0-20cm) and
endopedon (40 -60cm). At Isieke, there is
evidence of argillic horizon at 20-40cm depth
(Soil Survey Staff 2008) because the clay
content was 24.4% as against 21.4% at 0-20cm
depth and 11.4% at 40-60cm depth. Generally,
the textural classes ranged from loam to clay.
At Oso, the endopedon (20-60cm) is
dominated by clay. Similarly, the epipedon at
Ndiagu is predominated by clay underlain by
clay loam soils. Apart from this few outliers,
one can describe the soils of the nine locations
as fine loamy soils (Table 2). The
predominance of silt separate indicates that
water holding capacity of the soils is high.
However, this poses a high challenge to
tillage. The textural classes indicate that the
soils are likely to be waterlogged, slippery and
heavy while they will be hard to very hard in
the dry season. Consequently, tillage
operations should be carried out when the soils
are at field capacity.
Table 2: Particle Size distribution (%) of Wetland soils of Ebonyi State, Nigeria.
Where SiL = Silty Loam, SiCL = Silty Clay Loam, CL = Clay loam
Soil Chemical Properties
The chemical properties of the soils are
presented in tables 3-5. The soil reaction,
organic matter contents, effective cation
exchange capacity and base saturation are
shown in Table 3. There is a variation in
acidity ranges of the soils. Soils of Akaeze,
Amasiri, Amachi and Omaka are extremely
Location Sand (%) Silt (%) Clay (%) Textural Class
0-20 20-40 40-60 0-20 20-40 40-60 0-20 20-40 40-60 0-20 20-40 40-60
Oso 41.2 27.2 29.2 33.4 41.4 39.4 25.4 31.4 31.4 Loam Clay CL
Akaeze 11.2 7.20 5.20 67.4 67.4 68.4 21.4 25.4 26.4 SiL SiL SiCL
Amasiri 26.5 31.2 23.2 54.1 53.4 59.4 19.4 15.4 17.4 SiL SiL SiL
Isieke 21.2 20.0 21.2 57.4 56.4 67.4 21.4 24.4 11.4 Sil Sil Sil
Amachi 11.2 9.20 9.20 53.4 55.4 55.4 35.4 35.4 35.4 Si CL Si CL Si Cl
Nwida 25.2 33.2 31.2 58.4 55.4 57.4 16.4 13.4 11.4 SiL SiL SiL
Ndiagu 22.2 25.2 21.2 30.4 43.4 41.4 44.4 35.4 27. 4 Clay CL CL
Alike 9.20 9.20 11.2 77.4 71.4 63.4 13.4 19.4 25.4 SiL SiL SiL
Omaka 23.2 35.2 45.2 59.4 41.4 27.4 17.4 23.4 27.4 SiL Loam CL
Mean 21.2 22.2 21.9 54.6 54.0 53.3 23.8 24.8 23.7
CV ( % ) 44.0 49.0 53.0 26.0 18.0 25.0 40.0 31.0 34.0
99
Ogbodo and Chukwu NJSS/22(1)/2012

acidic ≤ pH 4.50 while Oso and Isheke soils
are very strongly acidic (pH 4.5 – 5.0).
However, the soils of Ndiagu and Nwida are
strongly acidic (pH 5.5 – 5.8). The overall
result indicates that the soils are acidic. The
results confirm earlier study by Chukwu
(2007) that soils of South eastern Nigeria
derived from shale are acidic.
The organic matter contents are low
irrespective of depth across locations, except
of 0-20cm depth at Oso and Akaeze, where the
organic matter contents are medium (>2.0%),
based on organic matter ratings of the south
eastern Nigeria soils by Enwezor et al (1990).
The soils are derived from shale which is
deposited from earlier cycles of weathering
(Ojanuga et al; 1981). As a consequence it had
lost most of its secondary elements (Ca and
Mg). The area is also marked by high rainfall
(1,500 – 2,000mm) per annum and high
temperatures ( FDALR, 1985). The soil
temperature regime is isohyperthemic (>22˚c)
(Chukwu, 2007). All these favour high rate of
organic matter decomposition. The area is also
prone to annual bush burning. These account
for the low organic matter content. Abundance
of soil organic matter resulting from mulch has
been reported to have a liming effect in soils
(Chukwu, 2001). The above scenarios explain
the acidic nature of the soils and the low
organic matter contents.
Table 3. Spatial distribution of Soil pH, Organic matter, ECEC and Base Saturation in
wetland soils of Ebonyi State. Location Soil pH (H2O) Orgnic Matter (%) ECEC ( Cmol /kg) B/S ( Cmol /kg)
0-20 20-40 40-60cm 0-20 20-40 40-60cm 0-20 20-40 40-60 cm 0-20 20-40 40-60 cm
Oso 4.90 5.20 5.10 3.20 0.88 0.90 7.13 9.17 8.28 91.03 90.40 96.14
Akaeze 4.40 4.30 4.60 2.98 0.47 0.66 12.04 8.57 11.26 92.69 86.93 87.20
Amasiri 4.50 5.00 4.00 0.85 0.90 0.52 9.7 11.98 9.85 91.76 85.95 83.76
Isieke 4.80 4.70 4.50 0.85 0.47 0.28 8.59 6.27 8.18 90.67 85.97 94.13
Amachi 4.10 4.20 4.30 1.50 0.66 0.24 9.21 10.12 8.51 84.37 84.19 82.15
Nwida 4.70 5.60 5.50 1.67 0.24 0.24 10.11 7.04 5.08 81.01 87.50 88.98
Ndiagu 5.50 5.70 5.80 1.67 1.21 1.52 12.00 12.66 9.96 82.67 88.63 83.13
Alike 4.40 4.50 5.00 1.20 0.52 0.29 6.79 5.96 7.40 72.89 82.96 72.96
Omaka 4.30 4.30 4.60 0.28 0.28 0.29 12.70 12.70 13.29 86.77 86.77 62.68
Mean 4.62 4.83 4.82 1.58 0.69 0.55 9.81 9.30 9.09 85.98 86.00 83.46
CV(%) 8.00 11.0 11.0 58.0 73.0 73.0 21 24 24 7.00 12.00 18
Based on soil fertility ratings of south eastern
Nigeria (Enwezor et al, 1990), the area suffer
nutrient deficiencies particularly N and K.
Total N is low (<0.15%). Similarly,
exchangeable K is also low ( <0.2cmol/kg).
The low organic matter content and the nature
of the parent materials might have accounted
for the observations. However, at the
epipedon, available P is generally medium
based on rating for Nigerian soils (Enwezor et
al, 1990; Adepelu,2000) Fertilizer use is
common in the area. The medium available P
at the epipedon except at Amasiri, Isieke,
Alike and Omaka could be attributed to the use
of mineral fertilizer (NPK). P is less mobile
and can be observed in the land after cropping
or at harvest. However, the low available P in
some locations corroborated the work of
Chukwu (2007) in Acid soils of south eastern
Nigeria.
100
Soil fertility evaluation in Ebonyi State

Table 4: Distribution of Primary nutrients in Relation to depth in Wetland Soils of Ebonyi
State
Location Total N(%) Available P(mg/kg) Exchangeable K(cmol/kg)
0-20 20-40 40-60 0-20 20-40 40-60 0-20 20-40 40-60cm
Oso 0.14 0.06 0.04 39.3 10.5 8.80 0.20 0.07 0.12
Akaeze 0.14 0.03 0.03 30.5 5.60 7.10 0.14 0.06 0.04
Amasiri 0.04 0.07 0.03 8.90 14.7 4.50 0.03 0.04 0.03
Isieke 0.06 0.03 0.03 11.8 8.00 6.30 0.02 0.54 0.12
Amachi 0.08 0.03 0.01 19.3 5.20 4.00 0.04 0.03 0.04
Nwida 0.09 0.01 0.02 20.5 3.00 5.40 0.04 0.03 0.03
Ndiagu 0.09 0.06 0.07 25.7 18.3 15.1 0.10 0.15 0.07
Alike 0.08 0.03 0.01 17.5 6.20 4.10 0.03 0.03 0.02
Omaka 0.01 0.01 0.01 6.00 6.00 3.80 0.02 0.02 0.02
Mean 0.08 0.03 0.03 19.9 6.00 6.57 0.07 0.13 0.04
CV(%) 58.0 73.0 58.0 50.0 86.0 52.0 86.0 76.0 76.0
Table 5 shows total exchangeable bases.
Generally, exchangeable Ca is medium (3.2 –
6.0 Cmol/kg) while exchangeable Mg is
medium to high (1.0 – 4.8 Cmol/kg), (Landon,
1984). The exchangeable Na is low (<0.70
Cmo/kg). The medium to high levels of Ca
and Mg probably accounted for the eutric
nature of the soils studied because the base
saturation is above 70% in all locations. The
overall result indicates that despite the acidic
nature of the soil and the deficiency of N and
K that the soils are generally fertile (>50%
Base Saturation), (Landon, 1984). This seems
to contradict the general reports regarding the
soils of the area, as being low in fertility.
Table 5: Distribution of Total Exchangeable Bases (Ca, Mg and Na) in Wetlands of Ebonyi
State in Relation to Soil Depth.
Location Ca(cmol/kg) Mg(cmol/kg) Na(cmol/kg)
0-20 20-40 40-60 0-20 20-40 40-60 0-20 20-40 40-60cm
Oso 3.60 4.40 4.40 2.40 3.60 3.20 0.30 0.23 0.24
Akaeze 6.00 4.80 6.00 4.80 2.40 3.60 0.23 0.19 0.18
Amasiri 4.80 7.20 5.60 4.00 2.80 2.40 0.07 0.26 0.23
Isieke 4.80 2.20 4.00 2.80 1.20 3.60 0.17 0.45 0.09
Amachi 4.80 5.00 4.00 2.80 2.80 2.80 0.13 0.10 0.16
Nwida 5.60 4.00 2.40 2.40 2.00 2.00 0.15 0.13 0.10
Ndiagu 6.00 6.80 5.20 3.60 4.00 2.80 0.23 0.27 0.22
Alike 3.20 2.80 3.60 1.60 2.00 1.60 0.12 0.10 0.17
Omaka 6.00 6.00 5.20 4.80 4.80 2.80 0.20 0.20 0.31
Mean 4.98 4.80 4.49 3.24 2.80 2.76 0.18 0.21 0.19
CV(%) 20.0 24.0 24.0 33.0 23.0 23.0 36.0 34.0 36.0
CONCLUSION
The soils are prone to water-logging, acidic,
low in organic matter, cation exchange
capacity, N and K. However, the base
saturation is high. To improve the soil
productivity and enhance agricultural
transformation in the area, retaining crop
residue on the soil, application of organic and
mineral fertilizers, drainage and tillage when
the soil moisture is at field capacity are
recommended.
101
Ogbodo and Chukwu NJSS/22(1)/2012

REFERENCES
Adepetu, J.A. (2000). Interpretation of soil test
data In: Simple soil, Water and Plant
Testing Technologies for Soil Resource
Management. IITA Ibadan/FAO Rome,
pp. 89 – 97.
Ashrad, M., A. lowery, and B. Grossman
(1966). Physical test for Monitoring
Soil guality. In: J. W. Doran and A. J.
Jones (eds.) Methods for assessing Soil
guality. Soil Sci. Soc. Am. Spec. Pub.
49. SSSA, Madison, WI: 123-142.
Blake, G.R. and K.H. Hartge (1986). Bulk
density. In: Methods of Soil analysis
part 1. Physical and ineralogical
Methods. A. Klute (ed) Am. Soc.
Agon. Madison, 101 USA: 365 – 375.
Chukwu, G.O. (2001). Residual effect of rice
husk on selected soil chemical
characteristics and yield of maize.
Discov. Innov. Kenya 13 (1/2): 58 –
62.
Chukwu, G.O. (2007) Soil fertitlity capability
classification for seed yam (Dioscerea
rondate Poir) on acid soils of
southeastern Nigeria. Unpublished
Ph.D thesis submitted to Federal
University of Technology, Minna,
Nigeria, 190pp.
Enwezor, W.O, A.C. Ohiri, E.E. Opuwaribo
and E.J.Udo (1990). A review of
fertilizer use on crops in Southeastern
zone of Nigeria In: Literature Review
of Soil Fertility Investigations in
Nigeria, FMANR, Lagos, Nigeria vol.
2:49-100.
Gee, G.W. and J.W. Bauder (1986). Particles
size analysis. In: Methods of Soil
analysis part 1. A. Klute (ed) Am. Soc.
Agron. Madision 101 USA: 38 - 41
Harold, M.F (1975). Field experience on light
soils. In: Physical Conditions and Crop
Production. MAFF, Technical Bulletin
London 29: 25 – 51.
Klute, A., 1986. Water Retention: Laboratory
Methods. In: Klute, A (ed). Methods of
Soil analysis, part 1: Physical and
Mineralogical Methods, 2nd ed. ASA,
SSSA, Madison USA: 635 – 660.
Maclean, E.O. (1982). Soil pH and lime
requirement. In: methods of soil
analysis part 2 A.L.page (ed) Am. Soc.
Agron. Madison 101 USA: 199 – 234.
Nelson, D.W. and L.E. Sommers (1982). Total
Carbon, Organ Carbon and Organic
Matter: Methods of Soil analysis part
2. Chemical and Microbiological
properties.
Page, A.L., R. H. Miller and D.R. Keeney,
1982. Methods of Soil Analysis II.
Amer. Soc. Agron. Madison,
Wisconsin, USA.
SAS Institute Inc. (2006). SAS/STAT user’s
guide: Version 6, Fourth Edition,
Vol. 2, Cary, NC., SAS Institute
Inc., 2006. 846 pp.
Tel, D. and F. Rao, 1982. Automated and semi
–anotamated methods for soil and plant
analysis pp. 201-270.
102
Soil fertility evaluation in Ebonyi State

GROWTH AND YIELD OF OKRA AND TOMATO AS AFFECTED BY PIG DUNG
AND OTHER MANURES ISSUE FOR ECONOMIC CONSIDERATION
IN BENUE STATE
OLATUNJI1, O AND V.U. OBOH2 1Department of Soil Science, University of Agriculture Makurdi
2Department of Agricultural Economics, University of Agriculture, Makurdi
E-mail: [email protected]
ABSTRACT
Pot experiments were conducted to compare the effects of pig dung and other sources of manure
on the production of okra (Abelmoschus esculentum) and Tomato (Lycopersicon esculentum
mill) at University of Agriculture, Makurdi. A survey was also conducted in Makurdi metropolis
to determine the comparative availability and cost of pig dung and other manures. Three levels of
organic manures were used, 0 ton/ha, 4 tons/ha and 8 tons/ha. Record of agronomic
characteristics such as leaf area, plant height, number of leaves/plant, the fresh pod weight was
taken as relevant. Increases in growth and yield of crops were recorded in response to application
of the manures. Pig manure was more effective than goat manure in increasing growth of tomato,
and was effective than poultry manure in increasing okra growth and yield. Application of Pig
manure increased pod yield. by 52%. In the study area pig manure is cheaper and also readily
available than poultry manure. It is highly recommended for vegetable crops production.
INTRODUCTION
The development of animal enterprises
produces a large amount of waste, which
becomes potential environmental hazard.
Hence, there is a renewed interest in proper
and effective use of organic manure to
maintain soil fertility. Aside from being source
of plant nutrients, organic wastes such as those
of poultry (Agbede and Ojeniyi, 2009)
increase the population of soil micro-
organisms which have some influence in
protecting plants against pathogens like
nematodes and soil borne insects and also
provides plant growth hormones like auxins (
Sanchez and Miller, 1986). The physical
properties of soil are also improved, (Odiete et
al, 1999, Akanni and Ojeniyi, 2008).The
application of organic manure has been found
to have higher comparative economic
advantage over the use of inorganic fertilizer.
A study conducted by Nwajiuba and
Akinsanmi, (2002) in Southeastern Nigeria,
showed that returns per hectare were higher in
organic farms though outputs were slightly
less than in inorganic farms.
However studies are scanty on response of
crops to Pig Dung. In Benue State, Nigeria,
Pig dung is available in appreciable quantity.
But its use as source of crop nutrients has not
received adequate research attention. Giwa and
Ojeniyi, (2004) investigated effect of Pig
manure and its integrated application with
NPK fertilizer on soil chemical properties and
103
Olatunji and Oboh NJSS/22(1)/2012

yield of tomato at Abeokuta , south west
Nigeria.
Pig dung and its combination with NPK
fertilizer significantly increased growth and
fruit yield and soil organic matter, P. K and
Mg were increased. The manure at 5t/ha
increased yield by 39%. The studies by Ojeniyi
et al., (2007) also found that pig manure
increased soil nutrients content and grain yield
of maize. This work is a comparative study of
the effect of Pig manure and other manures on
growth and yield of tomato and okra.
MATERIALS AND METHODS.
Experiment I
Experiments were conducted at University of
Agriculture, Makurdi using a soil classified as
typic ustropept. The experimental design was a
complete randomized design with four
replications.
Twenty plastics pots (20) of 4litre capacity
containing the equivalent of 4 kg of air dried
soil were used. The treatments consisted of 0
ton/ha (control), 4 tons/ha and 8 tons/ha of Pig
dung, 4 tons/ha and 8 tons/ha of Goat Dung
respectively were mixed with soil in an
attempt to allow mineralization to take place
before the transplanting of the tomato
seedlings from the nursery bed. Tomato
seedlings grown previously in a nursery bed
selected for uniformity were transplanted at
the rate of two seedlings into each of the 20
pots and later thinned to one per pot
throughout the experiment. Wetting of plants
with water was done at a consistent rate in
order to avoid waterlogging. The experiment
was terminated after 3 months.
Experiment II Twenty plastic pots (20) of 4 litre capacity
containing the equivalent of 4 kg of air dried
soil were used. The treatment consisted of 0
ton/ha (control), 4 tons/ha and 8 tons/ha of pig
dung, 4 tons/ha and 8 tons/ha of Poultry
dropping respectively were mixed with soil in
an attempt to allow for mineralization before
the plants of Okra (Jokoso variety) were
planted at the rate of 3 seeds per pot and
thinning was done after 4 weeks of planting
to one seed per pot. Throughout the
experiment wetting of plants was done in the
same way as in Experiment I.
Plant height above the soil, the leaf area,
number of leaves of tomato at different weeks
and weight of Okra plant, number and weight
of seeds per pod were recorded.
Soil Analysis
The soil used for the study was subjected to
routine analysis using a composite sample.
The soil pH was determined both in water and
0.01M CaCl2 using the glass electrode pH
meter. The particle size analysis was
determined using the hydrometer method.
Total Nitrogen was determined using the
regular macro-kjedahl method. Available
phosphorus was determined using the method
of Bray and Kurtz-Bray I extraction.
Exchangeable cations (Ca and Mg) were
extracted using 1M NH4 OAC and determined
on atomic absorption spectrophotometer. The
K in the soil sample was determined using a
flame photometer.
Data Collected from Pig and Poultry
farmers.
Thirty randomly selected commercial pig and
poultry farmers in Makurdi metropolis were
interviewed. A simple interview schedule was
administered to ascertain the comparative cost
of Pig dung and Poultry drippings
.
Statistical Analysis
The data collected from the pot experiments
were subjected to analysis of variance
(ANOVA) to test for differences among
treatments. The, means that showed significant
difference were separated using the Fishers
Least Significant Differences (F-LSD). Simple
descriptive statistics (Frequencies and
Percentages)were used to analyze the data
from farmers interview.
RESULTS AND DISCUSSION
The soil used for the study classified as Typic
ustropept had pH (H2O) 6.8, pH (CaCl2) 6.20,
104
Effect of pig dung on okra and tomatoe

organic matter 1.45%, Total N 0.09%,
Available P 4.6 mg /kg, exchangeable K, Ca,
Mg being 0.22, 3.4 and 2.5 cmol/kg
respectively and CEC of 6.5 cmol/kg. The soil
was low in organic matter, N, P and CEC.
Therefore, it required application of organic
manures.
Table 1 shows that pig manure (PD) and goat
manure (G D) increased height of tomato at 2,
4 and 8 weeks after planting (WAT), but
increases were not significant. The manure at
4tons/ha increased plant height at 10 WAT,
whereas at 8tons/ha the manures reduced plant
height, hence plant growth.
At different weeks of observation, the manures
at 4 and 8 tons/ha increased number of tomato
leaves (Table 2) relative to the control. The
increases were significant (P= 0.05). The PG
at 4tons/ha gave higher values of number of
leaves than at 8tons/ha at 4, 6, 8 and 10 WAT
indicating that leaf growth was depressed by
8tons/ha. This was not observed in case of GD.
The PG at 4 and 8tons/ha increased leaf area at
5, 6 and 7 WAT and at 7 WAT the increases
were significant. In case of GD there were no
increases or the increases were not significant
(Table 3).
The PG at 4tons/ha was more effective in
increasing tomato height, number of leaves
and leaf area than G D at 4tons/ha. At 8tons/ha
PG had higher value of leaf area (56.5>
41.4cm2) and plant heights (26.0, 27.8cm) and
number of leaves (54.0, 57.0) were similar.
The dry matter yield of okra recorded at 27
WAT were 22.7, 34.9, 44.5, 21.8 and 26.0g for
the control, 4.0tons/ha PG, 8.0tons/ha PG,
4.0tons/ha PD and 8.0tons/ha PD respectively
(LSD 0.05= 13.5) the pod and weights were
2.3, 2.3, 3.5, 2.4 and 2.2 g (LSD 0.05=0.6)
Both manures increased Okra growth, but it
was only PG at 8.0tons/ha that increased pod
weight by 52%. In case of tomato the optimum
rate of PG was 4tons/ha and Giwa and Ojeniyi
(2004) found that PG 5tons/ha significantly
increased root growth, dry matter and fruit
yield of tomato. For maize Ojeniyi et al.,
(2007) found that 7.5tons/ha PG was optimum.
The PG was more effective than GD in
increasing growth of tomato and okra.
This could be due to quicker availability of
nutrients in P G due to its watery nature. For
example the water content for P G and P D
were found to be 72 and 35% respectively
(Brady and Weil, 1999).
Increase in growth and yield of tomato and
okra in response to application of PG is
consistent with earlier finding of Ojeniyi et al.,
2007. That the manure increased soil organic
matter, N, P and exchangeable K, Ca and Mg
is also in agreement of the finding of Giwa and
Ojeniyi (2004) that manure increased soil
organic matter, P, K and Mg.
Also Pig manure has been found to have less
C, lower C:N, more K and Mg compared to
Poultry and Goat manure by (Moyin-Jesu and
Ajao, 2008) who gave C:N ratio for the three
manures as 6.72, 6.93 and 7.93 respectively.
This indicates that pig manure decompose and
thus mineralizes fastest. The values for %K
were 14.4, 9.2 and 2.9 and Mg concentrations
were 4.8, 4.1 and 4.5%.
Ano and Ubochi (2007) also confirmed that
pig manure has less C:N ratio and higher Ca,
Mg and N compared to goat and poultry
manures . The values given for Ca were 1.37,
1.37 and 1.24%, Mg 1.30, 0.83 and 0.89%. N
0.52, 0.32 and 0.36%, OC 27.1, 28.4 and
29.6% and C:N ratio were 19.8, 20.8 and 23.9.
CONCLUSION.
The survey carried out showed that majority of
the pig farmers (73.3%) indicated that nobody
requested for pig dung from them and hence it
constituted environmental menace. Only
26.7% contacted the farmers for the product to
be given free of charge, while no one
bargained on any price with the farmers. In
contrast, only 20% of poultry farmers regarded
poultry droppings as an environmental
menace, 40% sold theirs while the remaining
105
Olatunji and Oboh NJSS/22(1)/2012
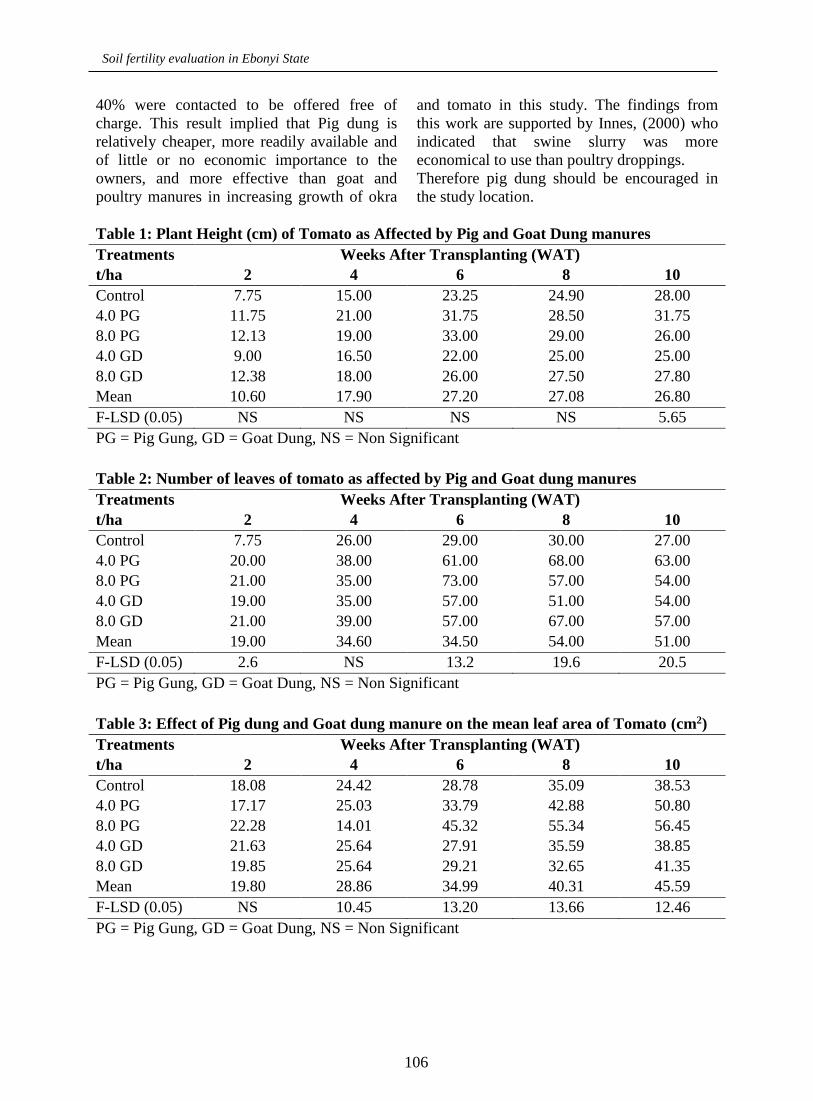
40% were contacted to be offered free of
charge. This result implied that Pig dung is
relatively cheaper, more readily available and
of little or no economic importance to the
owners, and more effective than goat and
poultry manures in increasing growth of okra
and tomato in this study. The findings from
this work are supported by Innes, (2000) who
indicated that swine slurry was more
economical to use than poultry droppings.
Therefore pig dung should be encouraged in
the study location.
Table 1: Plant Height (cm) of Tomato as Affected by Pig and Goat Dung manures
Treatments Weeks After Transplanting (WAT)
t/ha 2 4 6 8 10
Control
4.0 PG
8.0 PG
4.0 GD
8.0 GD
Mean
7.75
11.75
12.13
9.00
12.38
10.60
15.00
21.00
19.00
16.50
18.00
17.90
23.25
31.75
33.00
22.00
26.00
27.20
24.90
28.50
29.00
25.00
27.50
27.08
28.00
31.75
26.00
25.00
27.80
26.80
F-LSD (0.05) NS NS NS NS 5.65
PG = Pig Gung, GD = Goat Dung, NS = Non Significant
Table 2: Number of leaves of tomato as affected by Pig and Goat dung manures
Treatments Weeks After Transplanting (WAT)
t/ha 2 4 6 8 10
Control
4.0 PG
8.0 PG
4.0 GD
8.0 GD
Mean
7.75
20.00
21.00
19.00
21.00
19.00
26.00
38.00
35.00
35.00
39.00
34.60
29.00
61.00
73.00
57.00
57.00
34.50
30.00
68.00
57.00
51.00
67.00
54.00
27.00
63.00
54.00
54.00
57.00
51.00
F-LSD (0.05) 2.6 NS 13.2 19.6 20.5
PG = Pig Gung, GD = Goat Dung, NS = Non Significant
Table 3: Effect of Pig dung and Goat dung manure on the mean leaf area of Tomato (cm2)
Treatments Weeks After Transplanting (WAT)
t/ha 2 4 6 8 10
Control
4.0 PG
8.0 PG
4.0 GD
8.0 GD
Mean
18.08
17.17
22.28
21.63
19.85
19.80
24.42
25.03
14.01
25.64
25.64
28.86
28.78
33.79
45.32
27.91
29.21
34.99
35.09
42.88
55.34
35.59
32.65
40.31
38.53
50.80
56.45
38.85
41.35
45.59
F-LSD (0.05) NS 10.45 13.20 13.66 12.46
PG = Pig Gung, GD = Goat Dung, NS = Non Significant
106
Soil fertility evaluation in Ebonyi State

REFERENCES
Agbede, T.M. and Ojeniyi, S.O. 2009. Tillage
and poultry manure effects on soil
fertility and Sorghum yield in
Southwestern Nigeria. Soil and Tillage
Research (2009).
Akanni, D.I. and S.O. Ojeniyi. 2008. Residual
effect of goat and poultry manures on
soil properties nutrient content and
yield of amaranthus in Southwestern
Nigeria. Research Journal of
Agronomy 2(2), 44-47.
Ano, A.O. and Ubochi, C.I. 2007.
Neutralization of soil acidity by animal
manures: mechanism of reaction.
African Journal of Biotechnology 6(4),
364-368.
Brady, W.C and Weil, R.R. 1999. The nature
and properties of soil. 12th Ed.
Prentice-Hall, New Jersey. p629.
Giwa, D.D. and Ojeniyi, S.O. 2004. Effect of
integrated application of pig manure
and NPK on soil nutrient content and
yield of tomato. Proceedings 29th
Annual Conference of Soil Science
Society of Nigeria, UNAAB. p164-
169.
Innes, R. 2000. “The Economics of livestock
waste and its regulation”. American
Journal of Agric. Econs. 82:Pp 97-117.
Moyin-Jesu, F.I. and Ajao, K. 2008. Raising of
gaint snails (Arachachatina marginata
L) in urban cities using soil
amendments and feeding materials for
food security. African Journal of
Science and Technology (Science and
Engineering) 9, 117-123.
Nwajiuba, C and A. Akinsanmi. 2002.
“Organic Manure use among
smallholders in the rainforest of
southeastern Nigeria”. Online-
http//www.Tropentag.de/2002/proceedi
ngs/node188.html.
Odiete, I., Ojeniyi, S.O., Akinola, O.M and
A.A. Achor. 1999. Effect of goat dung
manure on soil chemical and yield
components of okra, amaranthus and
maize. Proceedings 25th Annual
conference of Soil Science Society of
Nigeria, Benin City p174-178.
Ojeniyi, S.O., D. Akanni and M.A. Awodun.
2007. Effect of goat manure on some
soil properties and growth yield and
nutrient status of tomato. University of
Khartoun Journal of Agricultural
Sciences 15(3), 396-406.
Ojeniyi, S.O., B.T. Faleye, Taiwo, L.B.
Akande, M.O. and Adediran, J.A.
2007. Effect of some manure on soil
plant nutrient status, growth and yield
of maize in Southwest Nigeria. The 4th
African Soil Science Society
Conference, GIMPA Accra, Ghana. 7-
8 January, 2007.
Sanchez, P.A. and Miller, R.H. 1986. Organic
matter and soil fertility management in
acid soils of the tropics. Transactions
of the XIII Congress of International
Soil Science Society (Vol. V).
107
Olatunji and Oboh NJSS/22(1)/2012

EFFECT OF NPK AND POULTRY MANURE ON COWPEA AND SOIL
NUTRIENT COMPOSITION
OLATUNJI, O1., S. A. AYUBA2, B.C. ANJEMBE3 AND S. O. OJENIYI4 1,2,3Department of Soil Science, University of Agriculture,
P.M.B. 2373, Makurdi, Benue State. 4Department of Crop Soil and Pest Management, Federal University of Technology
P.M.B 704, Akure, Ondo State. E – mail: [email protected]
ABSTRACT
Field experiment was conducted at University of Agriculture Makurdi in the Southern Guinea
Savanna ecology of Nigeria to test effect of NPK fertilizer and Poultry manure on performance
of cowpea and soil nutrient composition. The study conducted in 2008 and 2009 had a control,
NPK 20 – 10 – 10 (48 kgha-1) and poultry manure (PM) with or without NPK fertilizer. The test
soil was deficient in N and P. The PM, NPK and their combinations increased plant height,
number of branches, leaves, dry matter yield (DMY), number of peduncles, pods , seeds and seed
yield. The effect on plant height, DMY, number of pods and grain yield was significant. The 4t
ha-1 PM and 4t ha-1 PM + NPK gave highest and similar seed yield. The PM alone or with NPK
increased soil pH, N, P, K, Ca, Mg, CEC and O.M. The parameters increased with level of PM.
Addition of NPK to PM increased soil N, P, K, Ca, ECEC, OM while NPK reduced pH.
Application of PM at 4t ha-1 is recommended.
INTRODUCTION
Cowpea is a tropical food grain legume for
human and livestock. However low soil
fertility limits its yield. Although the crop
fixes nitrogen in symbiotic relationship with
rhizobium bacteria, it suffers from temporary
N deficiency during seedling growth once the
cotyledon reserve is exhausted. Hence starter
dose of N fertilizer is recommended to
enhance early growth of cowpea plant (Dart et
al.,1997). Also application of P is known to
stimulate performance and grain yield of
cowpea (Kolawole et al., 2003). Because of
problems associated with total dependence on
inorganic or organic fertilizer alone (Adeniyan
and Ojeniyi, 2003, 2005) the concept of
integrated nutrient supply i.e combined use of
inorganic and organic fertilizer is advocated to
enable sustainable crop production (Ojeniyi, et
al., 2003).
Integrated nutrient management ensures
balanced nutrient supply, control of acidity,
extended residual effect and improvement on
soil physical conditions compared with use of
inorganic fertilizer alone. Unlike its
application in maize and vegetable production
(Adeniyan and Ojeniyi, 2003, 2005; Adeoye, et
al., 2008; Ayeni, et al., 2009, 2010; Ewulo, et
al., 2009; Ojeniyi et al., 2009a, 2009b) studies
are scarce on combined application of the two
types of fertilizer in cowpea production.
In addition, because of the old impression that
cowpea can tolerate low soil fertility being a
N-fixer, attention has not been given to
108
Effect of NPK and manure on cowpea

enhancing performance of the crop using
organic manure. The need to improve yield of
cowpea in peri-urban soils of southeast Nigeria
has been met by application of inorganic
fertilizers which worsened the acidic problem
of the soil. Organic fertilizers have so far
served as a formidable alternative. Nnabude, et
al., (2006) found that compost at 4t ha-1 gave
highest cowpea grain yield, showing that
compost was beneficial to cowpea. In cowpea
production organic fertilizer has proved to be
effective in combating nematodes without the
usual side effects of nematicides. Abubakar
and Majeed (2000) obtained greater than 50%
reduction in nematode population with poultry
droppings.
This study was therefore designed to evaluate
the effect of poultry manure and its combined
use with NPK fertilizer on soil nutrients
composition, growth and yield components of
cowpea in Makurdi in the humid savanna
ecology of Nigeria.
MATERIALS AND METHODS.
Field Experiment:
The study based on NPK 20-10-10 fertilizer
and poultry manure (PM) in the 2008 and 2009
cropping seasons was conducted at the
University of Agriculture, Makurdi (70 410N,
80 350E ) in the southern Guinea Savanna agro
ecological zone of Nigeria. The soil is
classified as typical Ustropept.
The experiments were laid out in a
completely randomized block design with
three replications. The plot size was 4m x 3m.
The six treatments were as follow:
T1- No poultry manure, No NPK 20-10-10
(control)
T2- 48kg ha-1 NPK20-10-10
T3- 2t ha-1 poultry manure
T4- 2t ha-1 poultry manure with 48kgha-1 NPK
20-10-10
T5- 4t ha-1 poultry manure
T6- 4t ha-1 poultry manure with 48kgha-1 NPK
20-10-10
Sites were cleared manually using cutlass and
later ridged with hoe. Poultry manure (PM)
and the NPK 20-10-10 combined with poultry
manure were uniformly spread on the top of
the ridge and incorporated with hoe 2 weeks
before planting. Planting was done in August
for the two years at a spacing of 0.50m plant to
plant with two seedlings per stand after
thinning. Plots were weeded manually at
frequency they required. Plant data collected
included plant height, number of branches,
number of leaves, nodule production and dry
matter yield all taken at 50% to flowering. At
pod maturity, yield components including
peduncles per plant and number of pods per
plant, number of seeds per pods were taken.
Soil sampling and Analysis.
Before planting in 2008, surface (0-15cm) soil
samples were collected from 8 points and
bulked. The soil sample and the poultry
manure were analyzed. Post cropping
composite soil sample was collected per plot at
the end of the second cropping year. The soil
samples and the poultry manure sample were
air dried, crushed and allowed to pass through
2mm sieve. Particle size distribution was
carried out by the Hydrometer method, while
soil pH was measured with the glass electrode
pH meter in soil solution ratio 1: 2 in 0.01M
CaCl2. Soil organic carbon (OC) was
determined by the Walkey Black method and
the total N by the micro-Kjeldahl digestion
method (Bremner and Mulraney, 1982) after
digestion of samples with concentrated H2S04.
Availabile P was determined by Bray and
Kurtz (1995) extraction method.
Exchangeable cations were extracted using
NH4 OAC solution, K and Na were read using
flame photometer, while Ca and Mg were
determined on the atomic absorption
spectrophotometer. Effective cation exchange
capacity (ECEC) was established as the
summation of the exchangeable cations (K,
Na, Ca, and Mg).
Data Analysis
The statistical analysis was performed using
SPSS statistical package for the analysis of
variance (ANOVA). Means were separated
using fisher’s least significant difference
109
Olatunji, Ayuba, Anjembe and Ojeniyi NJSS/22(1)/2012

F.L.S.D at 5% level of probability when F
ratio was significant
RESULT AND DISCUSSION
Table 1 shows properties of the soil used for
the experiment. The soil is sandy loam and
very low in N and available P, their values
were below critical values. It is expected that
the test soil and cowpea would benefit from
added fertilizers since the N and P limit
cowpea performance.
The NPK fertilizer at 48kg ha-1, PM and their
combinations increased growth parameters of
cowpea such as plant height, number of
branches, leaves and dry matter yield (DMY)
in 2008 (Table 2) and 2009 (Table 3). The
effect on plant height and DMY was
significant. The number of nodules was
significantly reduced relative to control.
Rhodes (1981) and Ofori (1973) also observed
that nodulation in cowpea was inhibited by
application of N fertilizer. Graham and Scott
(1984) reported that N fertilizer at more than
30kg ha-1 inhibited nodulation. Eriksen and
Whitney (1984) reported that application of N
at flowering promoted vegetative dry weight
but reduced nodule dry weight. It is implied
that enhanced growth of cowpea associated
with application of NPK and PM was due to
improved and direct availability of nutrients
from the fertilizers rather than N from
nodulations. Effect of treatments on plant
height and DMY was significant. In both years
the 4t ha-1 PM + NPK increased plant height
and DMY significantly. Moreover, the growth
parameters increased between 2 and 4 tha-1
PM indicating that nutrients release from PM
had direct influence on growth of cowpea.
Also, PM should have had nematicidal effect
on cowpea (Nnabude, et al., 2006), Abubakar
and Majeed, 2000.
In 2008 and 2009, the PM, NPK and their
combinations increased number of penduncles,
pods, seeds, seed weight and seed yield per
plant. The effect on number of pods and grain
was significant in both years. In 2008, the 4t
ha-1 PM and 4t ha-1 PM + NPK increased grain
yield equally and significantly, in 2009, 2t ha-1
PM, + NPK, 4t ha-1 PM and 4t ha-1 NPK
increased grain yield significantly. They gave
similar values. In both years, 4t ha-1 PM and
4tha-1+ NPK had the highest and similar grain
yield. The yield components increased
between 2 and 4t ha-1 PM indicating that
nutrients released from PM increased cowpea
performance.
Table 6 indicates that PM alone, or with NPK
fertilizer increased soil pH, N, P, K, Ca, Mg,
CEC and OM compared to control or NPK
alone. The parameters increased with increase
in PM from 2 to 4t ha-1. Thus it is ascertained
that PM is a liming material in addition to
being a source of the nutrients. Similar
observations were made by other Workers.
(Adeniyan and Ojeniyi, 2003; Ewulo, et al.,
2008). The NPK reduced soil pH and slightly
increased N and P, thus it is acid producing
unlike the PM. It is observed that addition of
NPK to PM tended to increase soil N, P, K,
Ca, Mg, CEC and OM. This could be due to
enhanced release and mineralisation of
nutrients from native and added OM due to
synergistic effect of the NPK on OM,
(Adeniyan and Ojeniyi, 2005). Therefore
nutrients released to the soil from NPK and
PM led to enhanced growth and yield of
cowpea. Some studies reported that application
of N and P enhanced yield in Cowpea.
(Kolawole et al., 2005) and other legumes.
Also the increased OM should have had
nematicidal effect on cowpea.. This effect
should have obliterated effect of NPK on
yield.
In conclusion there was no significant effect of
addition of NPK added to PM on performance
of cowpea. Hence, application of PM at 4t ha-1
is recommended for cowpea. Relative to
control, 2t ha-1 + NPK, 4t ha-1 and 4t ha-1+
NPK increased mean grain yield (for 2008 and
2009) by 20, 24 and 27% respectively.
110
Effect of NPK and manure on cowpea

Table 1: Soil physical and chemical properties before planting.
Properties Values
pH (H20)
pH (CaCl2)
% Sand
% silt
% Clay
Textural class
Nitrogen (g 100g-1)
Phosphorus (mgkg-1
Potassium (cmolkg-1)
Calcium (cmolkg-1)
Magnesium (cmolkg-1)
Sodium (cmolkg-1)
ECEC (cmolkg-1)
Organic Carbon (g 100g-1)
Organic matter (g 100g-1)
6.20
5.90
75.60
17.20
7.20
Sand loam
0.09
4.60
0.22
3.44
2.48
0.31
6.48
1.25
1.45
Table 2: Effects of poultry manure and NPK 20-10-10 on growth parameters
of cowpea at 50% flowering stage in 2008
Treatments Plant height
(cm)
Branches/Plant
(No.)
Leaves/Plant
(No.)
Nodules/Plant
(No.)
Dry matter
(gplant-1)
Control
NPK 48 Kg/ha
2t/ha PM
2t/ha PM+NPK
4t/ha PM
4t/ha PM+NPK
Mean
F-LSD (0.05)
12.18
18.27
15.20
19.25
17.80
23.50
17.70
9.45
4.80
5.20
5.10
5.20
5.40
6.01
5.25
NS
28.50
30.20
29.00
31.50
31.40
33.40
30.67
NS
14.50
6.40
10.80
8.60
12.50
11.30
10.68
5.92
26.80
32.60
30.90
34.20
32.80
38.90
32.70
9.68
Table 3: Effects of poultry manure and NPK 20-10-10 on growth parameters
of cowpea at 50% flowering stage in 2009
Treatments Plant height
(cm)
Branches/Plant
(No.)
Leaves/Plant
(No.)
Nodules/Plant
(No.)
Dry matter
(gplant-1)
Control
NPK 48 Kg/ha
2t/ha PM
2t/ha PM+NPK
4t/ha PM
4t/ha PM+NPK
Mean
F-LSD (0.05)
13.40
23.80
20.40
26.50
23.50
38.60
24.32
15.20
6.10
8.20
8.20
9.40
9.70
9.80
8.57
NS
27.4
32.50
28.50
34.90
35.20
36.60
32.52
NS
21.80
10.30
15.50
14.80
17.50
17.20
16.18
9.25
25.50
38.50
37.50
42.80
40.20
46.70
31.50
18.75
111
Olatunji, Ayuba, Anjembe and Ojeniyi NJSS/22(1)/2012

Table 4: Effects of poultry manure and NPK 20-10-10 on growth parameters
of grain yield of cowpea at 50% flowering stage in 2008
Treatments Peduncle Plant
(No.)
Pods/Plant Seeds/Pods
(No.)
100 Seeds
(g)
Grain Yield
(tha-1)
Control
NPK 48 Kg/ha
2t/ha PM
2t/ha PM+NPK
4t/ha PM
4t/ha PM+NPK
Mean
F-LSD (0.05)
12.20
12.80
13.20
15.20
16.80
17.50
14.67
NS
17.90
19.50
19.20
22.80
20.60
24.50
20.75
5.60
8.10
9.40
9.60
11.20
11.00
11.60
8.48
NS
17.30
22.40
20.50
26.10
24.50
25.80
22.76
6.20
1.10
1.18
1.22
1.28
1.32
1.31
1.23
0.20
Table 5: Effects of poultry manure and NPK 20-10-10 on yield parameters
of grain yield of cowpea at 50% flowering stage in 2009
Treatments Peduncle Plant
(No.)
Pods/Plant Seeds/Pods
(No.)
100 Seeds
(g)
Grain Yield
(tha-1)
Control
NPK 48 Kg/ha
2t/ha PM
2t/ha PM+NPK
4t/ha PM
4t/ha PM+NPK
Mean
F-LSD (0.05)
12.60
13.10
14.20
16.50
17.20
18.20
15.30
NS
17.80
20.10
19.20
23.50
21.50
24.84
21.15
5.98
8.00
9.50
10.10
11.20
11.40
11.80
10.33
NS
16.80
23.50
22.10
27.60
26.70
28.50
24.20
NS
1.05
1.20
1.26
1.32
1.35
1.42
1.27
0.22
Table 6: Effects of poultry manure and NPK 20-10-10 fertilizer on chemical properties of
Soil after two seasons of cultivation Soil Properties Contol NPK 84
t/ha
2t/ha
PM+NPK
2t/ha PM 4t/ha PM 4t/ha
PM+NPK
pH (CaCl2)
Nitrogen (g 100g-1) (N)
Phosphorus (Mgkg-1) (P)
Potassium (cmol/kg-1) (K)
Calcium (cmol/kg-1) (Ca)
Magnesium (cmol/kg-1) (Mg)
Sodium (cmol/kg-1) (Na)
ECEC (cmol/kg-1)
Organic Carbon (g 100g-1)
Organic Matter (g 100g-1)
5.90
0.12
4.40
0.20
3.65
2.50
0.35
7.25
1.35
1.48
5.45
0.15
4.60
0.18
3.55
2.61
0.33
7.55
1.38
1.52
6.36
0.16
4.80
0.18
3.62
2.65
0.45
7.60
1.50
1.63
6.48
0.19
5.10
0.40
4.40
3.02
0.75
8.85
1.55
1.72
6.40
0.18
5.70
0.43
4.40
3.02
0.82
9.90
1.60
1.85
6.50
0.22
5.80
0.45
4.51
3.02
0.82
10.85
1.62
1.88
REFERENCES Abubakar, U and Majeed, Q. 2000. Use of
animal manure for the control of root-knot nematodes of cowpea. Journal of Agriculture and Environment 1: 23-33
Adeniyan, O.N and Ojeniyi, S.O. 2005. Effect
of poultry manure, NPK 15-15-15 and combination of their reduced levels on maize growth and soil chemical properties. Nigerian Journal of Soil Science. 15: Pp 34-41
Adeniyan, O.N and Ojeniyi, S.O. 2003. Comparative effectiveness of different levels of poultry manure with NPK fertilizer on residual soil fertility, nutrient uptake and yield of maize. Moor Journal of Agricultural Research 4(2). 191-197.
Adeoye, G.O., Adeoluwa, O.O., Oyekunle, M.
Shridhar, M.K.C., Makinde, E.A and Olowoake, A.P. 2008. Comparative evaluation of Organomineral fertilizer (OMF) and mineral fertilizer on yield and quality of maize. Nigerian Journal of soil science. 18:132-137.
112
Effect of NPK and manure on cowpea
Ayeni, L.S., Adetunji, M.T and Ojeniyi, S.O.2009. Integrated Application of NPK fertilizer Cocoa pod ash and poultry manure: Effect on maize performance plant and soil nutrient content. International Journal of Pure and Applied Sciences 2(2):34-41.
Ayeni, L.S., Omole, T., Adeleye, E.O and
Ojeniyi, S.O. 2010. Integrated application of poultry and NPK fertilizer on performance of Tomato in Derived Savanna Transition zone of Southwest Nigeria. Science and Nature 8(2):50-54.
Bray, R.H and L.T. Kurtz. 1995.
Determination of Total Organic and available forms of phosphorus in soils. Soil Science. 59:39-45.
Bremner, J.M and Mulvaney, C.S. 1982.
Nitrogen Total In: Methods of soil analysis 2nd ed. A.L. Page et al., (Eds) Pp. 595-624 ASA, SSSA Medison Winsconsin.
Dart, P.J., Day, R.A., Islam and J. Dobereiner.
1997. Some Effects of Temperature and Composition of the rooting medium in symbiotic nitrogen fixation in plants synthesis in: Tropical Grain Legume, Nutman, R.S (Ed.) Cambridge Univ. Press. Pp 361-383.
Ericksen, F.I and A. Whitney. 1984. Effects of
solar radiation requirements on growth and nitrogen fixation of soybean, cowpea and bush bean. Agron. J., 76: 529-534.
Ewulo, B.S., Babadele, O.O and Ojeniyi, S.O.
2009. Sawdust Ash and Urea Effect on soil and plant nutrient content and yield of Tomato. American-Eurasian Journal of Sustainable Agriculture 3 (1) 88-92.
Graham, A and R. Scott. 1984. Response of cowpea (Vigna unguiculata(L)walp) to nitrogen and inoculation. Trinidad Trop. Agric. 6:56-58.
Kolawole, G.O., G. Tian and B.B Singh. 2003.
Differential Response of cowpea lines to application of phosphorus fertilizer. In: challenges and opportunities of enhancing sustainable cowpea production. Fatokun, O.A., S.A. Tarawali, B.B. Singh, P.M. Karmawa and M. Tama (Eds.) International Institute for Tropical Agriculture (IITA), Ibadan pp:319-328.
Nnabude, P.C., Obi, C.O and Onuoha, E.
2006. Tillage and Kitchen wastes on peri-urban soil properties and vegetable cowpea (Vigna unguiculata(L)walp) production in Southeastern Nigeria. Nigerian Journal of Soil Science. 16:140-144
Ofori, C.S. 1973. The Importance of fertilizer
Nitrogen in Grain Legume production soils of gigantic origin in the upper region of Ghana. In : Proceedings of first IITA grain legume improvement workshop. 1973 pp: 155-161.
Ojeniyi, S.O., Owolabi, O., Akinola, O.M and
Odedina, S.A. 2009a. Field study of effect of organomineral fertilizer on maize growth yield soil and plant nutrient composition in Ilesa, southwest Nigeria. Nigerian Journal of Soil Science. 19(1):11-16.
Ojeniyi, S.O., Makinde, E.A., Odedina, S.A
and Odedina, S.N. 2009b. Effect of organic organomineral and NPK fertilizer on Nutritional Quality of Amaranthus in Lagos Nigeria. Nigerian Journal of Soil Science 19(2): 129-134.
Rhodes, E.R. 1981. The economic of
fertilizing cowpea (Vigna unguiculata(L)walp) with basic slag on an oxisol in Njala and the effect of the fertilizer on leaf lamina N, P, Zn contents and nodulation. Trop. Grain Legume Bull. 22: 6-10
113
Olatunji, Ayuba, Anjembe and Ojeniyi NJSS/22(1)/2012

SUITABILITY OF EXTRACTANTS FOR THE DETERMINATION OF AVAILABLE
SULPHUR FOR GROUNDNUT PRODUCTION IN SOME SOILS OF BENUE STATE,
NIGERIA
BEMGBA ANJEMBE1 AND M.T ADETUNJI2
1Department of Soil Science, University of Agriculture, Makurdi 2Department of Soil Science and Land Management
University of Agriculture, Abeokuta.
ABSTRACT
Occurrence of sulphur deficiency in Nigerian soils is becoming frequent and more extensive due
to intensive cultivation and shift from low analysis fertilizers to high analysis fertilizers which
do not contain sulphur. Information is still required on the parameters of evaluating sulphur
status and requirement of crops in the country. Studies were conducted in the laboratory,
greenhouse and farmers’ fields in 2004 and 2005 to evaluate four extractants (0.16 M KH2PO4,
0.10 M Ca (HPO4)2, 0.10 M LiCl and distilled water, for the determination of available sulphur
for groundnut production in some soils of Benue State. The soils include Abinsi, Adaka,
Ikpayongo, Tyowanye, Yandev, Gbatse, Tse-mker and Makurdi. Fields of 8 farmers cultivating
groundnut as sole crop were used to verify the findings of the laboratory and pot experiments.
Among the extractants, 0.10 M LiCl related significantly with pod yield and pod number. There
was also, significant relationship between the lithium chloride extractable S and the total S
values of the soils.
INTRODUCTION Sulphur as a yield limiting nutrient is
becoming increasingly important in many
Nigerian soils. Occurences of deficiency in
various crops are becoming more frequent and
extensive (Kang et al 1981, Adetunji and
Adepetu 1990, Obasi et al 2001). Information
is still required to adequately quantify the
extent and spread of the deficiency problem as
well as the parameters for evaluating the
status and requirement of crops in the country.
Sulphur occurs in soils in both organic and
inorganic forms, but only a fraction of it is
available for crop growth (Beaton et al 1968,
Metson 1979, Tabatabai 1982). Sulphate may
be present in the soil solution adsorbed on soil
surfaces or as insoluble compounds such as
gypsum (Nelson, 1982) or associated with
calcium carbonates (Roberts and Bettany,
1985). Adsorption of sulphate occurs on
positive charges that are pH dependent and
these sites are negligible above pH 6.5
(Tabatabai, 1982). The insoluble sulphate
compounds are probably not taken up directly
by the plant. On a theoretical basis then, the
solution and adsorbed forms of sulphate are
the primary pools of sulphate in the soil that
are immediately available for plant uptake.
Although there is a good theoretical basis for
the solution and adsorbed pools being present
in the soil, there are some practical limitations
to their quantification. Limitations occur in
both the extraction and subsequent chemical
114
Suitability of extractants for sulphur

quantification. Before choosing a method and
interpreting the results, these limitations
should be thoroughly understood. The choice
of the extractant will depend on analytical
equipment available and the type of soil to be
analyzed. Numerous extractants have been
used for soil sulphate (Beaton et al 1968).
Extractants may include water, acetates,
carbonates, chlorides, phosphates, citrates, and
oxalates (Beaton et al, 1968, Jones 1986,
Kilmer and Nearpass, 1960). The nature of the
anion influences the ability of the extractant to
displace adsorbed sulphate. The choice of a
method for extracting available sulphur from
soils then should be made carefully taking into
consideration the purpose of the analysis, the
soil type involved, the nature of the extractant
and the analytical method to quantify the
sulphur extracted.
This study was therefore carried out to evaluate
four extractants for the determination of
available sulphur for the production of
groundnuts in some eight selected soils
covering Abinsi, Adaka, Ikpayongo,
Tyowanye, Yandev, Gbatse, Tse-mker, and
Makurdi, in the groundnut producing areas of
Benue state.
MATERIALS AND METHODS
The experiment involved laboratory studies,
pot experiment and farmers’ fields. Surface
soil samples (0-20cm) were collected from the
eight sites corresponding to four different
parent materials in the groundnut producing
areas of Benue state that have no previous
history of S fertilization .Sub samples of the
soils were sieved to pass 2mm sieve for
laboratory analysis. The samples were
analyzed for the following parameters using
standard procedures; pH was measured by
glass electrode in a 1: 2 soil, water ratio.
Exchange acidity was determined by the
titration method (Page et al., 1982).
Exchangeable bases were extracted with
neutral ammonium acetate solution buffered at
pH 7, Na and K in the extracts were
determined using flame photometer while Ca
and Mg were determined by Atomic
Absorption Spectrophotometer (AAS) (Page
et al., 1982). Organic matter was determined
by wet acid digestion (Walkey and Black,
1934). Total Nitrogen by the Kjeldahl
digestion method, phosphorus by Bray -1
procedure (Bray and Kutz 1945). Particle size
analysis by the hydrometer method
(Bouyoucos, 1951).
Four extractants were evaluated for the
determination of available Sulphur. These
were distilled water, 0.016 M KH2PO4, 0.10
Ca(HPO4)2 and 0.10M LiCl. Each extractant
was employed for the extraction of available
sulphur in all the samples.
Water soluble sulphur or solution sulphur was
extracted in distilled water and determined
turbidimetrically as BaSO4. Surface adsorbed
sulphur was estimated as the difference
between available sulphur and water-soluble
sulphur. Total soil sulphur was determined by
digesting the Samples using wet acid digestion
(Page et al., 1982). Activated charcoal, 0.05g
per 25cm3 of the extracts and or digest was
used for decolourising the extracts and digests,
while gelatin was used as a stabilizer. Sulphur
in the extracts and digests was determined
turbimetrically as BaSO4 (Adetunji, 1989).
The crop was grown in the pots and harvested
after 12 weeks. 4 kg of the sieved soils was
weighed into experimental pots. The
treatments were 0, 10, 20 and 30 kg S ha-1 and
the pots were arranged in a randomized
complete block design. The treatments were
replicated four times. Nitrogen was added as
urea at the rate of 40 kg ha-1, P as KH2PO4 at
the rate of 30 kg ha-1. K was applied as MOP
in the 0 kg S ha-1 to make up the rate of 30kg
ha-1 (Yusuf and Idowu, 2001) as the P and S
sources (KH2PO4 and K2SO4 respectively)
were expected to have met the K requirements
in the 10kg S ha-1 to 30 kg S ha-1 treatments.
Agronomic data collected included the
following:
a. Dry matter yield at harvest (12 WAP).
b. Number of pods per plant per pot at
harvest.
c. pod weight at harvest.
115
Bamgba and Adetunji NJSS/22(1)/2012

Eight farmers’ fields cultivated with groundnut
as sole crop were selected. On each farmer’s
farm, an area of land covering 5m x 5m was
measured out. Soil samples were taken from
that measured area. Yield of groundnut from
that area was collected and weighed. The soil
samples taken from these areas were analyzed
for available sulphur using the four extractants
(above).Average plant population per plot was
52. The sulphur values were then correlated
with the yield of groundnuts.
DATA ANALYSIS
Correlation analysis was carried out. The
amount of available sulphur extracted by the
four extractants was correlated with the
groundnut yield with the aim of determining
the best extractant for the determination of
available sulphur in the soils under study. Data
were also subjected to analysis of variance and
means separated by the Duncan Multiple
Range Test.
RESULTS
Soil Properties
The properties of the soils used in the pot
experiment are shown in Table 1. The pH
values ranged from 5.29 at Abinsi to 6.82 at
Gbatse with a mean value of 5.85. The soils
are sand, loamy sand and sandy loam in
texture. Organic matter content varied widely
from 0.70% at Tyowanye to 3.21% at Abinsi
with a mean value of 1.98%. Available P
(Bray – 1) values ranged from 3.20 in Gbatse
to 12.90 at Adaka. Total nitrogen ranged from
0.025% at Ikpayongo to 0.14% at Abinsi.
Exchangeable acidity ranged from 0.20 c mol
kg-1 at Abinsi to 1.20 c mol kg-1 at Makurdi.
Table 2 shows the yield data in the pot
experiment. This indicates that in all the yield
parameters, Adaka soil performed better. This
is followed by Ikpayongo in terms of pod yield
and number. Tyowanye soil produced the
poorest yield in all the parameters studied.
Table 3 shows the yield of groundnut on the
farmers’ plots. The yield ranged from 300 k
gha-1 (0.30 t ha-1) at Tyowanye to 920 kg ha-1
(0.92 t ha-1) at Ikpayongo. Adaka has 880 kg
ha-1 (0.88 t ha-1), Abinsi 800 kg ha-1 (0.80 t ha-
1). Makurdi and Gbatse had 560 kg ha-1 (0.56 t
ha-1), Yandev had 480 kg ha-1 (0.48 t ha-1),
while Tsemker had 320 kg ha-1 (0.32 t ha-1).
116
Suitability of extractants for sulphur

Table 1: Some Properties of the Experimental Soils
% mg kg-1 K Na Ca Mg Exch. ECEC Acidity
Abinsi
Adaka
Ikpayongo
Tyowanye
Yandev
Gbatse
Tse-mker
Makurdi
5.29
6.10
5.70
5.67
5.77
6.82
5.83
5.63
10.00
12.00
10.04
6.48
4.60
6.88
6.48
11.04
3.21
3.55
1.55
0.70
1.04
1.90
1.73
2.14
0.140
0.087
0.025
0.053
0.084
0.062
0.115
0.056
11.20
12.90
3.80
7.30
9.00
3.20
4.60
6.50
SL
SL
SL
S
S
LS
S
SL
0.31
0.42
0.46
0.37
0.35
0.52
0.51
0.40
0.24
0.22
0.29
0.23
0.19
0.21
0.25
0.21
4.4
6.1
6.4
1.8
4.0
7.2
8.7
3.2
2.2
2.6
4.4
1.6
2.2
3.4
4.2
2.8
1.00
0.20
0.60
0.80
0.40
0.80
0.80
1.20
8.15
9.54
12.05
4.8
7.14
12.13
14.46
7.81
* SL Sandy Loam.S - Sand LS - Loamy Sand
117
Bamgba and Adetunji NJSS/22(1)/2012

Table 2: Yield data in the pot experiment (g pot-1)
S/No. Location Pod Yield Dry matter yield Pod number per plant
1.
2
3.
4.
5.
6.
7.
8.
Abinsi
Adaka
Ikpayongo
Tyowanye
Yandev
Gbatse
Tse-mker
Makurdi
21.40c
38.09a
23.42b
11.57h
13.26g
14.63f
15.88e
19.78d
13.87b
18.24a
9.88c
10.1c
11.65d
13.75b
11.82d
13.00c
8.27a
8.92a
8.29a
5.70b
5.84b
6.47b
6.06b
7.93a
Within each parameter, means with the same letters are not significantly different according to
DMRT.
Table 3: Yield Data On Farmers’ Field
Location Yield (kg plot-1) Yield (kg ha-1) Yield (t ha-1)
Yandev
Tyowanye
Abinsi
Ikpayongo
Makurdi
Tsemker
Adaka
Gbatse
1.20
0.75
2.00
2.30
1.40
0.60
2.20
1.40
480
300
800
920
560
320
880
560
0.48
03.0
0.80
0.92
0.56
0.32
0.88
0.56
Evaluation of Extractants for Sulphur In
The Experimental Soils
Table 4 shows that Water extracted 12 mg kg-1
of sulphur from Makurdi soil. This was the
highest amount extracted by this extractant
from the experimental soils. This was followed
by Adaka (8.0 mg kg-1). Yandev had (7.0 mg
kg-1), Ikpayongo and Gbatse 6.0 mg kg-1,
Tsemker 5 mg kg-1, Tyowanye 4 mg kg-1 while
the least amount of 3 mg kg-1 was extracted
from Abinsi soil.0.016 M KH2PO4 extractable
sulphur was highest (11 mg kg-1) in
Tyowanye. This was followed by Adaka (6 mg
kg-1), Gbatse and Tsemker soils. 4.0 mg kg-1
was extracted from Abinsi and Ikpayongo
soils. The least amount of 2 mg kg-1 was
extracted from Yandev and Makurdi
soils.O.010M Ca(HPO4)2 extracted the highest
amount of sulphur (10 mg kg-1) from Gbatse.
This was followed by 8.0 mg kg-1from Abinsi,
Adaka and Tsemker soils. 7.0 mg kg-1 was
extracted from Ikpayongo, Makurdi 6.0 mg kg-
1, Tyowanye 4.0 mg kg-1 and 2.0 mg kg-1 from
Yandev. This was the least amount of sulphur
extracted by this extractant. 0.10 M LiCl
extracted the highest amount of 18 mg kg-1
from Adaka, this was followed by 13.0 mg kg-
1 from Ikpayongo, 10.0 mg kg-1 from Abinsi,
Makurdi 8.0 mg kg-1 Yandev, Gbatse and
Tsemker 6.0 mg Kg-1 each while the least
amount of 2 mg Kg -1 was extracted from
Tyowanye.
The value of Sulphur extracted by the four
extractants from the farmers’ plots indicates
that the soils are generally low in their sulphur
status (table 5). Water extracted the highest
amount of 12 mg kg-1 from Tsemker. The
least amount of 1.0 mg kg-1 was extracted
from Abinsi.
0.016 M KH2PO4 extracted the highest amount
of 18.0 mg kg-1 from Ikpayongo, 0.10 M Ca
(HPO4) 2 extracted 14.0 mg kg-1 from Yandev,
while the least amount of 4.0 mg kg-1 was
118
Suitability of extractants for sulphur

extracted by this extractant from Abinsi.0.10
M LiCl extracted 18.0mg kg-1 from Adaka, the
least amount of 2.0 mg kg-1 was extracted
from Tyowanye.
Table 6 shows that only the LiCl extractable S
correlated positively and significantly with the
fresh weight of pods and the pod number.
Table 7; again shows that only the LiCl
extractable sulphur correlated positively and
significantly with the yield parameters studied.
Table 4: Values of Sulphur Extracted by the Extractants (Mg kg-1) In The
Experimental Soils
Extractants
Location Water 0.016M
KH2PO4
0.01M
Ca(HPO4)2
O.10M
LiCL
Abinsi
Adaka
Ikpayongo
Tyowanye
Yandev
Gbatse
Tse-mker
Makurdi
Mean
3.0
8.0
6.0
4.0
7.0
6.0
5.0
12.0
6.4
4.0
6.0
4.0
11.0
2.0
6.0
6.0
2.0
5.1
8.0
8.0
7.0
4.0
2.0
10.0
8.0
6.0
6.6
10.0
18.0
13.0
2.0
6.0
6.0
6.0
8.0
8.6
Table 5: Evaluation of Extractants for Sulphur On Farmers’ Field
Location Water 0.016M
KH2PO4
0.01M
Ca(HPO4)2
O.10M
LiCl
Yandev
Tyowanye
Abinsi
Ikpayongo
Makurdi
Tse-mker
Adaka
Gbatse
Mean
6
10
1
2
2
12
2
2
4.63
2
3
1
18
3
1
3
8
4.88
14
13
4
7
11
6
9
6
8.63
6.0
2.0
10.0
13.0
8.0
6.0
18.0
6.0
7.38
Table 6: Correlation table for the four Extractants under Evaluation and Groundnut yield
in the Pot Experiment
r-values
Parameter Distilled water KH2PO4 Ca(HPO4)2 LiCl
Pod yield
Dry matter yield
No. of pods per plant
0.277
0.273
0.266
-0.149
-0.099
-0.357
0.380
0.459
0.429
0.964**
0.648
0.886**
** Correlation is significant at 1%
*Correlation is significant at 5%
119
Bamgba and Adetunji NJSS/22(1)/2012

Table 7: Correlation table for the four Extractants under Evaluation and Groundnut yield
on farmers’ fields
r-values
Parameter Distilled water KH2PO4 Ca(HPO4)2 LiCl
Pod yield -0.777 0.500 -0.419 0.967**
** Correlation is significant at 1%
*Correlation is significant at 5%
DISCUSSION
The sulphur values of the experimental soils
indicated that Adaka soil had the highest S
status with total S value at 129.0 mg kg-1,
while Tyowanye had the least value of 48.0mg
kg-1. The amount of S extracted by the
extractants under evaluation showed that LiCl
extracted the highest amount from Adaka,
Ikpayongo and Abinsi, the extracted values by
the other extractants from these soils were
lower. The LiCl extractable S values followed
the same trend with the total S values of the
soils. Interestingly, the values of S extracted
by LiCl from the other locations were lower
compared to these three above, unlike the
other extractants that extracted significantly
higher amounts from locations other than these
three. Also, among the experimental soils,
Tyowanye had the least total S status of 48.0
mg kg-1 ,LiCl, again extracted the least
amount of 2.0 mg kg-1 from this soil. The total
S values of the soils also indicated that,
Yandev, Gbatse and Tse-mker had the same S
status; the LiCl extractable values also gave
the same results. Water extractable S values
for these soils are in a progressively
decreasing order. Yield data in terms of pod
yield showed that the highest pod yield was
obtained in Ikpayongo soil at 20 kg s ha-1.
However on the average Adaka had the
highest mean yield. Tyowanye and Yandev
gave yield values that were significantly lower
than the other soils. Dry matter yield was also
highest at Adaka (20 kg s ha-1), the least yield
at that S level was again obtained at Tyowanye
and Yandev following the same trend with the
total S status and the LiCl extractable S. The
extractable S values from the farmers’ plots
followed the same trend. Correlating the
extractable S values and yield shows that only
the LiCl extractable S correlated positively and
significantly with pod yield and number at
harvest. There was also positive and
significant relationship between LiCl
extractable S and total S content of the soils.
CONCLUSION
Since the LiCl extractable S correlated most
significantly both the total S values of the soils
as well as the yield parameters of the test crop,
LiCl can thus be referred to as the best
extractant for available S in these soils. The
LiCl extractable S can also be referred to as
the available S in these soils. REFERENCES
Adetunji M.T (1989). Effect of post sampling
treatments on the turbimetric
determination of available sulphur in
the soil. Nigeria Journal of Agronomy
4: (3): 1-7
Adetunji M.T and Adepetu J.A (1987).
Sulphur sorption characteristics of soils
in South Western Nigeria. Nigeria
Journal of Soil Science. 7: 63-65.
Beaton J.D, Burns, G.R and Platou J. 1968.
Determination of sulphur in soils and
plants material. Technical bulletin (14).
The sulphur institute, Washington D.C
pp.56.
120
Suitability of extractants for sulphur

Bouyoucos,G.H.(1975) A recalibration of the
hydrometer for testing mechanical
analysis of soils.Agricultural Journal.
43:434 –438.
Bray R.H and L.T.Kutz (1945). Determination
of total, organic and available forms of
phosphorus in soils. Soil Science. 59 :
45-59
Federal Department of Agricultural Land
Resources (1990). Soils Report 4: 70-
221
Jones M.B. (1986) Sulphur availability
indexes. In: Sulphur in Agriculture
M.A. Tabatabai ed. Agronomy 27:
American Society of Agronomy,
Madison W.I. pp 549-566.
Kang B.T. Okoro E.Acquaye D.and Osiname
O.A. (1981) Sulphur status of some
Nigerian soils from the savannah and
forest zones. Soil Science. 132(1): 220-
227.
Kilmer V.J. and Nearpass D.C. (1960) The
determination of available sulphur in
soils. Soil Science and Plant Analysis
16:289-300.
Metson A.J. (1979) Sulphur in New Zealand
soils I.A. review of sulphur in soils
with particular reference to adsorbed
sulphate sulphur. New Zealand Journal
on Agricultural Research. 22:95-114.
Nelson R.E. (1982) Carbonate and gypsum. In
A.L. page R.H Miller and D.R. Keeny
Eds. Methods of soil analysis. Part 2.
Chemical and microbiological
properties Agronomy No. 9. America
Society of Agronomy. Madison, W.I.
pp 181-197.
Obasi M.N., Isirimah N.O. and Ikpe F.N
(2001) A preliminary study on the
response of maize to sulphur
application in selected soil parent
materials in South Eastern Nigeria. In
proceedings of the 35th Annual
Conference of the Agricultural Society
of Nigeria September 16-20, 2001. Pp
155-159.
Page A.L. Ed. (1982). Methods of soil analysis
Part 2: Chemical and microbiological
properties 2nd ed. Agricultural Science
Society of America, Madison Pp 502-
537.
Roberts, T.I. and Bettany J.R. (1985). The
influence of topography on the nature
and distribution of Soil Sulphur across
a narrow environmental gradient.
Canadian Journal of Soil Sciences 65:
419-434.
Walkey, A. and Black I.A. (1934). An
examination of the degtjareff methods
for determining soil organic matter and
proposed modification of the chromic
acid organic titration method. Soil
Science. 37:29-38.
Yusuf I.A. and Idowu A.A. (2001) NPK
requirement for soybean production in
the Southern Guinea Savannah.
Tropical Oil Seeds Journal 6:50-56.
121
Bamgba and Adetunji NJSS/22(1)/2012

EVALUATION OF NUTRIENT RESTORATIVE ABILITY OF SOME SELECTED
CROP AND SOIL MANAGEMENT PRACTICES IN MAKURDI, SOUTHERN GUINEA
SAVANNA, NIGERIA
AGBER, P.I.1 AND M.E. OBI2 1Department Soil Science, College of Agronomy, University of of Agriculture Makurdi
2Department of Soil Science, University of Nigeria Nnsuka
E-mail: [email protected]
ABSTRACT Field experiments were carried out at the Teaching and Research Farm of the University of Agriculture, Makurdi Southern Guinea Savanna, during 2007 and 2008 cropping seasons to evaluate the nutrient restorative ability of some selected crop and soil management practices on soil productivity and yield of maize. The experiment was laid out in randomized complete block design (RCBD) arranged in a split-plot with four levels of crop and soil management practices including no fertilizer (control), NPK (300kg/ha), NPK (300kg/ha) + poultry manure (PM) (5 t/ha) and NPK (300 kg/ha) + Cow dung (CD) (5t/ha) and two tillage practices (no tillage and 30 cm raised seed bed) and replicated four times. The study used the percentage change in post harvest nitrogen content to develop an index of restorative ratings. Results of the study showed that the plots amended with NPK + PM gave higher seed yield of Maize (4 6t/ha) and higher left over N of 93.6 kg and 109/2 kg for 2007 and 2008 respectively. The highest P1 rating of +9.0 was also obtained from the same plot. The index developed could help farmers to predict the depletive or restorative effect of certain crop and soil management practices. Key words: Poultry manure, cow dung, maize, productivity index. All correspondence to (1)
INTRODUCTION Most soils of Nigeria are dominated by low activity clay minerals that are strongly weathered with low nutrient status (Ano, 1990). Bationo and Mokwunye (1991) also reported that the soils of the tropics are low in fertility. Tropical soils can not supply the quantities of nutrients required and yield levels decline rapidly once croping commences. Soil degradation and nutrient depletion have
become serious threats to agricultural productivity in Nigeria. In solving the infertility problem of tropical soils, traditional African farmers engaged in shifting cultivation. However, the demand for more land arising from increase in population pressure had led to a decrease in or complete disappearance of fallow periods. Continuous cultivation leads to reductions in organic matter and soil productivity. Other efforts
122
Crop and soil management practices in Makurdi

developed to restore and improve the productivity of these soils include crop rotations, intercropping, fertilization and organic manuring, mulching and agro forestry (Adekunle et al., 2004). The need for improved management practices, especially through the use of external inputs from organic and inorganic sources on these soils has been stressed (Busari et al., 2004). Complimentary use of organic and mineral fertilizer has proved a sound soil fertility management strategy in many countries of the world (Busari et al., 2004, Adeniyan and Ojeniyi 2005). The practice has a greater beneficial residual effect than can be derived from the use of either inorganic fertilizer or organic manure when applied alone (Makinde et al., 2001, Adekunle et al., 2004). Cultivation practices play a major role in nutrients and water sustainability. They are needed to increase agronomic stability and productivity while enhancing the environment (Hatfield et al., 1999). Therefore, complementary use of organic and inorganic fertlizer combines with appropriate cultivation practice becomes inevitable in fertility restoration in the tropical soils. This work was; therefore, designed to evaluate the efficacy of different crop and soil management practices on soil fertility restoration and growth and yield of maize.
MATERIALS AND METHODS Experiment was carried out during the 2007 and 2008 cropping seasons at the Teaching and Research farm of University of Agriculture Makurdi; in the southern Guinea savanna zone of Nigeria. A total land area of 23 m x 43.5 m (1000.5 m2) was used. The experimental design was a split – plot in a randomized complete block design with two tillage techniques and four management practices replicated four times. The tillage techniques served as the main plots while the management practices (soil amendments) as the sub plots treatment. The treatment, factors and rates are as follows:
Tillage techniques - Tno = No tillage - T30 = 30 cm till – raised seed bed The crop management practices - Mno = Maize + no soil amendments - Mnpk = Maize + NPK fertilizer (300 kg/ha) - Mnpk + PM = Maize + NPK fertilizer (300 kg/ha) + poultry manure (5t/ha) - Mnpk + CD = Maize + NKP fertilizer (300 kg/ha) + cow dung (5t/ha) The animal waste: cow dung and poultry manure were evenly spread on appropriate plots and worked into the soil during tillage. The amendments were allowed to decompose 14 days before planting the test crop (maize). The initial chemical properties of the soil were determined from bulked composite samples before planting. At harvest, soil samples were taken from each plot at 0 – 15cm depth, air dried and passed through 3mm sieve. Thereafter, the following soil chemical properties were determined. The soil pH was determined in water and 0.1N KCl using the method described by MacLean (1982). Organic carbon by Walkley and Black (1934), total N by the macro – Kjeidahl digestion (Bremmer, 1965), available P by Bray and Kurtz no. 1 method (1945). The cations were extracted using ammonium acetate and K was evaluated using flame photometer, and Ca and Mg by atomic absorption spectrophotometer (Juo, 1979). Soil productivity index calculation was formulated in terms of percentage changes in N content (Cook, 1962). The percentage change in N was used to determine the index of productivity for forecasting the effect of each management practice on soil productivity. Plant height, stem growth and leaf area index were taken at 9 WAP. Maize grain yield was determined at harvest. Data on soil N, growth parameters and seed yield were analyzed using correlation, regression and analysis of variance (F – test) to determine treatment effect. Means
123
Agber and Obi NJSS/22(1)/2012

were separated using the LSD technique at 5% level.
RESULTS AND DISCUSSION Soil properties of the site and chemical analysis of poultry manure and cow dung
used for the experiment The soil used for the experiment was low in organic matter. N, P and K and cation exchange capacity (table 1). Thus, the soil used was typical of upland soils in the tropics particularly Alfisols (Sanchez and Logan 1992). The low organic matter obtained may be partly due the effect of high temperature and relative humidity which facilitate rapid mineralization of organic matter. The soil has very low CEC reflecting intensely weathered status. The low CEC, low organic matter, and low total N are indicators of low inherent fertility status, which underscore the need for improved soil management techniques. The N and available P of the poultry manure were higher than that of the cow dung (Table 1). Cow dung however, contained higher K, Ca and Mg. If adequately applied, poultry manure contains reasonable amount of N that will raise the productivity of the soil and increase the yield of maize. Effect of crop and soil management
practices on growth and yield of maize The main effect of crop and soil management practices on mean leaf area index (LAI), stem growth, plant height and seed yield for 2007 and 2008 is presented in Table 2. Result of the
study show that fertilizer application significantly (P < 0.001) increased LA1, stem growth, plant height and seed yield. Cumulative results show that maize plots amended with NPK + PM had 81%, 53%, 83% and 232% increases in LA1, stem growth, plant height and seed yield respectively. This may be as a result of the combined beneficial effects of poultry manure and NKP fertilizer which make available nutrients especially nitrogen and organic matter for enhanced crop growth and higher grain yield. Higher grain yield resulting from the application of manurial treatments has been reported from other studies (Ojeniyi 2000, Ojeniyi and Adejobi 2002, Adeniyan and Ojeniyi 2005)/ Similarly, results of the study also show significant (P < 001) effects of tillage practices on LA1, stem growth, plant height and seed yield (Table 2). The tilled plots had 32%, 19%, 23% and 67% increases in LA1, stem growth, plant height and seed yield respectively relative to the no till plots. The improvement in soil physical properties following application of NKP + PM could have enhanced root proliferation, shoot growth and eventual seed yield. Upawansa (1997) earlier reported improvement in soil fertility exceeding expectations in an integrated system, probably because of combined effect of soil conservation, nutrient enrichment, enhancement of biological activities and improvement in moisture retention capacity.
Table 1: Chemical analysis of Poultry Manure and Cow dung used for the Experiment
Parameters Soil PM CD
Nitrogen (g kg-1) Organic matter (g kg-1) Phosphorus (g kg-1) Potassium (g kg-1) Calcium (g kg-1) Magnesium (g kg-1) CEC (g kg-1)
0.20 0.50 6.20 6.22 2.50 2.50 7.50
4.48 -
1.98 1.53 7.63 0.39
-
3.12 -
0.35 13.99 8.6 5.63
-
PM = Poultry manure CD = Cow dung
124
Crop and soil management practices in Makurdi

Table 2: Mean effect of crop and soil management practices on maize growth parameters
and seed yield
Treatment
Fertilizer
LA1 Plant Height
(cm)
Stem growth
(cm)
Seed yield
(t/ha)
Control
NPK
NPK + CD
NPK + PM
LSD
Tillage Practices
Tno
T30
LSD
0.09
0.11
0.23
0.19
0.01
0.14
0.17
0.01
26.1
26.5
49.9
96.5
9.75
43.2
56.2
6.80
5.0
5.4
6.3
7.4
0.47
5.7
6.3
0.33
1.27
2.98
3.57
4.22
0.39
2.41
3.80
0.28
Quantifying the effect of crop and soil
management practices on soil productivity The pre-cropping N, added N and post harvest
N contents from the experiment are presented
in Table 3. Results of the findings showed that
the initial (pre-cropping) N for all the plots
was 936 kg/ha. Prior to planting in each
season, plots amended with NPK, NPK + CD
and NPK + PM received 45 kg/ha, 60.6 kg/ha
and 67.4 kg N/ha respectively. The highest
value of post harvest soil N content was found
in plots amended with NPK + PM while the
lowest post harvest N value was found in
unamended plots.
Results of annual “left over N” for each crop
and soil management practices for 2007 and
2008 cropping seasons are presented in Table
4. The results show that the lowest “left over
N” was found in unamended plots while the
highest “left over N” was found in the plots
amended with NPK + P in the two cropping
seasons. Unamended plots had annual loss of
62.4 kg N/ha and 46.8 kg N/ha in 2007 and
2008 respectively. The maize plots amended
with NPK alone had identical loss of 31.2 kg
N/ha in both 2007 and 2008. The “left over N”
however, increase from the plots amended
with NPK + CD and NPK + PM. The increase
in “left over N” for NPK + CD plots was 31.2
kg N/ha and 46 kg N/ha for 2007 and 2008
respectively. Similarly, the increase in “left
over N” for plots amended with NPK + P were
93.6 kg N/ha and 109.2 kg N/ha for 2007 and
2008 respectively. A significant relationship
between soil post harvest N content and seed
yield was observed (table 5). This showed that
the soil amendments applied could deplete or
restore the fertility of the soil differently.
Table 3: Pre-cropping N, added N and post harvest soil N content (kg/ha) for crop and soil
management practices during the 2007 and 2008 planting seasons
Crop management
Practices
Pre-cropping
N + added N
Post harvest
N + added N
Post
Harvest N
Control (unamended)
NPK
NPK + CD
NPK + PM
LSD
936 + 0
936 + 45
936 + 60.6
936 + 67.4
873.6 + 0
904.8 + 45
967.2 + 60.6
1029.6 + 67.4
0.1847
826.8
873.6
1014
1138.8
0.0462
NB: The top soil (0 – 10 cm) of the study area has a weight of 1.56 x 10⁶ kg/ha thickness of 10
cm and bulk density of 1.56 g/cm3. Therefore:
124
Agber and Obi NJSS/22(1)/2012

N kg/ha = N (%) x 1,560,000
100 1
Table 4: Mean annual “left over N” (kg/ha) for crop and soil management practices
Crop management
Practices
(N kg/ha)
2007 2008
Control (unamended)
NPK
NPK + CD
NPK + PM
- 62.4
- 31.2
+ 31.2
+ 93.6
- 46.8
- 31.2
+ 46.8
+ 109.2
NB: (1) pre-cropping N – post harvest N 2007 = left over N 2007
(2) post havest N 2007 – post harvest N 2008 = left over N 2008
Table 5: Relationship between seed yield (y) and post harvest soil nitrogen (N) content (X)
Dependent
Parameter
Year Regression
Model
Coefficient of
Determination
Maize
Seed
Yield
2007
2008
Y = -12.81 + 0.824(x)
Y = -7.230 + 0.892(x)
0.84**
0.90**
Table 6: Percent change in post harvest N and seed yield of maize under different
management practices
Crop management
Practices
Percentage change in N Percentage change
in seed yield 2007 2008
Control
(Unamended)
NPK
NPK + CD
NPK + PM
- 7.1
- 3.4
+ 3.2
+ 9.1
- 5.7
- 3.6
+ 4.6
+ 9.6
- 13.3
- 5.3
+ 8.1
+ 13
Soil productivity index (P1) for estimating
safe or unsafe cropping systems The percentages changes in N content in
relation to the changes in crop seed yield under
the different crop and soil management
practices presented in Table 6 were used to
develop an index of productivity rating (P1) to
be used by farmers to calculate safe or unsafe
cropping systems. The ascribed productivity
index ratings are presented in Table 7. The
productivity indexes were derived directly as
the mean of percentage change in nitrogen
between 2007 and 2008 cropping seasons.
Results of the study as presented in Table 7
show that the plots amended with NPK + PM
had the highest rating (+9.0). This was closely
followed by plots amended with NPK + CD
with the rating of + 4.0. The unamended plots
had the lowest rating of + 6.0. The results
obtained show that the crop and soil
management practice with P1 of +9.0 is better
than all the other practices with lower P1
values. This P1 can help farmers to compare
the productivity of soils of different sites. It
will also help farmers to predict the depletive
or restorative effect of certain crop and soil
management practices.
125
Crop and soil management practices in Makurdi

Table 7: Soil productivity ratings for four management practices
Management practice Productivity index (P1)
Control (unamended)
NPK
NPK + CD
NPK + PM
- 6.0
- 4.0
+ 4.0
+ 9.0
NB: Ascribed productivity index (P1) was
derived directly from the percent N change in
each year for each management practice and is
defined as average annual percent change in
soil post harvest nitrogen content.
Calculation of safe or unsafe cropping
system In Table 8, a hypothetical four year cropping
programme was used to illustrate the use of
this productivity index (P1) for selected crop
and soil management practices. This
illustration would determine whether
productivity would increase or decrease in the
different cropping systems adopted (Table 8).
The soil producivity ratings derived from the
percent change in nitrogen in each year for
each management practice were used in
calculating whether the cropping systems were
safe or unsafe. An assumed four hectares of
farm land was used. In the four hectares, each
hectare had different management practices for
four years. The total productivity index (P1) at
the end of each year was calculated (Table 9).
Table 8: Hypothetical four year cropping programme using different crop and soil
management practices
Plot/Year 1 2 3 4
1 Maize
+
NPK
Maize
+
NPK + CD
Maize
+
NPK + PM
Maize
+
NA
2 Maize
+
NPK + PM
Maize
+
NPK
Maize
+
NPK
Maize
+
Na
3 Maize
+
NPK + CD
Maize
+
NPK + PM
Maize
+
NA
Maize
+
NPK
4 Maize
+
NPK + PM
Maize
+
NPK + CD
Maize
+
NPK
Maize
+
NPK
NA = No amendment
CD = Cow dung
PD = Poultry droppings
Table 9: Calculated productivity index for the crop and soil management practices
Plot/Year 1 2 3 4
1
2
3
4
- 4
+ 9
+ 4
+ 9
+ 4
- 4
+ 9
+ 4
+ 4
- 4
+ 9
+ 4
- 6
- 6
- 4
- 4
126
Agber and Obi NJSS/22(1)/2012

CONCLUSION The study revealed that the crop and soil
management practices adopted were efficient
in soil productivity improvement. This P1 can
help farmers to compare the productivity of
soils of diffeent sites. It will also help farmers
to predict the depletive or restorative effect of
certain crop and soil management practices.
REFERENCES Adekunle I.O., O.E. Akinrinade and J.O.
Azeez (2004). Influence of the
combined application of cattle manure
and NPK fertilizer on soil chemical
properties, growth and yield of okro in
an conference of the Soil Science
Society of Nigeria held at the
University of Agriculture, Abeokuta
Nigeria between December 6-10, 2004.
Adeniyan, O.N. and S.O. Ojeniyi (2005).
Effect of poultry manure, NPK
15:15:15 and combination of their
reduced levels on maize growth and
soil chemical properties. Nig. J. Soil
Sci. 15: 34-41.
Ano, A.O. (1990). Potassium fixation,
speciation, distribution and exchange
thermodynamics in soils of eastern
Nigeria. Ph.D thesis, University of
Ibadan, Nigeria.
Bationo, A. and Mokwunye, A.U. (1991). Role
of crop manure and crop residue in
alleviating soil fertility constraints to
crop production with special reference
to saharian and Sudanian zones of
West Africa. Fertilizer Research, 29:
17-175
Bray, R.H. and L.T. Kurtz (1945).
Determination of total organic and
available form of P in soil, Soil Sci. 59:
39-45.
Bremmer, J.M. (1965). Nitrogen availability
indexes. In C.A. Black (ed). Methods
of soil analysis part 2. Agronomy
madison Wisconsin
Busaic, M.A., I.O. Adekunle and J.O. Azeez
2004. Effect of poultry manure and
phosphorus application on the
productivity and fodder quality of two
centrosenia species in an Alfisol.
Proceeding of the 29th Annual
Conference of the Soil Science Society
of Nigeria December 6-10, 2004 at the
University of Agriculture Abeokuta,
Nigeria.
Cook, R.L. (1962). Fitting Crops to Soils. Soil
Management for Conservation and
Production. Macmillan Publishers.
Hatfield, J.I., R.R. Allmaras, G.W. Relm and
B. Lowrey (1999). Ridge tillage for
corn and soybean production.
Environmental Quality impacts. Soil
and Tillage Research 48: 145-154.
Juo, A.S.R. (1979). Selected methods of soil
and plant Analysis. IITA manual
series. No. 1. Ibadan Nigeria.
Mclean, E.O. (1982). Soil pH and Lime
requirements in page A.L. (ed).
Methods of soil analysis. Part 2.
Chemical and Microbiological
properties second ed. Agronomy series
No. 9 ASA Madison, W.J., USA.
Odofin, A.J. (2005). Effects of No-tillage with
much on soil hydrology Minna area of
Nigerias Southern Guinea savanna.
Nigerian Journal of Soil Science 15(2):
9-15.
127
Crop and soil management practices in Makurdi
Ojeniyi, S.O. and K.B. Adejobi (2002). Effect
of ash and goat dung manure on
nutrient composition, growth and yield
of Amaranthus. Nig. Agricultural
Journal 33: 46-57.
Ojeniyi, S.O. (2000). Effects of goat manure
on soil nutrients content and okra yield
in rainforest area of Nigeria. Applied
Tropical Agriculture 50: 20-23.
Sanches. P.A. and Logan, T.J. (1992). Myths
and science about the chemistry and
fertility of soil in the tropics. Soil Sci.
Soc. of American and American
Society of Agronomy. 667 Segde Rd.
Madison. Wis 53711, USA. SSA.
Special publication, No. 29 pp 35-45.
Upawansa, G.K. (1997). New kekulan rice
cultivation: a practical and scientific
ecological approach. Rebuilding lost
soil fertility. LEISA. ILEIA Newsletter
13 No. Leusden, Netherlands pp.
Walkley, A. and Black (1934). An
examination of the degtiareff method
for determining soil organic matter and
a proposed modification of the chronic
Acid Titration method. Soil Sci. 37:
29-38.
128
Agber and Obi NJSS/22(1)/2012

SHEAR STRENGTH AND COMPACTION CHARACTERISTICS OF
TERMITE MOUND SOIL (TMS)
MANUWA, S.I. AND OLAWOLU, O.E Department of Agricultural Engineering, The Federal University of Technology,
PMB 704, Akure, Nigeria
E-mail: [email protected]
ABSTRACT Termite mounds are common features of agricultural landscape of the tropical regions of the
world, however published scientific research on TMS in relation to surrounding soil and possible
potential of TMS in agricultural production are scarce. The purpose of this study was to
investigate effect of moisture content on compaction and shear strength of TMS with a view to
comparing it with the surrounding. Standard laboratory methods were used to evaluate physical,
chemical and strength properties of sampled termite mound soils and their surrounding soils.
Results showed that the texture of a TMS varied from top to bottom of the mound and from that
of the surrounding soil (R). There was less organic matter, organic carbon, and nitrogen in the
TMS than in the R, however, there was higher phosphorus, calcium, potassium, magnesium and
sodium. Similarly, consistency (Atterberg) limits of TMS were significantly higher than those of
surrounding soils at 5% level of significance. Mean shear strength (cohesion) of TMS was higher
than that of the R. The shear strength ranged between 63.11 and 120.11 kPa for experimental
TMS while for the R it was between 40.52 and 72.46 kPa. The maximum shear strength of
compacted (15 blows) TMS was 195 kPa at 12% (db) moisture content. The results of this study
will be useful in characterizing TMS in relation to surrounding soil and also for assessing
potential uses of TMS in agricultural production.
Keywords: termite mound soil, surrounding soil, properties, compaction, shear strength.
INTRODUCTION Termites have been identified as common
biological agents that produce significant
physical and chemical modifications to
tropical and subtropical soils (Semhi et al.,
2008).
It has been reported that termites go through a
sequence of actions, from fetching, carrying,
to cementing mineral particles into mounds by
using their salivery secretion (Lopez-
Hernandez et al., 2001). Also, it has been
shown that termite activity increases the
content of organic matter in the soils that they
use for the construction of their nests and also
modifies the clay mineral composition of these
soil materials (Jouquet et al., 2002; Roose
Amsaleg et al., 2004).
Studies emphasized the role of termine on soil
texture and chemical properties (Wood et al.,
128
Characteristics of termite mound soil

1983), soil nutrient cycling and soil
metabolism (Menaut et al., 1985; Abbadie and
Lepage, 1989). But the strength properties of
termite mound soil are scarce in literature.
It was reported (Rupela et al., 2006) that
African, farmers collect termite-mound soil
and apply to cropped fields (Watson 1977) as
it can be rich in available nitrogen (by about
20%), total P (by 2.25 times) and organic
carbon (by 9.3%) than adjacent soil (Lopez-
Hernandez, 2001).
In the Southern Province of Zambia soils with
low water retention capacity are common, so
when termite mound soil is spread on these
soils it results in higher soil moisture content
and improved crop growth (Siame, 2005).
Literature also shows that termite mound soils
have high levels of calcium, phosphorus and
organic matter, which contribute to better crop
development, especially on the poor soils in
the area. Plants were also reported to take up
nutrients very easily from termite mound soil
and that TMS is proving a viable option to
local farmers (Fageria and Baligar, 2004).
Soil from Macrotermes (termite) spp mounds
has lower soil organic matter (SOM) content
that adjacent soil (Garnier-Sillam et al., 1988).
However, the study reported by Jouquet et al
(2003), Abbadie and Lepage (1989) showed
that structures built by subterranean fungus-
growing termite Ancistrotermes contained
greater amount of SOM than adjacent soil.
Therefore the objectives of this study were to
(i) determine the relative physical and
chemical properties and shear strength of TMS
and surrounding soil; and (ii) determining the
influence of moisture content on the shear
strength at different levels of compaction.
MATERIALS AND METHODS
Study Site The study was carried out within the campus
of The Federal University of Technology,
Akure, Nigeria (70 151N, 50 151E). The mean
annual precipitations in the area ranged from
130 to 150 mm with average relative humidity
(80%). The climate consists a long wet season
from mid March to July, short dry season
(August break) July to August, short wet
season September to November and long dry
season from November to Mid March. The
vegetation is tropical rain forest.
Soil description and sampling Soil samples were collected from three
different termite mounds and surrounding soil
(3.0 m away from each mound). Soil sample
taken from the surrounding soil served as the
control within the study area. Two samples
were taken from each mound, at the top (T),
the base (B) and the third sample from the
surrounding soil (R). The three termite
mounds were termed A, B and C. Soil sample
was represented by S, so that SAB represents
soil sample of termite mound A, bottom
position and so on. The termite mounds had
varying height of A (2.0 m), B (1.1 m) and C
(1.2 m). The corresponding diameters of the
three termite mounds were 4.5, 6.0, and 8.5 m,
respectively. Samples were collected in May
2008 when the TMS were considered
workable (not too hard) before the onset of
heavy rains in the following months.
The textural analyses were determined by
standard methods similar to that reported
(Awadzi et al., 2004). The soil samples were
air dried and passed through a 2-mm sieve,
and the content of gravel (<2 mm) by weight
was determined. Particle size distribution was
determined by sieving sand fractions and by
using the hydrometer method for determining
the silt and clay fraction. Soil pH was
determined potentiometrically in 0.01 M CaCl2
at a soil-solution ratio of 1:2.5. Exchangeable
cations were extracted with 1M NH4Oac at pH
7. Calcium (Ca) and magnesium (Mg) were
determined by atomic absorption
spectrophotometry while potassium (K) was
determined by flame photometry.
129
Manuwa and Olawolu NJSS/22(1)/2012

Exchangeable acidity (H+ and Al3+) was
extracted with 1 M KCl and determined by
titration with NaOH. Total carbon content was
determined by dry combustion using an Eltra
CS500-apparatus. Total nitrogen (N) was
determined by the Kjeldahl method. Total
phsphorus (P) was determined
spectrophotometrically by the molybdenum
blue method using ascorbic acid as a reductant
after the soil samples were heated to 550oC
and extracted with 6 M sulphuric acid
In situ shear strength determination In situ shear strength was determined for all
the samples in August 2008. The timing was
not particularly significant apart from being
drier period, but as a matter of convenience.
The shear strength of soil samples were
measured with a shear vane tester (16mm
diameter vane) at depth 40, 80 and 120 mm on
each sample and the average strength was
calculated. The corresponding moisture
contents of the samples were also determined
with a moisture meter.
Laboratory determination of shear strength
of compacted soil Laboratory tests were conducted on all the
experimental soil samples after they were
sieved through 2 mm size sieve to determine
the shear strength using the shear vane tester.
The soil samples were subjected to 5, 10 and
15 blows respectively with a standard proctor
rammer (2.5 kg) at different moisture content
level in a cylindrical metal mould. The mould
was 100 mm in diameter and 120 mm height.
A round wooden pad was placed on the soil
before compaction in order to ensure unidorm
compaction of the soil in the mould. The shear
vane was graduated in kilopascal (kPa).
Measurements were taken at depth 40 and 80
mm respectively on each sample and the mean
value of each set of two-depth reading was
calculated and recorded.
RESULTS AND DISCUSSION
Textural classification The textural analysis showed that TMS could
have more clay fractions than the surrounding
soil (R) and that the texture could vary from
top to bottom of the mound as shown in
mounds A and C (Table 1).
It was also observed that the surrounding soil
might have a textural class that is different
from that of the mound. The percentage clay
plus silt is significantly higher in TMS than the
R.
Physical, chemical and organic properties Table 2 shows the termite mound soils are
acidic soils but less acidic (greater pH values)
than surrounding soils without termite
mounds, though for mound C, the soil seems
to be more acidic (lesser pH values). The
organic matter content of the TMS was lesser
than that of the surrounding soil. This agrees
well with Garniier-sillam et al, 1988) but
contrary to some reports (Jouquet et al., 2003;
Abbadie and Lepage, 1989).
Consistency limits Termite mound soil has higher consistency
limits values than the surrounding soil (Table
3) and therefore higher plasticity indix than the
R, which indicate that they have high clay
fractions. There is also some localized
variation in consistency limits within each
mound. The liquid limit and plastic limit of
mound B (Table 3) is the highest among the
three mounds.
Insitu shear strength The shear strength of the termite mound soil
increased with soil depth in the field and inside
the mound. The base of the mounds recorded
highest shear strength compared to the top
portion of the mounds. The shear strength of
the surrounding soil was found to be lower
than that of the mounds. The mounds shear
strength increased with reduction in moisture
130
Characteristics of termite mound soil

content but decreased as the water content
increased (this is expected) like during raining
season and it might even lead to mound
collapse during excess rainfall as a result of
high water content. Mound A, had part of it
collapsed due to heavy amount of rainfall.
Mound B had the highest mean shear strength
of 94.56 kPa, sample B Top position (SBT)
and 120.11 kPa, Sample B Base position
(SBB); this is probably due to high silt plus
clay content in it. Also Sample B Surrounding
soil (SBR) had 72.46 kPa. Mound A has the
least shear strength of a total mean value of
74.03 kPa at Sample A Top position (SAT)
and 63.13 Kpa at Sample A Base position
(SAB). This is due to presence of sandy soil
mixed with clay soil.
Shear strength of compacted termite mound
soils Generally, the shear strength of TMS
increased with the number of Proctor’s
hammer blows and reached a maximum at
about 15 blows in the moisture content range
of about 11 to 13% (db). It was observed that
about 90% of the maximum shear strength was
achieved at 10 blows.
Termite mound soil has greater shear strength
than corresponding adjacent soil (and therefore
is less susceptible to compaction) for all the
sampled mounds and the strength of the
mound also varied within the mound. This is
probably due to the variation of textural
fractions within the mounds.
CONCLUSION The following conclusions can be drawn from
this study;
The texture of a TMS varied from top to
bottom of the mound and with the surrounding
soil (R). There was less organic matter,
organic carbon and nitrogen in the TMS than
in the R, however, there were higher
phosphorus, calcium, potassium, magnesium
and sodium and consistency limits. Termite
mound soil has greater shear strength than
corresponding adjacent soil for all the sampled
mounds and the shear strength of TMS also
varied within the mound.
Table 1: Textures of Termite mound and adjacent soils
Soil type % Sand % Silt % Clay % (Silt + Clay) Texture
SAT
SAB
SAR
SBT
SBB
SBR
SCT
SCB
SCR
34
34
54
32
32
38
32
34
40
38
20
8
22
22
16
24
24
22
28
46
38
46
46
46
44
42
38
66
66
46
68
68
62
68
66
60
Clay loam
Clay
Sandy clay
Clay loam
Clay loam
Clay loam
Clay loam
Clay
Clay loam
131
Manuwa and Olawolu NJSS/22(1)/2012

Table 2: Chemical and organic properties of termite mound soil TERMITE MOUND A
Samples O/M
(%)
O/C
(%)
N
(%)
P
(mg/kg)
Ca2+
(cmol/kg)
K+
(cmol/kg)
Mg2+
(cmol/kg)
Na+
(cmol/kg)
pH
SAT
SAB
SAR
1.69
1.38
2.10
0.98
0.80
1.22
0.12
0.10
0.15
6.92
4.16
5.27
1.30
1.50
1.20
0.351
0.289
0.241
1.00
1.00
1.00
0.148
.0130
0.126
6.06
5.85
5.98
TERMITE MOUND B
SBT
SBB
SBR
1.62
1.62
2.13
0.94
0.94
1.24
0.12
0.13
0.16
6.87
1.76
0.80
2.00
2.00
2.00
0.249
0.233
0.264
1.70
1.10
1.40
0.139
0.126
0.165
5.19
5.30
4.91
TERMITE MOUND C
SCT
SCB
SCR
1.93
1.96
2.27
1.12
1.14
1.32
0.14
0.15
0.17
4.24
7.11
3.36
2.00
1.90
1.30
0.295
0.282
0.287
1.00
1.00
1.00
0.157
0.161
0.161
5.76
5.62
5.82
Table 3: Consistency limits of Termite mound soil (TMS) Soil Samples Liquid limit (%) Plastic limit (%) Shrinkage limit (%) Plasticity Indix
SAT
SAB
SAR
36.0
38.0
29.0
20.0
22.0
19.0
10.0
11.0
5.0
16.0
16.0
10.5
SBT
SBB
SBR
43.0
42.0
35.0
28.0
22.0
22.0
12.0
15.0
9.0
15.0
20.0
13.0
SCT
SCB
SCR
34.0
29.0
29.0
19.0
19.0
19.0
11.0
7.0
7.0
15.0
10.0
10.0
REFERENCES Abbadie, L. And M. Lepage (1989). The Role
of Subterranean fungus-corn chambers
Isoptera, Macrotermitinae) in soil
nitrogen cycling in a forest savanna
(Cote d Ivoire). Soil Biol. Bioch. 21:
1067-1071.
Fageria, N.K. and V.C. Baligar (2004).
Properties of termite mound soil and
responses of rice and beans to N, P and
K fertilization on such soil.
Communications in Soil Science and
Plant Analysis. 35: 15-16.
Garnier-Sillam, E., F. Toutain and J. Renoux
(1988). Comparaison de l’ influence de
deux termitieres (humivore et
champignonniste) sur la stabilite
structurale des sols forestiers tropicaux.
Pedobiol. 32: 89-97. In: Jouquet et al.,
2003.
Jouquet, P., Mamou, L., Lepage, M., Velde,
B. (2002). Effect of termites on clay
minerals in tropical soils; fungus-
growing termintes as weathering
agents. Eur. J. Soil Sci., 53 (4), 521-
527.
Jouquet, P., Mery, T., Roulland, C., Lepage,
M. (2003). Modulated effect of the
termite ancistrotermes cavothorex
(Isoptera, Macrotermitinae) on soil
properties according to the structure
built. Sociobiology 42, 403-412.
132
Characteristics of termite mound soil

Lopez-Hernandez D. 2001. Nutrient dynamics
(C, N and P) in termite mounds of
Nausutitermes ephratae from savannas
of the Orinoco Llanos (Venezuela).
Soil Biology and Biochemistry 33:
747-753.
Menaut J.C., Barbault R., Lavelle P., Lepage
M., (1985). African savannas:
biological systems of humification and
mineralization. In: J.T. a.J. Mott (ed.)
Ecology and management of the
world’s savannas. Australian Acad.
Sci., Canberra. 14-33.
Roose Amsaleg, C., Brygoo, Y., Harry, M.
(2004). Ascomycete diversity in soil-
feeding termite nests and soils from a
tropical rainforest. Environment.
Microbiol., 6(5), 462-469.
Rupela, O.P., Humayun, P., Venkateswarlu, B.
And Yadav, A.K. (2006). Comparing
Conventional and Organic Farming
Crop Production Systems: Inputs,
Minimal Treatments and Data Needs.
Paper prepared for submission to the
Organic Farming Newsletter published
by the National Center for Organic
Farming (NCOF), Ministry of
Agriculture, Government of India, 06
April 2006.
Semhi, K., Chaudhuri, S., Clauer, N., Boeglin,
J.L. (2008). Impact of termite activity
on soil environment: A perspective
from their soluble chemical
components. Int. J. Environ. Sci. Tech.,
5 (4), 432-444, Autumn 2008.
Siame, J.A. (2005). Termite mound as
fertilizer. LEISA Magazine, pp 29,
June, 2005.
Watson JP. (1977). The use of mounds of the
termite Macrotermes falciger
(Gerstacker) as a soil amendment.
Journal of Soil Science 28: 664-672.
Wood T.G., Johnson R.A. and Anderson J.M.
(1983). Modification of the soil in
Nigerian savanna by soil-feeding
Cubitermes (Isoptera, Termitidae). Soil
Biology and Biochemistry, 15: 575-
579.
133
Manuwa and Olawolu NJSS/22(1)/2012
TESTING THE GOODNESS OF FIT OF INFILTRATION MODELS FOR SOILS
FORMED ON COASTAL PLAIN SANDS IN AKWA IBOM STATE,
SOUTHEASTERN NIGERIA
OGBAN, P. I., OBI, J. C., ANWANANE, N. B., EDET, R. U., AND OKON, N. E.
Department of Soil Science, University of Uyo, Uyo, Nigeria
E-mail: [email protected]
ABSTRACT
Infiltration of water into the soil is an important physical process affecting the fate of water
under field conditions, especially, the amount of subsurface recharge and surface runoff and
hence the hazard of soil erosion. The study was conducted to investigate the capability of six
infiltration models, namely, Kostiakov, modified Kostiakov (A) and (B), Philip, modified Philip
(A) and (B) to describe infiltration into soils formed on coastal plain sands parent material in
Akwa Ibom State, Southeastern Nigeria. A total of 18 infiltration runs were made with the
double infiltrometer technique. Model-predicted cumulative infiltration consistently deviated
from field-measured data, that is, the models over-predicted cumulative infiltration by several
orders of magnitude. However, there was a fairly good agreement between mean - measured
cumulative infiltration (274.2 cm, CV = 35.5%) and Philip (405.6 cm, CV = 34.9%) and
Kostiakov (480.3 cm, CV = 37.9%) models. The r2 values of the model parameters obtained
from linear regression analysis were generally low. The data however showed that the Kostiakov
(0.49) and modified Philip ((B) = 0.48) and ((A) = 0.48) provided best fit with the field-
measured data. The residual mean square error (RMSE) of the infiltration equations showed that
the classical Philip model had the least non-significant value (6.47) while other models had
significant (p≤0.01) values that range from moderately high (Kostiakov, 14.23) to very high
(modified Philip (B) , 426.20). T-test of measured versus predicted cumulative intake showed all
but the basic Philip infiltration model were significantly (p≤0.01) different from the field-
measured data, indicating the close agreement between the Philip model and the measured
values. The results confirmed that Philip model could be used for routine characterization of the
infiltration process on coastal plain sands parent material in Akwa Ibom State.
INTRODUCTION Infiltration of water into the soil is of great
practical importance to agriculture since it
determines the amount of subsurface recharge
and surface runoff, and hence the hazard of
soil erosion. Knowledge of the infiltration
process is a prerequisite for efficient soil and
water conservation. The infiltration rate can
mostly be evaluated under either ponded or
rainfall conditions, but the measurement is
time-consuming, could be expensive where
water is limiting, and preferential flow within
cracks can cause an over-estimation of the
infiltration process (Hume, 1993). Infiltration
134
Fit of infiltration models for soils

rate can also be predicted using infiltration
models, that range from those that are strictly
empirical to those that are deemed to be
mechanistic, but that generally vary in their
predictive capacity of the soil infiltration
characteristics (Haverkamp et al., 1988;
Majaliwa and Tenywa, 1998), and all are not
usable under all conditions. Consequently,
tests of their applicability and accuracy are
essential.
Several studies have attempted to quantify the
infiltration process (Green and Ampt, 1911;
Kostiakov, 1932; Horton, 1940; Philip, 1957;
Talsma and Parlange, 1972; Rao et al., 2006).
Equally, several studies have evaluated
existing models either for the purpose of
validation, to establish the model parameters
for different soils or comparison of model
efficiencies and applicability for different soil
conditions (Ahmed, 1982; Bach et al., 1986;
Davidoff and Salim, 1986; Obiechefu, 1991;
Topaloglu, 1999; Mudiare and Adewumi,
2000; Wudduvira et al., 2001; Haws et al.,
2004; Igbadun and Idris, 2007).
Cook et al.(1982) studied the infiltration
process on reclaimed surface mined soils using
Horton, Philip, Green and Ampt, and Parlange
(1973) equations, and reported that these
models generally failed to predict initial
infiltration rates adequately, although they did
simulate long-term infiltration rates relatively
well. Obiechefu (1991) evaluated the
Kostiakov, Horton, and Philip equations and
found that the Kostiakov model best predicted
the infiltration characteristics of permeable
soils in the Nsukka area of southeastern
Nigeria. Similarly, Mbagwu (1995) tested the
goodness of fit of the Kostiakov, modified
Kostiakov (A) and (B), Philip and modified
Philip (A) and (B) and found the modified
Kostiakov (B) and modified Philip (B) could
be used for routine characterization of the
infiltration process in highly permeable soils in
the Nsukka area of southeastern Nigeria.
Wuddivira et al. (2001) tested the performance
of the Kostiakov, Philip, and Horton models
and reported that the Kostiakov and Philip
models adequately described the infiltration
data, but that the Philip equation was superior
in predicting infiltration into Samaru soils in
Northern Nigeria. Similarly, Igbadun and Idris
(2007) evaluated the Kostiakov, Philip,
Kostiakov-Lewis function or modified
Kostiakov (A) (Elliot and Walker, 1982) and
modified Kostiakov (B) (Micheal , 1992) in
hydromorphic soils in Samaru, Zaria, Nigeria,
and found that all four models provided good
overall agreement with field-measured data
but that the Kostiakov and modified Kostiakov
models provided the best fit. The preceding
reviews show that the reliability of the models
is often location-specific, and sometimes
variable results may obtained within location.
This study was conducted to evaluate the
suitability of the Kostiakov, modified
Kostiakov (A) and (B), Philip, and modified
Philip (A) and (B) infiltration models to
describe the infiltration characteristics of soils
formed on coastal plain sands in Akwa Ibom
State, Southeastern Nigeria.
MATERIALS AND METHODS
Environment of Study Area
The study was conducted in soils formed on
coastal plain sands parent material in Akwa
Ibom State, Southeastern Nigeria. The State is
located between latitudes 4° 30' and 5° 30' and
longitudes 7° 30' and 7° 56'. The climate is
tropical hot humid, characterized by two
distinct rain (April to October) and dry
(November to March) seasons. Rainfall is
bimodal (July and September) and heavy with
annual range between 2000 and 3500 mm.
Temperatures are uniformly high averaging
between 28 and 300. Similarly, relative
humidity is high, about 75%.
Over 75% of the State comprises
unconsolidated sediments of the coastal plains
and alluvium (Petters et al., 1989), mostly in
134
Ogban, Obi, Anwanane, Edet and Okon NJSS/22(1)/2012

the central and southern areas. The geologic
formation passes imperceptibly to a thick
sequence of sandstone and shale parent
material in the northern area of the State. The
soils are highly permeable and well-drained,
structurally unstable, and low in organic
matter content. The vegetation is mostly
secondary forests interspersed with wild oil
palms. Land use is the traditional shifting
cultivation with the associated slash-and burn
and bush fallow farming system. The bush
fallow or natural fallow age has been reduced
to about four (4) years (Ogban et al.,2004,
2005), the vegetation is immature (Areola,
1990), affecting the quality of the soil resource
base (Ogban and Obi, 2010).
Field methods
The study was conducted in 18 locations, from
where a total of 18 soil samples were collected
from 20 cm depth for particle size analysis.
Another set of 18 undisturbed samples were
collected from the depth zone with core
samplers 7.2 cm long and 6.8 cm internal
diameter for bulk density, total porosity, and
hydraulic conductivity. The soil samples were
collected prior to and adjacent the infiltration-
test points.
Eighteen (18) infiltration runs were carried out
using the double ring infiltrometer technique.
The rings, 30 and 55 cm diameter respectively,
were driven into the soil to a depth of 10 cm.
Plant materials were placed on the surface of
the soil to minimize disturbance of the surface
soil when water was applied. Water was
applied and ponded to a depth of about 15 cm.
The rate of water entering the soil and the
depth of water infiltrated as a function of time
were monitored in the inner ring for 120
minutes at each location.
DATA ANALYSIS
The six infiltration models were examined to
evaluate their parameters. These are Kostiakov
(equation 1), modified Kostiakov (A) and (B)
(equations 2 and 3), Philip (equation 4), and
modified Philip (A) and (B) (equations 5 and
6) (Table 1).
I = Ktα (1)
where K and α are constants.
I = K1tα1 + Kst (2)
where Ks is a laboratory determined hydraulic
conductivity of the soil.
I = K2tα2 + ic t (3)
where ic is the asymptotic final infiltration rate
of the soil.
I = St½ + At (4)
where S and A are constants.
I = S1t½ + Kst (5)
where Ks is as defined in equation (2) above.
I = S2t½ +ict (6)
where ic is as defined in equation (3).
Least square linear regression analysis and
curve fitting were used to determine the model
parameters. The principle of curve fitting is to
find an equation which fits the data with a
minimum deviation. To facilitate linear
regression, each model was first transformed
into its linear equivalent using logarithm, in
which I and t are the dependent and
independent variables, respectively, and the
coefficients of the linear functions are the
model parameters to be estimated. The values
of the parameters estimated were then
incorporated into the respective model
equations and the capability of each model to
simulate cumulative infiltration was evaluated
by comparing the model-simulated data with
the field-measured data.
RESULTS AND DISCUSSION The results of soil physical determinations are
shown in Table 2. The mean measured
cumulative infiltration for the 18 sites was
274.2 cm, with a standard deviation of 97.27
cm and a coefficient of variability (CV) of
35.5% (Table 3). A comparison between
measured and model-predicted cumulative
infiltration showed that consistently the values
predicted by the classical Kostiakov and Philip
135
Fit of infiltration models for soils
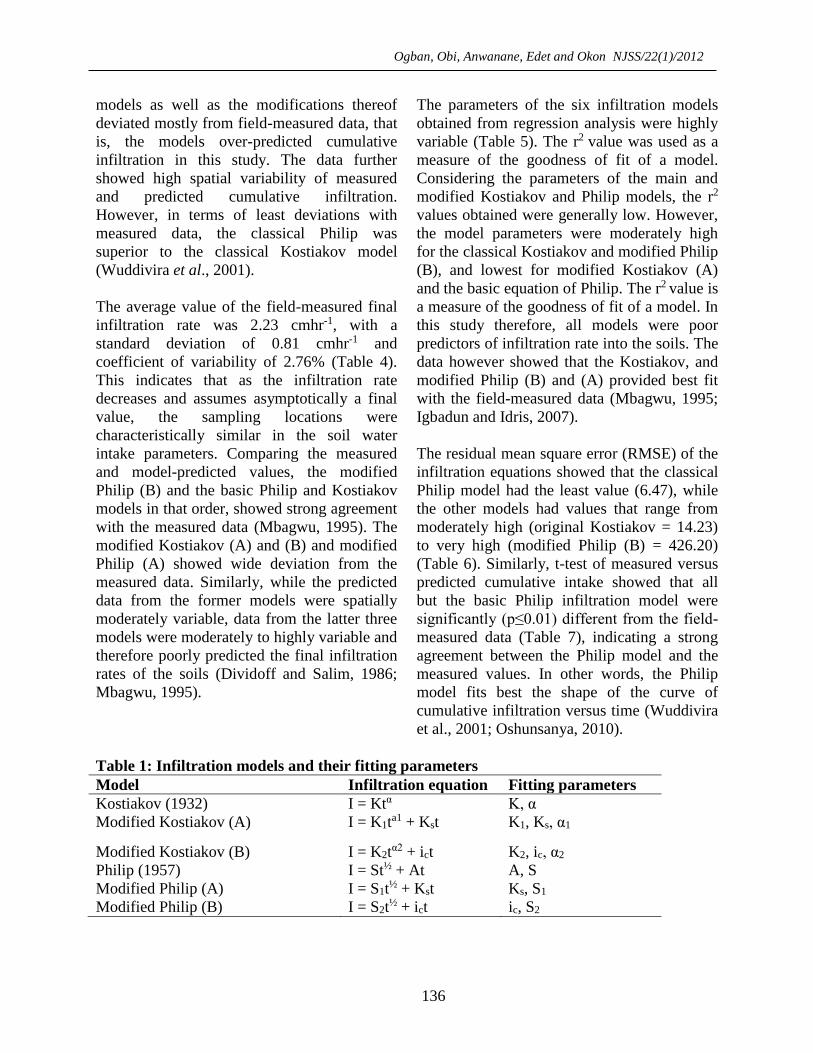
models as well as the modifications thereof
deviated mostly from field-measured data, that
is, the models over-predicted cumulative
infiltration in this study. The data further
showed high spatial variability of measured
and predicted cumulative infiltration.
However, in terms of least deviations with
measured data, the classical Philip was
superior to the classical Kostiakov model
(Wuddivira et al., 2001).
The average value of the field-measured final
infiltration rate was 2.23 cmhr-1, with a
standard deviation of 0.81 cmhr-1 and
coefficient of variability of 2.76% (Table 4).
This indicates that as the infiltration rate
decreases and assumes asymptotically a final
value, the sampling locations were
characteristically similar in the soil water
intake parameters. Comparing the measured
and model-predicted values, the modified
Philip (B) and the basic Philip and Kostiakov
models in that order, showed strong agreement
with the measured data (Mbagwu, 1995). The
modified Kostiakov (A) and (B) and modified
Philip (A) showed wide deviation from the
measured data. Similarly, while the predicted
data from the former models were spatially
moderately variable, data from the latter three
models were moderately to highly variable and
therefore poorly predicted the final infiltration
rates of the soils (Dividoff and Salim, 1986;
Mbagwu, 1995).
The parameters of the six infiltration models
obtained from regression analysis were highly
variable (Table 5). The r2 value was used as a
measure of the goodness of fit of a model.
Considering the parameters of the main and
modified Kostiakov and Philip models, the r2
values obtained were generally low. However,
the model parameters were moderately high
for the classical Kostiakov and modified Philip
(B), and lowest for modified Kostiakov (A)
and the basic equation of Philip. The r2 value is
a measure of the goodness of fit of a model. In
this study therefore, all models were poor
predictors of infiltration rate into the soils. The
data however showed that the Kostiakov, and
modified Philip (B) and (A) provided best fit
with the field-measured data (Mbagwu, 1995;
Igbadun and Idris, 2007).
The residual mean square error (RMSE) of the
infiltration equations showed that the classical
Philip model had the least value (6.47), while
the other models had values that range from
moderately high (original Kostiakov = 14.23)
to very high (modified Philip (B) = 426.20)
(Table 6). Similarly, t-test of measured versus
predicted cumulative intake showed that all
but the basic Philip infiltration model were
significantly (p≤0.01) different from the field-
measured data (Table 7), indicating a strong
agreement between the Philip model and the
measured values. In other words, the Philip
model fits best the shape of the curve of
cumulative infiltration versus time (Wuddivira
et al., 2001; Oshunsanya, 2010).
Table 1: Infiltration models and their fitting parameters
Model Infiltration equation Fitting parameters
Kostiakov (1932) I = Ktα K, α
Modified Kostiakov (A) I = K1ta1 + Kst K1, Ks, α1
Modified Kostiakov (B) I = K2tα2 + ict K2, ic, α2
Philip (1957) I = St½ + At A, S
Modified Philip (A) I = S1t½ + Kst Ks, S1
Modified Philip (B) I = S2t½ + ict ic, S2
136
Ogban, Obi, Anwanane, Edet and Okon NJSS/22(1)/2012

I is cumulative infiltration (cm); K, K1, K2 are
Kostiako’s time coefficient terms, (cm); t is
time elapsed (h); a, a1, a2 are Kostiakov’s time
exponent terms (dimensionless); Ic is steady
infiltration rate (cm h-1); A is Philip’s soil
water, transmissivity (cm h-1); S, S1 S2 are
Philip’s soil water sorptivity terms (cm h-1); Ks
is saturated hydraulic conductivity (cm h-1).
Table 2: Average values of soil physical and chemical properties
Soil property X sd CV
Sand --g k
g-1--
927 19.27 2.1
Silt g kg-1 28 19.70 71.1
Clay g kg-1 43 1.04 2.4
Organic matter 30.4 7.99 26.3
Ks cm h-1 12.32 7.33 59.5
Bulk density kg m-3 1524 54.28 28.1
Total porosity m3 m-
3
0.425 0.02 20.2
X is mean; sd is standard deviation; CV is coefficient of variation.
Table 3: Average statistics of cumulative infiltration from six infiltration models fitted
to 18 trials
Model X Sd CV
Measured 274.2 97.27 35.5
Kostiakov 480.3 181.87 37.9
Modified Kostiakov (A) 698.6 235.31 33.7
Modified Kostiakov (B) 1294.3 903.44 69.8
Philip 405.6 141.58 34.9
Modified Philip (A) 1573.7 977.99 62.2
Modified Philip (B) 1399.3 933.01 66.7
X is mean; sd is standard deviation; CV is coefficient of variation
Table 4: Average statistics of final infiltration rates from six infiltration models fitted
to 18 trials
Model X Sd CV
Measured 2.23 0.81 2.76
Kostiakov 3.50 1.09 31.14
Modified Kostiakov (A) 10.60 7.31 68.96
Modified Kostiakov (B) 5.80 1.80 31.03
Philip 3.41 1.16 34.02
Modified Philip (A) 101.45 70.40 69.19
Modified Philip (B) 2.41 0.82 34.02
X is mean; sd is standard deviation; CV is coefficient of variation.
137
Fit of infiltration models for soils

Table 5: Average statistics of estimated values of the model parameters Kostiakov Modified Kostiakov (A) Modified Kostiakov (B) Philip Modified Philip (A) Modified Philip (B)
K Α r2 K1 KS α1 r2 K2 ic α2 r2 S A r2 S1 Ks r2 S2 ic r2
X 4.52 O.86 0.49 8.66 x 10⁻⁵ 12.32 -704.5 O.40 2.28 2.23 0.19 0.46 2.46 2.06 0.44 -110.06 12.32 0.47 0.52 2.232 0.48
Sd 1.78 0.05 0.25 2.72 x 10⁻⁵ 7.33 419.59 0.29 1.39 0.81 0.23 0.26 1.52 0.78 0.25 77.62 7.33 0.25 0.30 0.31 0.25
CV 39.4 6.7 50.5 3.14 x 10⁻⁵ 59.5 -59.6 72.5 61 36.1 121.1 55.6 61.8 37.9 57.4 -70.5 59.5 54.0 57.7 36.1 52.5
X is mean; sd is standard deviation; CV is coefficient of variation; K, K1, K2 are Kostiakov’s time coefficient terms(cm h -1); Ks is
saturated hydraulic conductivity (cm h-1); a, a1 are Kostiakov’s time exponent terms (dimensionless); ic is steady infiltration rate (cm
h-1); S, S1, S2 are soil water sorptivity (cm h-½); A is soil water transmissivity (cm h-1).
138
Ogban, Obi, Anwanane, Edet and Okon NJSS/22(1)/2012
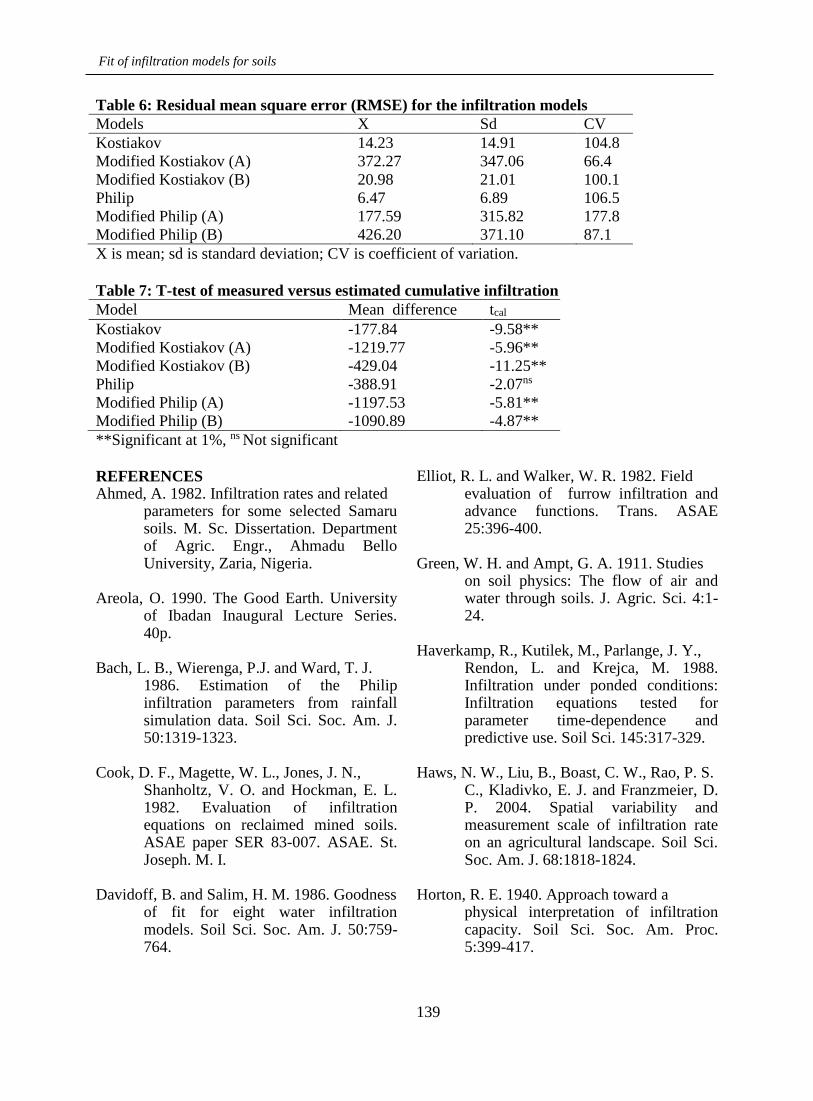
Table 6: Residual mean square error (RMSE) for the infiltration models
Models X Sd CV
Kostiakov 14.23 14.91 104.8
Modified Kostiakov (A) 372.27 347.06 66.4
Modified Kostiakov (B) 20.98 21.01 100.1
Philip 6.47 6.89 106.5
Modified Philip (A) 177.59 315.82 177.8
Modified Philip (B) 426.20 371.10 87.1
X is mean; sd is standard deviation; CV is coefficient of variation.
Table 7: T-test of measured versus estimated cumulative infiltration
Model Mean difference tcal
Kostiakov -177.84 -9.58**
Modified Kostiakov (A) -1219.77 -5.96**
Modified Kostiakov (B) -429.04 -11.25**
Philip -388.91 -2.07ns
Modified Philip (A) -1197.53 -5.81**
Modified Philip (B) -1090.89 -4.87**
**Significant at 1%, ns Not significant
REFERENCES Ahmed, A. 1982. Infiltration rates and related
parameters for some selected Samaru soils. M. Sc. Dissertation. Department of Agric. Engr., Ahmadu Bello University, Zaria, Nigeria.
Areola, O. 1990. The Good Earth. University
of Ibadan Inaugural Lecture Series. 40p.
Bach, L. B., Wierenga, P.J. and Ward, T. J.
1986. Estimation of the Philip infiltration parameters from rainfall simulation data. Soil Sci. Soc. Am. J. 50:1319-1323.
Cook, D. F., Magette, W. L., Jones, J. N.,
Shanholtz, V. O. and Hockman, E. L. 1982. Evaluation of infiltration equations on reclaimed mined soils. ASAE paper SER 83-007. ASAE. St. Joseph. M. I.
Davidoff, B. and Salim, H. M. 1986. Goodness
of fit for eight water infiltration models. Soil Sci. Soc. Am. J. 50:759-764.
Elliot, R. L. and Walker, W. R. 1982. Field evaluation of furrow infiltration and advance functions. Trans. ASAE 25:396-400.
Green, W. H. and Ampt, G. A. 1911. Studies
on soil physics: The flow of air and water through soils. J. Agric. Sci. 4:1-24.
Haverkamp, R., Kutilek, M., Parlange, J. Y.,
Rendon, L. and Krejca, M. 1988. Infiltration under ponded conditions: Infiltration equations tested for parameter time-dependence and predictive use. Soil Sci. 145:317-329.
Haws, N. W., Liu, B., Boast, C. W., Rao, P. S.
C., Kladivko, E. J. and Franzmeier, D. P. 2004. Spatial variability and measurement scale of infiltration rate on an agricultural landscape. Soil Sci. Soc. Am. J. 68:1818-1824.
Horton, R. E. 1940. Approach toward a
physical interpretation of infiltration capacity. Soil Sci. Soc. Am. Proc. 5:399-417.
139
Fit of infiltration models for soils

Hume, I. H. 1993. Determination of infiltration characteristics by volume balance for bother-check irrigation. Agric. Water Management 23:23-39.
Igbadun, H. E. and Idris, U. D. 2007.
Performance evaluation of infiltration models in a hydromorphic soil. Nig. J. Soil Env. Res. 7:53-59.
Kostiakov, A. N. 1932. On the dynamics of the
coefficient of water percolation in soils and on the necessity for studying it from a dynamic point of view for purpose of amelioration. Trans. Int. Congr. Soil Sci. 1932(A): 17-21.
Majaliwa-Mwanjalolo, J. G. and Tenywa, M.
M. 1998. Infiltration characteristics of soils of Kyetume ridge, Kabanyolo, Uganda. MUARIK Bull. 1:57-65.
Mbagwu, J. S. C. 1995. Testing the goodness
of fit of infiltration models for highly permeable soils under different tropical soil management systems. Soil Tillage Res. 34:199-205.
Micheal, A. M. 1992. Irrigation: Theory and
Practice. Vikas Publ. House. PVT Ltd. New Delhi, India. Pp. 464-472.
Mudiare, O. J. and Adewumi, J. K. 2000. Estimation of infiltration from field-measured sorptivity values. Nig. J. Soil Res. 1:1-3.
Obiechefu, G. C. 1991. Evaluation of
infiltration equations for Nsukka soils. The Nig. Agric. J. 26:27-42.
Ogban, P. I., Ukpong, U. K. and Essien, I. G.
2004. Interrelationship between bush fallow and the physical and chemical properties of “acid” sands in southeastern Nigeria. Nig. J. Soil Res. 5:32-45.
Ogban, P. I., Ukpong, U. K. and Essien, I. G.
2005. Influence of bush fallow on the physical properties of acid sands in
southeastern Nigeria. Nig. J. Soil Sci. 15:96-101.
Ogban, P. I. and Obi, J. C. 2010. The relation
between natural fallow and soil quality in Akwa Ibom State, southeastern Nigeria. Nig. J. Agric. Food Env. 6(3&4):34-43.
Oshunsanya, S. O. 2010. Predicting infiltration
rates and determining suitability of infiltration models under vetiver grass strips management systems in South-Western Nigeria. Nig. J. Soil Sci. 20(1): 36-44.
Parlange J. Y. 1973. Note on the infiltration
advance front from border irrigation. Water Resources Res. 9:1075-1078.
Petters, S. W., Usoro, E. J., Udo, E. J., Obot,
U. W. and Okpon, S. N. 1989. Akwa Ibom State: Physical Background, Soil and Land Use and Ecological Problems. Govt. Print Office, Uyo. 603p.
Philip, J. R. 1957. The theory of infiltration:
The infiltration equation and its solutions. Soil Sci. 83:345-347.
Rao, M. D., Raghuwanshi, N. S. and Singh, R.
2006. Development of a physically based infiltration model for irrigated soils. Agric. Water Management 85:165-174.
Talsma, T. and Parlange, J. Y. 1972. One-
dimensional vertical infiltration. Aus. J. Soil Res. 10:143-150.
Topaloglu, F. 1999. Comparing tillage
technique by infiltration model. Trop. J. Agric. Forestry 23:609-614.
Wuddivira, H. N., Abdulkadir, A. and Tamu, J. 2001. Prediction of infiltration characteristics of an Alfisol in the Northern Guinea savanna of Nigeria. Nig. J. Soil Res. 2:1-5.
140
Ogban, Obi, Anwanane, Edet and Okon NJSS/22(1)/2012

CONTAMINANT LIMIT (c/p index) OF HEAVY METALS IN SPENT OIL
CONTAMINATED SOIL BIOREMEDIATED WITH LEGUME PLANTS AND
ORGANIC NUTRIENT
UDOM, B.E.1 , ANO A. O.,2 AND CHUKWU L. I. 2 1Department of Crop and Soil Science, University of Port Harcourt,
P.M.B. 5323, Port Harcourt, Rivers State, Nigeria.
E-mail: [email protected] 2National Root Crops Research Institute, Umudike.
P.M.B 7006, Umuahia, Abia State, Nigeria.
ABSTRACT
Three legume plants (Gliricidia sepium, Leucaena luecocephala and Calapogonium caerulean)
alone or in combination with 0.5% (w/w) poultry manure were tested for their ability to reduce
the heavy metals and toxicity criteria of a sandy soil contaminated with 5% (w/w), (equivalent of
50,000 mg/kg) spent lubricating oil, each for two years. The oil and poultry manure led to build-
up of Ni, Pb, Zn and Cu in the soils. The contaminant – pollution index (c/p index) calculated
for Ni, Pb, Zn and Cu showed that at 3 months after oil contamination, concentration of Ni
ranged from 0.03 to 0.024 mg/kg, Pb from 0.01 to 0.18 mg/kg, Zn from 0.27 to 0.60 mg/kg, and
Cu from 0.12 to 0.81 mg/kg. The application of oil led to slight contamination of the soil with
Pb, moderate to severe contamination with Zn and Cu, whereas, plots treated with poultry
manure alone showed very severe contamination with Cu. Within 18 to 36 months, after oil
contamination, the Gliricidia, Leucaena and Calapogonium combined with poultry manure
reduced the toxicity levels of Ni, Pb, Zn and Cu. The Gliricidia was more effective in removal of
these metals. At 36 months, the Gliricidia sepium combined with poultry manure reduced the Ni,
Pb, Zn and Cu concentrations in the soil by 96%, 90%, 42%, and 50% respectively. Therefore,
these legume plants are promising species in phytoremediation of oil contaminated sites and for
general improvement of soil health. They can bioaccumulate high levels of these metals that
could be toxic to other plants or organisms.
Key words: contaminant limit, heavy metals, bioremediation, legume plants, organic nutrients
Email of corresponding author: [email protected]
INTRODUCTION
Heavy metals are widely and usually applied
to the elements such as Cd, Cr, Cu, Hg, Ni,
and Zn, which are commonly associated with
pollution and toxicity problems. It is a general
collective term applying to the group of metals
and metalloids with an atomic density greater
than 6g/cm3 (Alloway, 1990). However, some
of the elements in this group are required by
most living organisms in small but critical
concentrations for normally healthy growth.
Those metals which are unequivocally
essential, whose deficiency have adverse
effects in normal living conditions include Cu,
Mn, Fe and Zn for both plants and animals,
141
Contaminatant limit of heavy metals

Co, Cr and Se for animals, B and Mo for
plants.
The toxicity effects caused by excess
concentrations of these metals include
competition for sites with essential
metabolites, replacement of essential ions, and
damage to cell membrane (Ernst, 1996). Zinc,
Cu, Pb, Cd and Ni are generally the metals of
greatest concern. Zinc, Cu and Pb are
important because they can be phytotoxic.
Whereas, concern for Cd and Ni arises from
their possible entry into the food chain
(Chaney, 1994). If these metals move too
rapidly in a particular soil, they can pollute
ground water supplies, especially in areas with
high water table. It has been found that
limiting Cu-contaminated soils to pH 7 can
mitigate the toxicity by reducing the
bioavailability of the Cu. (Alloway and Ayres,
1997). Copper is also highly toxic to the soil
microbial biomass and this can affect various
aspects of soil fertility.
Disposal of petroleum products with high
heavy metal burdens on soil could result in
nutritional imbalance, phytotoxicity and
reduced crop production. Sediments and
polluted soils enriched in heavy metals are
subjected to erosion, which increase the risk of
pollution in the surrounding areas. (Merkl et
al.,2005). Excessive applications of metals
bearing materials to the soil in whatever form
have the potential of restricting plant growth
and reducing crop yields. Ultimately, yield
reduction has been the most important measure
of phytotoxicity for agronomic species, since it
affects the profitability of crop production and
limits the utility of the land. Heavy metal
accumulation and possible phytotoxicity are
therefore, the most critical long-term hazards
associated with disposal of petroleum products
to land.
Contaminant limit (c/p index) has been used
for assessment of toxicity risk of heavy metals
in a soil site. The limit value is equivalent to
maximum permissible risk level. It is intended
to indicate the environmental quality to be
achieved in a given period. (Kabata-Pendias
and Pendias,1984).
Spent lubricating oil includes mono-and multi-
grade crankcase oils from petrol engines,
together with gear oils and transmission fluids
with significant levels of heavy metals and
other undesirable properties present in all
petroleum products. Atuanya (1987) observed
that Nigeria accounts for more than 87 million
litres of spent oil annually and that most heavy
metals such as Va, Pb, Ni, Cu and Zn which
are below detection in unused lubricating oil,
showed high values in waste motor oil.
Contamination of open vacant plots and farm
lands with petrol oils and grease is becoming
more widespread problem than crude oil
pollution.(Anoliefo and Vwioko, 1995;
Atuanya, 1987).
The use of plants and organic nutrients to
modify soils contaminated with petrol oil and
grease will provide a solution for metal
stabilization and for minimizing erosion and
associated risks. Phytoremediation has shown
great potential as an alternative treatment for
remediation of heavy metal-contaminated soils
and ground water (Chen and Cutright, 2001,
Merkl et al., 2005, Gallizia et al., 2003,
Harayama et al., 2004). There is very little
information available in the literature on the
use of organic nutrients and legume plants to
reduce the risk levels of heavy metals in
contaminated sites. Moreover, the distinction
between contamination and pollution range
values of most metals in soils is uncertain.
This study will provide valuable input data in
the assessment of toxicity risk levels of Ni, Pb,
Zn and Cu in soils.
MATERIALS AND METHOD
The study was carried out at the University of
Nigeria, Nsukka, Research Farm (Lat 06052’N
and Long 07024’E) The soil is a Typic
kandiustult (Nwadialo, 1989), derived from
False-Bedded Sandstone (Akamigbo and Igwe,
1990). The mean sand, silt, and clay contents
at the 0-30 cm depth were 820, 60 and 120 g
kg-1 soil respectively, (Table 1). The soil was
142
Udom, Ano and Chukwu NJSS/22(1)/2012

impacted with equivalent of 50,000 mg kg-1
soil (5% w/w) mono- and multi-grade
crankcase oils sourced from petrol and diesel
engines. The oil was applied in a single dose
each for two years. By the second year of the
experiment, oil contaminated plots had
equivalent of 100,000 mg kg-1 soil,
representing a total oil load of 10% (w/w).
Some properties of the soil and spent oil used
for the experiment are shown in Table 1.
Three (3) legume plants: Calapogonium
Caerulean, Gliricidia sepium, and Leucaena
leucocephala, alone or in combination with
0.5% (w/w), (equivalent of 50 mg kg-1) of
poultry manure were used to enhance
biodegradation. The legume seeds and poultry
manure were introduced to the plots at seven
(7) days after the oil contamination and
allowed for incubation, fourteen (14) days,
before planting the maize crop. The
Calapogonium caerulean was planted at 30 x
90 cm spacing, (giving density of 37,000
plants ha-1), whereas the Gliricidia ssp and
Leucaena ssp were planted at 1m x 90 cm
spacings, (density of 11, 111 plants ha-1).
FASR-W maize (zea mays) variety was used
as test crop, planted at 25 x 50 cm spacing,
giving a density of 50,000 plants ha-1. The
legume plants used were regularly pruned to
prevent shading of the maize crop and the
biomass incorporated into the soil.
The experiment was laid out as a Randomized
Complete Block Design (RCBD) with nine (9)
treatments, viz: uncontaminated (control) soil
(c), 5% spent oil (A5), 5% spent oil +
Calapogonium ssp (A5 + Ca), 5% spent oil +
Gliricidia spp (A5 + Gl), 5% spent oil +
Leucaena spp (A5 + Le), 5% spent oil +
poultry manure (A5 + Pm), 5% spent oil +
Calapogonium ssp + 0.5% poultry manure (A5
+ Ca + Pm), 5% spent oil + Gliricidia ssp +
0.5% poultry manure (A5 + Gl + Pm), 5%
spent oil + Leucaena ssp + 0.5% poultry
manure (A5 + Le + Pm) with five (5)
replications. The second application of 5%
(w/w) spent oil was done 12 months after the
first application.
Soil sample and measurement of heavy metal
Soil samples were collected from 0 – 30cm
depth at 3, 12, 18, 24, 30 and 36 months after
oil contamination, air-dried and crushed to
pass through a 2 mm sieve. Heavy metals (Ni,
Pb, Zn and Cu) were measured by atomic
absorption spectrophotometer (AAS), after
digesting 3 g air-dried soil sample in
concentrated HCIO4 – HNO3 as described by
(Carter, 1993). The values were compared
with the widely used normal and critical levels
set by Kabata – Pendias and Pendias (1984).
The contaminant limit (c/p index) was
calculated as the ratio between the heavy metal
content in the soil and the toxicity criteria (the
tolerable levels) and classified according to
Lacatusu (1998) as: very slight (c/p index <
0.1), slight (0.1 – 0.25), moderate (0.26 –
0.50), severe (0.51 – 0.75) and very severe
contamination) 0.76 – 1.00), and that of
pollution range as: slight (1.1 – 2.0) , moderate
(2.1– 4.0), severe (4.1 – 8.0), very severe (8.1
– 16.0) and excessive pollution (>16.0). The
distinction between contamination and
pollution range of heavy metals was
established according to Lacatusu (1998). The
legume plants used in this study are good
bioaccumulators of heavy metals (Merkl et al.
2005), fast growing with massive root system,
which penetrate the soil for several metres.
RESULTS AND DISCUSSION
The soil is sandy loam with pH of 4.7 and low
in total nitrogen (Table 1). The spent oil has
high levels of Pb, Zn, and Cu and specific
gravity of 0.87.
Heavy metal concentrations
The heavy metal concentrations pH values of
the soil are shown in Table 2. There were
build-up of Ni, Pb, Zn and Cu in plots
contaminated with spent oil and similar build-
up in plots treated with poultry manure. PH
values ranged from 3.1 to 3.7 in spent oil-
contaminated plots leading to increase in soil
acidity between 2 and 36 percent relative to
the control. This confirmed that spent oil and
poultry manure are sources of heavy metals
contamination in soils (Udom et al, 2004,
143
Contaminatant limit of heavy metals

Amadi et al, 1993). In 3 months, Pb, Zn and
Cu showed significant (P < 0.05) increases in
the oil contaminated plots relative to control
(Table 1). Plots treated with poultry manure
(Pm) alone, showed the highest values of 17,
48, 43.6 and 48.3 mg/kg of Pb, Zn and Cu
respectively, and similar trend at 6 months
after oil contamination. In 12 months, the
increase in Ni, Pb, Zn and Cu concentrations
in the contaminated plots (A5), were 158%,
702%, 118% and 446% respectively compared
to the control (Table I). The high levels of
these metals in the contaminated plots A5 is an
indication that Ni, Pb, Zn and Cu have been
introduced to the soil via the spent oil and
poultry manure applied. This confirmed the
observations of Amadi et al (1993) that most
heavy metals such as Va, Pb, Ni and Fe which
are below detection in unused lubricating oil
showed high values in waste motor oil, and
when disposed to soil, lead to contamination of
the soil.
At high concentrations, these metals can block
essential functional groups in the soil,
displacing other metals ions and modify the
active conformation of biological molecules in
soil and plants, causing reduction in growth
(Vangronsveld and Clijsters, 1994, Ernst,
1996).
Within 18 to 36 months, after oil application,
the Gliricidia, Leucaena and Calopogonuim
combined with poultry manure showed
reductions in Ni, Pb, Zn, and Cu. At 36
months, the Gliricidia sepium combined with
poultry manure significantly reduced the Ni,
Pb, Zn and Cu concentrations in the soil by
96%, 90%, 42% and 50%, respectively,
relative to the A5 soil. This implies that these
legume plants belong to the small group of
plants reported by Brown et al. (1995), that
can tolerate high levels of these metals.
Table 1: Some characteristics of the soil (0-30cm depth), poultry manure and spent oil used in the experiment
Parameters Unit Soil Poultry manure Spent oil
Sand (200-50µm)
Silt (50-2µm)
Clay(< 2µm)
Texture
Organic carbon
Total N
pH (H2O)
Specific gravity
Pb
Zn
Cu
g kg-1
g kg-1
g kg-1
-
g kg-1
g kg-1
-
-
mg kg-1
mg kg-1
mg kg-1
Sandy loam
6.84
0.76
4.7
-
1.48
18.6
7.0
-
28.6
4.5
6.5
-
BDL
182.8
46.1
-
31.5
2.79
-
0.87
286b
478b
164b
BDL – Below detection limit
b – Values in mgl-1
Contaminant-pollution index The contaminant-pollution index(c/p index) calculated for Ni, Pb, Zn, and Cu concentrations in the soil are shown in Table 2. At 3 months after oil contamination, the contaminant-pollution index of Ni ranged from 0.003 to 0.024 mg/ kg, and Pb from 0.12 to 0.81 mg/kg. The oil led to slight contamination of the soil with Pb, moderate to severe
contamination with Zn and Cu, whereas A5 + Pm showed severe contamination of the soil with Cu. This indicates that Zn and Cu are the major contaminant risk in spent oil impacted soils. At 12 months, Zn and Cu showed moderate to severe contamination in the A5 plots, and slight to very slight contamination with Pb.
144
Udom, Ano and Chukwu NJSS/22(1)/2012

After 18 months when additional 5% and 0.5% levels of spent oil and poultry manure respectively, were applied to the soil, the A5 soil showed severe risk levels of these heavy metals. This indicated that Ni, Pb, Zn, and Cu are commonly associated with contamination and toxicity problems in soils as earlier reported by Alloway and Ayres (1997). Copper at this level of concentration has been reported to inhibit plant growth, and interfered with several cellular processes in plants (Devez et al., 2003), and Pb and Zn at these levels can suppress homeostatic mechanism in microorganisms (Ernst, 1996).
Within 18 to 36 months, after oil contamination, the Gliricidia, Leucaena and Calapogonium reduced the c/p index Pb, Zn and Cu (Table 3). The Gliricidia sepium alone was more effective in reducing toxicity levels of these heavy metals. The c/p index of Pb, Zn, and Cu in the treated soils showed gradual reduction in 18, 24, 30 and 36 months. This is an indication that these legumes plants are promising in phytoremediation of heavy metal contaminated soils.
Table 2: Heavy metal content of the top 0 – 30cm soil of oil contaminated site as influenced by the treatments.
Treatment PH(H2O) PH (KCl) Ni Pb Zn Cu
mg kg-1
3rd Month
A5 3.7 3.3 2.4 15.3 31.4 39.0
A5 + Gl 3.8 3.3 2.2 15.2 30.9 30.1
A5 + Le 4.0 3.8 2.2 15.9 30.4 30.6
A5 + Ca 3.9 3.5 2.1 15.0 30.1 29.2
A5 + Pm 4.0 3.7 2.1 17.5 43.6 48.3
A5 + Gl + Pm 4.2 4.0 2.1 17.2 42.1 32.6
A5 + Le + Pm 4.4 4.0 2.1 17.3 41.5 33.1
A5 + Ca + Pm 4.1 3.8 2.1 17.3 41.8 30.9
C 4.0 3.5 0.3 1.0 18.6 7.1
LSD (0.05) 0.67 0.53 NS 0.5 0.6 7.0
6th Month
A5 3.1 3.0 2.3 15.1 32.7 30.29
A5 + Gl 3.6 3.4 1.1 15.0 30.8 28.3
A5 + Le 3.8 3.5 1.2 14.8 31.0 28.6
A5 + Ca 3.8 3.6 1.4 15.0 31.6 28.7
A5 + Pm 4.1 3.7 2.1 17.1 44.7 36.0
A5 + Gl + Pm 4.4 4.2 1.7 16.0 38.1 30.2
A5 + Le + Pm 4.3 4.0 1.7 16.2 39.5 29.7
A5 + Ca + Pm 4.4 4.0 1.9 15.2 39.2 29.1
C 4.3 4.0 0.2 1.2 18.3 7.1
LSD (0.05) 0.36 0.28 0.3 0.1 0.8 1.8
12th Month A5 3.2 3.0 3.9 8.2 40.8 38.8 A5 + Gl 4.1 3.8 2.4 6.9 33.1 26.9 A5 + Le 3.8 3.6 2.4 6.8 34.5 27.7 A5 + Ca 4.5 4.1 2.4 7.0 33.8 27.1 A5 + Pm 3.8 3.6 2.5 9.9 46.4 33.4 A5 + Gl + Pm 4.8 4.2 2.2 7.1 38.1 28.1 A5 + Le + Pm 4.2 4.0 2.3 7.2 38.4 29.4 A5 + Ca + Pm 4.1 4.0 2.4 7.1 38.5 29.5 C 4.3 3.9 0.2 1.0 18.7 7.1
145
Contaminatant limit of heavy metals

LSD (0.05) 0.85 0.36 0.4 0.2 0.6 0.4 18th Month A5 3.1 3.0 3.9 28.0 45.8 42.6 A5 + Gl 4.6 4.3 1.1 15.1 24.8 37.9 A5 + Le 4.1 3.8 1.1 15.3 31.2 36.2 A5 + Ca 4.3 4.1 1.3 15.2 31.6 31.3 A5 + Pm 3.7 3.5 1.9 16.2 43.4 40.8 A5 + Gl + Pm 4.8 4.4 1.0 15.3 39.1 36.7 A5 + Le + Pm 4.6 4.4 1.3 15.4 30.4 39.2 A5 + Ca + Pm 4.8 4.4 1.2 15.4 31.2 38.1 C 4.2 4.0 0.2 1.5 17.6 10.0 LSD (0.05) 0.81 0.3 0.1 0.1 0.4 0.1
24th Month
A5 3.1 4355 3.9 28.1 44.7 38.7 A5 + Gl 4.8 3866 0.9 15.0 21.5 26.0 A5 + Le 4.3 3894 0.9 15.2 26.0 27.0 A5 + Ca 4.4 4011 0.9 15.2 26.8 27.1 A5 + Pm 3.8 4024 0.3 16.3 33.9 33.2 A5 + Gl + Pm 4.8 3668 0.8 14.2 30.6 27.7 A5 + Le + Pm 4.8 3699 0.8 14.3 36.6 28.4 A5 + Ca + Pm 4.6 3681 0.8 14.6 30.1 28.0 C 4.2 3079 0.3 1.4 17.7 7.1 LSD (0.05) 0.26 27.9 0.0 0.1 0.2 0.4 30th Month A5 3.4 4429 4.0 28.0 44.3 39.0 A5 + Gl 4.8 3776 0.8 19.7 21.2 21.2 A5 + Le 4.6 3801 0.8 10.8 26.1 25.1 A5 + Ca 4.8 3874 0.8 10.9 26.6 25.3 A5 + Pm 3.7 3882 1.3 10.2 30.7 28.1 A5 + Gl + Pm 4.8 3364 0.7 11.0 27.4 22.0 A5 + Le + Pm 4.6 3386 0.7 10.1 29.3 22.6 A5 + Ca + Pm 4.8 3400 0.1 10.0 29.1 23.9 C 4.2 3057 0.2 1.1 17.9 7.3 LSD (0.05) 0.14 22.9 0.1 0.1 0.1 0.6 36th Month A5 3.4 3946 4.0 28. 44.5 38.3 A5 + Gl 4.8 3674 0.8 10.5 20.9 20.6 A5 + Le 4.8 3689 0.8 10.6 25.3 22.1 A5 + Ca 4.7 3880 0.8 10.7 25.7 22.7 A5 + Pm 3.8 3981 1.0 10.1 30.0 27.0 A5 + Gl + Pm 5.0 3119 0.6 2.8 25.9 19.1 A5 + Le + Pm 4.8 3321 0.7 3.1 27.6 19.3 A5 + Ca + Pm 5.1 3472 0.6 3.3 27.9 19.1 C 4.1 3015 0.2 1.0 17.8 7.3 LSD (0.05) 0.37 121.3 0.0 0.0 0.1 0.1 100a 100a 70d 60a
a = Threshold tolerable limit (Kabata-Pendias and Pendias, 1984).
Table 3: C/p index of the soil and some heavy metals as modified by the treatments
Treatment Ni Pb Zn Cu
3rd Month A5 0.024a 0.16b 0.45c 0.65d A5 + Gl 0.022a 0.15b 0.44c 0.50c A5 + Le 0.022a 0.15b 0.44c 0.52d A5 + Ca 0.021a 0.15b 0.43c 0.47c A5 + Pm 0.021a 0.18b 0.63d 0.81e A5 + Gl + Pm 0.021a 0.17b 0.60d 0.55d
3.0
4.3 4.1 4.1 3.5 4.4 4.6 4.5 4.0 0.22 3.2 4.6 4.3 4.7 3.6 4.6 4.5 4.7 4.0 0.22 3.3 4.7 4.5 4.5 3.6 4.8 4.5 5.0 4.0 0.30
146
Udom, Ano and Chukwu NJSS/22(1)/2012

A5 + Le + Pm 0.21a 0.18b 0.59d 0.55d A5 + Ca + Pm 0.21a 0.17b 0.60d 0.52d C 0.003a 0.01a 0.27c 0.12b 6th Month A5 0.023a 0.15b 0.47c 0.51d A5 + Gl 0.011a 0.15b 0.44c 0.47c A5 + Le 0.012a 0.15b 0.44c 0.48c A5 + Ca 0.015a 0.15b 0.45c 0.48c A5 + Pm 0.021a 0.17b 0.64d 0.60d A5 + Gl + Pm 0.017a 0.16b 0.55d 0.51d A5 + Le + Pm 0.018a 0.16b 0.57d 0.49c A5 + Ca + Pm 0.019a 0.15b 0.56d 0.49c C 0.002a 0.02a 0.26c 0.12b 12th Month A5 0.039a 0.08a 0.58d 0.65d A5 + Gl 0.024a 0.06a 0.47c 0.45c A5 + Le 0.024a 0.07a 0.49c 0.46c A5 + Ca 0.024a 0.07a 0.48c 0.45c A5 + Pm 0.025a 0.10a 0.66d 0.56d A5 + Gl + Pm 0.022a 0.07a 0.55d 0.47c A5 + Le + Pm 0.023d 0.07a 0.55d 0.49c A5 + Ca + Pm 0.024a 0.07a 0.55d 0.49c C 0.003a 0.01a 0.27c 0.12b 18th Month A5 0.039a 0.28c 0.63d 0.71d A5 + Gl 0.011a 0.15b 0.36c 0.63d A5 + Le 0.011a 0.15b 0.45c 0.60d A5 + Ca 0.013a 0.15b 0.45c 0.52d A5 + Pm 0.019d 0.16b 0.62d 0.68d A5 + Gl + Pm 0.010a 0.15b 0.56d 0.61d A5 + Le + Pm 0.013a 0.15b 0.44c 0.65d A5 + Ca + Pm 0.012a 0.16b 0.45c 0.65d C 0.003a 0.02a 0.25b 0.17b 24th Month A5 0.039a 0.28c 0.64d 0.65d A5 + Gl 0.009a 0.15b 0.31c 0.44c A5 + Le 0.009a 0.15b 0.37c 0.45c A5 + Ca 0.009a 0.16b 0.38c 0.45c A5 + Pm 0.003a 0.14b 0.49c 0.55d A5 + Gl + Pm 0.008a 0.15b 0.45c 0.46c A5 + Le + Pm 0.008a 0.15b 0.44c 0.48c A5 + Ca + Pm 0.008a 0.15b 0.43c 0.47c C 0.003a 0.02a 0.25b 0.12b
30th Month
A5 0.040a 0.28c 0.63d 0.65d
A5 + Gl 0.008a 0.11b 0.31c 0.36c
A5 + Le 0.008a 0.12b 0.37c 0.42c
A5 + Ca 0.003a 0.11b 0.38c 0.42c
A5 + Pm 0.013a 0.10b 0.44c 0.47c
A5 + Gl + Pm 0.007a 0.11b 0.39c 0.37c
147
Contaminatant limit of heavy metals

A5 + Le + Pm 0.007a 0.10b 0.42d 0.38c
A5 + Ca + Pm 0.007a 0.10b 0.42c 0.40c
C 0.002a 0.011a 0.26c 0.12b
36th Month
A5 0.04a 0.28c 0.64d 0.64d
A5 + Gl 0.01a 0.11b 0.30c 0.35c
A5 + Le 0.01a 0.11b 0.36c 0.37c
A5 + Ca 0.01a 0.11b 0.37c 0.38c
A5 + Pm 0.01a 0.10b 0.43c 0.45c
A5 + Gl + Pm 0.01a 0.03a 0.37c 0.32c
A5 + Le + Pm 0.01a 0.03a 0.40c 0.32c
A5 + Ca + Pm 0.01a 0.03a 0.40c 0.32c
C 0.002a 0.01a 0.26c 0.12b
a = Very slightly contaminated
b = Slightly contaminated
c = Moderately contaminated
d = Severely contaminated
e = Very severely contaminated
CONCLUSION
It is indicated that Gliricidia sepium, Leucaena
leucocephala and Calapogonium cerulean can
mitigate toxicity levels of Ni, Pb, Zn and Cu
and also reduce soil acidity. Within 18 to 36
months, there was general reduction in c/p
index for Pb, Zn, and Cu in plots treated with
legume plants. Consequently, they are an
excellent bioremediators of heavy metal
contaminated soils, and can be exploited in
clean-up of heavy metal contaminated soils.
However, the absence of any adverse growth
effect on these plants highlight the danger of
these metals being bioavailable to consuming
animals or humans through the food chain.
REFERENCES
Akamigbo, F. O. R. and Igwe, C. A. 1990.
Morphology, geography, genesis and
taxanomy of three soil series in eastern
Nigeria. Samaru Journal of
Agricultural Research 7: 33-48.
Alloway, B. J. and 1990. Heavy Metals in
Soil. John Wiley and Sons Inc. New York. Pp 57
Alloway, B. J. and Ayres, D. C. 1997. Chemical Principles of Environmental Pollution. Champman and Hall Publishers pp. 395.
Amadi, A., Dickson, A. A. and Maate, G. O.
1993. Remediation of oil pollution soil I: Effects of organic and inorganic nutrient supplement on the performance of maize (zea mays). Water, Air, Soil Pollution. 66:54-76.
Anoliefo, G. O. and Vwioko, D. E. 1995.
Effects of spent lubricating oil on the growth of Capsicum annum L. and Lycopersicon esculenta Miller. Environmental. Pollution. 99:361-364.
Atuanya, E. I. 1987. Effect of waste engine oil
pollution on physical and chemical Properties of soil. A case study of Delta soil in Bendel State. Nigerian Journal of Applied Science 55:155 – 176.
Brown, S.L., Chaney, R. L., Angle, J. S. and
Baker, A. J. M. 1995. Zinc and Calcium uptake by hyperaccumulator Thlaspi caerulescens grown in nutrient solution. Soil Science Society of American Journal 59: 125 – 133.
148
Udom, Ano and Chukwu NJSS/22(1)/2012

Carter, M. R. (Ed.), 1993. Soil Sampling and
Methods of Analysis, Lewis
Publishers, Boca Raton, Florida pp.
368.
Chaney, R. L. 1994. Trace metal movement.
Soil-plant systems and bioavailability
of bio solids-applied metals In: Sewage
sludge land utilization and the
environment (eds) C. E. Clapp, W. E.
Lawson and R. H. Dowdy. Soil
Science Society of America Madison
WI. Pp 27 – 31.
Chen, H. and Cutright T. 2001. EDTA and
HEDTA effects on Cd, Cr and Ni
uptake by Helianthus annuus.
Chemosphere 45: 21 – 28.
Devez, A., Gomez, E., Gilbin, R. Elbaz-
Poulichet, F, Persin, F., Andrieus, P.
and Casellas, C. 2005. Assessment of
Copper Bioavailability and Toxicity in
vineyard run off waters by DPASV and
algal bioassay. Science of the Total
Environment. 348:82-92.
Ernst, W. H. 1996. Bioavailability of heavy
metals and decontamination of soils by
plants. Applied Geochemistry. 11:163-
167.
Gallizia, L., McKlean, S. and Banat, I. M.
2003. Bacterial degradation of phenol
and 2, 4- dichlorophenol. Journal of.
Chemical Technology and
Biotechnology 78:959-963.
Harayama, S., Kasai, Y. and Hara, A. 2004.
Microbial communities in oil-
contaminated sea water. Curr. Opin.
Biotechnology 15:205-214.
Kabata – Pendias, A. and Pendias, H. 1984.
Trace Elements in Soil and Plants.
CRC Press Boca Raton. pp. 49.
Lacatusu, R. 1998. Appraising levels of soil
contamination and Pollution with
heavy metals. European Soil Bureau
Research Report. No 4. pp. 48.
Merkl, N., Schulize – Kraft, R. and Infante, C.
2005. Assessment of tropical grasses
and legumes for phytoremediation of
petroleum – contaminated Soils. Water
and Air. Soil Pollution 165:195-209.
Nwadialo, B. E. 1989. Soil – landscape
relationship in Udi-Nsukka Plateau
Nigeria. Catana Verlag Pp. 11-120.
Udom, B. E., Mbagwu, J.S.C., Adesodun, J. K.
and Agbim, N. N. 2004. Distribution of
Zinc, Copper, Cadmium and Lead in a
tropical ultisol after long-term disposal
of sewage sludge. Environment
International 30. 467-470.
Vangronsveld, J. and Clijsters, H. 1994. Toxic
effect of metals In: Farayo, M.G and
Weinhein, V. C. H. (Eds). Plant and the
Chemical Elements. New York. Basel,
Cambridge. Tokyo. Pp 149 = 177.
149
Contaminatant limit of heavy metals

CHARACTERIZATION, CLASSIFICATION AND MANAGEMENT OF OLOKORO
SOILS UMUAHIA, ABIA STATE NIGERIA FOR INCREASED DIOSCOREA
DUMETORUM YIELDS.
ONYEKWERE, I.N.1, NWOSU, P .O.1, EZENWA, M . I. S.2 AND ODOFIN, A. J.2
1 Soil Science Division, NRCRI Umudike Abia State.
2 Soil Science Department, FUT Minna Niger State.
Email [email protected]
ABSTRACT
Trifoliate yam (Dioscorea dumetorum) is an important food security crop in Nigeria, it occupies
a prominent position in the diets and farming systems in the South East agroecological zone
especially in Abia State. Olokoro Soils, Umuahia South, Abia State, Nigeria grown to Trifoliate
yam (Dioscorea dumetorum) were studied characterised and classified. Profile pits were dug and
studied, using the rigid grid survey techniques, soil samples from pedogenetic horizons were
collected processed and analysed, and results showed that the soils colour ranged from dark
grayish brown (10 YR 4/2) to dark reddish brown, (5 YR 4/2), the soils were weakly to strongly
aggregated, and posses loamy sand to sandy clay loam textures. pH ranged from 4.5 to 4.9
organic carbon ranged from 5 to 36mg kg-1. The exchangeable bases and CEC were low while
the base saturation ranged from 31 to 50%.
Based on the criteria of soil Taxonomy the soils have been classified as Haplic Nitosol in the
FAO/UNESCO Soil Map of the world legend. Integrated use of lime inorganic and organic
fertilizer is recommended to ameliorate the soils and to increase and sustain good yields
Key words: Characterization, Classification, Management, Olokoro Soils, Dioscorea
Dumetorum, Yields.
INTRODUCTION Trifoliate yam (Dioscorea dumetorum) is an
all important food security crop in Nigeria and
variously grown by resource poor farmers.
Mostly women who intercrop it with maize,
vegetables, cassava, okra cowpea etc. it
occupies a prominent position in the diets and
farming systems in South Eastern Agro-
ecological Zone especially in Abia State,
Nigeria.
Nutritionally Dioscorea dumetorum is superior
to commonly consumed yams, having high
protein, minerals and vitamins most especially
vitamin A contents. Research has shown that
it contains crude protein content of 11.07%,
fibre content of 2.06% and total carotenoid
content of 217.73 (ug/100g) (Ezeocha et al.
2009).
The cultivation of this medicinal crop is
seldom practiced now, and not much research
attention is given to it. And can be included
among the neglected crops. The problem of its
neglect extends to yield. This low yield can
be attributed to inherent low fertility of the
soils because soil is a vital natural resources
in which many agricultural activities take
150
Onyekwere, Nwosu, Ezenwa and Odofin NJSS/22(1)/2012

place, so must be managed to guarantee high
productivity and sustain yield.
Adoption of soil management option that will
guarantee high productivity basically depends
on the nature and properties of the soil.
Characterization of soil is helpful in the
appraisal of soil productivity (Mgbagwu et al,
1983) and as well determines optional type of
soil management.
However, for Dioscorea dumetorum, farmers
in Olokoro Umuahia Abia State, Nigeria
recorded an increase in the present yields. The
knowledge of the soil properties and
classification will enable their proper use,
management and technology transfer.
Therefore, the objective of this work was to
characterize and classify Olokoro soils,
Umuahia, Abia State, Nigeria and give
possible management measures for an increase
in Dioscorea dumetorum yields.
MATERIALS AND METHODS
The surveyed area covered about 600 hectares
and is located in Olokoro Umuahia South
Local Government Area (LGA) of Abia State
Nigeria. The area falls within the tropical
rainforest zone and lies between latitude 50 271
and 50 28 N and 70 291 to 70 321 E, situated at
the elevation of 154.25m cutting across
Federal Girls College Umuahia through
National Cereals Research Institute Amakama
Olokoro Outstation to National Root Crops
Research Institute Umudike, representing the
three geographical locations of Olokoro
(Azuiyi, Epe and Umutowe).
The soils are derived from coastal plain sand.
The total annual rainfall of the area is about
2.200mm, the mean annual temperature is
about 310C and the mean annual relative
humidity is about 75%. The soils occupy very
complex upper, middle and lower slopes
positions but the overall micro-relief consist of
slightly undulating to gently sloping terrain of
not more than 3% gradient.
A detailed soil survey using the rigid grid
format was conducted. Transverses were cut
along a properly aligned base line at 300m
intervals while auger borings were made at
25cm interval to a depth of 100cm. Physical
and morphological (colour, texture, structure,
consistency and inclusions) soil descriptions
were made, Following which three soil units
were delineated. Then three profile pits were
dug and described according to the guideline
for profile pit description (Soil Survey Staff,
1998). Soil samples were collected from
identified soil horizons packaged in soil bags,
then labeled and transported to the laboratory
for analysis.
The soil samples were air dried, gently
crushed, sieved through a 0.5mm sieve
because of organic carbon and total Nitrogen
and analysed in the laboratory using standard
routine methods. Soil pH (H20) was
determined in 1:2 soil/water suspensions using
a glass electrode. Organic carbon was
determined using Walkey and black titration
method, total nitrogen was determined using
Kyeldahl method; available phosphorus was
determined using Bray P 1 of Bray and Kurtz
method. Exchangeable bases were extracted
using IN NH4OAC at pH 7 and determined by
the EDTA titration method and Ca, K and Na
by flame photometry method and Mg by
EDTA titration, using Molybdenum blue
Colorometry.
RESULTS AND DISCUSSION
Meteorological Properties
The Meteorological data of the study area are
shown in Table 1.
151
Classification of Olokoro soils

Table 1: Ten Years Meteorological Data of the Study Area
Temperature (oC) Rainfall (mm) Rel humidity (%) Sunshine
Year Minimum Maximum Days Amount 1500 900 Hours
1999 22.67 31.10 159 2701.3 63 79 4.6
2000 23.25 31.92 138 1680.6 66 77 4.2
2001 22.33 31.33 137 2351.4 64 79 4.5
2002 22.67 31.25 137 2351.4 64 79 4.4
2003 22.83 31.75 134 2256.5 66 79 4.1
2004 22.42 31.92 123 1911.4 63 78 4.1
2005 22.50 32.08 147 2064.8 67 80 4.3
2006 22.75 31.50 122 2038.3 66 81 4.9
2007 22.42 31.67 142 2416.7 62 76 4.1
2008 22.58 31.50 141 2395.6 61 76 4.7
Source: National Cereals Research Institute Amakama Olokoro Out-station Meteorological Unit.
Morphological Properties
Data of the morphological properties of the soils studied are shown in Table 2.
Table 2: Field Morphological Description of Pedons Studied Horizon Depth Matrix
Colour
Texture Structure Consistency
(Moist)
Boundary Other
Feature
Pedon 1
AP 0-15 5YR 3/2 LS 1fsg vfr Cs m2rts
AB 15-35 5YR 4/3 SL 1fsbk fr Gs m2rts
Bt1 35-70 5YR 4/6 SCL 2msbk fr Cs f2rts
Bt2 70-110 5YR 4/4 SCL 2msbk fr Gs m2rts,
3chcl
Bt3 110-150 5YR 3/2 SL 2msbk fr - f2rts, 3chcl
Pedon 2
AP 0-27 5YR ¾ SL 2msbk sfm Cw m1rts,m3rts
AB 27-56 5YR 5/6 SCL 2msbk fm Gw m1rts
Bt1 56-98 5YR 5/6 SCL 2msbk fm Cw f2rts
Bt2 98-150 5YR 4/6 SCL 2msbk vfm - f2rts
Pedon 3
AP 0-15 10 YR 4/2 SL 1msg fr Gw m1rts
AB 15-40 10 YR 4/3 SL 1msbk fr Gw m1rts
Bt1 40-85 10 YR 4/4 SCL 2msbk fr Gw f1rts
Bt2 85-120 7.5 YR 5/4 SCL 2msbk fm Gw f2rts
Bt3 120-150 7.5 YR 5/6 SCL 2msbk fm - f2rts
Short hand Notation and Meaning for Table 1:
Boundary: a = abrupt, b = broken, c = clear, d = diffuses, s = smooth, w = wavy, I = irregular.
When a dash (-) is present the property is not recorded.
Structure: sbk = sub angular blockly, sg = single grained, c = coarse, cr = crumb, f = fine, m =
medium, l = weak, 2 = moderate, 3 = strong.
Consistency: Sfm = slightly firm, frm = firm, vfm = very friable, fr = friable.
Texture: s = sand, SCL = sandy clay loam, Sl = sandy loam, LS = loamy sandy.
Remarks: rts = roots, m = many, c = common, f = few, q = fine, 2 = medium, 3 = coarse, Fe-mm
= manganiferrous concretion
Qtz = quartz fragments, Fe = iron nodules, chcl = Charcoal
152
Onyekwere, Nwosu, Ezenwa and Odofin NJSS/22(1)/2012

Morphological Properties
The field morphological properties of the
pedons studied are presented in table 2. The
soils include very deep drained, loamy sand to
sandy clay loam dark grayish brown (10 YR
4/2) to dark reddish brown (5 YR 3/2) at the
upper horizon, sandy clay loam dark brown
(10 YR 4/3) to dark reddish brown (5 YR 3/2)
moist at the sub-soils. The rather deep nature
of the soils can be attributed to the nature of
the parent materials of the soils, which is
coastal plain sands (Federal Ministry of
Agriculture and Natural Resources, 1990).
The loamy sand to sandy clay texture of the
soils confers a weak single grained to
moderate medium sub-angular blocky
structure.
Physical properties
The physical properties of the pedons studied are shown in table 3.
Table 3: Physical Properties of the Pedons Studied
Horizon Depth Particle Size clay
(%)Silt
(%)
Silt
Clay +
Silt
(%)
Silt/Clay
Ratio
Texture
Class
Pedon 1
Ap 0-15 81.40 14.80 18.6 18.60 0.22 LS
AB 15-35 80.80 16.80 2.40 19.20 0.14 SL
Bt1 35-70 71.81 16.79 3.40 28.20 0.14 SCL
Bt2 70-110 73.81 24.80 3.39 26.20 0.15 SCL
Bt3 110-150 75.80 18.80 5.40 24.20 0.29 SL
Pedon 2
Ap 0-27 76.60 21.60 1.80 23.40 0.08 SL
AB 27-56 77.52 19.78 2.70 22.50 0.14 SCL
Bt1 56-98 68.01 29.59 2.40 32.00 0.08 SCL
Bt2 98-150 62.01 36.00 1.40 37.40 0.04 SC
Pedon 3
Ap 0-15 86.24 9.20 4.56 13.76 0.50 SL
AB 15-40 78.24 19.20 2.56 21.76 0.13 SL
Bt1 40-85 72.24 24.20 3.56 27.76 0.15 SCL
Bt2 85-120 72.24 25.20 2.56 27.76 0.15 SCL
Bt3 120-150 73.24 25.20 1.56 26.76 0.06 SCL
Particle Size Distribution
The sand fraction of the pedons studied ranged
from 62.01 to 86.24%, in pedon one it
decreased down the depth, whereas there was
no definite pattern of distribution in the other
pedons.
The silt content ranged from 1.40 to 18.60%
and did not maintain any particular pattern of
distribution. The clay content ranged from
9.20 to 36.00%, and increased with depth in
pedon three which is as a result of elluviation-
illuviation processes going on in the soils and
it fails to maintain any pattern of distribution
in other pedons. (Silt + Clay) % values of the
soils ranged from 13.76 to 37.40%, which is
corroborated by Ezenwa (1987).
The values of silt/clay ratio of the soils ranged
from 0.04 to 0.50, an indication that apart from
soils of AP and Bt3 horizons in pedon 1 and
AP horizon in pedon 3 all the soils are old
soils derived from old parent materials
Ayolagha (2001) reported that “old” parent
materials usually have silt/clay ratio less than
0.15 with low degree of weathering, and
Asmoa (1985) reported that soils with silt/clay
ratio less than 0.25 indicates low degree of
weathering.
153
Classification of Olokoro soils

Textural Classification
The textual classification of the AP horizons in
all the pedons studied ranged from sandy loam
to sandy clay loam. Generally the textual
classification of these soils agrees with
optimum criterion of light medium loams,
sandy soils (Onyekwere et al 2009) required
for unhindered anchorage and bulking of roots
and tubers and for easy harvest. This gives the
indication that these soils are conducive for
Dioscorea dumetorum production
Primary Nutrients N, P and K are primary nutrients most
commonly demanded by root and tuber crops
most especially Dioscorea dumetorum as well
as other crops in plant nutrition. This explains
why most compound fertilizers and fertilizer
requirements for this crop are based on N, P
and K (Onyekwere et al 2009). The results of
these nutrients are shown in Table 4
Table 4: Primary Nutrients of the Pedons Studied
Horizon Depth (cm) Total N (%) Available P
(mgkg-1)
Exchangeable
K
Cmol (+) kg-1
Pedon 1
Ap 0-05 0.14 36.00 0.07
AB 15-35 0.11 36.00 0.03
Bt1 35-70 0.06 18.00 0.04
Bt2 70-100 0.08 30.00 0.04
Bt3 100-150 0.10 31.00 0.03
Pedon 2
Ap 0-27 0.21 33.00 0.07
AB 27-56 0.16 8.00 0.04
Bt1 56-98 0.15 7.00 0.40
Bt2 98-150 0.14 5.00 0.03
Pedon 3
Ap 0-15 0.08 9.00 0.02
AB 15-40 0.06 11.50 0.03
Bt1 40-85 0.04 15.50 0.03
Bt2 85-120 0.01 15.60 0.01
Bt3 120-150 0.01 20.00 0.05
Total Nitrogen
The total nitrogen content of the soils studied
ranged from 0.01 to 0.21%. apart from soils of
Pedon 1 the values of other Pedons decreased
down the slope. The surface soils (AP
horizons) had total nitrogen content range of
0.08 to 0.21% with a mean value of 0.14%.
Apart from that of pedon 2 that had value
exceeding the critical level of 0.15% required
for sustainable Dioscorea dumetorum
production. The remaining pedons studied
were deficient in total N. The low content of
total N in the soils could be attributed to low
organic matter of these soils, since inorganic N
is accounting for only a small portion of total
N in soils (Almu and Audu 2001). The low
amount of total N reflects the amount of
organic carbon in the soils. Variable response
to applied nitrogen was thus expected in these
soils.
Available Phosphorus
The available phosphorus values of the pedons
ranged from 7.00 to 36.00 mgkg-1. Pedon 1
had no definite pattern of distribution of
available P. Pedon 2 values decreased with
depth, while those of pedon 3 increased with
depth. The upper horizons had values that
ranged from 9.00 to 36.00 mgkg-1, with a
mean value 26 mgkg-1. The mean value
154
Onyekwere, Nwosu, Ezenwa and Odofin NJSS/22(1)/2012

obtained exceeded the critical limit of
8.0mgkg-1. Bray 1-P established for crops in
South Eastern Nigeria including Dioscorea
dumetorum (FPDD) 1989) and the critical
level of 15 mgkg-1 Bray 1 extractable P
recommended by Thomas and Peaslee (1973)
cited by Onyekwere et al. (2009). This result
showed that the soils had the available P
requirement for Dioscorea dumetorum
production.
Exchangeable Potassium
The values of the exchangeable K of the soils
studied ranged from 0.01 to 0.07 cmol (+) kg-1.
Pedons 1 and 3 did not maintain any definite
pattern of distribution of exchangeable K,
while values of pedon 2 decreased with depth.
The surface soils had values that ranged from
0.02 to 0.07 cmol (+)kg-1, with a mean value of
0.05 cmol (+)kg-1, having values below the
critical limit of 2.0 cmol (+)kg-1 recommended
for soils of South Eastern Nigeria (FPDD)
1989),for Dioscorea dumetorum production.
These suggest that all the soils will show
substantial responses to applied potassium.
According to Chukwu (1997), Olokoro
farming area is subjected to annual and
seasonal bush burning which occur about
January to April. Burning deprives the soils of
natural organic matter from vegetation and
exposes the soils to erosive impact of heavy
annual precipitation (about 2000mm) in this
area. This aggravates leaching due to the
coarse nature of the soils. There is high
demographic pressure in the area necessitating
unavoidable pressure on the land in quest for
food and money with consequential reduction
in fallow periods. These factors explain the
deficiencies of total N and exchangeable K
observed.
Table 5: Selected Chemical Properties of the Pedon Studied
Horizon Depth
(cm)
pH
(H20)
0C
%
Exchangeable
Bases
Ca Mg Na
Exch. Acidity CEC
(cmol (+)Kg-1 NH4OAC
ECEC Base
Salt
(%)
Pedon 1
Ap 0-15 4.9 2.06 0.58 1.65 0.09 1.40 6.29 3.80 38.00
AB 15-35 4.9 1.50 0.39 1.15 0.04 1.60 6.42 3.20 50.00
Bt1 35-70 4.8 0.70 0.39 0.96 0.09 1.40 3.10 2.90 48.00
Bt2 70-100 4.8 0.90 0.39 0.96 0.10 1.20 2.98 2.80 50.00
Bt3 100-150 4.9 1.75 0.80 1.60 0.08 5.2 7.90 7.72 32.6
Pedon 2
Ap 0-27 4.9 2.27 0.30 2.50 0.09 6.10 11.19 8.86 31.00
AB 27-56 4.7 1.27 0.80 1.60 0.08 5.20 7.88 7.72 32.60
Bt1 56-98 4.8 0.99 1.00 1.40 0.09 5.20 8.25 8.09 35.70
Bt2 98-150 4.7 0.69 0.60 1.60 0.08 5.30 10.00 7.81 32.00
Pedon 3
Ap 0-15 4.9 1.75 0.40 0.60 0.06 0.80 2.70 1.88 40.00
AB 15-40 4.7 0.99 1.46 0.70 0.02 2.00 4.42 4.21 50.00
Bt1 40-85 4.8 0.66 1.16 0.77 0.04 4.00 6.06 4.00 33.30
Bt2 85-120 4.5 0.67 1.65 0.15 0.01 2.10 3.96 2.35 46.00
Bt3 120-150 4.9 0.16 1.16 0.38 0.08 1.00 3.90 3.10 41.00
155
Classification of Olokoro soils

Selected Chemical Properties
Selected chemical properties of the pedons
studied are presented in Table 5.
Soil Reaction
The soil reaction expressed as pH (H20) were
strongly acidic, with a range of 4.5 to 4.9.
There was no definite pattern of changes in pH
down the slope in all the pedons studied. The
AP horizons had an average value of 4.9.
Liming the soils and increasing the base status
with organic manure provides good
amelioration option for Dioscorea dumetorum
yield.
Organic Carbon
The organic carbon content varied from very
low to moderate that is from 0.70 to 2.27%.
They were distributed irregularly down the
slope, apart from pedon 2 where it decreased
down the slope. The AP horizons had a value
range of 1.75 to 2.27% with a mean value of
2.03%. Maintenance of a satisfactory organic
matter status is essential to the production of
most of the Nitrogen and half of the
Phosphorus taken up by unfertilized crops
(Von Uxekull 1986), including Dioscorea
dumetorum
Exchangeable Bases
The soils are very low in their content
exchangeable Ca, with surface soils value that
varied from 0.30 to 0.58 cmol (+)kg-1.
Exchangeable Mg in the surface soils were
moderate with values that varied from 0.60 to
2.50 cmol (+)kg-1, while exchangeable Na
were low ranging from 0.06 to 0.09 cmol
(+)kg-1.
Effective Cation Exchange Capacity
(ECEC)
ECEC values of the soils varied from 1.88 to
8.86 cmol (+) kg-1. This result indicates that
the effective Cation Exchange Capacity of the
soils is low. The low ECEC and nutrient
reserves of the soils have been attributed to the
fact that soils of South Eastern Nigeria are
strongly weathered have little or no content of
weatherable rock in sand and silt fraction and
have predominantly kaolinite in their clay
fractions (FPDD, 1989).
Classification of the Soils
The soils were classified according to the
USDA Soil Taxonomy (Soil Survey Staff
1975) and correlated with the FAO/UNESCO
Soil Legend (FAO/UNESCO 1988). Table 6.
The soils are formed under udic moisture
regime. There is an evidence of argillic,
horizon, and presence of an old and well
developed B horizon, so the three pedons were
therefore classified as ultisols. The soil finally
met the requirement for classification as Typic
Paleudult under the subgroup level. In the
FAO/UNESCO all the soils of the three
pedons were classified as Dystric Nitosol.
Table 6: Taxonomic Classification of Soils Studied
Pedon USDA FAO/UNESCO
Pedon 1 Typic Paleudult Haplic Nitosol
Pedon 2 Typic Paleudult Haplic Nitosol
Pedon 3 Typic Paleudult Haplic Nitosol
CONCLUSION AND RECOMMENDATION From the study it was revealed that the soils
were deep, well drained, loamy sand to sandy
clay loam, dark grayish brown to dark reddish
brown, acidic, with low to moderate nitrogen,
low exchangeable K and organic carbon
content while the available P contents were
low to high. The textual classification of the
soils were conducive for the production of
Dioscorea dumetorum. The soils were
classified as Typic Paleudult under USDA soil
156
Onyekwere, Nwosu, Ezenwa and Odofin NJSS/22(1)/2012

Taxanomy and as Dystric Nitosol under
FAO/UNESCO system.
For sustainable increase in the production of
Dioscorea dumetorum, the following
recommendations are made:
Stop burning of grasses after clearing of
farms.
Living the crop residues after harvesting.
Liming the soils to an appreciable pH level at
the rate of 0.5 to 1 ton/ha .
Use of organic fertilizer to increase the organic
carbon base of the soils.
Nitrogen fertilization at the rate of 90kgN/ha
for pedon 1 and 3, 45kgN/ha for pedon 2 to
increase the total N content of the soils. Phosphorus fertilization at the rate of 25mgkg-1 for pedons 2 and 3 and Potassium fertilization
at the rate of 75kg K20/ha for all the pedons to
increase the exchangeable K content. (or
application of 600kg NPK/ha)
REFERENCES
Almu, H, and Audu M.D. (2001). Physico-
chemical Properties of Soils of A' Awa
Irrigation Project Area Kano State in
Management of Wetland Soils for
Sustainable Agriculture and
Environment. Pp 135-139.
Asomoa. G.K. (1983). Particle size and free
Iron oxide distribution in some
Latosols and ground water Lacterites
of Ghana Geoderma 10:285-297.
Chukwu, G.O (1997). Conserving uplands
through sloping agriculture Land
technology. Proceeding Forestry
Association of Nigeria Conference
Ibadan. Pp 293-298.
Ezenwa, M .1.S. (1987). Some physico-
chemical Characteristics of Soils Is of
Basement Complex and Adjoining
Basaltic Rocks of Northern part of
Nigeria in Soil Resources for Rural
Development. Pp 205-214.
Ezeocha, V.C., Oti, E, Etudaye H and Aguyo
(2009). Effect of Variety on the
Chemical Composition of Trifoliate
Yam (Dioscorea dumetorum) in Global
food crisis and Nigerian Agriculture.
Pp 963-964.
FAO/UNESCOP, (1988). Soil Map of the
World. World Soil Resources Report
60 F AO, United Nations, Rome.
FMA and NR, (1990). Literature Review on
Soil Fel1ility Investigation in Nigeria
(in five folumes). Federal Ministry of
Agriculture and Natural Resources
Abuja. Pp 281.
FPDD (1989). Literature on Soil Fertility
Investigation in Nigeria produced by
the Federal Ministry of Agriculture
and Natural Resources Lagos.
Mbagwu, J.S.C. Lal, R. and Scott T.W.
(I983). Physical properties of 3 soils in
Southern Nigeria Soil Sci. 136(1 )48.
Onyekwere, I.N, Chukwu, G.O. and Ano, A.O.
(2009). Characteristics and
Management of Soils of Akamkpa
Area, Cross River State Nigeria for
increased Cocoyam Yields. Nig. Agric.
Journal 40 NO.1:271-278.
Soil Survey Staff (J 975). Soil Taxonomy a
basic system of Soil Classification for
making and interpreting soil surveys
U.S. Govt. Printing Office Washington
D.C.
Soil Survey Staff (1998) Keys to Soil
Taxonomy SMSS Technical
Monograph No. 19 5th edition,
Pocahontas Press Inc. Blacksburg
Virginia.
Von Uxehull H.R. (1986). Efficient fertilizer
use in Acid Upland Soils of the humid
tropics. F AO fertilizer and Plant
Nutrition bulletin No.1 O. 59 pp.
157
Classification of Olokoro soils

RHEOLOGICAL PROPERTIES OF SOIL GROUPS IN CENTRAL SOUTH-EASTERN
NIGERIA IN RELATION TO OTHER PHYSICAL PROPERTIES
E.U. ONWEREMADU, B.N. NDUKWU, G.E. OSUJI AND M.A. OKON
Department of Soil Science and Technology, Federal University of Technology,
P.M.B. 1526 Owerri, Nigeria E-mail: [email protected]
ABSTRACT Rheological properties of soils formed over different parent materials were investigated in
central southeastern Nigeria in 2010. Random sampling technique quided by the geology of the
study area was employed in field studies. A total of 150 soil samples were subjected to
laboratory analyses. Soil data were analyzed using analysis of variance (ANOVA) of the PROC
mix-model of SAS. Means were separated by standard error of difference at 5% level of
probability. Correlation coefficient was used to estimate the degree of relationship between
rheological properties and soil physical attributes. There was significant (p<0.05) positive
relationship between gravimetric moisture content or clay and rheological properties. Sand had
significant (p<0.05) negative relationship with plasticity index.
Keywoards: Parent materials, Rheology, Physical properties, Tropical soils.
INTRODUCTION The strength of soils changes with differences
in soil water content. But, responsiveness of
soil groups to soil water vary due to other
inherent soil attributes as well as management
factors. Brady and Weil, (1999) remarked that
soil moisture, plasticity and particle size of
soils determine stability of soils in response to
loading forces from traffic, tillage and building
foundations.
In central southeastern Nigeria, six major soil
groups were identified as alluvial, coastal plain
sands, false bedded sandstones, lower coal
measures, shale and upper coal measures –
formed soils (Onweremadu, 2006). These soil
groups vary in their soil moisture retention
capacity as well as particle size distribution.
Ndukwe et al. (2009) reported rheological
differences among Nigerian clays. Clay
content, nature of clay, nature of exchangeable
cations and organic matter content of soils
vary, and these influence plasticity and general
activity levels of soils. Clay has much greater
cohesion, plasticity and activity than other
primary soil particles. Differences in the
aforementioned attributes alter hydraulic
properties of soils as including water flow
characteristics of the pedosphere. There exists
spatial heterogeneity in soil water behaviour
(Gerke et al., 2001) and non-uniform water
repellency in different soils under diverse
vegetation types (Dekker et al., 2001) and land
use (Hallet et al., 2004). Based on these, we
investigated variability in rheological
properties of soils formed over different parent
materials in central southeastern Nigeria.
Study Area The study was conducted in the central
southeastern Nigeria (Abia and Imo State)
lying between latitudes 4040’ and 70 15’N, and
158
Onweremadu, Ndukwu, Osuji and Okon NJSS/22(1)/2012

longitudes 6040’ and 8015’E. Soils are derived
from alluvium, coastal plain sands, false
bedded sandstones, lower coal measures, shale
and upper coal measures. Central southeastern
Nigeria is characterized by lowlands except for
North-east lying hilly landscapes. It has a
humid tropical climate with mean annual
rainfall ranging from 1800 to 2500 mm. The
annual temperature ranges from 26oC to 31oC
while its relative humidity is generally high
throughout the year. Central southeastern
Nigeria is a typical rainforest area,
characterized by multiple vegetal forms
dominated by oil palm trees (Elaeis
guineensis). The plants are arranged in tiers
and evergreen.
Field Sampling Prior to field studies, a reconnaissance visit
was made. Field soil sampling was guided by a
geologic map of the study area. Five soil
profile pits were dug on each of the six soil
groups, namely alluvium, coastal plain sands
(Benin formation), false bedded sandstones
(Ajalli formation), lower coal measures
(Mamu formation), shale (Bende-Ameki
formation) and upper coal measures (Nsukka
formation). In all, a total of 30 profiles pits
were dug and described using the FAO (1998)
guidelines. One hundred and fifty soil samples
were used for the study. These soil samples
were air dried and sieved using a 2mm sieve.
In addition to the above, 150 core soil samples
were collected from profile pits based on
horizon differentiation and used for bulk
density determinations.
Laboratory Analysis Particle size distribution was determined by
hydrometer method and bulk density was
estimated by core procedure. Atterberg limits
were determined by Cassagrande method
while plasticity index was computed as liquid
limit minus plastic limit. Soil moisture was
measured gravimetrically.
Data Analysis Soil physical and rheological data were
subjected to analysis of variance of the PROC
Mix model of SAS (Little et al., 1996). Means
were separated using standard error of the
difference at 5% level of probability.
Relationship between rheological properties
and other soil physical properties were
estimated using correlation analysis.
RESULTS AND DISCUSSION Soil physical properties varied significantly
(p<0.05) among soil groups except bulk
density (Table 1). Higher values of sand sized
particles were reported in soils formed over
upper coal measures, alluvium, coastal plain
sands and false bedded sandstones while clay
predominated in soils derived from shale and
lower coal measures. This pattern reflected in
the gravimetric moisture content, with shale-
derived soils having highest value (460 g kg-1)
while least value was reported in soils formed
over upper coal measures (208 g kg-1)
Table 1: Some soil physical properties
Parent Material Sand Silt Clay BD Gm
Gkg-1 (Mgm-3) (g kg-1)
Alluvium
Coastal plain sand
False bedded sandstones
Lower Coal Measures
Shale
Upper Coal Measures
SED 0.05
P-Value
808
694
744
475
377
835
58.3
<0.0001
42
73
73
202
131
32
25.2
<0.0001
150
233
183
323
492
133
45.8
<0.0001
1.45
1.41
1.46
1.42
1.45
1.47
0.03
ns
278
315
288
417
460
208
51.4
<0.0001
BD = bulk density, M = gravimetric moisture content.
159
Rheological properties of soil

Rheological properties of soil groups are
shown in Table 2 and values differ
significantly (P<0.05). Soils formed over shale
and lower coal measures had higher plasticity
values of 32.7 and 22.4, respectively. The
plasticity of these soil groups could be a
reflection of clay content of soils as soils
derived from shale and lower coal measures
indicated higher clay content. Plasticity index
values affected shrinkage behaviour of soil
groups as given by the coefficient of linear
extensibility (Table 2).
Table 2: Rheological soil properties
Parent material LL PL Pl COLE
Alluvium
Coastal plain sand
False bedded sandstones
Lower Coal Measures
Shale
Upper Coal Measures
SED 0.05
P-Value
27.7
9.7
30.0
33.4
59.5
3.5
1.32
<0.0001
3.7
1.4
15.4
11.0
27.8
2.0
0.76
<0.031
24.0
8.3
15.0
22.4
32.7
1.5
0.53
<0.0001
0.011
0.025
0.031
0.058
0.101
0.008
0.004
0.0002
LL = liquid limit, Pl = Plastic limit, P1 = Plasticity index
COLE = Coefficient of linear extensibility.
High clay contents of soils derived from shale
and lower coal measures as opposed to other
four groups imply the possibility of higher
activity in the forms which portends instability
of soils especially under high engineering
activity.
Rheological figures were significant (p<0.05),
indicating positive correlations betwen
rheological attributes and particle size
fractions (Table 3).
Table 3: Relationship between rheological properties and some physical properties (n=150).
Factor Correlated Pearson Correlation Coefficient (r) Significance (P<0.09)
COLE vs m
COLE vs Clay
COLE vs BD
COLE vs Sand
LL vs BD
LL vs Sand
PL vs m
PL vs Clay
P1 vs M
P1 vs BD
P1 vs Sand
0.73
0.61
0.06
0.48
0.03
0.53
0.71
0.65
0.67
0.02
0.31
<0.0001
<0.001
Ns
<0.0001
Ns
<0.0001
<0.001
<0.001
<0.001
ns
ns
COLE = coefficient of linear extensibility, m = gravimetric moisture content, BD = bulk
density, LL = liquid limit, PL = plastic limit, P1 = plastic index.
Atterberg limits (Liquid limit, plastic limit and
plasticity index) had significant (p<0.05)
positive relationship with gravimetric moisture
and clay content. Coefficient of linear
extensibility had strong positive relationship
with gravimetric moisture and clay contents.
These findings suggest possible use of these
soil physical attributes in predicting these
rheological properties in soil groups of central
Southeastern Nigeria. Sand content had
significant (p<0.05) correlation with
rheological properties (Table 3), implying its
160
Onweremadu, Ndukwu, Osuji and Okon NJSS/22(1)/2012

efficacy in predicting soil behaviour in the
study area.
Strong relationship between soil moisture and
plasticity index (r = 0.67, p<0.0001) (Table 3)
indicates that soil moisture is a major
determinant of soil compressibility (McNabb
and Boersma, 1996) among other factors such
as bulk density (1mhoff et al., 2004). But, the
r-value (0.67) suggests that other
undetermined factors could be influencing
plasticity of soil groups.
REFERENCES Dekker L.W., Doerr, S.H., Ooshridie, K.,
Ziogas, A.K. and Ritsema, C.J. (2001).
Water repellency and critical soil water
content in sludge sand. Soil Sci. Soc.
Am. J., 65: 1667-1674.
Food and Agricultural Organization (1998).
Guidelines for soil profile description,
2nd edition/Rome. Pp 66.
Gerke, H.H., Hangen E., W. Schaaf and
Huunfi, R.F. (2001). Spatial variability
in potential water repellency in a
linguistic mine soil afforested with
Pinus Nigra Geoderma. 102: 252-274.
Hallet, P.D., Nunan, N., Douglas, J.T. and
Young, I.M. (2004). Millimeter-scale
spatial variability in soil water
sorptivity: Scale surface elevation and
sub critical repellency effects. Soil Sci.
Soc. Am. J., 68: 352-358.
Imhoff, S., Daa Silva, A.P. and Fallow, D.
(2004). Susceptibility to compaction,
load support capacity and soil
compressibility of Hapludox. Soil Sci.
Soc. Am. J., 68: 17-24.
Little, R.C., G.A., Millikin W.W.., Strong,
R.C. Wolfinger (1996). SAS System
for mixed models. Statistical System
Inc. Cary, North Carolina, U.S.A. 633
pp.
McNabb, D.H. and Boersma, L. (1996). Non-
linear model for compressibility of
partly saturated soils, Soil Science Soc.
Am. J., 60: 333-34.
Ndukwe, O.C.N. Onweremadu, E.U. and U.M.
Nyoyoko (2009). Nigerian local clay:
A possible substitute for bentonite in
drilling fluid (spud mud) based on
rheology int. J. Eng., 3 (3): 311-317.
Onweremadu, E.U. (2006). Application of
geographical information systems on
soils and soil related environmental
problems in Southeastern Nigeria. A
Ph.D Thesis of the Department of Soil
Science, University of Nigeria,
NSUKKA, 330 pp.
161
Rheological properties of soil

RESPONSES OF MELON (COLLOCYNTHIS CITRULLUS ) AND SOIL CHEMICAL
PROPERTIES TO DIFFERENT N - SOURCES IN ADO – EKITI, SOUTHWESTERN
NIGERIA
B. OSUNDARE
Department of Crop, Soil, and Environmental Sciences
University of Ado – Ekiti, Nigeria
ABSTRACT A two – year field experiment was conducted at the Teaching and Research Farm of the University of Ado – Ekiti, Ekiti State, Nigeria, during 2008 and 2009 cropping seasons to determine the effects of different N – sources on soil nutrient status and yield of melon (Collocynthis citrullus). The experiment was laid out in a randomized complete block design with three replicates. The different sources of N were: Calcium ammonium nitrate (CAN), Ammonium sulphate (AS), Urea (U), NPK 15 – 15 – 15 and control i.e. no fertilizer (NF). The results indicated that there were significant (P=0.05) differences among the various N – sources with respect to their effects on soil nutrient status and yield of melon. The percentage decreases in soil organic carbon (SOC) after cropping were 58, 39, 49, 28 and 21 for NF, CAN, AS, U and N P K, respectively. Similarly, application of the different N – sources resulted in decreases in total nitrogen after cropping by 48, 26, 40, 14 and 7% for NF, CAN, AS, U and NPK 15 – 15 – 15, respectively. Averaged over two – years of experimentation, values of melon seed yields were 0.37, 0.61, 0.85, 1.22 and 1.15 t ha-1 for NF, U, CAN, NPK and AS, respectively. Key words: N – sources, fertility, yield, melon.
INTRODUCTION Low soil nitrogen has been reported to be a limiting factor to crop production in many parts of the world (Harriz, 2006; Been et al; 2011). Nitrogen plays key roles in the growth and development of crops. It influences the yields mainly through leaf area expansion, which in turn, increases the amount of solar radiation intercepted, and dry matter production (Cam, 2009; Brader, 2011). In many parts of the world, sources of nitrogen commonly used include Diammonium phosphate (DAP), Calcium ammonium nitrate (CAN), Sulphate of ammonia (SA) or Ammonium sulphate (AS) and compound fertilizers, such as NPK 15 – 15 – 15; 20 – 20 – 20 (Kurtz, 2004; Sas, 2006). Other sources of N include urea and ammonium nitrate, depending on their local availability (Kurtz; 2004). However, the use of sulphate of
ammonia is discouraged due to its high residual acidity (Sas, 2006). Previous studies had demonstrated significant effects of different N – sources on the growth and yield of melon (Adeuya, 2008; Cern, 2010; Mucido, 2010). In all these studies, significant differences among N – sources with respect to their effects on growth and yield attributes of melon were reported. Similarly, significant effects of N sources on major soil nutrients had been demonstrated by Fessil (2009); Cheng (2009); Handra (2011). Elsewhere, in the tropics, few studies had been conducted on the growth and yield of melon, as affected by different sources of N. In view of the paucity of published work on different N sources on melon performance, this study sought to investigate the effects of different
162
Osundare NJSS/22(1)/2012

sources of N on soil nutrient status and melon performance. MATERIALS AND METHODS Study site: A two – year field experiment was carried out at the Teaching and Research Farm of the University of Ado – Ekiti, Ekiti State, Nigeria, during 2008 and 2009 cropping seasons. The soil of the study site is an Alfisol (SSS, 2003) of the basement complex, highly leached, and with low to medium organic matter content. The site of study had earlier been cultivated to certain arable crops, among which were maize, melon, cassava before it was left to fallow for some years prior to the commencement of this study. The fallow vegetation was manually slashed and thereafter, the land was ploughed and harrowed. Collection and analysis of soil samples: Prior to planting, ten core soil samples, randomly collected from 0 – 15 cm top – soil , were bulked to form a composite, which was analyzed for physical and chemical properties. At the end of the second cropping season, another set of soil samples was collected and analyzed. The soil samples were analyzed in accordance with the procedures outlined by IITA (1989).
Experimental design and treatments: The experiment was laid out in a randomized complete block design with three replicates. The N – sources were: Calcium ammonium nitrate (CAN), Ammonium sulphate (AS), Urea (U), NPK 15 – 15 – 15 and control i. e. no fertilizer (NF). All the different N – sources fertilizers were applied at the rate of 200 kg ha-1 (Fondufe, 1995) in two split doses, at four and six weeks after planting (WAP). Planting and weeding: Planting was done on March 12 and March 20 in the respective 2008 and 2009 cropping seasons. Two melon seeds were planted per stand at a spacing of 1 m x 1 m, but later thinned to one plant per stand (10,000 plants ha-1), three weeks after planting. Weeding was carried out manually at 3 and 6 WAP, using a hand hoe. Collection and analysis of data: At harvest, data were collected on yield and yield components of melon. All the data collected were subjected to analysis of variance (ANOVA), and treatment means were compared, using the Duncan Multiple Range Test (DMRT) at 5% level of probability. RESULTS The physical and chemical properties of soil in the study site before cropping are presented in Table 1.
Table 1: The physical and chemical properties of soil in the study site before cropping Parameters Values pH Organic carbon (g kg-1) Total nitrogen (g kg-1) Available phosphorus (mg kg-1)
5.6 0.95 0.58 0.86
Exchangeable bases (cmol kg-1) Potassium Calcium Magnesium Sodium Acidity ECEC
0.44 0.40 0.60 0.51 0.32 2.27
Texture (g kg-1) Sand Silt Clay
680 200 120
163
Effect of N sources on melon and soil

Changes in soil nutrient status after cropping Table 2 shows the soil nutrient status as
affected by N – sources at the end of the
experiment.
CAN resulted in 18% increase in soil pH after
cropping, while contrasting decreases of 18,
32,29 and 46% for NF, AS, U and NPK,
respectively. The percentage decreases in soil
organic carbon (SOC) after cropping were 58,
39, 49, 28 and 21 for NF, CAN, AS, U and
NPK, respectively. Similarly, the percentage
decreases in total nitrogen after cropping were
48, 26, 40, 14 and 7 for the respective NF,
CAN, AS, U and NPK. N – sources decreased
available P after cropping by 47, 38, 28, 21
and 13% for NF, CAN, AS, U and NPK 15 –
15 – 15, respectively. Similarly, decreases in
exchangeable K were 59, 43, 18, 32 and 9%
for NF, CAN, AS, U and NPK, respectively.
Application of CAN resulted in 40% increase
in exchangeable Ca, compared to decreases of
33, 15, 3, and 13% for NF, AS, U and NPK,
respectively. In addition, decreases in
exchangeable Mg were 57, 45, 20, 32 and 43%
for NF, CAN, AS, U and NPK and for Na,
decreases were 65, 51, 26, 39 and 14% for
NF, CAN, AS, U and NPK, respectively.
Table 2: Soil nutrient status as affected by different N – sources after cropping Treatments Org. C Total N Av. P Exchangeable bases (cmol kg-1)
(N-sources) pH (g kg-1-) (g kg-1) (mg kg-1) K Ca Mg Na
Control
CAN
AS
Urea
NPK
4.6b
6.3a
3.8c
4.0c
3.0d
0.40e
0.58c
0.48d
0.68b
0.75a
0.30e
0.43c
0.35d
0.50b
0.54a
0.46e
0.53d
0.62c
0.68b
0.75a
0.18e
0.25d
0.36b
0.30c
0.40a
0.27d
0.56a
0.34c
0.39b
0.35c
0.26d
0.33c
0.48a
0.41b
0.34c
0.18e
0.25d
0.38b
0.31c
0.44a
Mean values in the same column followed by the same letter are not significantly different at
P=0.05
Seed yield, and yield components of melon
Table 3 shows the effects of N – sources on
seed yield, number of fruits per plant and
average fruit weight of melon at harvest.
On the two – year average, values of melon
seed yield were 0.37, 0.66, 0.85, 1.22 and 1.15
t ha-1 for NF, U, CAN, NPK and AS,
respectively. Similarly, values of number of
fruits per plant were 4.3, 6.1, 7.9, 10.4 and 9.0
for NF, U, CAN, NPK and AS, respectively.
Values of average fruit weight were 0.54, 0.70,
0.87, 1.10 and 0.97 kg for NF, U, CAN, NPK
and AS, respectively.
Table 3: Seed yield, number of fruits per plant and average fruit weight of melon as
affected by different N – sources at harvest Treatments Melon seed yield (t ha-1) Number of fruits per plant Average fruit weight (kg)
(N-sources) 2008 2009 Mean 2008 2009 Mean 2008 2009 Mean
Contrtol
Urea
CAN
NPK
AS
0.40e
0.64d
0.89c
1.25a
1.18b
0.33e
0.58d
0.81c
1.19a
1.11b
0.37
0.61
0.85
1.22
1.15
4.6e
6.3d
8.0c
10.6a
9.1b
4.0e
5.9d
7.8c
10.1a
8.8b
4.3
6.1
7.9
10.4
9.0
0.56e
0.71d
0.90c
1.12a
1.00b
0.51e
0.68d
0.83c
1.07a
0.93a
0.54
0.70
0.87
1.10
0.97
Mean values in the same column followed by the same letter are not significantly different at
P=0.05
DISCUSSION
In this study, the decreases in the soil organic
carbon (SOC) after cropping, observed in all
the plots where different N – sources fertilizers
were applied agree with the findings of Kowal
(2009) and Idah (2011), who obtained
significant decreases in soil organic matter
(SOM), at termination of experiments
involving mineral fertilizer application. This
observation can be adduced to the fact that, the
addition of the synthetic fertilizers may have
resulted in the provision of favourable soil
164
Osundare NJSS/22(1)/2012

conditions for the soil microbes with resultant
stimulated organic matter decomposition. In
view of the decline in SOM, associated with
inorganic fertilization, the addition of organic
fertilizers (plants and animal remains) to
inorganic fertilizers – treated soils is strongly
recommended.
The decreases in virtually all the nutrients after
cropping, observed in the plots where N –
sources fertilizers were not applied (i.e.
control) can be ascribed to uptake by melon as
well as leaching losses. Similarly, the
decreases in the soil pH in the control plots
after cropping can be attributed to decreases in
the exchangeable bases, due perhaps, to
leaching and / or melon uptake. The increase
in soil pH after cropping, associated with
application of CAN can be adduced to the
increase in the value of exchangeable Ca, as
CAN contains Calcium ions (Ca2+). The
decrease in available P and exchangeable K,
Mg and Na can be attributed to melon uptake,
as P is indispensable in the formation of good
root system, flowering and seed production in
plants. The decrease in soil pH (i. e. increased
acidity), observed in the plots where
ammonium sulphate [(NH4)2SO4] fertilizer
was applied can be adduced to the acidifying
effects of ammonium sulphate due to hydrogen
ions (H+), resulting from oxidation of the
ammonium ion (NH4+). Besides, this
observation can be attributed to the decreases
in the exchangeable bases, associated with
ammonium sulphate application.
The decreases in N value after cropping,
obtained in plots where CAN, ammonium
sulphate and urea were applied can be
attributed to melon uptake, leaching and
ammonia volatilization, since these three
fertilizers contain ammonium ions (NH4+),
which are readily reduced to ammonia gas
(NH3) in the soil. Although, differences were
obtained in the quantity of N lost through
ammonia volatilization from these fertilizers,
due to differences in their composition and
properties. For instance, in CAN, half of the N
is in form of NH4+, while the rest half is in
form of nitrate (NO3-) . So, only half of the
applied N (i.e. NH4+ form) is therefore
vulnerable to volatilization, which is a distinct
advantage over the other ammonium –
containing fertilizers. The decreases in N, P
and K values after cropping, despite the
addition of NPK fertilizer, implies that these
nutrient elements were absorbed and utilized
by melon.
The significantly higher value of melon seed
yield for CAN than that of urea agrees with the
findings of Adeuya (2008); Cern (2010);
Mucido (2011). This observation points to the
superiority of CAN to urea, as far as nitrogen
nutrition of melon is concerned. The
superiority of CAN stems from its ability to
supply N in the forms of NH4+ and NO3
-,
compared with urea, that can only supply N in
the form of NH4+. Thus, the presence of NH4
+
and NO3- in CAN accounts for the higher
yield performance of melon in CAN than the
urea (Osaki et al; 1995). Besides, CAN has
Calcium ions (Ca2+) which is an extremely
important element in the maintenance of cell
membrane integrity, as well as cell division,
hence, stimulating growth and development in
plants. Moreover, the calcium element helps
in the neutralization of soil acidity, hence,
enhancing availability of certain nutrient
element in the soil (Kurtz, 2004).
Much as the significant difference in melon
seed yield between CAN and urea can be
ascribed to the aforementioned factors,
however, another factor that can be implicated
for the significant differences between CAN
and urea in melon seed yield performance is
the difference between CAN and urea. This is
in the respect to the amount of N lost in the
form of an ammonia gas through volatilization
from these two N – sources. This is because
the amount of N lost in CAN through
volatilization is not as high as that of N lost in
urea.
The higher value of melon seed yield for
ammonium sulphate than that for urea and
CAN can be attributed to the presence of
165
Effect of N sources on melon and soil

sulphur in the ammonium sulphate fertilizer,
as sulphur has been reported as one of the
essential nutrient elements needed for
satisfactory growth and development of crop
plants (Osaki et al; 1995). The highest melon
seed yield value consistently recorded for
NPK fertilizer treatment can be ascribed to the
complementary roles of P and K in the
nutrition of melon. Therefore, for a good
melon performance, the recommendation of a
judicious and balanced combination of these
three nutrient elements is imperative.
CONCLUSION
Application of nitrogen from different N –
fertilizer sources resulted in significant
decreases in soil organic carbon , total N,
available P and exchangeable bases at the end
of each year experiment. The increases in
seed yield and yield components of melon
under different N – sources can be ranked as:
control < urea < CAN < AS < NPK.
REFERENCES Adeuya, O. (2008): Effects of N – sources on
melon yield performance. Journal of
Applied Sciences. 21: 1-5
Been, T; Osai, K.O; Loe, B.S. (2011): Study
on factors responsible for nitrogen
deficiencies of the Tropical soils. Soil
Science. 16:21 – 25.
Brader, I. A. (2011): Long – term trends in the
fertility of soils under continuous
cereal cultivation. International Journal
of Pure and Applied Sciences. 40:203 –
209.
Cam, W.F. (2009): Effects of poultry manure
on soil physico – chemical properties
and maize yield In southeastern
Nigeria. Soil Fertility Research.
26(21):321 – 326.
Cern, B.R. (2010): Influence of fertilizer types
and tillage practices on the yield of
melon interplanted with maize. Plant
Nutrition. 18:17 – 24.
Cheng, M.I. (2009): Soil fertility evaluation
under different sources of N – fertilizers. Journal of Agriculture and Applied Sciences. 60:423 – 428.
Fessil, C. (2009): Comparative effects
fertilizer types on soil nutrient status and tuber yield of white yam in Ghana. Soil and Plant Science. 17:11 – 17.
Fondufe, E.Y. (1995): Assessment of different
fertilizer models for application under different cropping systems. Ph.D Thesis, University of Ibadan, Nigeria. 282 pp.
Handra, D. E. (2011): Long – term effects of
application of N – fertilizers on an Alfisol in northern Province of Cameroon. Soil Science Research. 28:111 – 116.
Harriz, A.D. (2006): Nitrogen nutrition of
melon. M. Sc. Dissertation, Ahmadu Bello University, Zaria, Nigeria. 61 pp.
Idah, S.O. (2011): Tillage and soil organic matter dynamics. Soil Organic Matter.
16:25 – 32. IITA, (1989): Automated and semi –
automated methods of soil and plant analysis. Manual Series, No 7, IITA, Ibadan, Nigeria.
Kowal, E. H. (2009): Soil organic carbon
under long – term tillage practices. Soil Fertility and Tillage Research. 22:153 – 159.
Kurtz, E. C. (2004): Urea in root and tuber
crops production. Soil Fertility and Plant Nutrition. 17:81 – 86.
Mucido, M. M. (2011): Effects of inorganic
fertilizer types and weeding frequency on yield and yield components of melon. Crop Physiology. 12:110 – 115.
166
Osundare NJSS/22(1)/2012

Osaki, M; Sshirai, J. Shinamo, T. and Tadano,
T. (1995): Effects of ammonium and
nitrate assimilation on the growth and
tuber swelling of potato plants. Soil
Science and Plant Nutrition. 41 : 709 –
719.
Sas, E. Z. (2006): Evaluation of efficacy of N
– fertilizers in improving soil fertility
and crop yield. European Journal of
Soil and Crop Science. 61: 709 – 719.
Soil Survey Staff (SSS) (2003): Keys to soil
taxonomy, 9th edition. USDA Natural
Resources Conservation Services, U.S.
Department of Agriculture,
Washington D.C. 306 P.
167
Effect of N sources on melon and soil

ASSESSMENT OF DEGRADATION STATUS OF SOIL IN SELECTED AREAS OF
BENUE STATE SOUTHERN GUINEA SAVANNA OF NIGERIA
A.O. ADAIKWU1, M.E. OBI2 AND A. ALI3 1&3Department of Soil Science, University of Agriculture P.M.B 2373,
Makurdi, Benue State, Nigeria. [email protected] 2Department of Soil Science University of Nigeria Nsukka
ABSTRACT
The assessment of degradation status of soils in selected areas of Benue state was carried out in
2009. The physical and chemical properties of these soils were evaluated in the laboratory and
the results obtained were compared with the standard indicators and criteria for land degradation
assessment according to FAO, 1979. The results showed that most of the cultivated parts of the
study areas were highly degraded compared to the soils under vegetative fallow which were
moderately degraded. The textural composition of the soil ranged from loamy sand to sandy
loam to clay loam. Saturated Hydraulic conductivity ranged from 0.31 to 0.74 cmh-1
corresponding to slow and moderate permeability. The pH ranged from slightly to moderately
acidic condition in some locations and strongly acidic in the eroded parts. The organic matter
was very low in all the study areas. Available phosphorus was low in all the locations. Total
Nitrogen was predominantly very low in most of the cultivated areas to low in the fallow soils.
Cation Exchange capacity (CEC) also ranged from very low to low. The soils were classified as
follows: SIWES Farm Typic ustochrepts, Obarike Oju, Vertic tropaquept and Otobi Typic
Kandiaqualf. NYSC farm, Typic Kandiustalf; Adum-Ito, Typic Kandiustalf; and Otukpa, Oxic
Ustropept. It is recommended that soil conservation practice should be intensified in these areas.
The practice should include the use of organic manure such as cow dung and poultry droppings
for the fertilization of the fragile low fertility soils. There should also a programme for periodic
monitoring of the fertility status of the soil from the time the soil is first cultivated.
INTRODUCTION
Soil degradation is one of the greatest
challenges facing mankind. Its extent and
impact on human welfare and the global
environment is more severe now than ever
before. Due to its enormous impact, soil
degradation leads to political and social
instability. It is associated with enhanced rate
of deforestation, intensive use of marginal and
fragile soil, accelerated runoff and erosion,
pollution of natural waters, and emission of
green house gases into the atmosphere.
Soil degradation means a reduction of the
biological and economic productivity
potentials of rain-fed cropland, irrigated
cropland or range, pasture and forested land by
one or a combination of processes (Amalu,
1998). Such processes include, among others,
displacement of soil materials by wind and
water erosion, deterioration of soil physical
and chemical properties and long-term loss of
natural vegetation.
168
Adaikwu, Obi and Ali NJSS/22(1)/2012

The principal types of soil degradation are
physical, chemical, and biological degradation
(FAO 1994). Physical degradation refers to the
deterioration of the physical properties of the
soils. It includes soil compaction and hard
setting, soil erosion and sedimentation and
laterization. Biological degradation of the soil
includes a reduction in soil organic matter
(OM) content, decline in biomass carbon, and
decrease in activity of soil flora and fauna,
high soil and air temperature due in part, to the
use of chemicals and soil pollutants. Chemical
degradation is caused majorly by nutrient
depletion and excessive leaching of cation in
soils with low activity clay. The buildup of
some toxic chemicals and elemental imbalance
that are injurious to plant growth also
constitute chemical degradation of the soil.
In the Southern guinea savanna, particularly
Benue State, which is regarded as the “Food
Basket of the Nation”, farming is the
predominant economic activity. The
continuous unguided use of the soils for
agricultural production and other benefits had
exposed the soils to different forms of
degradation
The Objectives of the Study:
The main aim of this study is to assess the
degree of degradation of soils in selected areas
of Benue State using some soil quality
indicators with a view to making modest
recommendations on the rehabilitation and
proper management of degraded soils. It has
the following specific objectives;
1. To conduct a reconnaissance survey of
the selected study areas in Benue State
so as to identify appropriate study sites.
2. To assess the level of soil degradation in
the study areas through the laboratory
evaluation of some selected soil quality
indicators.
3. To establish the degree of degradation of
the soils of the study areas using
standard indicators and criteria for soil
degradation assessment (FAO, 1979).
MATERIALS AND METHODS
The Study Area
The study areas are in Benue state popularly
known as the Food Basket of the nation.
Benue falls within latitudes 6o20N to 7o55N
and longitudes 7o30E and 9o40E. It shares
boundaries with six other states of Nigeria,
these include, Nassarawa to the north, Taraba
and Cross River to the south, Enugu and
Ebonyi to the South East and Kogi to the
West. It has a land area of about 30,955 square
kilometers. The state is bounded on the north
by 280km of River Benue and traversed by
202km of River Katsina-Ala in the Inland
areas.
Study Sites The followings areas were selected for the
assessment:
i. NYSC Farm, Nyiev Udei village in
Guma LGA of the State;
ii. SIWES Farm, University of
Agricultural Makurdi;
iii. National Root Crop Research Institute
(NRCRI), outpost, Otobi;
iv. Adum-Ito in Obi local Government
Area;
v. Odoba–Otukpa near Audu Ogbe’s
Cashew plantation Local Government
Area;
vi. Obarike in Oju Local Government
Field Methods
Soil sampling was carried out from January to
June 2009. In each of the study sites, an area
of two hectares of land was chosen and a bulk
sample, comprising of 20 auger points,
randomly selected, was collected and properly
labeled. In addition at each of these study sites,
soil samples were collected from an adjacent
soil at a distance of about 100m away.
Samples were labeled as A and B respectively
for such location. Samples labeled ‘A’ were
from the cultivated areas while sample ‘B’
represented soils under fallow condition. The
sampling covered 0 – 15cm depths for the
surface and 15-30cm for the subsurface. A
core sampler was also used to collect soil
samples for bulk density determination.
169
Assessment of degradation of soil

At each of these locations, a soil profile pit
was dug at site ‘A’. The topography was
described in terms of slope, physiography and
drainage based on field observations. The soils
were classified according to Soil Survey Staff
(1994). The present and past land use histories
were obtained partly through field
observations and partly through
interviews/interactions with the local farmers.
The soil samples were then taken to
NICONSOL Laboratory, University of
Agriculture, Makurdi, for evaluation
Laboratory Methods Particle Size Distribution The Bouyoucos
hydrometer method (1951) was used to
determine the particle size distribution of the
samples, while the soil textures were
determined using the USDA textural triangle.
Bulk Density The soil dry bulk density was
determined using the core method
Soil Total Porosity:
The total porosity of the soil samples was
calculated from the relationship.
% F = (1 – Bd/pd) x 100
Where F = porosity
Bd = bulk density g/cm3
Pd = particle density of the soil estimated at
2.65 g/cm3
Saturated Hydraulic Conductivity
The constant head method was used to
determine Ksat.
Soil Chemical Analysis
A total of 24 composite samples were air dried
ground and sieved to collect soil fraction less
than 2 mm size. These represent four samples
in each of the locations. The sampling covered
the depths of 0-15cm and 15-30cm for the
cultivated (A) and the fallow (B) soils. Twenty
three samples were also drawn from the 6
profile pits dug during the field study. The
following chemical properties of the soil were
analyzed.
Soil pH The soil pH in water (1:1) and in KCl
(1:1) were determined by electrometric
method.
Organic Carbon The wet oxidation method
of Walkley and Black (1934) was used to
determine the organic carbon content of the
soil samples.
Total Nitrogen This was determined by the
Macro-Kjeldahl digestion method (Jackson,
1965).
Cation Exchange Capacity (CEC) The CEC
was determined by neutral, 1N Ammonium
acetate method.
Available Phosphorus Bray-1 method was
used to determine the extractable phosphorus
(Bray & Kurtz, 1945).
Exchangeable Bases
Ca and Mg These cations were determined
by EDTA titration method (Jackson, 1965).
Sodium (Na) and Potassium (K) The EDTA
extracts of Na and K were determined with
flame photometer at Benue State Rural Water
Supply and Sanitation Agency, Makurdi.
Base Saturation This was calculated by
dividing the sum of exchangeable bases by
CEC and multiplying by 100.
Effective Cation Exchange Capacity
(ECEC) This was calculated by summing up
the exchangeable bases plus the exchangeable
acidity.
Exchangeable Sodium Percentage (ESP)
This was calculated by dividing the
exchangeable sodium by CEC.
Soil Degradation Assessment
The degradation status of the soils in the
various locations was assessed by field
observation and the standard indicators and
criteria for land degradation assessment by
Food and Agricultural Organization (FAO,
1979). Table 1 shows these indicators and
criteria. The four degrees of degradation
identified includes:
170
Adaikwu, Obi and Ali NJSS/22(1)/2012

1. Slightly degraded soil, where
productivity ranges between 75-100%.
2. Moderately degraded soil, productivity
range between 50-75%.
3. Highly degraded soil, productivity is
between 25-50%.
4. Very highly degraded, productivity is
between 0-25%
Table 1 Indicators and Criteria for Land Degradation Assessment
Indicator Degree of Degradation
1 2 3 4
Soil bulk density
(g/cm-3)
<1.5 1.5 – 2.5 2.5 – 5 < 5
Permeability (cm/hr) <1.25 1.25 – 5 5 – 10 > 20
Content of Nitrogen Element
(multiple decrease) N (%)
>0.13 0.13 – 0.10 0.10 – 0.08 <0.08
Content of Phosphorus Element
(cmol kg-1)
>8 8 – 7 7 – 6 < 6
K content (cmol kg-2) >0.16 0.16 – 0.14 0.14 – 0.12 <0.12
Content of ESP (Increase by % of
(CEC)
<10 10 – 25 25 – 50 < 50
Content of Base Saturation (Decrease
of saturation in more than 50%
<2.5 2.5 – 5 5 – 10 > 10
Excess salts (Salinization) (Increase in
conductivity mmhos/cm/vr
<2 2 – 3 3 – 5 < 5
Content of humus in soil >2.5 2.5 – 2 2 – 1.0 <1.0
Source: FAO (1979)
Key: Class 1: None-slightly degraded. Class 3: Highly Degraded
Class 2: Moderately degraded. Class 4 Very Highly Degraded
RESULTS AND DISCUSSION
Physical Properties of the Soils in the Study
Areas: The result of the particle size distribution
obtained in this study as presented in Table 2
indicates different textural composition of the
soils. The textural classes are the intrinsic
properties of the soils, which are sufficiently
permanent and are often used to characterize
the soil physical make up (Hillel, 1980). The
fallow soils in the six locations indicated
higher clay content compared with the
cultivated (Table 2). This agrees with Troech
and Thompson, (1993) who argues that good
soil management practice may marginally
increase the clay content and improve
productivity but cannot change the textural
class of the soil. According to Fitz-Patrick
(1986), the textural class of the soil is a
function of weathering in asociation with
parent materials influenced by climate over
time. The texture of the soil has high influence
on the physical and chemical properties of the
soils which are used as quality indicators for
soil degradation assessment.
171
Assessment of degradation of soil

Table 2: Physical Properties of the Soils of the Study Areas Location Depth
(cm) Bulk
Density (gcm-3)
Total Porosity
(%)
Sat. Hydr condc.
(cmhr-1)
Sand (%)
Silt (%)
Clay (%)
Textural Class
SIWES Farm
0-15A 15-30A 0-15B 15-30B
1.44 1.46 1.52 1.56
46 45 43 41
0.62 0.65 0.53 0.57
88 86 80 78
10 12 12 14
2 2 8 8
Loamysand Loamysand Sandyloam Sandyloam
Oju 0-15A 15-30A 0-15B 15-30B
1.85 1.97 1.69 1.74
30 26 36 36
0.31 0.33 0.51 0.53
46 44 58 58
18 18 20 20
36 38 22 22
Clayloam Clayloam Loam Loam
Otobi 0-15A 15-30A 0-15B 15-30B
1.54 1.49 1.64 1.64
42 44 38 38
0.58 0.58 0.58 0.57
78 76 61 60
15 13 19 16
7 11 20 24
Sandyloam Sandyloam Sandyloam Loam
NYSC 0-15A 15-30A 0-15B 15-30B
1.36 1.39 1.48 1.5
49 48 44 43
0.59 0.55 0.55 0.57
61 57 57 55
21 21 16 16
18 22 27 29
Loam Loam Loam Loam
Adum 0-15A 15-30A 0-15B 15-30B
1.28 1.33 1.54 1.51
52 50 42 38
0.79 0.74 0.65 0.60
85 58 69 65
12 8
14 14
3 7 17 21
Loamysand Loamysand Sandyloam Standyloam
Otukpa 0-15A 15-30A 0-15B 15-30B
1.45 1.46 1.58 1.60
46 45 40 40
0.74 0.69 0.58 0.55
85 85 69 67
12 12 18 20
3 3 12 13
Loamysand Loamysand Sandyloam Sandyloam
A-cultivated soils, B-fallow soils. The soil parameters used for the assessment of the physical degradation of the soils of the sites studied indicated that, on permeability rating; the soils were slightly degraded (SD) in all the studied sites (Table 5), FAO (1979). In addition, the soils were mostly moderately degraded (MD) with respect to bulk density (BD). The cultivated parts in SIWES farm as well as the subsurface (15-30 cm) of Otobi, NYSC farm, Adum-Ito and Otukpa all indicated SD soils with respect to BD. The BD of soil is greatly influenced by the organic matter (OM) content. The correlation between BD, clay and OM was significant. This implies that the lower BD in the cultivated part compared with the fallow were indications of lower clay content and OM in the former. The continuous cultivation of the soils tends to modify the soil BD and pore size distribution since the operation loosens, granulates and
crushes the soil particles. On the other hand, the high bulk density in the fallow soils compared with the cultivated soils agrees with Ojeniyi (1989), who reported higher BD with zero tillage compared with conventional tillage. This observation implies that the continuous exposure of untilled soils to intensive rainfall, without mechanical tillage could compact the soils. Moreover, in the Savanna region of Nigeria, Ike (1986) reported high BD under untilled soil compared with the cultivated ones. Ohiri (1988) reported significantly higher BD and penetrometer resistance for zero tilled soils compared with conventionally tilled soils. Kayombo and Lal (1984) indicated a range of 1.35–1.5 gcm-3 as the critical BD for cassava production in an alfisol.
172
Adaikwu, Obi and Ali NJSS/22(1)/2012

Chemical Properties of the Soils of the Study Areas The results of the chemical analysis of the soils in the six locations are presented in Table 3. From the table, the pH of the soil in water is predominantly moderate to slight acidic condition (USDA-SCS 1974). These are typical characteristics of savanna soils. Harpstead (1973) reported that Guinea Savanna soils were less leached and, hence of moderate to near neutral acid condition. The pH values in most of these areas were in the range of 5.5 to 6.5 (Table 3) which could be considered reasonably well for plant growth and development in the agroclimatic zone. Most soil quality indicators can be affected by the pH of the soil.
The cation exchange capacity (CEC) in the study areas are predominantly low, ranging below 12 cmol/kg in all the locations (Table 3). The low CEC may be related to the low organic matter (OM) content. Lal and Kang (1982) had observed that the higher the OM content of the soil, the higher the CEC. Lombin et al (1991) also reported that organic matter content was a major contributor to the CEC of the soil. The correlation between OM and CEC was significant, which agrees with the above position. The application of organic residue and the avoidance of bush burning are management practices that play important role in reversing the trend of nutrient depletion in conjunction with conversion to lower tillage system (Haine and Uren, 1990) and the establishment of mulches (Lal, 1986).
Table 3 Soil quality indicators (QI) for land degradation assessment
Locations Depth Cm
Bd g/cm3
Permeability Cm/hr
B.Sat %
N P K Esp OM
Cmol/kg (ppm) Cmol/kg % %
SIWES A 0-15 1.44 0.62 64 0.04 4.40 0.13 5.78 0.40 Farm A 15-30 1.46 0.65 64 0.08 4.40 0.10 5.61 0.40 B 0-15 1.52 0.53 63 0.13 5.56 0.17 3.53 1.19 B 15-30 1.56 0.57 56 0.13 5.46 0.16 2.94 1.10
Oju A 0-15 1.85 0.31 58 0.13 4.58 0.13 9.57 1.31 A 15-30 1.97 0.33 57 0.11 4.50 0.13 8.81 1.31 B 0-15 1.69 0.51 56 0.13 5.46 0.27 7.48 1.49 B 15-30 1.74 0.53 59 0.12 5.38 0.24 8.77 1.45
Otobi A 0-15 1.54 0.58 52 0.08 4.52 0.12 6.21 0.89 A 15-30 1.49 0.58 53 0.08 5.80 0.11 7.28 0.93 B 0-15 1.64 0.58 63 0.13 4.48 0.23 5.88 1.76 B 15-30 1.64 0.57 59 0.13 4.46 0.22 5.26 1.72
NYSC A 0-15 1.36 0.59 77 0.07 4.48 0.10 4.25 1.24 Farm A 15-30 1.39 0.55 70 0.08 4.00 0.08 3.77 1.14 B 0-15 1.48 0.57 70 0.13 4.56 0.24 3.69 1.72 B 15-30 1.50 0.55 66 0.14 4.52 0.22 2.43 1.72
Adum A 0-15 1.28 0.79 58 0.10 4.48 0.09 8.4 0.79 A 15-30 1.33 0.74 55 0.10 4.00 0.06 8.57 0.80 B 0-15 1.54 0.65 62 0.14 5.50 0.19 3.04 1.56 B 15-30 1.51 0.60 62 0.13 4.48 0.20 2.80 1.49
Otukpa A 0-15 1.45 0.74 70 0.10 4.48 0.11 7.71 0.69 A 15-30 1.46 0.69 60 0.08 4.46 0.10 6.50 0.73 B 0-15 1.58 0.58 62 0.13 4.52 0.15 3.29 1.56 B 15-30 1.60 0.55 66 0.13 4.50 0.19 2.67 1.45
173
Assessment of degradation of soil

The chemical degradation of the soils of these
studied sites indicated different degrees of
degradation with respect to the parameters
used. For instance, the soils were not-slightly
degraded (SD) with respect to exchangeable
sodium percentage (ESP) at the depth of 0-15
cm and 15-30 cm in all the studied sites.
Available phosphorus was VHD in all the
study sites (Table 5) FAO, (1979). Phosphorus
is the second most critical element influencing
plant growth and production throughout the
world. It is taken up by plants from soil
solution as orthophosphate anion H2PO4- or
HPO4. For southern guinea savanna
agroecology of Nigeria, Agbede (2009)
recommended 225 kg/ha or 4.5 bags of P for
soils that are low in available P (less than 8.0
ppm) for maize production.
The degree of degradation with respect to
potassium (K+) ranged from not-slightly
degraded (SD) to very highly degraded (VHD)
soils. The surface (0-15 cm) of the fallowed
soil in SIWES farm, the fallowed parts of
Otobi, NYSC farm, Adum-Ito and the
subsurface of Otukpa studied sites were all SD
with respect to K. The fallowed part of Oju
and the subsurface (15-30 cm) of the fallowed
part of the SIWES farm were moderately
degraded (MD). The cultivated parts of the
SIWES farm, Obarike Oju were highly
degraded (HD) and the cultivated parts of
Otobi, NYSC farm, Adum-Ito and Otukpa
were VHD with respect to K+.
With respect to nitrogen content, the
degradation status of the soils in these study
areas ranged from highly degraded (HD) in
most of the cultivated sites to moderately
degraded in the fallow soils (Table 5). All the
soils under fallow conditions were MD as well
as the cultivated sites of Obarike Oju and
Adum-Ito. The cultivated sites of the SIWES
farm, subsurface (15-30 cm) of Otobi, and
NYSC farm as well as the cultivated sites of
Otukpa were all HD with respect to N content.
Table 3 indicates very low nitrogen content in
most of the cultivated part to low in the fallow
soils. This trend is an indication of nutrient
loss in the farms due to continuous cultivation
as well as nutrient loss during the harvesting
period. Nitrogen as a soil quality indicator is
one of the key nutrients in plant growth.
Agbede (2009) listed nitrogen as the most
important of all the 16 essential plant elements
needed for plant growth, development and
reproduction and also the most easily limiting
or deficient throughout the world especially in
the tropics. Nitrogen as a mobile element can
easily be lost. The continuous cultivation
exposed the soil to sheet erosion which
washed away the top soil including plant
nutrients. For soils that are low in nitrogen
content (less than 0.15) Agbede (2009)
recommended 200 kg or 4 bags of urea or 383
kg or 7¾ bags of CAN for maize production in
southern guinea savanna agroecology of
Nigeria.
The rating of base saturation (BS) indicated
that the soils were predominantly VHD (Table
5). These include the cultivated site and the
surface (fallow) of SIWES farm, NYSC farm,
the fallow site of Adum-Ito and Otukpa. The
soils in Obarike-Oju, the cultivated part of
Otobi were HD with respect to BS while the
fallow parts of Otobi and the cultivated part of
Adum-Ito were MD with respect to BS.
The biological degradation was more
pervasive compared with the physical and the
chemical degradation in all the sites studied.
The soils at the surface (0 – 15 cm) and
subsurface (15 – 30 cm) of both the cultivated
and the fallow areas were very highly
degraded (VHD) with respect to organic
matter (OM) content (Table5) FAO, (1979).
This is an indication of very high biological
degradation, which is typical of savanna soils.
The values of organic matter (OM) content in
all the locations as presented in Table 3 were
very low (Metson, 1961). The very low
organic matter contents are indicative of very
high biological degradation of all the soils of
the study areas. The OM depletion may be, in
part, due to crop uptake exacerbated by
continuous cropping without adequate
174
Adaikwu, Obi and Ali NJSS/22(1)/2012

measures of nutrient replacement either
through the use of inorganic fertilizer or other
forms of soil conservation measures. However,
the low OM content is a phenomenon
associated with the savanna soils, which could
be due to high temperatures that rapidly break
down OM and inhibit nitrogen fixation by
rhizo-bacteria, (Harpstead, 1973). The practice
of bush burning that is most common in the
savanna could also destroy soil organisms and
cause reduction in the biodiversity of the soil’s
flora and fauna. Organic matter is closely
related to the CEC of the soil. Lal and Kang
(1982) reported that the higher the OM the
higher the CEC. The correlation between OM
and CEC was highly significant which agrees
with this position. Organic matter has direct
imprint on soil physical properties by
improving water transmission and root
penetration. Agbim and Adeoye (1991)
reported that OM improves soil permeability.
Kang and Balasubramania (1990) stated that
high rates of OM addition was needed to solve
the problem of soil acidity arising from
continuous cropping in West African Alfisols.
The contribution of animal wastes to increase
the level of soil OM had been reported by
Ojeniyi (2000), and by Okpara and Mbagwu
(2003). Gao and Cheng (1996) also observed
significant increase in organic carbon content
of the soil as a result of added organic
amendments in tropical soils with low activity
clays, low CEC and low plant nutrient levels.
Proper management of organic matter is highly
desirable. Agbede (2009) recommended that
incorporated crop residue must be of high
quality, that is, must have C/N ratio of below
20/1. Leguminous plants provide such high
qualityresidues.
Table 4: Assessment of Individual Soil Quality Indicators (QI)
Locations
Depth
(cm)
B.D.
(gcm-3)
Permeability
(cm/hr)
B. Sat
(%)
N
(%)
P
(ppm)
K
(cmol/kg)
ESP
(%)
Om
(%)
SIWES
Farm
Obarike
Oju
Otobi
NYSC
Farm
Adum
Ito
Otukpa
A
A
B
B
A
A
B
B
A
A
B
B
A
A
B
B
A
A
B
B
A
A
B
B
0 - 15
15-30
0 –15
15-30
0-15
15-30
0-15
15-30
0-15
15-30
0-15
15-30
0-15
15-30
0-15
15-30
0-15
15-30
0-15
15-30
0-15
15-30
0-15
15-30
SD
SD
MD
MD
MD
MD
MD
MD
MD
MD
MD
SD
SD
SD
SD
MD
SD
SD
M D
M D
SD
SD
M D
M D
SD
SD
SD
SD
SD
SD
SD
SD
SD
SD
SD
SD
SD
SD
SD
SD
SD
SD
SD
SD
SD
SD
SD
SD
VHD
VHD
VHD
HD
HD
HD
HD
HD
HD
HD
MD
MD
VHD
VHD
VHD
VHD
M D
M D
VHD
VHD
VHD
VHD
VHD
VHD
HD
HD
MD
MD
MD
MD
MD
MD
MD
MD
VHD
HD
VHD
HD
MD
MD
MD
MD
MD
MD
HD
HD
M D
M D
VHD
VHD
VHD
VHD
VHD
VHD
VHD
VHD
VHD
VHD
VHD
VHD
VHD
VHD
VHD
VHD
VHD
VHD
VHD
VHD
VHD
VHD
VHD
VHD
HD
HD
SD
MD
HD
HD
MD
MD
SD
SD
VHD
VHD
VHD
VHD
SD
SD
VHD
VHD
SD
SD
VHD
VHD
M D
SD
SD
SD
SD
SD
SD
SD
SD
SD
SD
SD
SD
SD
SD
SD
SD
SD
SD
SD
SD
SD
SD
SD
SD
SD
VHD
VHD
VHD
VHD
VHD
VHD
VHD
VHD
VHD
VHD
VHD
VHD
VHD
VHD
VHD
VHD
VHD
VHD
VHD
VHD
VHD
VHD
VHD
VHD
H.D. ------------- Highly degraded; VHD ----------Very highly degraded
Key: SD --------------- None-Slightly degraded; M D. -----------Moderately degraded
Assessment of degradation of soil

A-cultivated soils, B-fallow soils CONCLUSIONS An investigation was conducted in 2009 to assess the degree degradation of the soils in some selected areas of Benue state. The main objective was to assess the degree degradation of the soils in these study areas, using the standard indicators and criteria for land degradation assessment (FAO, 1979). The results of the study show that soil degradation in these areas ranged from highly degraded to moderately degraded soils. On a comparative basis, most of the soils that were cultivated showed higher degree of degradation compared to the fallow areas. From the study, 42 % of the soils were highly degraded while 58 % were moderately degraded. The soils were classified according to the provisions of soil survey staff (1999) on the basis of the physical and chemical properties of the soils evaluated RECOMMENDATIONS Base on the findings of this study the following recommendations are made; 1. The application of mineral fertilizer
nutrients especially nitrogen, phosphorus, and potassium is necessary. Accordingly 200 kg or 4 bags of urea or 383 kg or 7¾ bags of CAN are recommended for maize production in southern guinea savanna agroecology of Nigeria for soils that are low in nitrogen (less than 0.15 %), as well as 225 kg/ha or 4.5 bags of P for soils that are low in available P (less than 8.0ppm).
2. The use of organic manure such as cow dung and poultry dropping is recommended to improve the productivity of these degraded soils. However, farmers are encouraged to leave crop residues on their farms and incorporate same during tillage rather than burning them.
3. The Portions of the SIWES farm, NYSC farm and the site at Otobi that had been used continuously for cultivation for quite some time should be allowed to fallow, as the higher degree of degradation observed may be due to their prolonged use.
4. There should be a programme for monitoring the fertility status of the soils at regular intervals.
REFERENCES Agbede O.O (2009) Understanding soil and
plant nutrition. 1st Ed. 132-160 pp. Agbim, N.N an K.B Adeoye (1991). The role
of crops residue in soil fertility maintenance and conservation. Organic fertilizer in the Nigeria agriculture: present and future. Proceedings of a National Organic Fertilizer Seminar, Held in Durba Hotel Kaduna, March 26 – 27, 1991
Amalu, U.C (1998): Issues on Agricultural and
Environmental Sustainability Chapter 7, in Agricultural Research and Extension Delivery System in Sub-Saharan Africa. University of Calabar Press. Calabar Nigeria.
Bouyoucos, G.H. (1951) A Recalibration of
the Hydrometer Method for making mechanical analysis of the soil. Agron J. 43: 434-438
Bray R.H and Kurtz L.T. (1945)
Determination of total organic and available forms of phosphorus in soil. Soil Science 59:39-45.
Enwezor, W.O. Udo E.J, Usoroh, N.J.
Ayotade, K. A., Adepetu, J.A. Chude, V.O. and Udegbe, C.I. (1989). Fertilizer Use and Management Practice for Crops in Nigeria, Series No. 2 Fertilizer Procurement and Distribution Division, Federal Ministry of Agriculture, Water Resources and Rural Development Lagos Nigeria, 63pp.
Fitz-Patrick F.A. (1986). An Introduction to
Soil Science 2nd Edition. Longman Scientific and Technical and John Willy and Sons Int. New York 266pp
Gao and Chang (1996). Changes in CEC and
particle size distribution of soils associated with long term annual application of cattle feedlot manure. Soil science 161(2): 115-119 pp.
175
176
Adaikwu, Obi and Ali NJSS/22(1)/2012

Haines, P.J. and N.C. Uren. (1990). Effects of
conservation tillage farming on microbial biomass, organic matter and earthworm populations in north east Victoria. Australian J. Experimental Agricultural 30:365 – 371.
Harpstead, M.T. (1973). The classification of
some Nigerian Soils. Soil Science. 116:437 – 442.
Hillel, D. (1980) Fundamentals of Soil Physics New York Academic Press Inc. Ike, I.F. (1986). Soil and crop Responses to
difference to different tillage practice in a ferruginous soils in the Nigeria Savanna. Soil and Tillage Res. 6:261 – 272.
Jackson (1965) USA monograph N0 9 method of soil
analysis part II Kang, B.T. V Balasubramania (1990) Long Term Fertilizer
Trial on Alfisol in West Africa. In: Transaction of XIV International Soil Science Society Congress. Koyoto. Japan (Vol. 4) Kyoto Japan ISSS
Kayombo, B and R. Lal (1984) Cited by Lal,
R. (1986) In: Land clearing and development in the Tropics. Bulkerma Publication. 299 – 308.
Lal, R. and B.T. Kang (1982). Management of
Organic Matter in Soils of the Tropics In: Soil Management Abstract 302 – 400 1 (2) 152 – 178.
Lombin, L.O. J. Adepetu and K.A. Ayotade
(1991). Complementary use of Organic Manures and in Organic Fertilizer in Arable Crop Production. Organic Fertilizer in the Nigerian Agriculture: Present and Future. Proceedings of a National organic Fertilizer Seminar, Kaduna Nigeria, March 26 – 27 1991.
Metson, A J. (1961). Method of Chemical Analysis for
Soil Survey Sample. New Zealand DSIR Soil
Bulletin 12. Government Printer, Wellington New Zealand.
Ohiri, A.C. (1988). Influence of 4 years of
Continuous Tillage on the Soil Properties of Alfisols. Proc. 16th Annual Conference of Soil Science Soc. of Nigeria, November 27–30, Minna Nigeria.
Ojeniyi S.O., (1989), Investigation of
ploughing requirement on the establishment of cowpea. Soil and Tillage Res. 14:177 – 184.
Ojeniyi, S.O. (2000). Effect of goat manure on
soil nutrient content and okara yield in rainforest area of Nigeria. Applied Tropical Agriculture 5:20-23.
Okpara, M.I. and J.S.C. Mbagwu (2003).
Effectiveness of cattle dung and Swine Waste as bio-fertilizers on an ultisol at Nsukka. Land Degradation, Agricultural Productivity and Rural Poverty Environmental Implication. Proceedings of the 28th Annual Conference of Soil Science Society of Nigeria, Umudike. Abia State Nigeria pp. 71 – 80.
Soil Survey Staff (1994). Keys to Soil
Taxonomy United States Department of Agriculture, Soil Conservation Service 6th edition.
Troeh, F.R. and L.M. Thompson (1993). Soils
and Soil Fertility. Fifth Edition Oxford University Press New York 462 pp.
USDA–SCS (1974). Definitions and
abbreviations for soil description. West technical service centre. Portland, Oregon USA.
Walkely, J.T and C. A. Black (1934)
Examination of the Degtjarefft method of determining the organic matter and a proposed modification of the chromic acid titration method. Soil Science 37: 29-38.
177
Assessment of degradation of soil

EFFECTS OF LAND USE TYPES ON SOIL QUALITY IN A SOUTHERN GUINEA
SAVANNAH, NASARAWA STATE OF NIGERIA
AMANA, S. M; JAYEOBA, O. J AND AGBEDE, O. O Department of Agronomy, Nasarawa State University,
Lafia Campus, Nigeria
ABSTRACT
This research was carried out at the College of Agriculture, Lafia Research field in 2010
cropping season. The objective of this study was to investigate effects of long term cultivation on
soil properties. Surface soil samples (0-15cm) were collected from three sites in each of the five
land use types including: cassava, legume, maize, oil palm plantation and secondary forest. The
samples were subjected to physical and chemical analyses to access the extent of change in soil
quality. According to the results of statistical analysis, bulk density (BD), mean weight diameter
(MWD), water stable aggregates (WSA), soil organic matter content (SOM), total nitrogen (TN),
total porosity (TP), pH and available phosphorus (P) were significantly affected by land use
types. Differences in bulk density (1.65-1.81g/cm3) among the land use types were highly
significant (p<0.05) due to pore disruption by cultivation and percent sand resulting in decreased
total porosity. The mean weight diameter and water stable aggregates were better in secondary
forest compared to other land use types. Soil organic matter content and total nitrogen were
generally very low, but were significantly different (p<0.05). Available phosphorus and CEC
were high for all the land use types. The pH in all the land use types was slightly acidic with
mean of 6.38. The results of study suggest that the continuous cultivation of the land has
degraded the soil properties and there is therefore the need to adopt appropriate management
practices to achieve high soil quality and sustainable productivity.
Key words: soil properties, land use types, soil quality
INTRODUCTION
Human population pressure upon land
resources and their demand for food has
resulted in the increase land use, and intensive
Agriculture (Houghton, 1994; Geissen et al.,
2009). Intensive land use may cause important
changes in soil physical and chemical
characteristics, and can affect soil fertility,
increase soil erosion or cause soil compaction
(Geissen, 2009). Land use changes through
cultivation may rapidly diminish soil quality,
as ecologically sensitive components of
tropical soils are not able to buffer the effect of
intensive agricultural practices (Islam and
Weil, 2000). Most areas of land previously
developed from tropical rainforest have been
degraded because of land misuse. Nutrient
mining and soil degradation are presently
considered as problems in arable farms (Ande
and Onajobi, 2009). Severe deterioration in
soil quality may lead to a permanent
degradation of land productivity (Kang and
Juo, 1986; Islam and Weil, 2000).
Assessment of the effects of land use and soil
management practices on soil properties is of
178
Amana, Jayeoba and Agbede NJSS/22(1)/2012

importance to detect changes in soil quality.
These effects on soil properties also provide
essential information for assessing
sustainability and environmental impact (Ishaq
and Lal, 2002; Ceyhum, 2009). Effect of land
use types on the determination of soil quality
has been reported (Amhakhian et al., 2006;
Islam and Weil, 2009; Conant et al., 2003). Up
till now few or no work has been done on soil
quality in the Southern Guinea Savannah agro-
ecology zone. The aim of the study is to assess
the effects of land use types on the properties
of soils in this area.
MATERIALS AND METHOD
The study area was located in the College of
Agriculture, Lafia North Local Government
area of Nasarawa State, of Nigeria (0.8.33’N,
08.32’E and 175m high). Mean annual rainfall
in the area is 1132mm, minimum and
maximum temperature ranges between 24 8oC
and 33oC respectively. The soil is an Oxisol
(ferrasol, FAO). It is well drained, porous and
brownish red below the surface, made of
kaolinite clay. The soil type is mostly sandy
loam and pH varies from 5 to 6.5. The selected
sites have been under cultivation for over 30
years and secondary forest was left fallow for
about 10 years. The selected areas were of
uniform topography and soil types.
Soil sampling
Disturbed and undisturbed soil samples were
collected in September, 2010 from three
locations in each of the five land use types
(cassava, maize, legume, palm plantation and
secondary forest). The land use types were
either adjacent to one another separated by no
more than 1000m, within the same
physiographic unit and with similar slope and
aspect. Soil samples were taken at the depth of
0-15cm (top soil) in each of the three selected
areas. Soil samples were taken in plastic bags
to the laboratory and air dried for analysis.
Laboratory studies
Physical properties: - Particle size distribution
was determined using disturbed soil samples
by the hydrometer method as described by
Boyoucous (Gee and Bauder, 1986). Bulk
density was determined by core method and
total porosity was calculated assuming a
particle density of 2.65g/cm3. The size
distribution of aggregates was measured by
wet sieving through a series of sieve (2.0, 1.0,
0.5, 0.25mm). The percent water stable
aggregates (%WSA) on each of the size range
were then determined, thus
% WSA = (Ma+s – Ms) x 100
(Mt – Ms)
Where;
Ma+s = Mass of the resistant aggregates plus
sand (g)
Ms = Mass of sand fraction alone (g)
Mt = total mass of the sieved soil (g)
The nodded of Van Bavel (1950) as modified
by Kemper and Roseau (1986) was used to
determine the mean weight diameter (MWD)
of the wet stable aggregates. Thus
n
MWD =∑XiWi
i=1
Where;
Xi = Mean diameter of each size fraction (mm)
Wi = proportion of the total mass in the
corresponding size fraction after deducting the
weight of stones
Chemical properties
Soil organic carbon was determined by the
Walkley – Black method (Nelson and
Sommer, 1996). Total nitrogen (TN) was
determined by Kjeldahl (Brenner, 1996)
method. Soil pH and electrical conductivity
(EC) were measured by pH/conductivity
method (Rhoades, 1996) in soil water solution.
Available phosphorus extracted by Bray-1
extractant (Bray and Kurtz, 1945). Ca2+ and
Mg2+ were read by atomic absorption
spectrophotometer while K+ and Na+ were
read with flame photometer. Cation exchange
capacity (CEC) was by the summation of
exchangeable bases. The base saturation was
calculated as ratio of exchange bases to the
179
Effect of land use types on soil

effective cation exchange capacity (ECEC)
expressed in percentage.
Data analysis: One- way analysis of variance
(ANOVA) procedure was used to compare the
effects of land use types on soil quality. Means
were compared by least significant difference
(LSD) at P<0.05 level.
RESULTS AND DISCUSSION.
Physical properties
Table 1, showed the results of physical
properties of the various land use types. The
particles size distribution of top soil (0-15cm)
shows that there is no difference in the textural
class of the soils under the different land use
types. The textural class remained sandy loam
(SL) in all the locations. This means that land
use does not have effect on texture since
texture is largely determined by parent
material (Obi 1999). The bulk density (BD)
values were significantly different for the land
use types. Bulk density was statistically
significant (p<0.05) with mean value of
1.74g/cm3. The bulk density values were
generally high in all the land use types, with
highest value in secondary forest (1.81g/cm3).
This high soil bulk density might be due to
intensive agricultural practice, low organic
matter content for crop land and compaction of
top soil due to overgrazing of the pasture (Lal,
1986; Ceyhun, 2009).
The effect of land use types on total porosity
(Table 1) showed significant difference
(P<0.05). Total porosity was generally low
with mean value of 34.4%, highest in corn
(37.7%) and lowest in secondary forest 31.6%.
The low value in secondary forest may be
attributed to the high bulk density. This result
disagrees with the finding of Ande and
Onajobi (2009) who recorded 53.9% in
secondary forest of about 20years. However,
the soils recorded here have different textural
class.
The percentage water stable aggregate (WSA)
and mean weight diameter (MWD) values
(Table 1) of secondary forest land were higher
than the cultivated land. Both MWD and WSA
were significantly different from other land
uses (P<0.05). Compared to the secondary
forest, cultivated land use types decreased both
WSA and MWD. That is, the loss of large
sized water stable aggregates under cultivation
was associated with significant reduction in
stability as measured by the MWD (Table 1).
The decreases in soil aggregation resulted in
the increased bulk density in the cultivated
land. This process could get worse by the
continuous use of machinery for cultivation
(Lal et al., 1997).
Table 1: Effects of land use types on soil physical properties of top soil (0-15cm). Land use types Soil Texture Bulk
density
g/cm3
Sand
%
Soil
%
Clay
%
Porosity
%
Aggregate
stability %
MWD
mm
Cassava (CV) Sandy loam 1.68 7496 6 19.04 36.7 10.76 0.67
Corn (M) Sand loam 1.65 74.96 6 19.04 37.7 10.91 1.43
Legume (LG) Sandy loam 1.77 74.96 8 17.04 33.2 27.51 1.13
Oil Palm (POP) Sandy loam 1.78 74.96 8 17.04 32.8 9.74 1.34
Forest(F) Sandy loam 1.81 76.96 6 17.04 31.6 56.82 2.02
LSD 0.118 ns ns ns 1.365 0.952 0.089
Chemical properties
In Table 2, some of the soil chemical
properties were significantly different in soils
under different land use types. Soil
characteristics have changed over the past 30
years with land use. Long term cultivation
significantly (P>0.05) decreased soil organic
matter content (som) in the cropped lands and
it has crucial effect on soil physical and
chemical properties. Organic matter content
was significantly higher in secondary forest
(5.75g/kg) than the cultivated land.
180
Amana, Jayeoba and Agbede NJSS/22(1)/2012

Total nitrogen was generally low ranging from
0.11g/kg in maize to 0.29g/kg in secondary
forest. Total nitrogen was slightly higher in
legume field (LG) than the other cultivated
land. This could be due to its ability to fix
nitrogen in the soil. The low total nitrogen
observed in the soils may be due to intensive
cultivation (Power, 2004).
Available P content in all soils was medium
(17.68mg/kg) to high (23.10 mg/kg).
Phosphorus was significantly different in all
the land use types with the highest value of
23.10mg/kg in oil palm plantation (POP). This
means that P fixation by Fe and Al-oxides
occur in the soil (Sanchez et al., 2003) due to
slightly acidic medium.
The pH values varied significantly from 6.20
in POP to 6.5 in secondary forest (Table 2).
The pH was slightly acidic in all the land use
types. Biomass from incorporated stubble after
harvest could have retained enough base
forming cations to increase pH of the surface
soil (Islam and Weil, 2000). Percentage base
saturation values were generally high in the
land use types and were significant different
from one another. Electrical conductivity in all
the land use types was not significantly
different.
Table 2: Effects of land use types on chemical properties of the top soil (0-15cm). Land use types pH in
water
ECe O.M
g/kg
TN g/kg Available P,
mg/kg
CEC
C/mol/kg
% base
saturation
Cassava(CV) 6.48 50 4.18 0.21 18.38 15.30 79.40
Corn(M) 6.41 50 2.22 0.11 18.90 14.35 69.53
Legume(LG) 6.24 50 4.57 0.23 21.88 17.13 77.34
Oil palm(POP) 6.20 60 2.61 0.13 23.10 14.18 69.54
Forest(F) 6.58 60 5.75 0.29 17.68 13.50 73.19
LSD 0.1546 ns 0.962 0.005 1.561 1.451 2.005
CONCLUSION
This study indicated that long-term cultivation
of lands resulted in destruction of soil
properties. The land use types have
significantly reduced SOM, TN, TP, MWD
and WSA, as it has increased the soil bulk
density. In summary, the finding of this study
indicates that continuous cultivation of these
lands for crop production may lead to loss of
soil productivity and land degradation. It is
clear, that there is need to adopt appropriate
management practices to achieve high soil
quality and sustainable productivity.
REFERENCE
Amhakhian S.O; Isitekhale, H.H;Ezeku P.I.,
2006.Assessment of soil structure
under different land uses in Anyingba,
North Central, Nigeria International
Formal of Agricultural Research (PAT)
volume 1 No.1
Bray R.H, Kurtz L.T (1945). Determination of
total organic and available forms of
phosphorus in soils. Soil Sci. 59:39-45
Bremner, J.M: Method of Soil Analysis, Part
3. Chemical Methods, Soil Science of
America and American Society of
Agronomy, SSSA Book Series No. 5,
Madison-USA (1996).
Conant, R.T.J. Six and K. Paustian: Land use
effects on soil carbon fractions in the
southeastern United States. I
Management-intensive versus
extensive grazing. Biol. Fertile Soils,
38, 386 392 (2003).
Gee, G. W. and Bauder J.W. 1986. Particle
size analysis, In: Wute A (ed) Methods
of Soil Analysis. Part 1 physical and
mineralogical methods. 2nd edition.
Madison, WI. USA: ASA-SSA,
Pp.383-411
181
Effect of land use types on soil

Houghton, R.A., 1994. The worldwide extent
of land-use change. Bioscience 44,
305-313.
Islam, K.R., and Weil, R.R., 2000. Soil quality
indicator properties in mid-Atlantic
soils as influenced by conservation
management J. Soil Water Conser. 55,
69,2269-2284
Kang, B.T., Juo, ASR., 1986. Effect of forest
clearing on soil chemical properties
and crop performance. In: Lal, R.,
Sanchez, P.A. Cummings, Jr., R.W.
(Eds), Land Clearing and Development
in the Tropics. Belkema, Rotterdam,
pp. 79-83
Kemper, W.D. and R.C. Rosenau: Methods of
Soil Analysis. Part 1, Physical and
Mineralogical Methods-Agronomy
Monograph, No.9 (2nd Edn.) ASSA,
USA (1986)
Lal, R., P. Henderlong and M. Flowers:
Forages and row cropping effects on
soil organic carbon and nitrogen
contents. In: Management of carbon
sequestration in soil (Eds.: R. Lal, J.M.
Kimble, R.F. Follett and B.A. Stewart).
CRC Press, Boca Raton, FL. Pp. 365-
380 (1997).
Nelson, D.W. and L.E.Sommer: Methods of
Soil Analysis. Part3. Chemical
Methods, Soil Science of America and
American Society of Agronomy, SSSA
Book, Series No. 5 Madison-USA
(1996).
Obi, M. E. 1999. Physical and chemical
responses of a degraded sandy clay
loam soil to cover crops in southern
Nigeria. Plant and Soil 211: 165-172.
Powers, J.S., 2004. Changes in soil carbon and
nitrogen after contrasting land-use
transitions in northeastern Costa Rica.
Ecosystem 7,134-146.
Sanchez, P.A. Palma, C.A., Buol, S.W., 2003.
Fertility capability soil classification: a
tool to help assess soil quality in the
tropics. Geoderma 114, 57-185.
Ceyhun, G., 2009: The effects of land use
change on soil properties and organic
carbon at Dagdami river catchment in
Turkey. Journal of Environmental
biology 30(5) 825 – 830.
Gersien V., Sanchez – Hernandez, R.,
Kampicher, C., Ramos-Reyes, R.,
Sepulvada-Lozada A., Ochoa-Goana,
S., Dejong, B.H.J., Itueta-Lwanga E.,
and Hernandez-Dauma S. 2009. Effects
of Land-Use change on some
properties of tropical soils-An example
from southeast mexico. Geoderma 151,
87 – 97.
Ande, T.O. and Onajobi, J. 2009. Assessment
of effects of controlled land use types
on soil quality using inferential
method. African journal of
Biotechnology Vol. 8(22), pp 6267 –
6271.
Ishaq, M.I., and Lal. R. 2002. Tillage effects
on soil properties at different levels of
fertilizer application in Punjab,
Pakistan. Soil Tillage Res., 68, 93 – 99.
182
Amana, Jayeoba and Agbede NJSS/22(1)/2012

SOIL PROPERTIES AND RESPONSE OF YAM TO ASH
APPLICATION AT AKURE, NIGERIA
KAYODE, B.O.1, OJENIYI, S. O.2, AND ODEDINA, S.A.1
1Department of Agronomy, Federal College of Agriculture, Akure 2Department of Crop Soil and Pest Management
Federal University of Technology, Akure, Nigeria
ABSTRACT Two experiments were conducted at the Federal College of Agriculture Akure, Southwest
Nigeria to test effectiveness of a crop waste wood ash as source of nutrients for plantain (Musa
paradisica) and yam (Dioscorea rotundata). Effect of wood ash at 0, 0.4, 0.8 and 1.2 kg/plant
was studied as to the effect on soil chemical properties and performance of the crops. The test
soil was low in organic matter (OM), total N, available P, exchangeable K and Mg. The soil pH,
OM, N, P, K, Ca and Mg increased with level of ash. The 0.4 kg/plant ash increased the number
of leaves of plantain and tuber weight of yam significantly. Tuber weight was increased by 44%.
INTRODUCTION Ash derived from burning of plant residues is a
natural fertilizer for farmers especially in the
tropics where the slash and burn land
preparation is done. However research has not
been focused on the effectiveness of different
types of ash on different crops until recently
(Odedina et al 2003; Owolabi et al 2005;
Nottidge et al 2007; Awodun et al 2007;
Ewulo et al, 2009). In addition to being source
of macro and micro nutrients, ash raises soil
pH thus it has a liming effect through the
supply of basic elements especially Ca and K.
Studies carried out in different parts of Nigeria
indicate that ash derived from cocoa pod,
wood, sawdust and other plant residues
increased availability of nutrients in soil,
nutrient uptake, soil pH and enhances the
performance of crops such as amaranthus,
tomato, pepper, cowpea, okra, tomato, maize
and cocoa seedlings (Ojeniyi et al, 2010,
Ayeni et al, 2008a, 2009, 2008b, 2008c,
Ojeniyi and Adejobi, 2002; Awodun et al,
2007).
Information is scarce on response of plantain
crop to ash application. This work carried out
in Akure Southwest Nigeria investigated the
response of plantain and yam to application of
ash and its concomitant effect on soil
properties.
MATERIALS AND METHODS
Field Experiments
Experiments were carried at Federal College
of Agriculture Akure in the rainforest zone of
southwest Nigeria. Land was manually
cleared. In the first experiment on plantain
between August 2010 to August 2011, four
wood ash levels 0, 0.4, 0.8, 1.2 kg were
applied on soil surface to each plant the
spacing being 1m x 1m. The treatments were
replicated four times. Each of the 16 plots had
four plants. Ash was applied in May 28, 2011.
Between 2 and 8 weeks after treatment
application, data were collected bi-weekly on
plant girth, number of leaves and plant height.
In the second experiment on yam, another site
was cleared in 2011. The four ash treatments
were applied to yam on surface soil. The four
183
Effect of ash on soil and yam

ash treatments were replicated four times
given 16 plots. Yam heaps were spaced at 1 x
1m in each plot that contained 20 heaps. Yam
sets were planted in March 2011, and ash
applied in May 2011 when rain was steady.
Weeding was done 18 days after ash
application.
At 8 weeks after ash application (WAT) data
were taken on five plants selected per plot on
plant height, number of leaves and girth. At
harvest, tuber weight, mean tuber girth and
length were determined.
RESULT AND DISCUSSION The test soil was inadequate in most nutrients
(Table 1) such as organic matter (OM), total
N, available P, exchangeable K and Ca
considering the critical values set for soils in
southwest Nigeria (Akinrinde and Obigbesan,
2000; Adeoye and Agboola, 1985)
Table 1: Pre-test soil chemical analysis (plantain experiment)
Soil Property Value
pH (H2O)
OM %
Total N %
Available P mg/kg
Exchangeable K cmol/kg
Exchangeable Ca cmol/kg
Exchangeable Mg cmol/kg
Texture
7.7
1.86
0.14
14.6
0.14
0.70
1.50
Sandy Clay Loam
It is shown that soil pH, OM, N, P, K, Ca and
Mg increased with level of wood ash applied
to plantain. However it is the 4 t/ha ash that is
optimum since there was no clear increases in
soil nutrients after the 0.4 t/ha ash per plant.
The values of soil pH, OM, N, P, K, Ca and
Mg at this level is adequate for crop
production, although values recorded for OM
and N were marginal. Therefore, in terms of
soil fertility, application of ash at 0.8 and 1.2
kg/plant is superfluous.
Table 2: Soil analysis as affected by ash application (plantain experiment)
Treatment
Ash kg/ha
pH
(H2O)
OM
%
N
%
P
mg/kg
K
cmol/kg
Ca
cmol/kg
Mg
cmol/kg
0
0.4
0.8
1.2
LSD (0.05)
6.9
9.2
7.4
7.5
NS
1.79
2.13
2.37
3.83
0.47
0.13
0.18
0.22
0.28
0.40
12.2
19.3
27.3
55.5
10.7
0.12
0.30
0.37
0.51
0.07
0.10
0.44
0.62
0.70
0.30
1.4
3.1
3.8
4.7
0.81
The findings from this work on the role of
wood ash is consistent with findings from the
work of Nottidge et al 2007, that affirm the
role of ash as a liming material and effective
source of nutrients for crops such as
vegetables, maize and cocoa (Ojeniyi and
Adejobi, 2002; Odedina et al, 2003; Ayeni et
al 2008c)
The studies also showed that ash increased the
uptake of nutrients by the crops, and nutrient
contents of the soil leading to increase in their
growth and yield. Since the test soil in this
work is inadequate in OM, N, P, K and Ca, it
is expected that ash would increase the fertility
of the soil and raise its pH (Table 2).
Table 3 contains data on growth parameters of
plantain as affected by ash application.
184
Kayode, Ojeniyi and Odedina NJSS/22(1)/2012

Parameters such as girth, number of leaves and
plant height were increased by ash at
0.4kg/plant. The increase was significant with
respect to the number of leaves. After the
0.4g/tree level (0.8 and 1.2g/tree) growth was
reduced or slight.
Table 3: Growth of Plantain as Affected by Wood Ash
Ash
Kg/Plant
Plant Girth
8 WAP
Number of
Leaves
Plant Height
(cm)
0
0.4
0.8
1.2
LSD (0.05)
37.2
46.9
39.4
46.6
NS
11.9
14.1
12.1
13.7
0.70
243.9
327.4
274.1
335.5
NS
The yam yield components are shown in Table
4. The ash treatments namely 0, 0.4, 0.8 and
1.2 kg/plant increased tuber weight
significantly. The increases in tuber girth and
length were not significant. Application at
0.4kg/tree is optimum because increases in
tuber weight given by 0.4, 0.8 and 1.2 kg/tree
were similar being 44, 43 and 48%
respectively. The 0.4 kg/tree rate is
recommended for both plantain and yam.
Table 4: Yam Tuber Yield as affected by Wood Ash
Ash
kg/Plant
Tuber Weight
kg
Tuber Girth
cm
Tuber length
(cm)
0
0.4
0.8
1.2
LSD (0.05)
1.26
1.82
1.50
1.86
0.40
34.8
36.1
40.7
39.8
NS
31.3
33.3
36.7
36.5
NS
This work has shown that wood ash served as
liming material and fertilizer. Soil acidity was
reduced and nutrients released to enhance soil
fertility. Hence the growth of plantain and yam
yield were increased significantly. Application
at 0.4 kg/plant is recommended.
REFERENCES Adeleye, E.O.; Adeleye, A.A. and Ojeniyi,
S.O. (2004). Effects of wood ash manure on soil nutrients status leaf nutrient and yield of yam on an alfisol in Southwestern Nigeria. The Nigerian Journal of Research and Production 5(5) 76-82.
Awodun, M..A.; Otaru, M.S. and Ojeniyi S.O.
(2007). Effect of saw dust ash plus urea on maize performance and nutrient status of maize. Asian Journal of Agricultural Research 1, 1-4.
Awodun, M.A.; Ojeniyi S.O.; Adesoye, A. and
Odedina, S.A. (2007). Effect of oil palm bunch refuse ash on soil and plant nutrient composition and yield of maize. American–Eurasian Journal of sustainable Agriculture 1, 50-54.
Ayeni, L.S.; Adetunji, M.T.; Ojeniyi, S.O.;
Ewulo, B.S. and Adeyemo, A.J. (2008a). Comparative and cumulative effect of cocoa pod husk and poultry manure on soil and maize nutrients contents and yield. American Eurasian Journal of Sustainable Agriculture 2(1), 92-97.
Ayeni, L.S.; Adetunji M.T. and Ojeniyi S.O
(2008b). Comparative nutrients release from cocoa pod ash poultry manure and NPK 20:20:20 fertilizer and their
combinations – incubation study,
185
Effect of ash on soil and yam

Nigerian Journal of Soil Science 18, 114-123.
Ayeni, L.S.; Ayeni, O.M.; Ojo, O.P. and
Ojeniyi, S.O. (2008c) Effect of saw
dust and wood ash applications in
improving soil chemical properties and
growth of cocoa seedlings in the
nurseries. Agricultural Journal 3(5),
323-326.
Ayeni, L.S.; Adetunji, M.T. and Ojeniyi, S.O.
(2009). Integrated application of NPK
fertilizer, cocoa pod ash and poultry
manure: Effect on maize performance
plant and soil nutrient content.
International Journal of Pure and
Applied Sciences 2(2), 34-41,
Ewulo, B.S.; Babadele, O.O. and Ojeniyi, S.O.
(2009). Saw dust ash and urea effect on
soil and plant nutrient content and yield
of tomato. American – Eurasian
Journal of Sustainable Agriculture
3(1), 88-92.
Nottidge, D.O.; Ojeniyi S.O. and Asawalam,
D.O. (2007). Effect of different levels
of wood ash on nutrient contents of
maize and grain yield in an acid ultisol
of Southeast Nigeria. Nigerian Journal
of Soil Science 17, 98-103.
Odedina, S.A.; Odedina, J.N.; Ayeni, S.O.;
Arowojolu, S.A.A.; Areyeye, S.D. and
Ojeniyi, S.O. 2003. Effect of types of
wood ash on soil fertility nutrient
availability and yield of tomato and
pepper. Nigerian Journal of Soil
Science 13, 61-67.
Ojeniyi, S.O.; Awanlemhen, B.E. and Adejoro,
S.A. (2010). Soil plant nutrients and
maize performance as influenced by oil
palm bunch ash plus NPK fertilizer.
Journal of American Science 6(12),
456-460.
Ojeniyi, S.O. and Adejobi, K.B. (2002). Effect
of ash and goat dung manure on leaf
nutrients composition growth and yield
of amaranthus. The Nigerian
Agricultural Journal 33, 46-57.
Owolabi .O.; Ojeniyi, S.O.; Amodu, A.O. and
Hazan, K. (2005). Response of cowpea
okra and tomato to saw dust ash
manure. Moor Journal of Agricultural.
Research 4(2), 178-182.
Ponsu, M. and Gautheyron, J. (2003).
Handbook of Soil Analysis
Mineralogical Organic and Inorganic
Methods Springer – Verlay, Berlin.
New York.
186
Kayode, Ojeniyi and Odedina NJSS/22(1)/2012

USE OF AGRICULTURAL WASTES FOR IMPROVING SOIL CROP NUTRIENTS
AND GROWTH OF COCOA SEEDLINGS
AKANNI, D.1; ODEDINA, S.A1 AND OJENIYI, S. O.2 1Department of Agronomy, Federal College of Agriculture, Akure, Nigeria
2Department of Crop Soil and Pest Management
Federal University of Technology, Akure, Nigeria
(Correspondence to 2)
ABSTRACT
The quest for organically produced cocoa in the world market necessitated recent focus on
research into the use of agricultural wastes as source of nutrients in cocoa (Theobroma cacao)
production. This work carried out at Federal College of Agriculture Akure is the comparative
study of effect of kola testa (KT), cocoa pod ash (CPA), melon testa (MT), cowpea pod (CP),
kola pod (KP) and cocoa testa (CT) and NPK fertilizer (NPK) on soil and crop nutrient
composition and growth cocoa seedlings. The nutrient composition of the wastes was also
determined. The test soil was slightly acidic, medium in organic matter (OM) and low in N and
available P. In terms ofnutrient of N, P and K, the MT, CP and CPA respectively have the
highest percentages. The KT, CT, CPA and MT had highest and similar values of C:N ratio.
NPK gave highest soil OM, N, Mg, leaf N, P, K and Ca. MT gave highest soil P, Ca, leaf Ca and
Mg, CPA which gave highest soil K had relatively high soil P, N, Mg and leaf K and Ca. KT
gave relatively high soil K, Mg, leaf K and Mg. The CT, KT, CPA and KP increased number of
leaves significantly. The KT, MT, CPA and NPK gave higher and similar values of fresh matter
yield and tended to give highest values of soil and plant N, P, K, Ca and Mg. In addition to
nutrients release the relatively high C:N ratio (27 – 31 C:N ratio) of KT, CPA and MT should
have contributed to their better effect on growth of cocoa seedlings.
INTRODUCTION There is quest for organically produced farm
produce in international markets. This is
particularly so in the case of horticultural and
plantation crops such as coffee, cocoa and
fruits. Hence, there is shift on part of
producers to establish organically certified
farms and tap into the lucrative organic export
markets. In Papua New Guinea small-scale
highland coffee farmers now produce certified
organic coffee bound for Australian and US
markets, earning far higher incomes than they
ever had. In Sao Tome, about 200 tonnes of
organically produced cocoa beans are exported
annually.
In Nigeria research effort into methods of
establishing organic cocoa farms is quite
recent. One aspect of this effort is to study into
use of agricultural wastes and organomineral
fertilizer for soil amendment and supplying of
nutrients to cocoa seedlings (Akanni and
Ojeniyi, 2011, Moyin Jesu and Atoyosoye,
2002). In their study, Moyin Jesu and
187
Use of wastes for improving soil

Atoyosoye (2002) found that agricultural
wastes such as wood ash, cocoa pod husk, rice
bran and oil palm bunch ash increased growth
significantly and leaf N, P, K, Ca and Mg
contents of cocoa seedlings and soil N and P.
They were more effective than NPK fertilizer.
Studies by Ojeniyi and Egbe (1981), Ojeniyi et
al (1982) and Ojeniyi and Egbe (1983) had
found that cocoa trees require supplementary
application of N, P and K fertilizers in
southwest Nigeria. Ojeniyi (1986) indicated
that more emphasis should be placed on
supplementary nutritional needs of young
cocoa plants compared with old plants because
soil organic matter, N, K, Ca and Mg
increased with age of cocoa trees while P
reduced.
In this work agricultural wastes which have
not been studied namely; melon testa, cowpea
and kola pod, cocoa testa were studied in
addition to cocoa pod ash and NPK fertilizer
as to their effects on soil and plant nutrient
composition, and growth of cocoa seedlings.
MATERIALS AND METHODS
Nursery experiment was conducted on cocoa
seedlings at Federal College of Agriculture,
Akure, Ondo State, Nigeria. After land
clearing, a shade was erected. Polythene pots
of 20 x 12cm that had drainage holes were
filled with top soil and the weight was 1.7kg
each. Wet seeds were planted at one seed per
pot and there were 420 pots to cover eight
manure fertilizer treatments replicated three
times. The treatments were (a) the control, 2.5
t/ha each (b) kola testa (c) cocoa pod ash (d)
melon testa (e) cowpea pod (f) kola pod (g)
cocoa testa, and (h) 400 kg/ha NPK 15:15:15
fertilizer. Five pots were allocated to each
treatment. The kola testa, cocoa pod ash, kola
pod (ground) and cocoa testa were obtained
from Cocoa Research Institute of Nigeria,
Ibadan: melon testa and cowpea pod were
obtained from the market at Akure. A seed
was planted in a pot. The surface soil in the
nursery was protected using nylon to prevent
insect attack. Fencing of the nursery was done
with wire mesh to prevent rodent attack.
Treatments were allocated using a complete
randomized block design. Watering with can
water was done twice daily (morning and
evening) and it continued after emergence at 2
weeks. The NPK fertilizer and organic
manures were applied as mulch materials at 4
weeks after planting.
Plant Data Collection As from 6 weeks after planting (WAP), data
were collected bi-weekly on plant height, stem
girth, number of leaves, till 20 WAP. At 20
WAP, samples of fresh root and fresh shoot
were weighed. The weight of dry root and
shoot were determined by oven-drying fresh
samples at 80oC for 24 hours.
Leaf Analysis The twenty-four samples of oven-dried leaves
were ground for the tree replicates and
chemically analysed as described by Faithful
(2002). The N was determined by the macro-
kjeldahl method. The samples were extracted
using the nitric-perchloric acid mixture, P was
evaluated using vanadomolybdate colorimetry,
K by flame photometer, and Ca and Mg by
atomic absorption spectrophotometry.
Soil Analysis A composite surface (0-15cm) soil samples
was collected on the site where soil was
collected to fill the pots used for growing
cocoa seedlings..
After the harvest of plants at 20 WAP, twenty-
four composite soil samples were collected for
the three replicates, samples were air-dried and
2mm sieved for analysis as described by Pensu
and Gautheyron (2003). Total N was
determined by micro-kjeldahl method, organic
matter by wet dichromate oxidation method,
available P by vanadomolyb date colorimetry
and Bray-P1 extraction. Exchangeable K, Ca
and Mg were extracted using ammonium
acetate, K was determined on flame
photometer, and Ca and Mg by atomic
absorption spectrophotometer. The pH in 2:1
water – soil medium was determined.
188
Akanni, Odedina and Ojeniyi NJSS/22(1)/2012

Analysis of Agricultural Wastes The wastes used as manure were kola testa,
cocoa pod ash, melon testa, cowpea pod, kola
pod and cocoa testa. The air-dried samples
were ground and analysed as for the leaf
samples (Faithful, 2002).
RESULT AND DISCUSSION Table 1 shows chemical analysis of soil used
for the experiment. The soil is slightly acidic,
organic matter (OM), is low in total N,
available P and exchangeable Ca, K and Mg
(Akinrinde and Obigbesan, 2000) are
adequate.
Chemical analysis of agricultural wastes is
shown in Table 2. In terms of the composition
of major nutrients (N, P, K), the melon testa
(MT), cocoa pod (CP) and cocoa pod ash
(CPA) respectively have the highest
percentages respectively. The cocoa testa
(CT), kola pod (KP) and kola testa (KT)
respectively had least composition in terms of
NPK. However the CT had highest
concentration of Mg. The CP had highest
concentration of Ca. The KT, CT, CPA and
MT had the highest and similar values of C:N
ratio.
Table 1: Soil chemical properties before planting
pH Om
%
Total N
%
Available P
mg/kg
Ca K Mg
Cmol/kg
6.4 2.1 0.12 6.5 2.4 1.2 0.96
Table 2: Chemical analysis of agricultural wastes (%)
Waste C:N OM N P K Mg Ca
Kola testa (KT)
Cocoa pod ash (CPA)
Melon testa (MT)
Cowpea pod (CP)
Kola pod (KP)
Cocoa testa (CT)
31
30
27
15
21
30
2.14
2.01
1.01
0.90
1.71
0.23
0.04
1.40
1.30
0.71
0.92
0.58
11.7
10.1
16.7
12.0
6.0
10.1
2.01
2.45
3.40
3.07
2.20
1.66
0.01
1.29
0.81
1.51
2.06
2.14
1.36
2.68
2.05
2.70
0.61
2.25
Data of soil chemical properties as influenced
by the agricultural wastes are presented in
Table 3. The NPK fertilizer increased soil OM,
N, P, Ca and Mg. The increased OM, Ca and
Mg could be due to enhanced OM, Ca and Mg
could be due to enhanced biotic activity and
resultant decomposition of organic material
and mineralization of organic nutrients. Ayeni
et al (2009) also found that NPK fertilizer
increased soil OM, N, P, K, Ca and Mg and
micronutrients.
The CPA increased soil N, P, Ca, Mg and K.
Ayeni et al (2008a, 2008b, 2009), Ajayi et al,
(2007a, 2007b) had also found that cocoa pod
ash significantly increased soil macronutrients
and had liming effect. Related to this is the
observation in this work that cocoa testa
increased soil N, P and Ca. It is also found that
CP (cowpea pod) increased soil OM, P, Ca and
Mg; MT (melon testa) increased soil N, P, Ca,
cola testa (KT) increased soil N, P, Ca, Mg
and Cola pod powder (KP) increased soil N, P
and Mg. Generally, the agricultural wastes
increased soil OM and macronutrients.
189
Use of wastes for improving soil

Table 3: Soil chemical properties as affected by NPK fertilizer and organic wastes
Treatment OM
%
N
%
P
mg/kg
Ca Mg K Ph
--- cmol/kg---
NPK
Kola testa
Cocoa pod ash
Melon testa
Cowpea pod
Kola pod
Cocoa testa
Control
1.11a
0.64ab
0.82ab
0.59ab
1.06a
0.87ab
0.39b
0.88ab
0.91
0.57
0.79
0.62
0.43
0.68
0.63
0.25
NS
1.95a
1.88b
2.39ab
3.06a
1.57b
1.88b
2.15ab
1.44B
2.76
2.63
2.84
3.43
3.39
2.63
3.19
2.59
NS
1.91a
0.94abc
1.12a
0.76c
1.10ab
0.99abc
0.72c
0.78bc
0.41
0.52
0.82
0.54
0.53
0.58
0.35
0.55NS
7.1
7.9
7.4
7.5
7.6
7.4
7.6
7.4
NS
Data on leaf nutrient composition are shown in
Table 4. Only NPK and cowpea pod (CP)
increased leaf N. All the agricultural wastes
and NPK increased leaf K and Mg. The
exception is that CPA did not increase leaf Mg
and CT and KT did not increase leaf P. The
wastes did not increase leaf Ca probably
because of the relatively high exchangeable Ca
content of soil compared with K and Mg.
Unlike in this study with cocoa seedlings,
other works (Ayeni et al, 2009, Ayeni et al,
2008, Ajayi et al, 2007a, 2007b) showed that
the CPA increased uptake of N, P, K, Ca Mg
and micronutrients by crops such as cola (Cola
nitida) and maize (Zea mays)
Data on soil and plant analysis can be
summarized thus: The NPK gave highest soil
OM, N, Mg and leaf N, P, K and Ca. The MT
gave highest soil P, Ca and leaf Ca, Mg, and
relatively high leaf N, P and K. The CPA gave
highest soil K, relatively high soil P, N, Mg
and leaf K and Ca. The KT gave relatively
high soil K, Mg and leaf K and Mg.
Table 4: Leaf nutrient composition of cocoa seedlings as affected by NPK fertilizer and
organic wastes (%)
Treatment N P K Ca Mg
NPK
Kola testa
Cocoa pod ash
Melon testa
Cowpea pod
Kola pod
Cocoa testa
Control
0.94a
0.44b
0.50b
0.61b
0.70ab
0.50b
0.54b
0.60b
1.20a
0.23b
0.30b
1.12a
0.44b
0.40b
0.32b
0.23b
2.80a
1.10c
1.10c
1.83b
0.94cd
1.01cd
0.90cd
0.82d
1.10ab
0.82ab
1.00ab
1.10ab
0.74ab
0.90ab
1.03ab
1.20a
0.90cd
1.73ab
0.71e
1.97a
1.11c
1.10ad
0.90de
0.73e
Data on growth parameters such as plant
height, stem girth and number of leaves are in
Table 5. Though the NPK and agricultural
wastes increased plant height and stem girth
the increases were not statistically significant.
CT, KT, CPA, KP, MT and CP respectively
increased the number of leaves. The increases
given by CT, KT, CPA and KP were
significant. The NPK did not increase number
of leaves.
The fresh and dry matter, and root yield are
presented in Table 6. The wastes and NPK
significantly increased fresh matter (shoot)
yield (FMY), and the KT, MT and CPA gave
highest values. Increases in fresh root yield
(FRY), dry matter yield (DMY) and dry root
yield (DRY) were not significant. Aside from
availability of N, P, K, Ca and Mg due to the
agricultural wastes, the higher FMY given by
KT, MT and CPA respectively could be
attributed to slow release of nutrients
190
Akanni, Odedina and Ojeniyi NJSS/22(1)/2012

contained in them over a longer period due to
their relatively high C:N ratio. The period of
determination of growth parameters was 14
weeks. Other wastes such as kola pod (KP),
cocoa pod (CP) and kola testa (CT) should
have decomposed and mineralized faster due
to their relatively low C:N ratio (Table 2).
Although CT had high C:N ratio (30) similar
to the values for KT, CPA and MT, this is
merged by relatively low N, P and K contents.
Infact, the CT and KP respectively had least
aggregate value for NPK which are the major
nutrients. This should have adversely affected
nutrient availability to cocoa seedlings. Hence,
CT and KP with least aggregate value for NPK
had least FMY and DMY among the wastes.
The CT also gave least N, P and K contents.
The wastes such as the KT, MT, CPA and
NPK that gave highest and similar values of
FMY tended to produce highest values of soil
and plant N, P, K, Ca and Mg. Therefore,
increased nutrient availability induced by the
agricultural wastes enhanced significantly the
growth of cocoa seedlings. In addition, slow
nutrients release associated with the high C:N
ratio of KT, MT and CPA contributed to the
enhanced performance of cocoa seedlings. The
optimum C:N for composts is indicated to be
between 20:20:1. Composts with ratio less
than 20 quicken release of nutrients by
preventing nutrient immobilization
(Chukwujindu et al, 2006).
Table 5: Growth of cocoa seedlings as affected by NPK fertilizer and organic wastes at 20
WAP
Treatment Plant height
(cm)
Stem girth
(cm)
No of leaves
NPK
Kola testa (KT)
Cocoa pod ash (CPA)
Melon testa (MT)
Cowpea pod (CP
Kola pod (KP)
Cocoa Testa (CT)
Control
30.6
33.8
36.0
33.8
36.8
36.5
31.3
28.4
NS
2.80
2.80
2.80
2.80
2.70
2.60
2.60
2.40
NS
18.3b
25.0ab
23.3ab
20.7b
20.7b
22.7b
27.3a
21.0b
Table 6: Fresh and dry matter yield of cocoa seedlings as affected by NPK fertilizer and
organic wastes
Treatment Fresh matter
yield (g)
Fresh root yield
(g)
Dry matter
yield (g)
Dry root yield
g)
NPK
Kola testa (KT)
Cocoa pod ash (CPA)
Melon testa (MT)
Cowpea pod (CP
Kola pod (KP)
Cocoa Testa (CT)
Control
27.5ab
28.7a
24.7ab
27.4ab
18.1c
14.2b
20.0c
13.7b
9.01
6.70
7.20
7.60
6.60
8.60
6.70
6.5
NS
6.70
8.70
5.00
7.80
5.70
3.90
5.20
3.70
NA
2.50
1.70
2.80
2.00
2.20
2.10
1.90
1.70
NS
191
Use of wastes for improving soil

CONCLUSION Agricultural wastes such as kola testa, cocoa pod ash, melon testa, cowpea pod, kola pod and cocoa testa are composed of major nutrients which were released into soil to increase soil N, P, Ca, Mg at various degrees and this led to increased nutrients content and growth of cocoa seedling. The kola testa, cocoa pod ash and melon testa were more effective in increasing leaf production and fresh matter yield and plant K, Ca and Mg. REFERENCES Akanni, D.I. and Ojeniyi, S.O. (2011).
Influence of sunshine organic and organomineral fertilizers on growth of oil palm and cocoa seedlings, plant and soil nutrients. Nigeria Journal of Soil Science 21(1), 80-84.
Ajayi, C.A.; M.A. Awodun and S.O. Ojeniyi,
(2007a). Effect of cocoa husk ash on growth and stem nutrient uptake of kola seedlings. Asian Journal of Agricultural Research 4(1), 31-34.
Ajayi, C.A.; M.A. Awodun and S.O. Ojeniyi
(2007b) Comparative effect of cocoa pod husk and NPK fertilizer on soil and root nutrient content and growth of kola seedling. International Journal of Soil Science 2(2), 148-153.
Ayeni, L.S.; Adetunji, M.T.; Ojeniyi, S.O.;
Ewulo, B.S. and Adeyemo, A.J. (2008a). Comparative and cumulative effect of cocoa pod husk ash and poultry manure on soil and maize nutrients content and yield. American Eurasian Journal of Sustainable Agriculture 2(1), 92-97.
Ayeni, L.S.; Adetunji, M.T. and Ojeniyi, S.O.
(2008b). Comparative nutrients release from cocoa pod ash poultry manure and NPK 20:10:10 fertilizer and their combinations – incubation study. Nigerian Journal of Soil Science 18, 114-123.
Ayeni, L.S., Adetunji, M.T. and Ojeniyi, S.O. (2009). Integrated application of NPK fertilizer cocoa pod ash and poultry manure effect on maize performance plant and soil nutrient content. International Journal of Pure and Applied Science 2(2), 34-40.
Chukwujindu, M.A.; A. Cegun, N. Emuh and
N.O. Isirimah (2006). Compost maturity evaluation and its significance to agriculture. Pakistan Journal of Biological Science. 9, 2933-2944.
Faithful, N.T. (2002). Methods in Agricultural
Chemical Analysis. A practical Handbook. CABI Publishing. Pp. 206.
Moyin Jesu, E.I. and A.B. Atoyosoye, (2002).
Utilization of agricultural wastes for the growth leaf and soil chemical composition of cocoa seedlings in the nursery. Partanika Journal of Tropical Agricultural Science 25(1), 53-62.
Ojeniyi, S.O. and N.E. Egbe (1981). Effect of
foliar application of potassium on cocoa yield. Journal of Horticultural Science 56(3), 267-269.
Ojeniyi, S.O.; N.E. Egbe and T.I. Omotoso
(1982). Effects of nitrogen and phosphorus fertilizers on unshaded Amazon cocoa in Nigeria. Fertilizer Research 3, 13-16.
Ojeniyi, S.O. and Egbe, N.E. (1983). Results
of boron potassium nitrogen fertilizer experiment on Amazon Cocoa in Nigeria. Nigeria Journal of Applied Science 1, 124-128.
Ojeniyi, S.O. (1986). Relationship between
age of cocoa (Theobroma cacao) trees and soil nutrient contents. Turrialba 36(2), 245-262.
Ponsu Marc and Gauthayron, J. (2003).
Handbook of soil analysis. Mineralogical organic and inorganic methods. Springer-Verlag, Berlin. New York. Pp 995.
192
Akanni, Odedina and Ojeniyi NJSS/22(1)/2012

Top Related