


Languages
Pages
Legal

Next-Generation Sequencing Technologies
Next-Generation Sequencing Technologies
Nicholas E. Navin, Ph.D. MD Anderson Cancer Center
Dept. Genetics Dept. Bioinformatics
Introduction to Bioinformatics GS011062
Next-Generation Sequencing Technologies
Nicholas E. Navin, Ph.D.
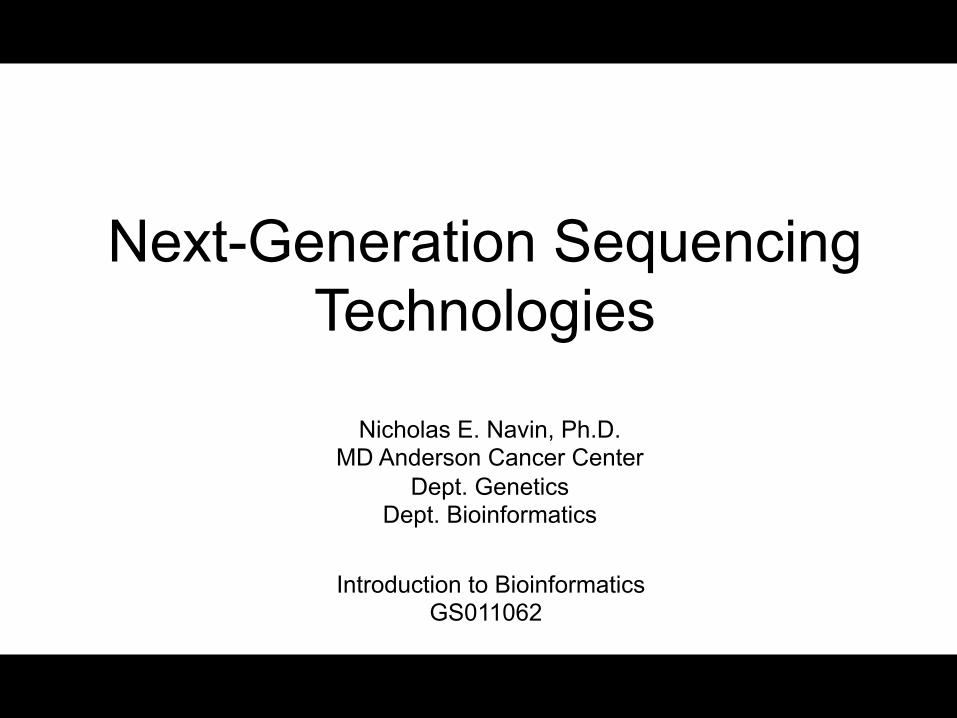
Zero-Generation First-Generation Second-Generation
Output: 700bp / day Output: 384kb /day Output: 1 gigabase / day
1970s-80s 1980s-90s 2000s
Generations of Sequencing Technologies
Sanger Chain Termination Radiolabelling
Automated Fluorescent Capillary Sequencers
Massively Parallel Sequencing
ABI3700 454 Pyrosequencer
Next-Generation Sequencing Technologies
Nicholas E. Navin, Ph.D.
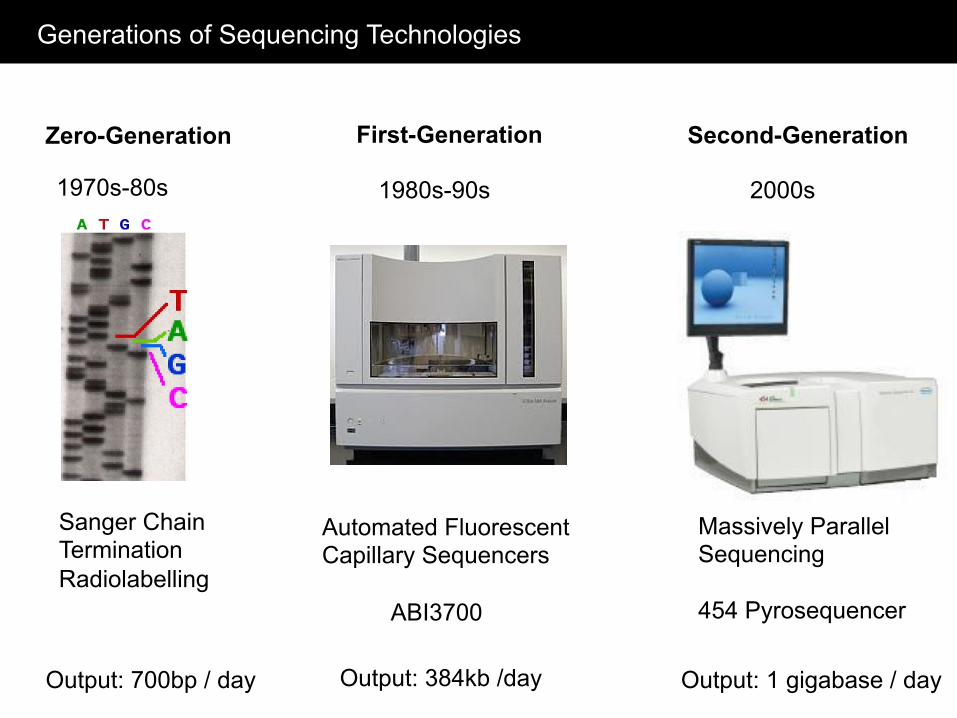
Third-Generation Second-Generation
Output: 150gb / week Read Length: 100bp
Output: 1gb /day Read Length: 10kb
Output: ? Read Length: 40kb
2005-2012 2010 2012
Next-Generation Sequencing Technologies
Illumina HiSeq2000
PacBio Real-time sequencing Oxford Nanopore
Sequencing
Third-Generation
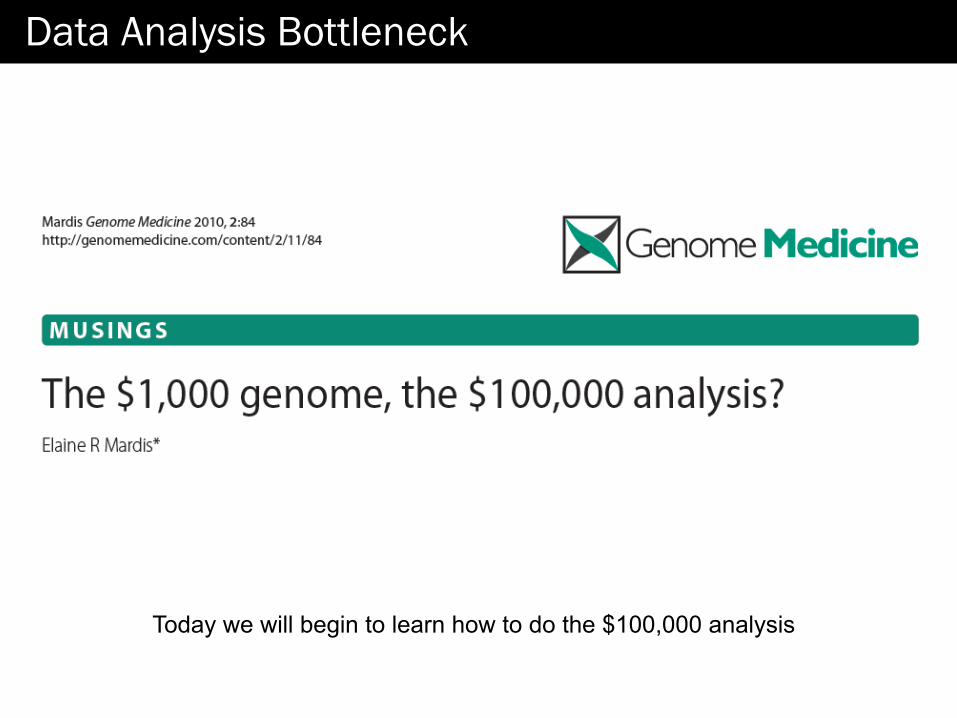
Data Analysis Bottleneck
Today we will begin to learn how to do the $100,000 analysis
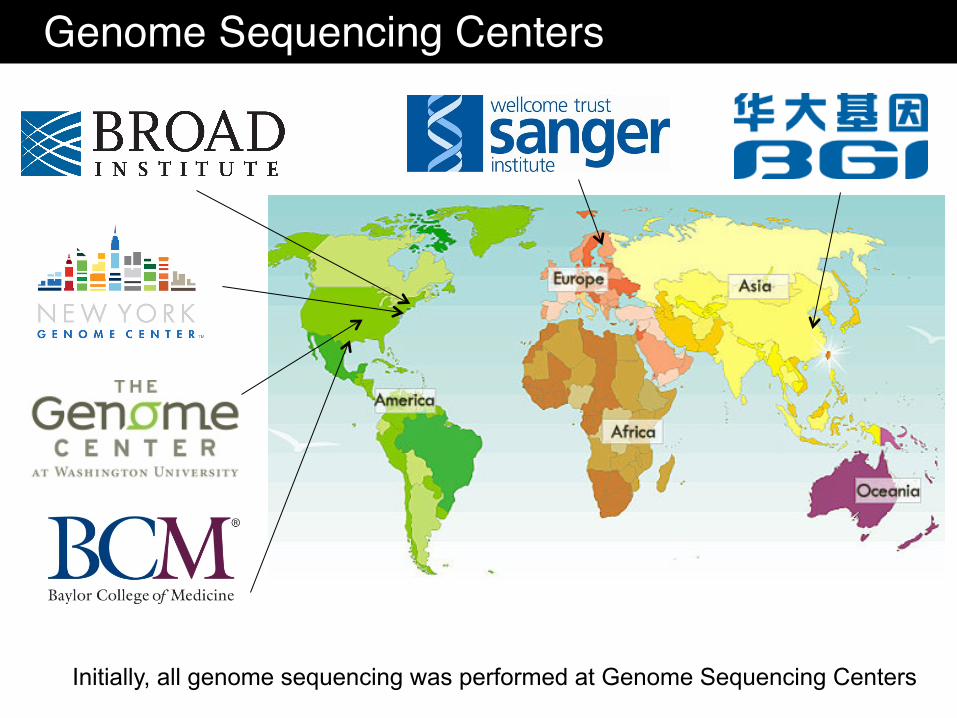
Genome Sequencing Centers!
Initially, all genome sequencing was performed at Genome Sequencing Centers

Today NGS can be performed at most Universities
Many Universities (including MD Anderson) have sequencing core facilities that can sequence DNA or RNA samples provided by users
Machines such as the Illumina HiSeq 2000 can generate: ~150 gigabases per week Very low error rates: 0.01% ~2 human genomes at 40-50X coverage Cost of sequencing Genome: $5000 Exome: $1000 Transcriptome: $500
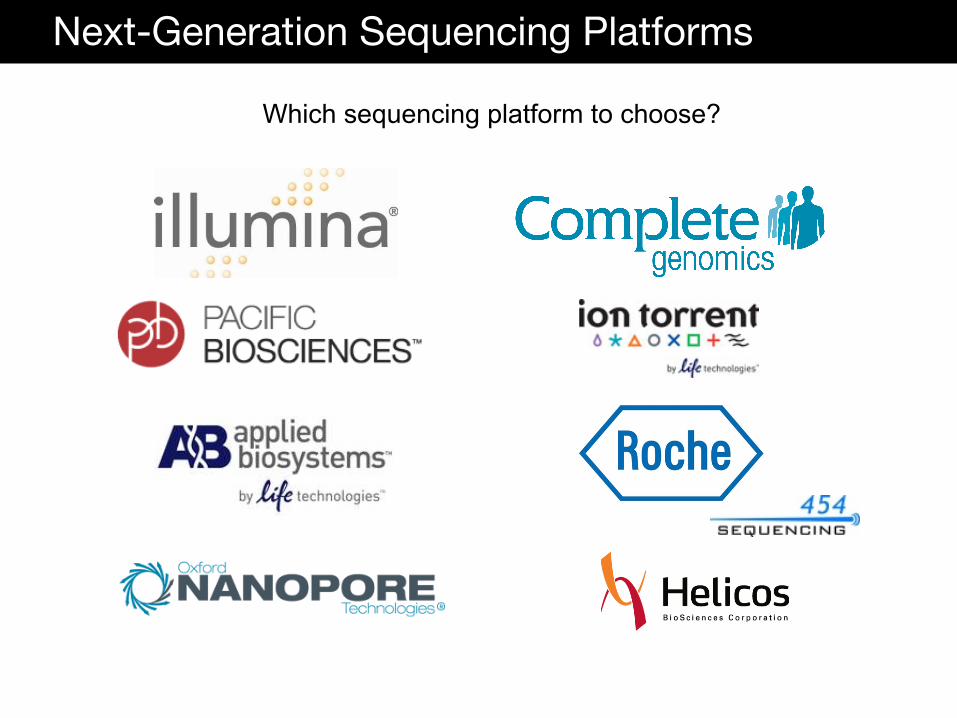
Next-Generation Sequencing Platforms
Which sequencing platform to choose?
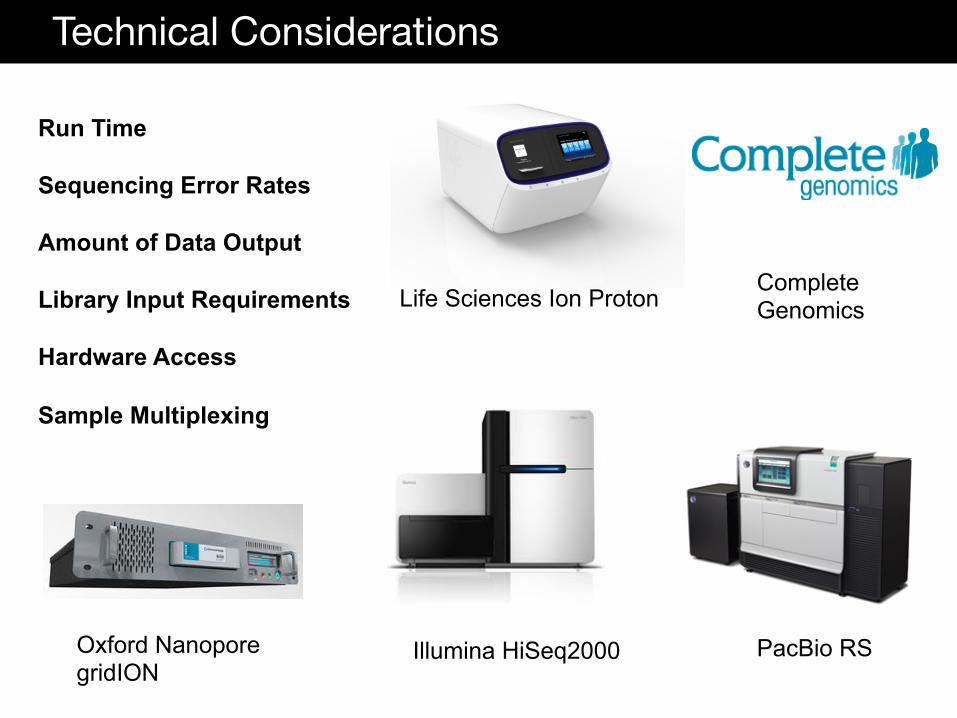
Technical Considera/ons: Sequencing Pla6orms
Run Time Sequencing Error Rates Amount of Data Output Library Input Requirements Hardware Access Sample Multiplexing
Illumina HiSeq2000
PacBio RS
Life Sciences Proton Ion Life Sciences Ion Proton
Complete Genomics
Oxford Nanopore gridION
Technical Considerations
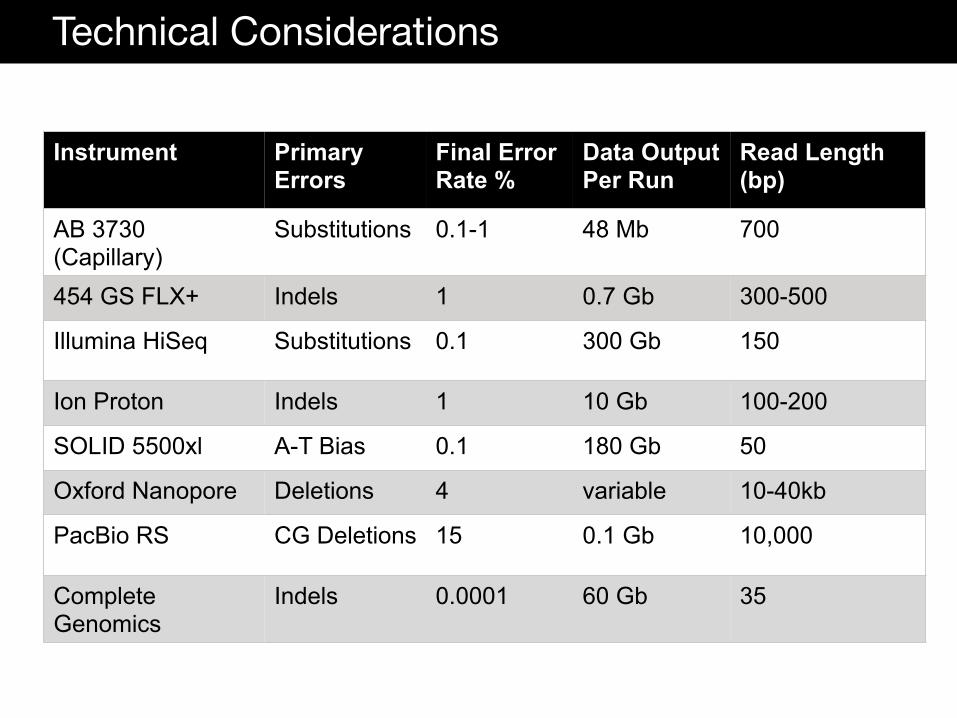
Instrument Primary Errors
Final Error Rate %
Data Output Per Run
Read Length (bp)
AB 3730 (Capillary)
Substitutions 0.1-1 48 Mb 700
454 GS FLX+ Indels 1 0.7 Gb 300-500
Illumina HiSeq Substitutions 0.1 300 Gb 150
Ion Proton Indels 1 10 Gb 100-200
SOLID 5500xl A-T Bias 0.1 180 Gb 50
Oxford Nanopore Deletions 4 variable 10-40kb
PacBio RS CG Deletions 15 0.1 Gb 10,000
Complete Genomics
Indels 0.0001 60 Gb 35
Technical Considerations
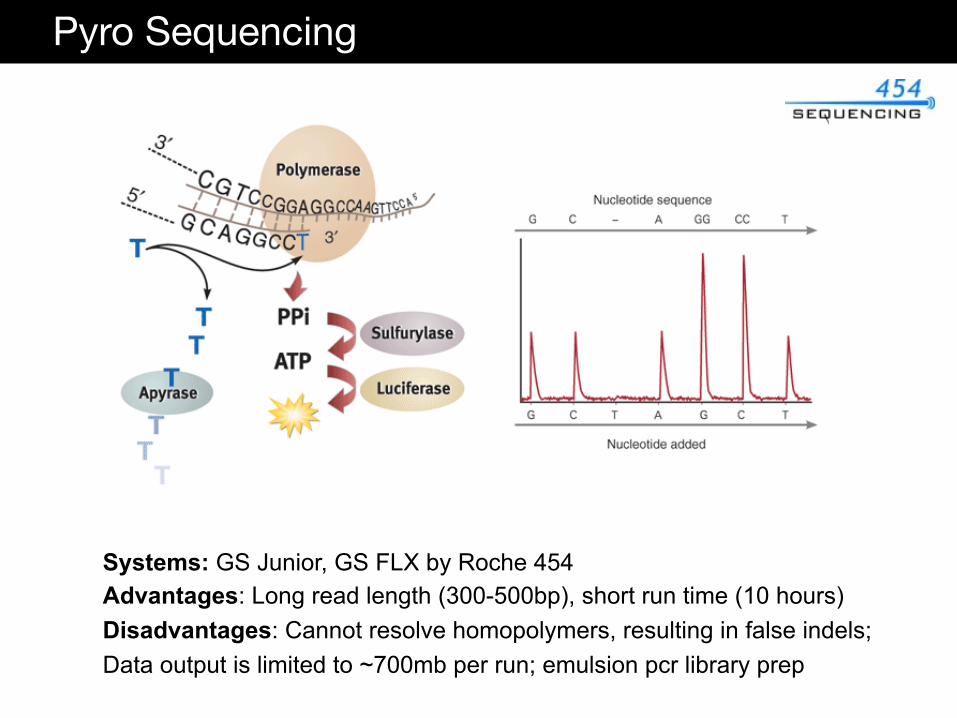
Pyro Sequencing
Systems: GS Junior, GS FLX by Roche 454 Advantages: Long read length (300-500bp), short run time (10 hours) Disadvantages: Cannot resolve homopolymers, resulting in false indels; Data output is limited to ~700mb per run; emulsion pcr library prep
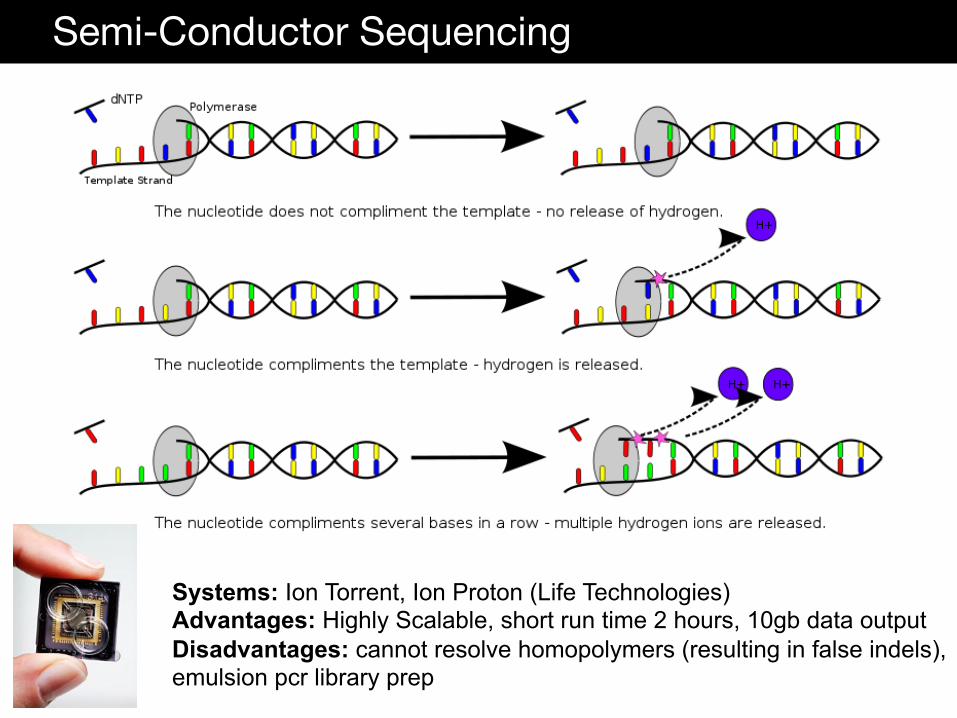
Semi-Conductor Sequencing
Systems: Ion Torrent, Ion Proton (Life Technologies) Advantages: Highly Scalable, short run time 2 hours, 10gb data output Disadvantages: cannot resolve homopolymers (resulting in false indels), emulsion pcr library prep

Sequencing by Synthesis (Illumina)
Illumina Video
Systems: HiSeq2000 MiSeq, GA2 (Illumina) Advantages: High data output (150gb per run), Paired-end sequencing, inexpensive, resolves homopolymers well Disadvantages: Long runtime (1 hour per base), must run 8 lanes in parallel (hiseq)
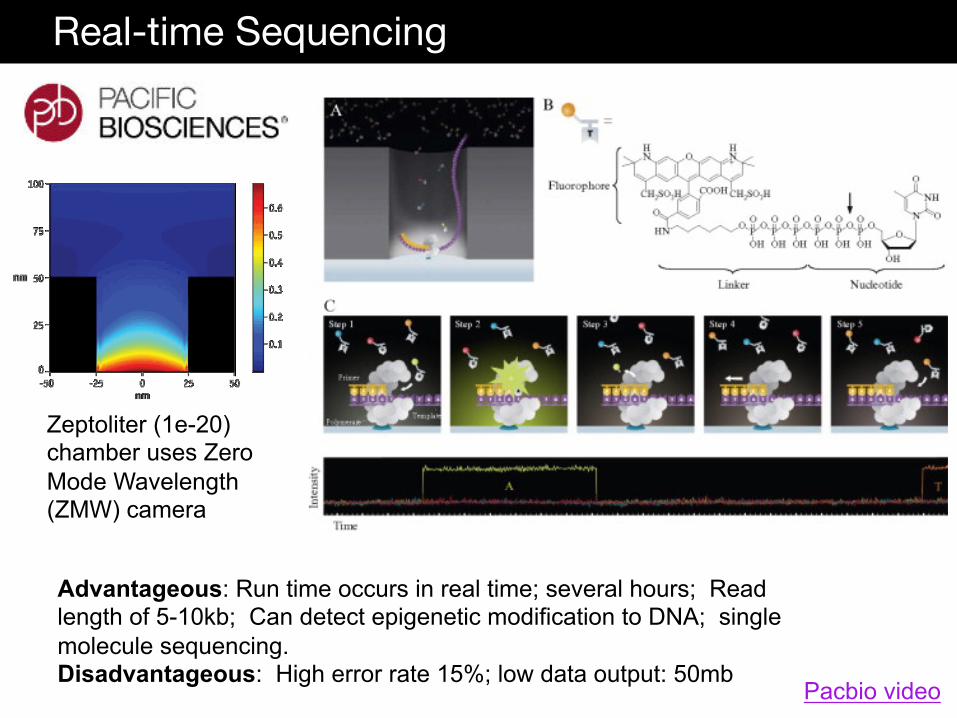
Real-time Sequencing
Advantageous: Run time occurs in real time; several hours; Read length of 5-10kb; Can detect epigenetic modification to DNA; single molecule sequencing. Disadvantageous: High error rate 15%; low data output: 50mb
Zeptoliter (1e-20) chamber uses Zero Mode Wavelength (ZMW) camera
Pacbio video
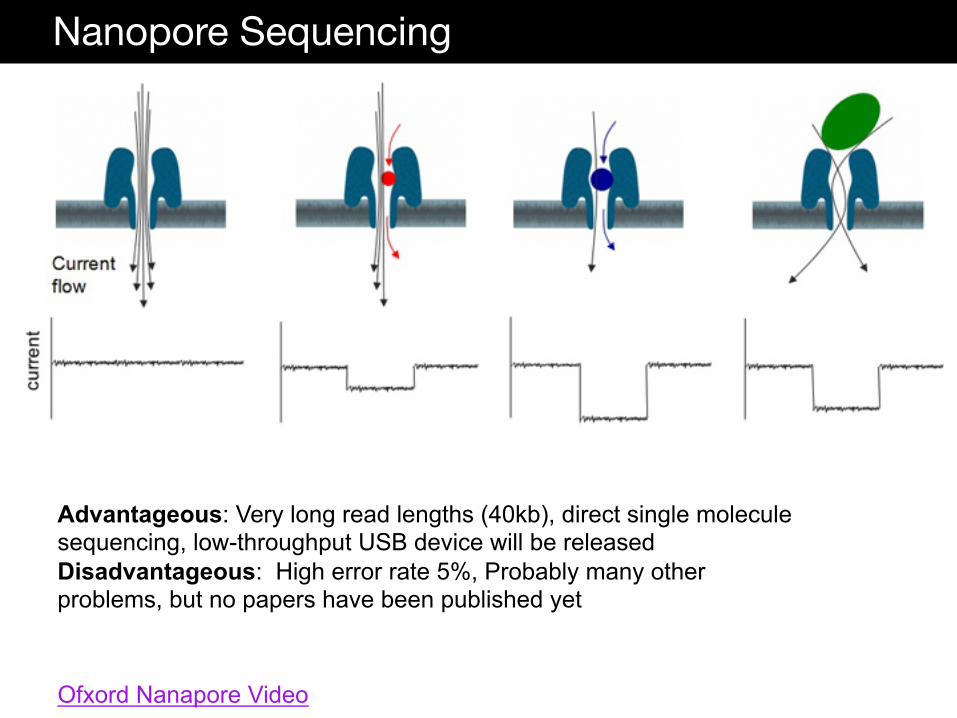
Nanopore Sequencing
Ofxord Nanapore Video
Advantageous: Very long read lengths (40kb), direct single molecule sequencing, low-throughput USB device will be released Disadvantageous: High error rate 5%, Probably many other problems, but no papers have been published yet
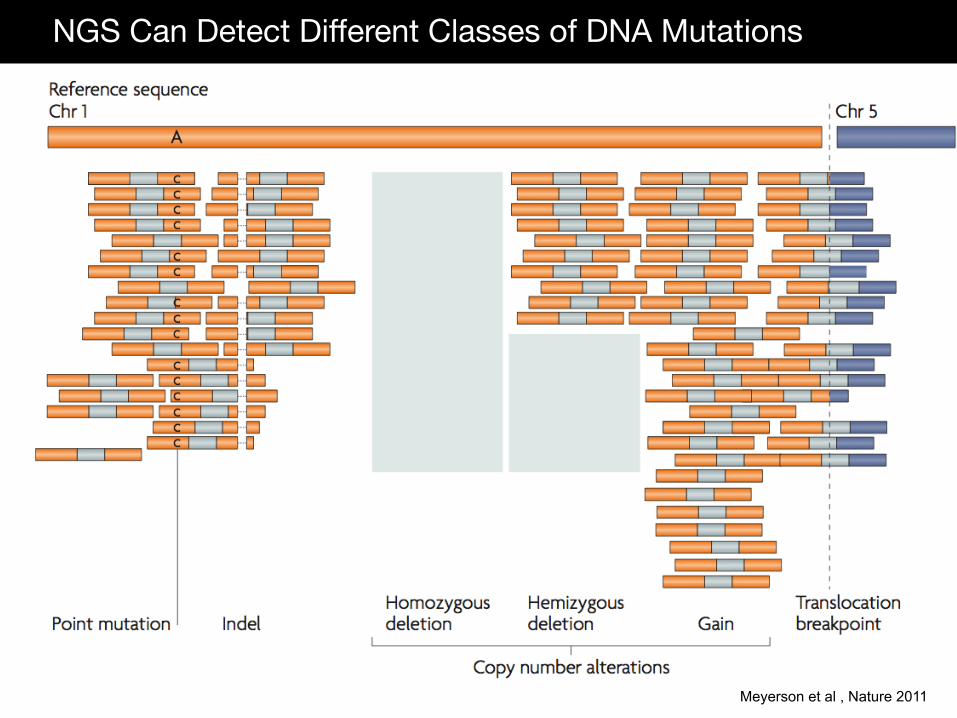
NGS Can Detect Different Classes of DNA Mutations
Sequencing throughput has increased from 700 bases per run to 150 gigabases per run on the Illumina HiSeq2000
Meyerson et al , Nature 2011
Applications of NGS
DNA Copy Number Amplifications and Deletions Structural Variations (translocations, inversions) Indels (insertions and deletions) Point mutations (nonsense, missense, splice-site) RNA RNA expression levels (mRNA, microRNA, lincRNA) Alternative Transcripts Fusion transcripts Protein Binding Chip-Seq Epigenetic Bisulfite Sequencing Third Generation Sequencing Platforms
Illumina Next-Generation Sequencing
Introduction to Bioinformatics
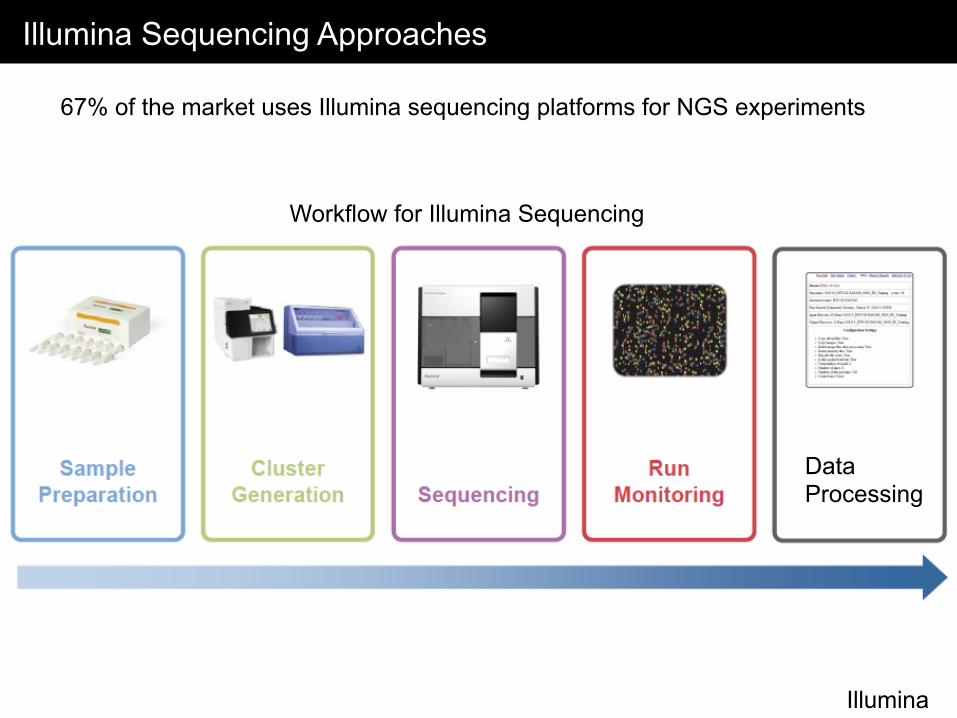
Illumina Sequencing Approaches
Single-End Sequencing
Paired-End Sequencing
Resulting Data One sequence read per molecule; good for detecting point mutations and small indels
Mate-Pair Sequencing
Good for genome assembly and resolving large regions with repetitive DNA elements
Illumina
67% of the market uses Illumina sequencing platforms for NGS experiments
Data Processing
Workflow for Illumina Sequencing
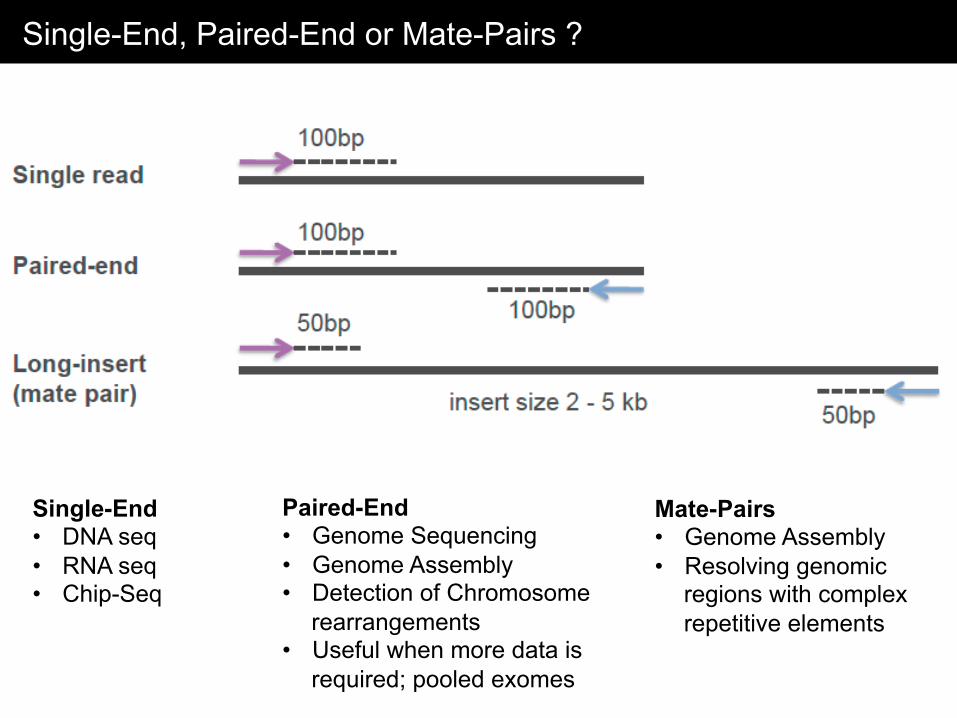
Single-End, Paired-End or Mate-Pairs ?
Single-End • DNA seq • RNA seq • Chip-Seq
Paired-End • Genome Sequencing • Genome Assembly • Detection of Chromosome
rearrangements • Useful when more data is
required; pooled exomes
Mate-Pairs • Genome Assembly • Resolving genomic
regions with complex repetitive elements
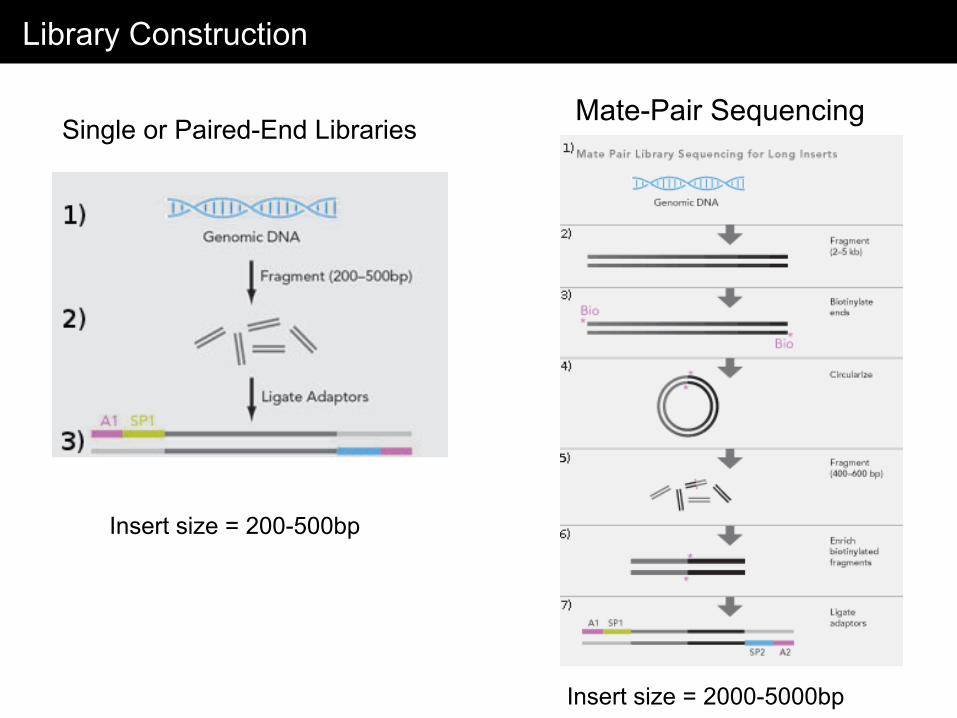
Library Construction
Single or Paired-End Libraries Mate-Pair Sequencing
Insert size = 200-500bp
Insert size = 2000-5000bp
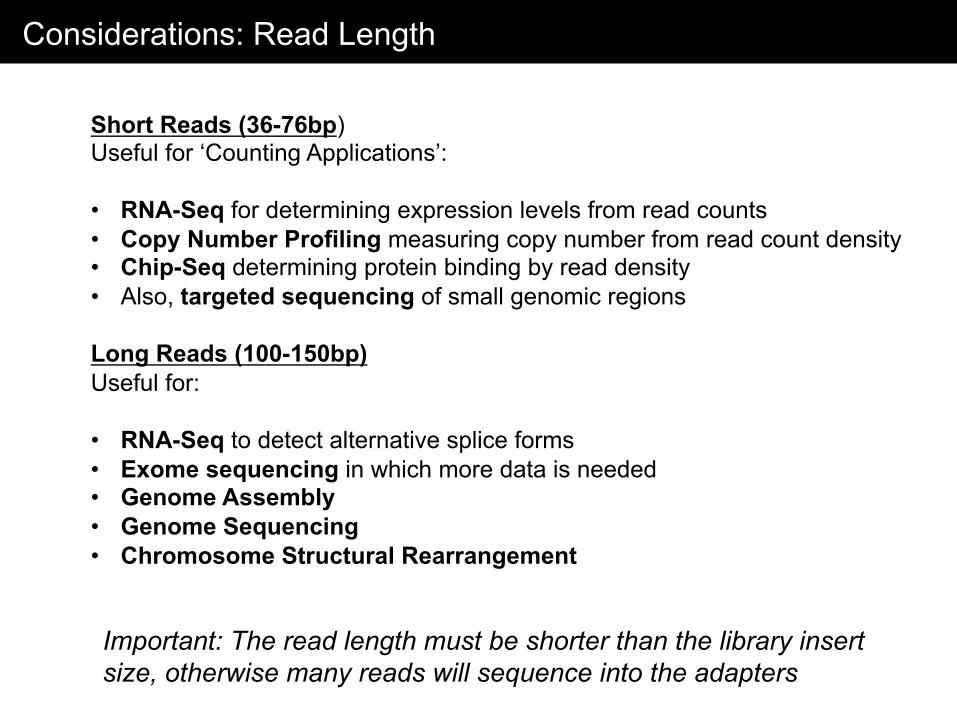
Considerations: Read Length
Short Reads (36-76bp) Useful for ‘Counting Applications’: • RNA-Seq for determining expression levels from read counts • Copy Number Profiling measuring copy number from read count density • Chip-Seq determining protein binding by read density • Also, targeted sequencing of small genomic regions Long Reads (100-150bp) Useful for: • RNA-Seq to detect alternative splice forms • Exome sequencing in which more data is needed • Genome Assembly • Genome Sequencing • Chromosome Structural Rearrangement
Important: The read length must be shorter than the library insert size, otherwise many reads will sequence into the adapters
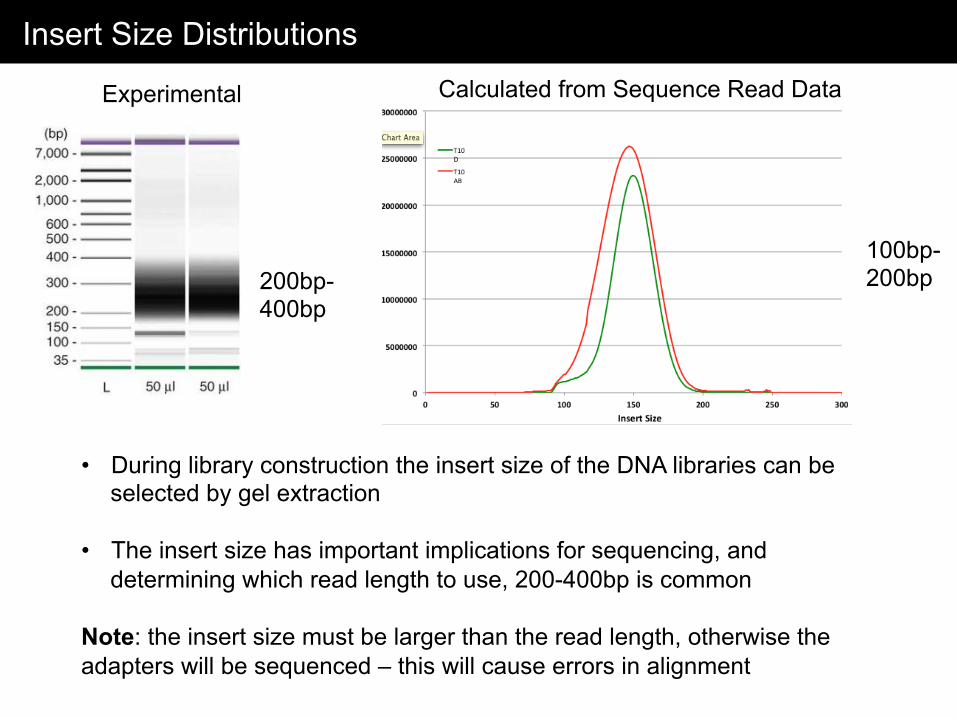
Insert Size Distributions
• During library construction the insert size of the DNA libraries can be selected by gel extraction
• The insert size has important implications for sequencing, and
determining which read length to use, 200-400bp is common Note: the insert size must be larger than the read length, otherwise the adapters will be sequenced – this will cause errors in alignment
200bp-400bp
100bp-200bp
Experimental Calculated from Sequence Read Data
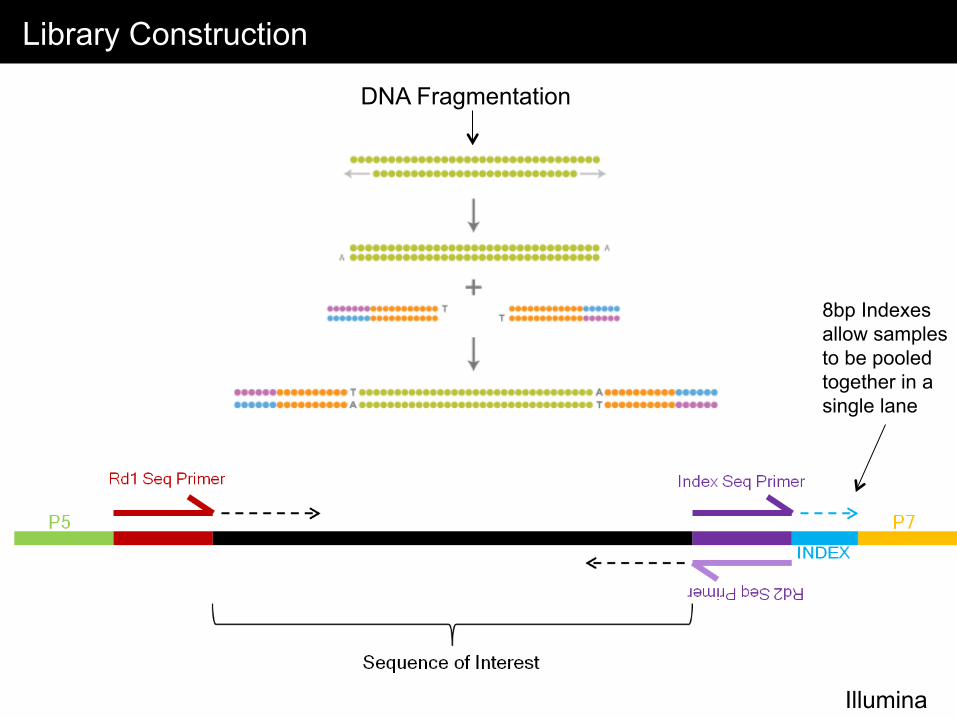
Library Construction
Illumina
8bp Indexes allow samples to be pooled together in a single lane
DNA Fragmentation
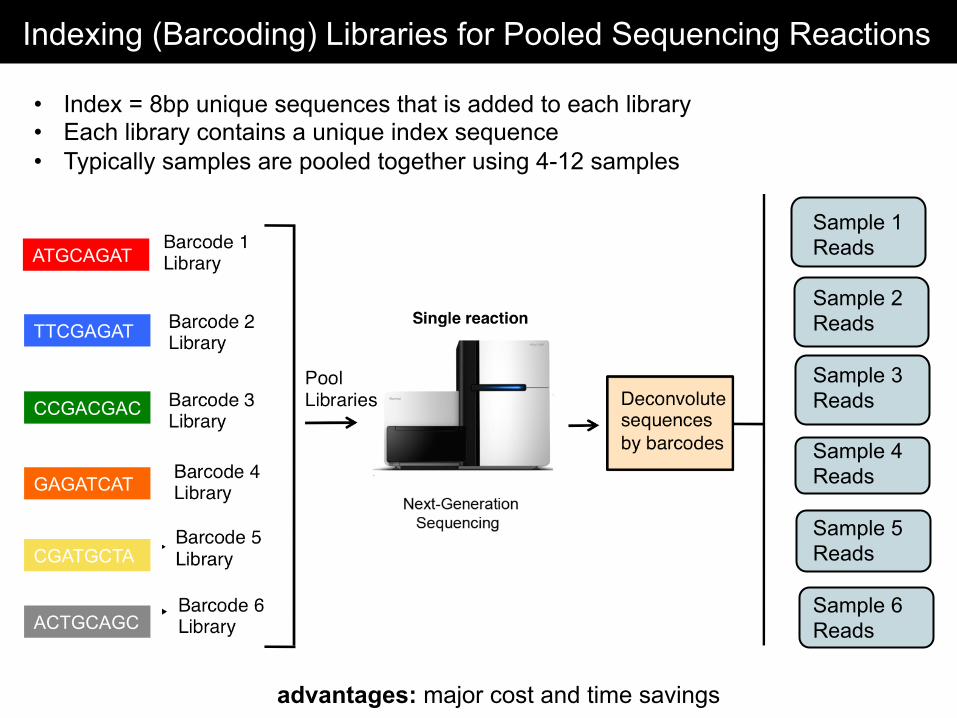
Indexing (Barcoding) Libraries for Pooled Sequencing Reactions
• Index = 8bp unique sequences that is added to each library • Each library contains a unique index sequence • Typically samples are pooled together using 4-12 samples
advantages: major cost and time savings
ATGCAGAT
TTCGAGAT
CCGACGAC
GAGATCAT
CGATGCTA
ACTGCAGC
Sample 1 Reads Sample 2 Reads Sample 3 Reads Sample 4 Reads Sample 5 Reads Sample 6 Reads

Exome Capture
For many research projects it may be advantageous to sequence only the coding regions of the human genome (the exome) This can be achieved using exome capture kits (Illumina, Agilent, Nimblegen) to capture DNA in exonic regions by hybridizing to biotinylated probes before sequencing
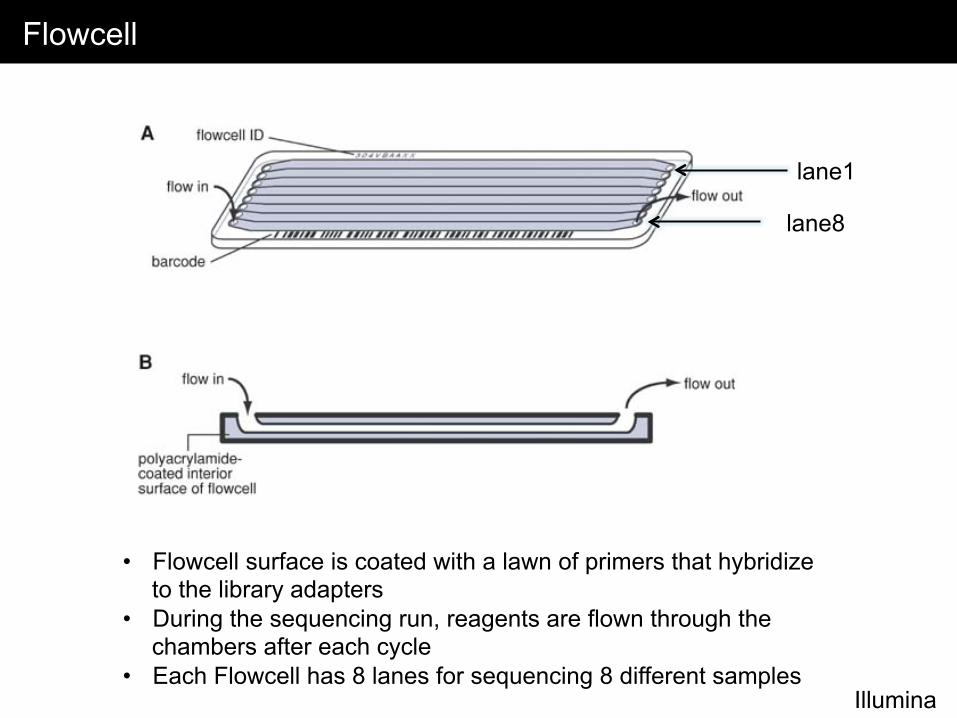
Flowcell
Illumina
lane1
lane8
• Flowcell surface is coated with a lawn of primers that hybridize to the library adapters
• During the sequencing run, reagents are flown through the chambers after each cycle
• Each Flowcell has 8 lanes for sequencing 8 different samples
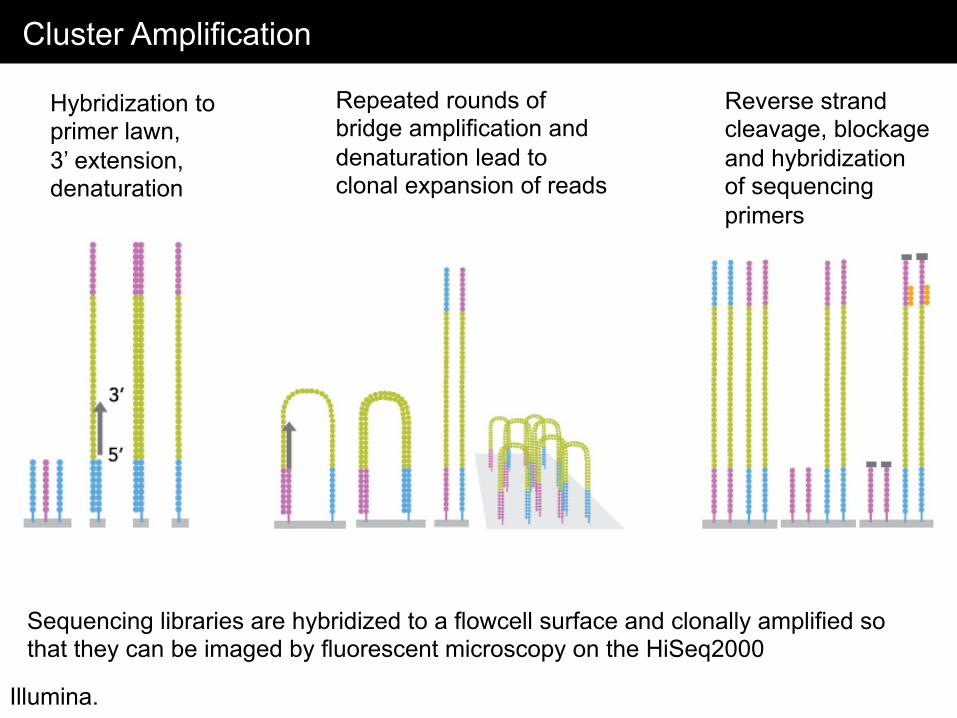
Cluster Amplification
Illumina.
Sequencing libraries are hybridized to a flowcell surface and clonally amplified so that they can be imaged by fluorescent microscopy on the HiSeq2000
Hybridization to primer lawn, 3’ extension, denaturation
Repeated rounds of bridge amplification and denaturation lead to clonal expansion of reads
Reverse strand cleavage, blockage and hybridization of sequencing primers
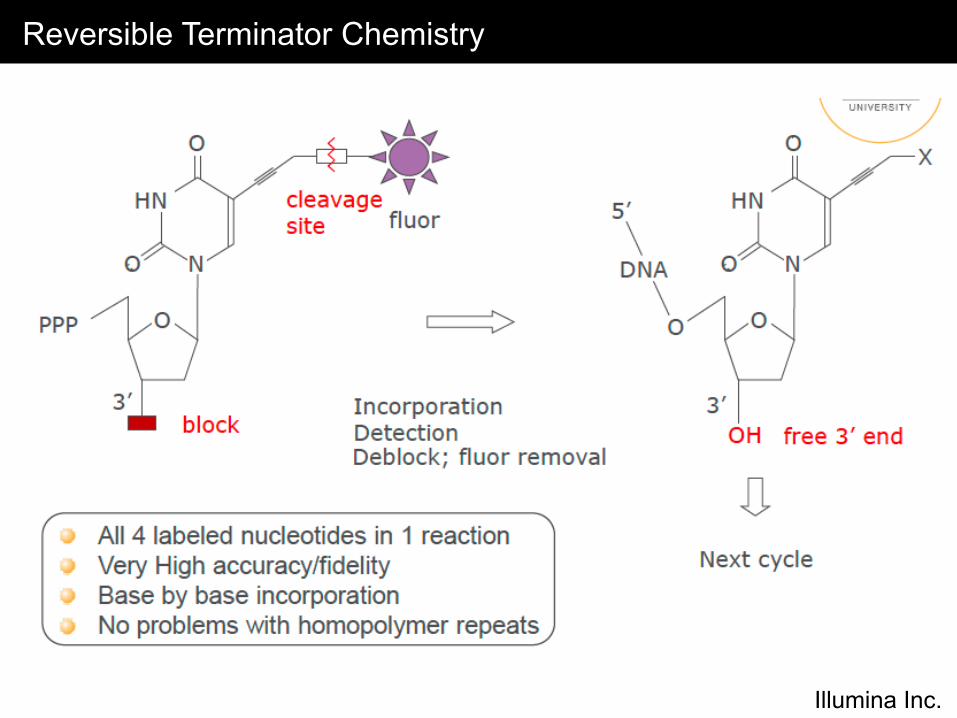
Reversible Terminator Chemistry
Illumina Inc.
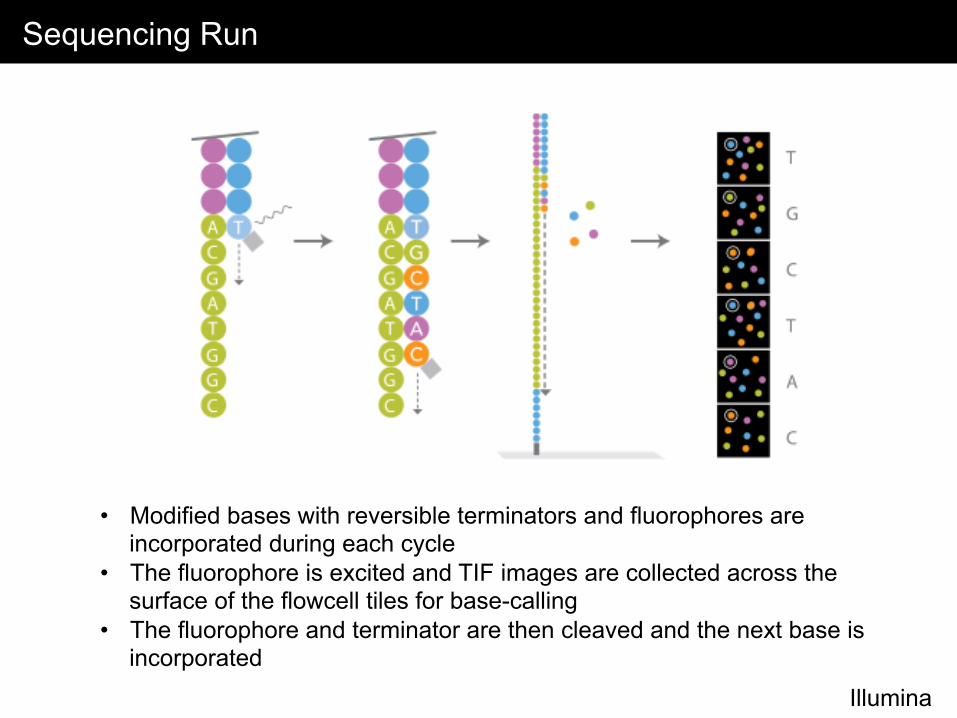
Sequencing Run
Illumina
• Modified bases with reversible terminators and fluorophores are incorporated during each cycle
• The fluorophore is excited and TIF images are collected across the surface of the flowcell tiles for base-calling
• The fluorophore and terminator are then cleaved and the next base is incorporated
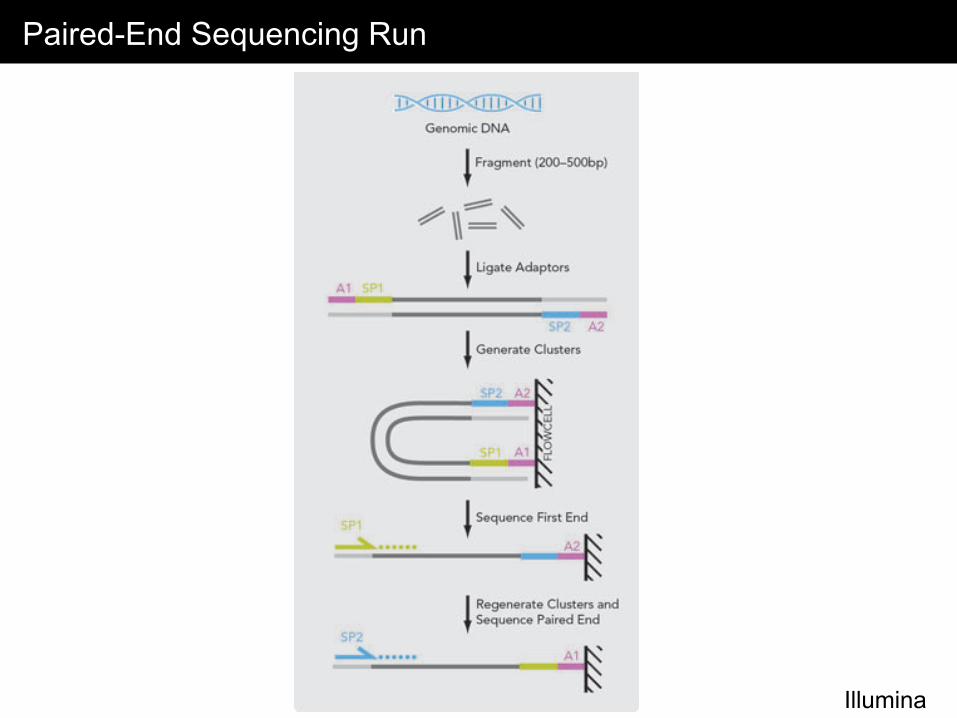
Paired-End Sequencing Run
Illumina
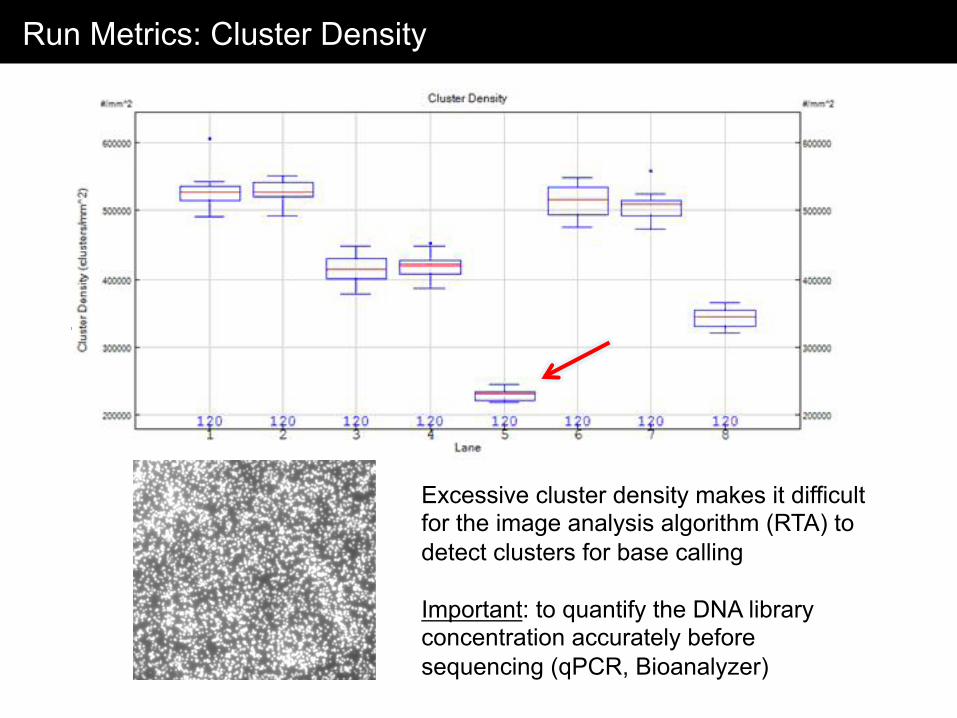
Run Metrics: Cluster Density
Excessive cluster density makes it difficult for the image analysis algorithm (RTA) to detect clusters for base calling Important: to quantify the DNA library concentration accurately before sequencing (qPCR, Bioanalyzer)
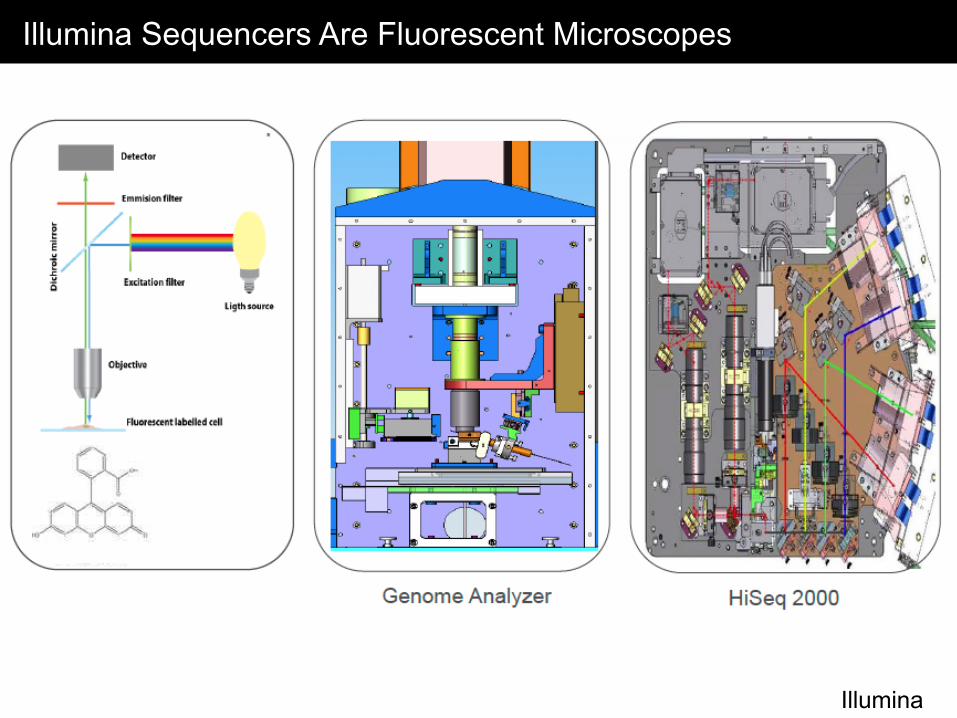
Illumina Sequencers Are Fluorescent Microscopes
Illumina
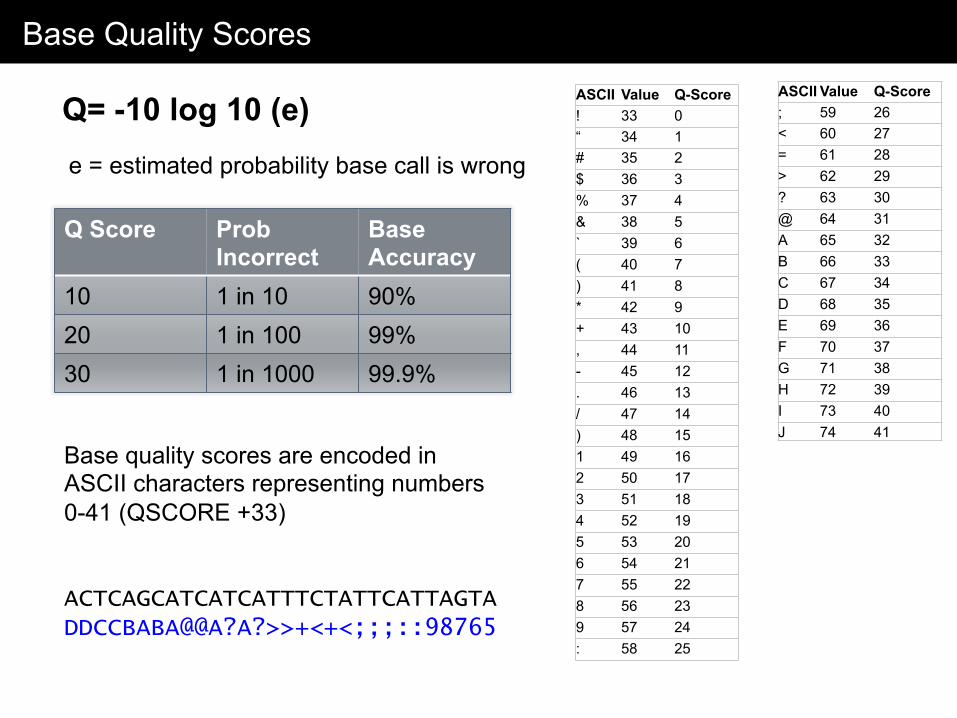
Base Quality Scores
Q= -10 log 10 (e) e = estimated probability base call is wrong
Q Score Prob Incorrect
Base Accuracy
10 1 in 10 90% 20 1 in 100 99% 30 1 in 1000 99.9%
Base quality scores are encoded in ASCII characters representing numbers 0-41 (QSCORE +33) ACTCAGCATCATCATTTCTATTCATTAGTA DDCCBABA@@A?A?>>+<+<;;;::98765
ASCII Value Q-Score ! 33 0 “ 34 1 # 35 2 $ 36 3 % 37 4 & 38 5 ` 39 6 ( 40 7 ) 41 8 * 42 9 + 43 10 , 44 11 - 45 12 . 46 13 / 47 14 ) 48 15 1 49 16 2 50 17 3 51 18 4 52 19 5 53 20 6 54 21 7 55 22 8 56 23 9 57 24 : 58 25
ASCII Value Q-Score ; 59 26 < 60 27 = 61 28 > 62 29 ? 63 30 @ 64 31 A 65 32 B 66 33 C 67 34 D 68 35 E 69 36 F 70 37 G 71 38 H 72 39 I 73 40 J 74 41
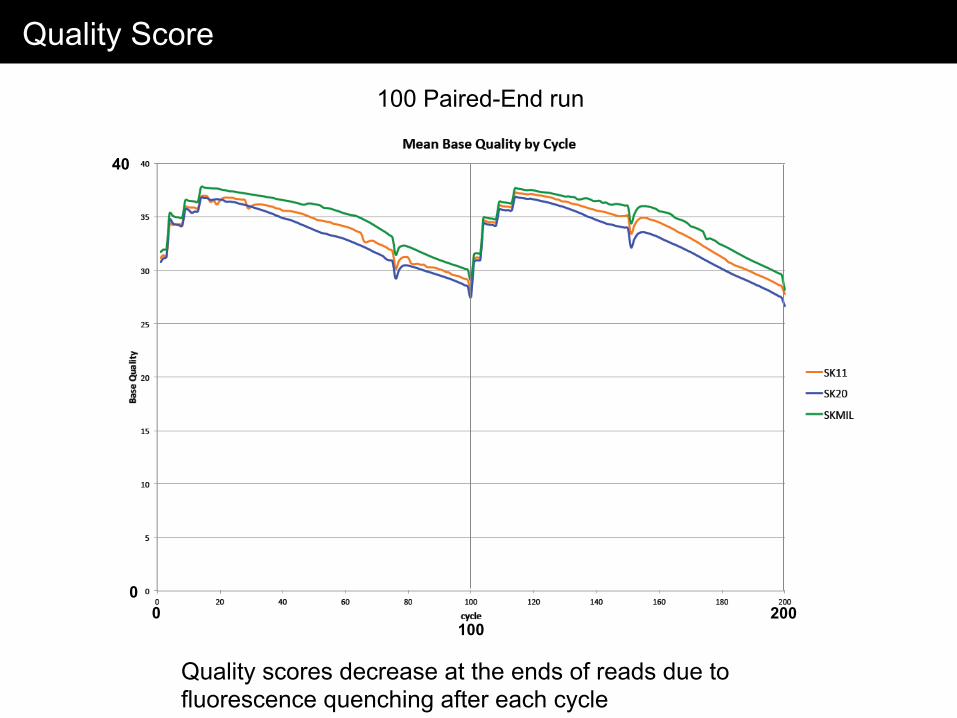
Quality Score
100 Paired-End run
Quality scores decrease at the ends of reads due to fluorescence quenching after each cycle
40
0 200
100 0
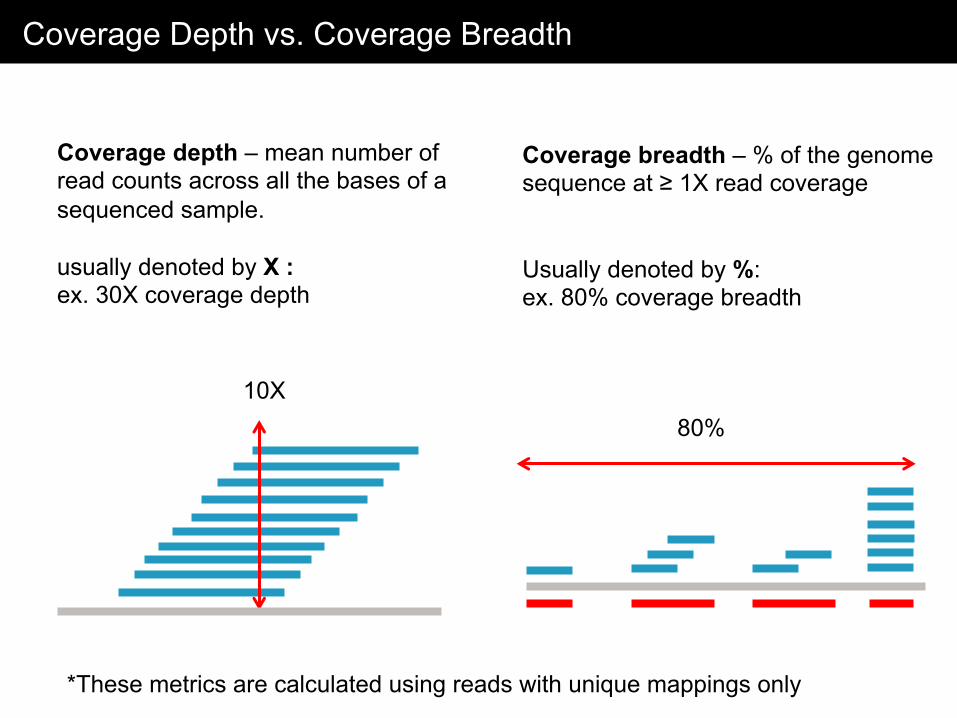
Coverage Depth vs. Coverage Breadth
Coverage depth – mean number of read counts across all the bases of a sequenced sample. usually denoted by X : ex. 30X coverage depth
10X
Coverage breadth – % of the genome sequence at ≥ 1X read coverage Usually denoted by %: ex. 80% coverage breadth
80%
*These metrics are calculated using reads with unique mappings only
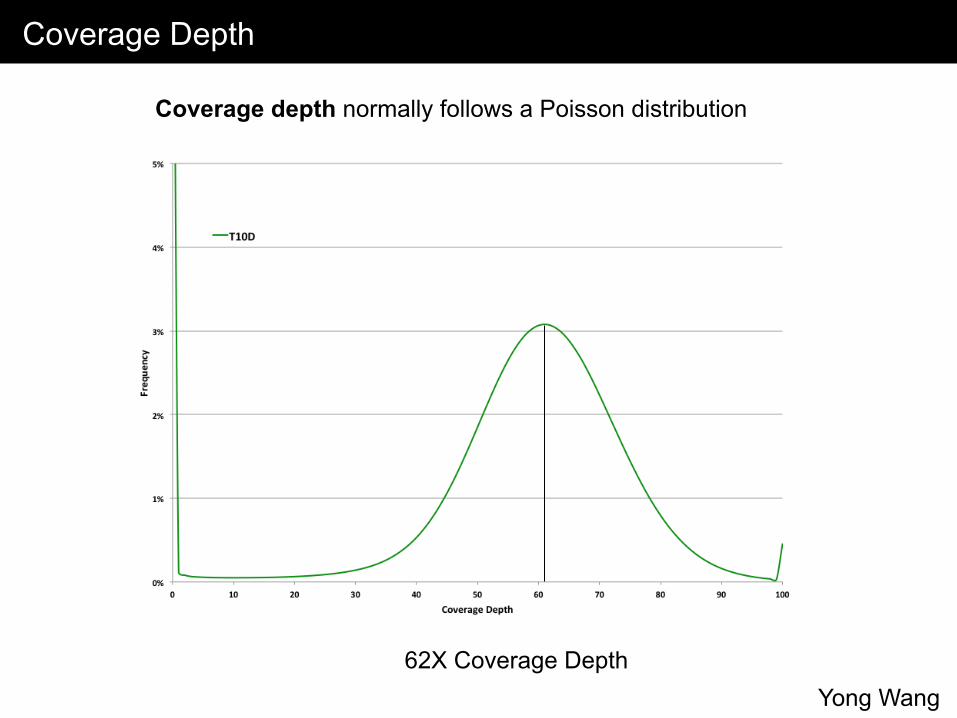
Coverage Depth
Coverage depth normally follows a Poisson distribution
62X Coverage Depth Yong Wang
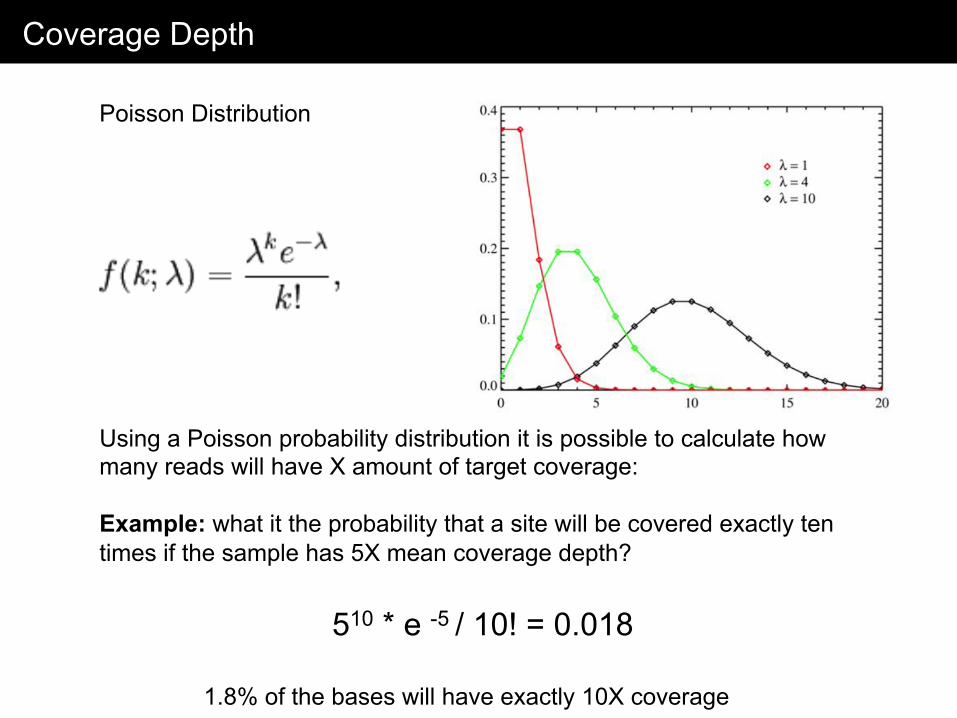
Coverage Depth
Using a Poisson probability distribution it is possible to calculate how many reads will have X amount of target coverage: Example: what it the probability that a site will be covered exactly ten times if the sample has 5X mean coverage depth?
Poisson Distribution
510 * e -5 / 10! = 0.018
1.8% of the bases will have exactly 10X coverage
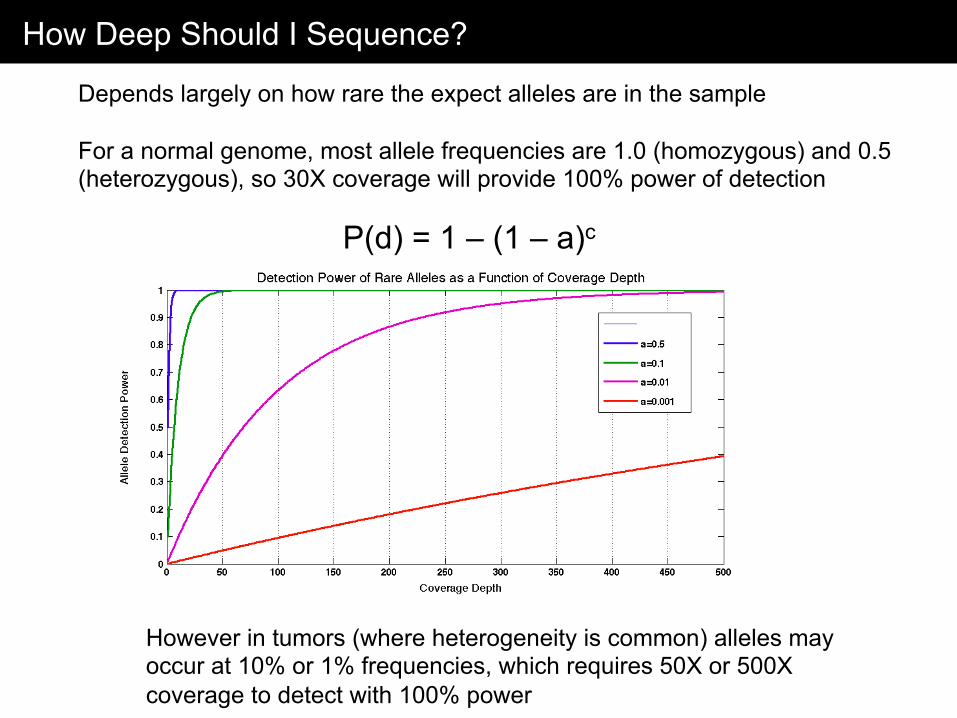
How Deep Should I Sequence?
Depends largely on how rare the expect alleles are in the sample For a normal genome, most allele frequencies are 1.0 (homozygous) and 0.5 (heterozygous), so 30X coverage will provide 100% power of detection
However in tumors (where heterogeneity is common) alleles may occur at 10% or 1% frequencies, which requires 50X or 500X coverage to detect with 100% power
P(d) = 1 – (1 – a)c
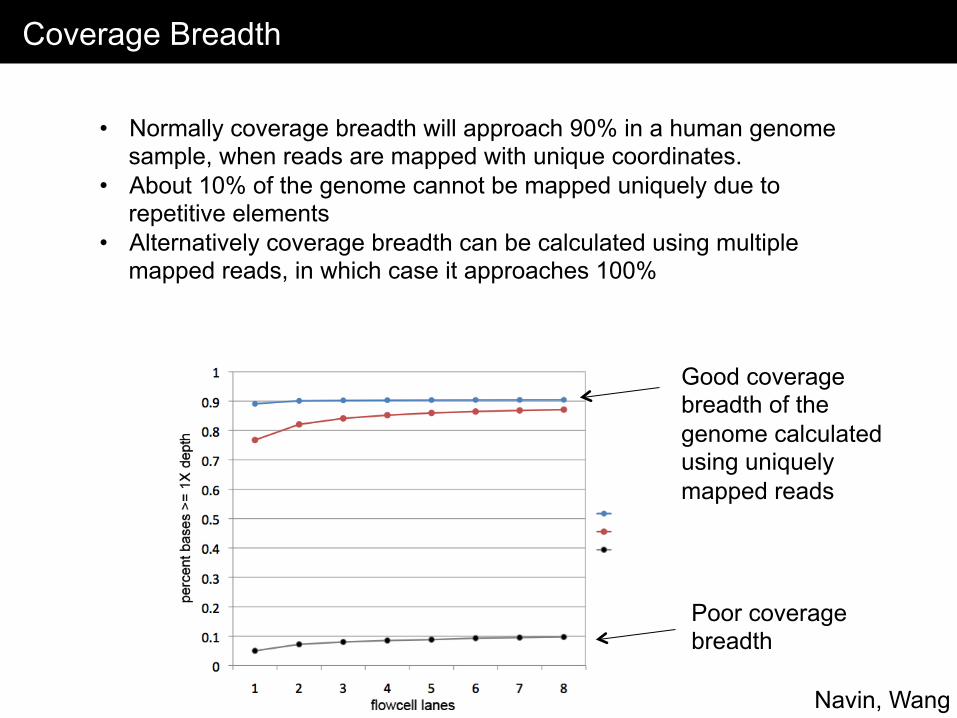
Coverage Breadth
Navin, Wang
• Normally coverage breadth will approach 90% in a human genome sample, when reads are mapped with unique coordinates.
• About 10% of the genome cannot be mapped uniquely due to repetitive elements
• Alternatively coverage breadth can be calculated using multiple mapped reads, in which case it approaches 100%
Good coverage breadth of the genome calculated using uniquely mapped reads
Poor coverage breadth
Data Processing Pipelines
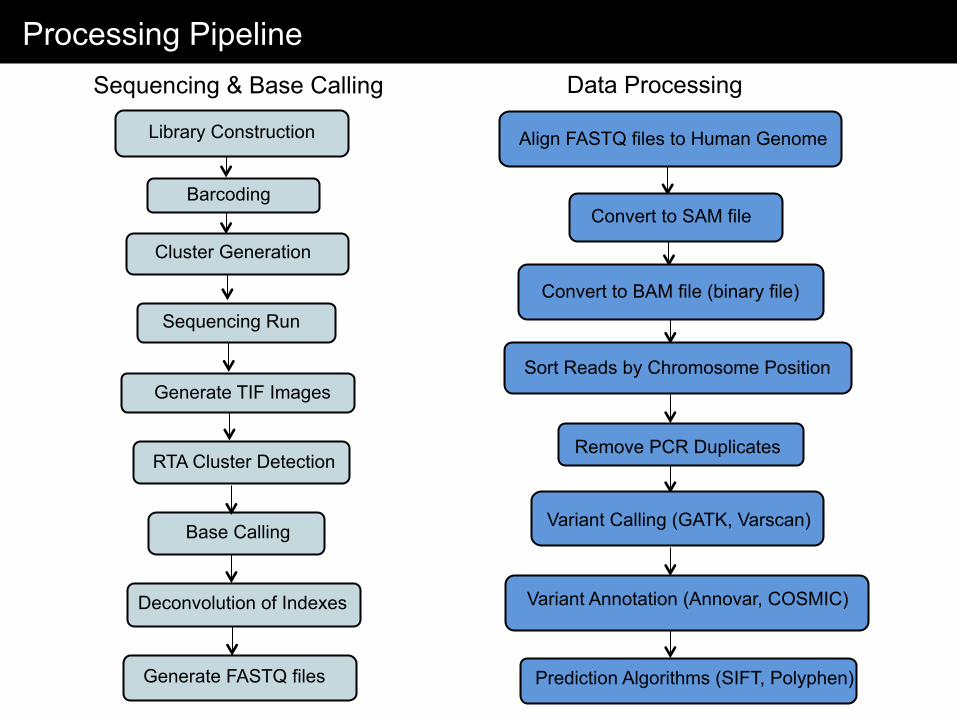
Processing Pipeline
Library Construction
Sequencing Run
Generate TIF Images
RTA Cluster Detection
Base Calling
Generate FASTQ files
Align FASTQ files to Human Genome
Sort Reads by Chromosome Position
Remove PCR Duplicates
Variant Calling (GATK, Varscan)
Convert to SAM file
Convert to BAM file (binary file)
Variant Annotation (Annovar, COSMIC)
Prediction Algorithms (SIFT, Polyphen)
Barcoding
Cluster Generation
Sequencing & Base Calling Data Processing
Deconvolution of Indexes
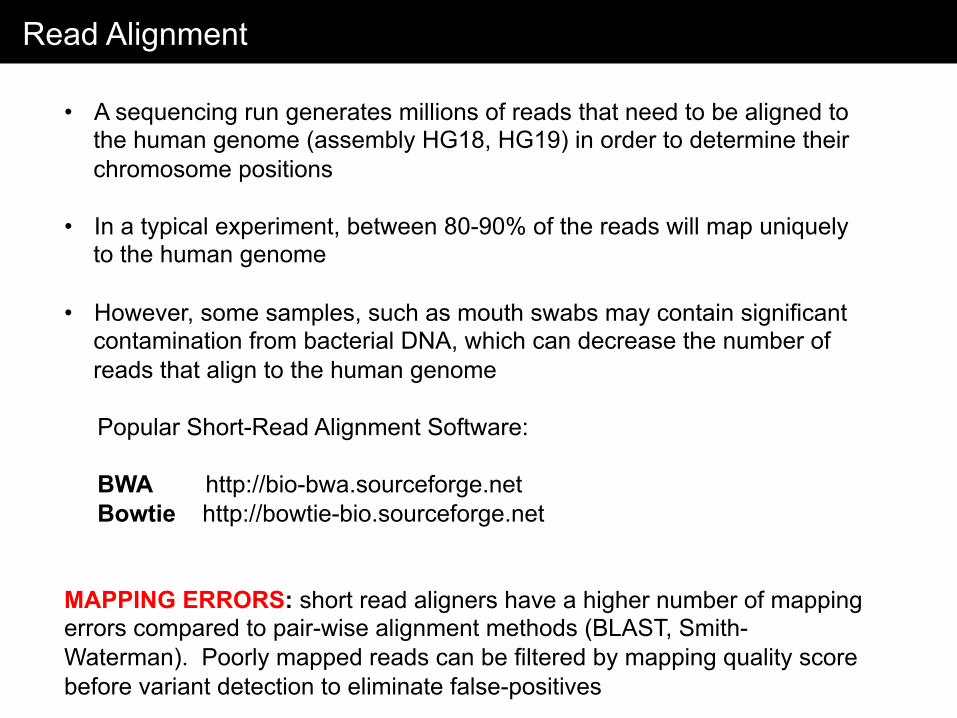
Read Alignment
Paired-End Sequencing
Mate-Pair Sequencing
Good for genome assembly and resolving large regions with repetitive DNA elements
• A sequencing run generates millions of reads that need to be aligned to the human genome (assembly HG18, HG19) in order to determine their chromosome positions
• In a typical experiment, between 80-90% of the reads will map uniquely to the human genome
• However, some samples, such as mouth swabs may contain significant
contamination from bacterial DNA, which can decrease the number of reads that align to the human genome
Popular Short-Read Alignment Software: BWA http://bio-bwa.sourceforge.net Bowtie http://bowtie-bio.sourceforge.net MAPPING ERRORS: short read aligners have a higher number of mapping errors compared to pair-wise alignment methods (BLAST, Smith-Waterman). Poorly mapped reads can be filtered by mapping quality score before variant detection to eliminate false-positives
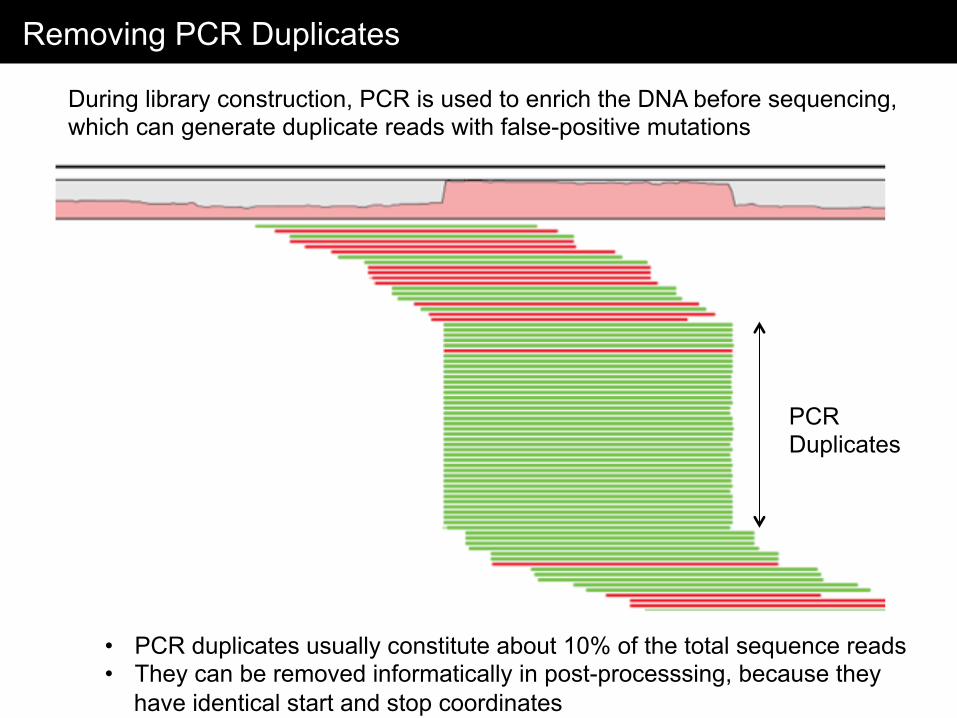
Removing PCR Duplicates
Single-End Sequencing
Paired-End Sequencing
Mate-Pair Sequencing
Good for genome assembly and resolving large regions with repetitive DNA elements
During library construction, PCR is used to enrich the DNA before sequencing, which can generate duplicate reads with false-positive mutations
• PCR duplicates usually constitute about 10% of the total sequence reads • They can be removed informatically in post-processsing, because they
have identical start and stop coordinates
PCR Duplicates
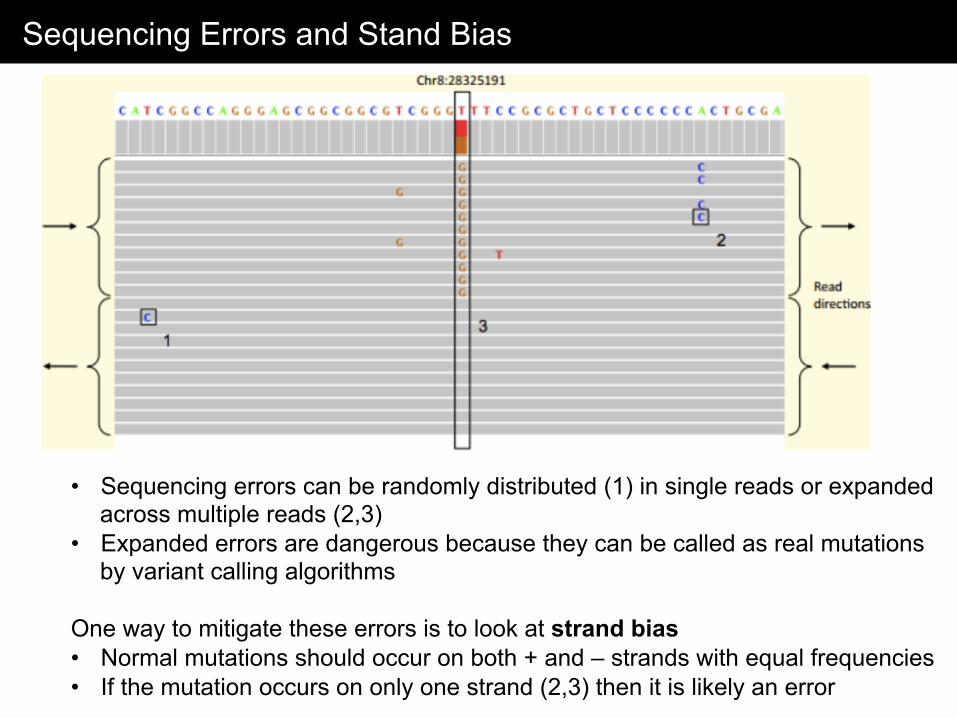
Sequencing Errors and Stand Bias
Paired-End Sequencing
Mate-Pair Sequencing
Good for genome assembly and resolving large regions with repetitive DNA elements
• Sequencing errors can be randomly distributed (1) in single reads or expanded across multiple reads (2,3)
• Expanded errors are dangerous because they can be called as real mutations by variant calling algorithms
One way to mitigate these errors is to look at strand bias • Normal mutations should occur on both + and – strands with equal frequencies • If the mutation occurs on only one strand (2,3) then it is likely an error
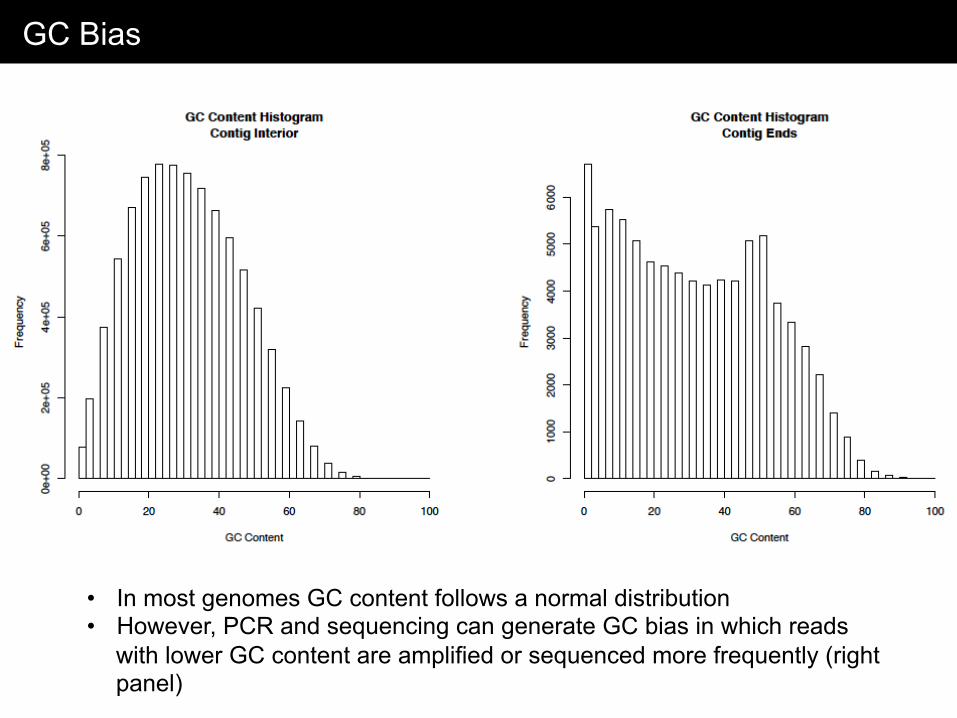
GC Bias
Paired-End Sequencing
Mate-Pair Sequencing
Good for genome assembly and resolving large regions with repetitive DNA elements
• In most genomes GC content follows a normal distribution • However, PCR and sequencing can generate GC bias in which reads
with lower GC content are amplified or sequenced more frequently (right panel)
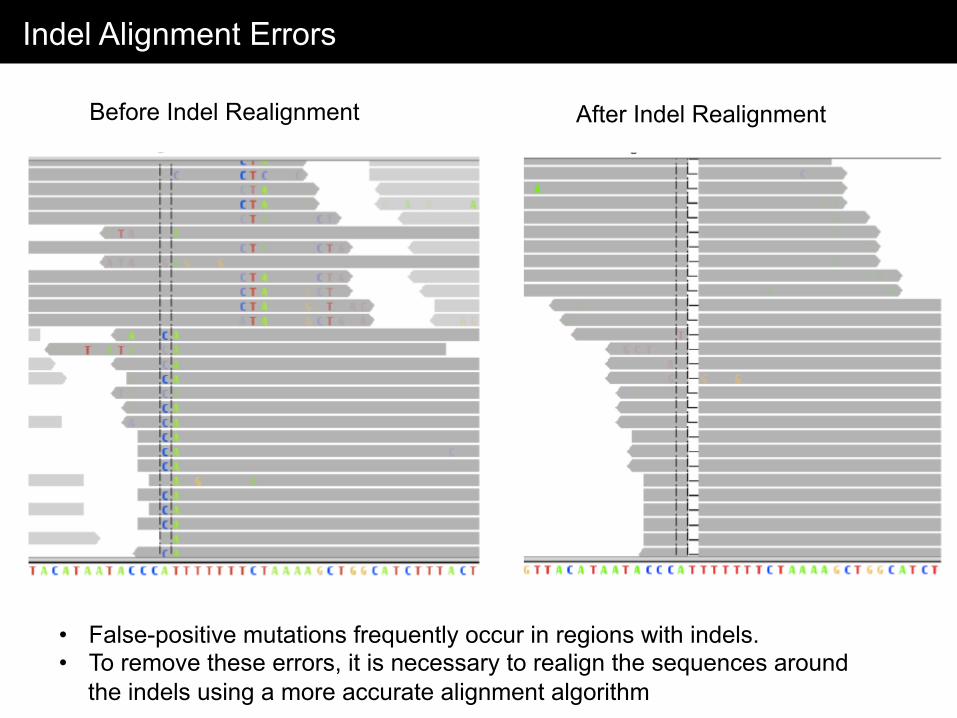
Indel Alignment Errors
Paired-End Sequencing
Mate-Pair Sequencing
Good for genome assembly and resolving large regions with repetitive DNA elements
• False-positive mutations frequently occur in regions with indels. • To remove these errors, it is necessary to realign the sequences around
the indels using a more accurate alignment algorithm
Before Indel Realignment After Indel Realignment
Summary
Single-End Sequencing
Paired-End Sequencing
Mate-Pair Sequencing
Good for genome assembly and resolving large regions with repetitive DNA elements
• Select the appropriate sequencing platform for your project and consider what type of biological information you are interested in measuring (DNA, RNA, CHIP, Epigenetics)
• Sequencing technologies are constantly evolving, understand the caveats and advantageous of each system. The newest platform is not always best.
• Consider the appropriate read length, single or paired end sequencing and whether indexing or exome capture is advantageous for your study
• Determine what target sequence depth is appropriate for your sample and calculate the number of lanes necessary to achieve that depth
• Be aware of false-positive technical errors (PCR amplification, sequencing errors, mapping errors) and how to mitigate them in your processing pipeline
Acknowledgements
Several slides in this lecture were provided by:
Jude Kendall (Cold Spring Harbor Laboratory)
Michael Schatz (Cold Spring Harbor Laboratory)
Yong Wang (MD Anderson)
Illumina Inc. (San Diego)
Future IPTC across the street
Top Related