


Languages
Pages
Legal

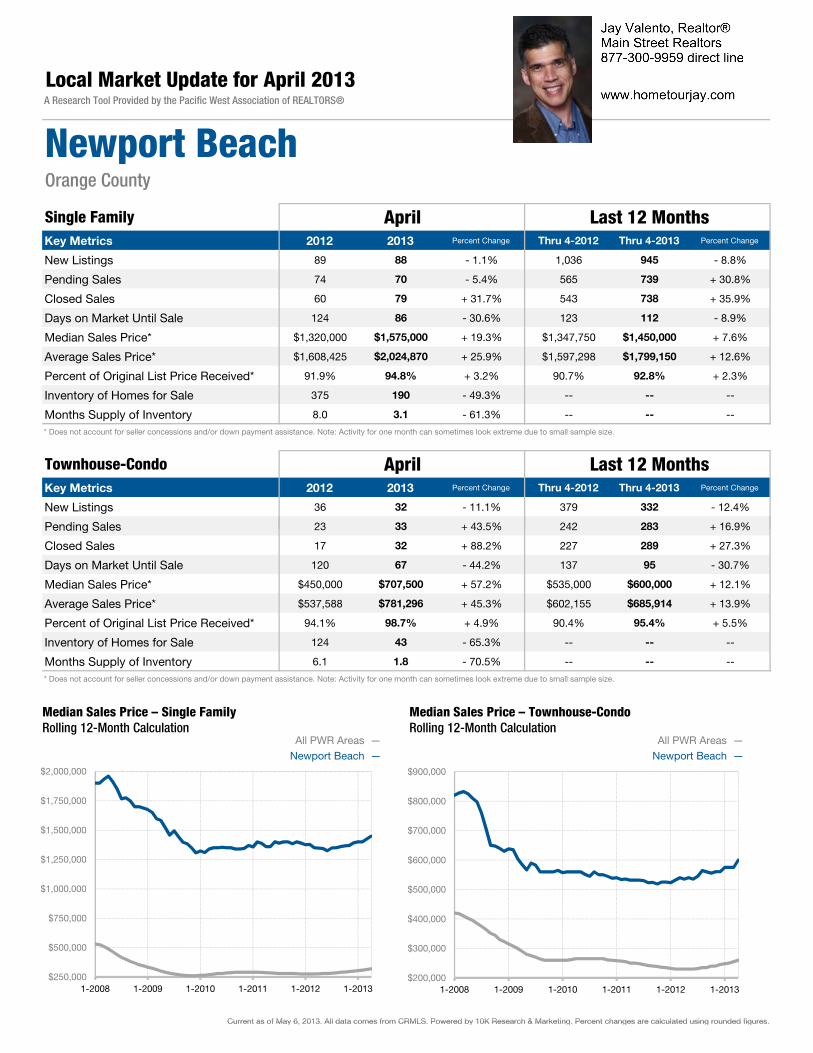
Key Metrics 2012 2013 Percent Change Thru 4-2012 Thru 4-2013 Percent Change
New Listings 89 88 - 1.1% 1,036 945 - 8.8%
Pending Sales 74 70 - 5.4% 565 739 + 30.8%
Closed Sales 60 79 + 31.7% 543 738 + 35.9%
Days on Market Until Sale 124 86 - 30.6% 123 112 - 8.9%
Median Sales Price* $1,320,000 $1,575,000 + 19.3% $1,347,750 $1,450,000 + 7.6%
Average Sales Price* $1,608,425 $2,024,870 + 25.9% $1,597,298 $1,799,150 + 12.6%
Percent of Original List Price Received* 91.9% 94.8% + 3.2% 90.7% 92.8% + 2.3%
Inventory of Homes for Sale 375 190 - 49.3% -- -- --
Months Supply of Inventory 8.0 3.1 - 61.3% -- -- --
* Does not account for seller concessions and/or down payment assistance. Note: Activity for one month can sometimes look extreme due to small sample size.
Key Metrics 2012 2013 Percent Change Thru 4-2012 Thru 4-2013 Percent Change
New Listings 36 32 - 11.1% 379 332 - 12.4%
Pending Sales 23 33 + 43.5% 242 283 + 16.9%
Local Market Update for April 2013A Research Tool Provided by the Pacific West Association of REALTORS®
Newport BeachOrange County
April Last 12 Months
April Last 12 MonthsSingle Family
Townhouse-Condo
Pending Sales 23 33 + 43.5% 242 283 + 16.9%
Closed Sales 17 32 + 88.2% 227 289 + 27.3%
Days on Market Until Sale 120 67 - 44.2% 137 95 - 30.7%
Median Sales Price* $450,000 $707,500 + 57.2% $535,000 $600,000 + 12.1%
Average Sales Price* $537,588 $781,296 + 45.3% $602,155 $685,914 + 13.9%
Percent of Original List Price Received* 94.1% 98.7% + 4.9% 90.4% 95.4% + 5.5%
Inventory of Homes for Sale 124 43 - 65.3% -- -- --
Months Supply of Inventory 6.1 1.8 - 70.5% -- -- --
* Does not account for seller concessions and/or down payment assistance. Note: Activity for one month can sometimes look extreme due to small sample size.
Current as of May 6, 2013. All data comes from CRMLS. Powered by 10K Research & Marketing. Percent changes are calculated using rounded figures.
Newport Beach — All PWR Areas — All PWR Areas —
Newport Beach —
$250,000
$500,000
$750,000
$1,000,000
$1,250,000
$1,500,000
$1,750,000
$2,000,000
1-2008 1-2009 1-2010 1-2011 1-2012 1-2013
Median Sales Price – Single FamilyRolling 12-Month Calculation
$200,000
$300,000
$400,000
$500,000
$600,000
$700,000
$800,000
$900,000
1-2008 1-2009 1-2010 1-2011 1-2012 1-2013
Median Sales Price – Townhouse-Condo Rolling 12-Month Calculation
Current as of May 6, 2013. All data comes from CRMLS. Powered by 10K Research & Marketing. Percent changes are calculated using rounded figures.
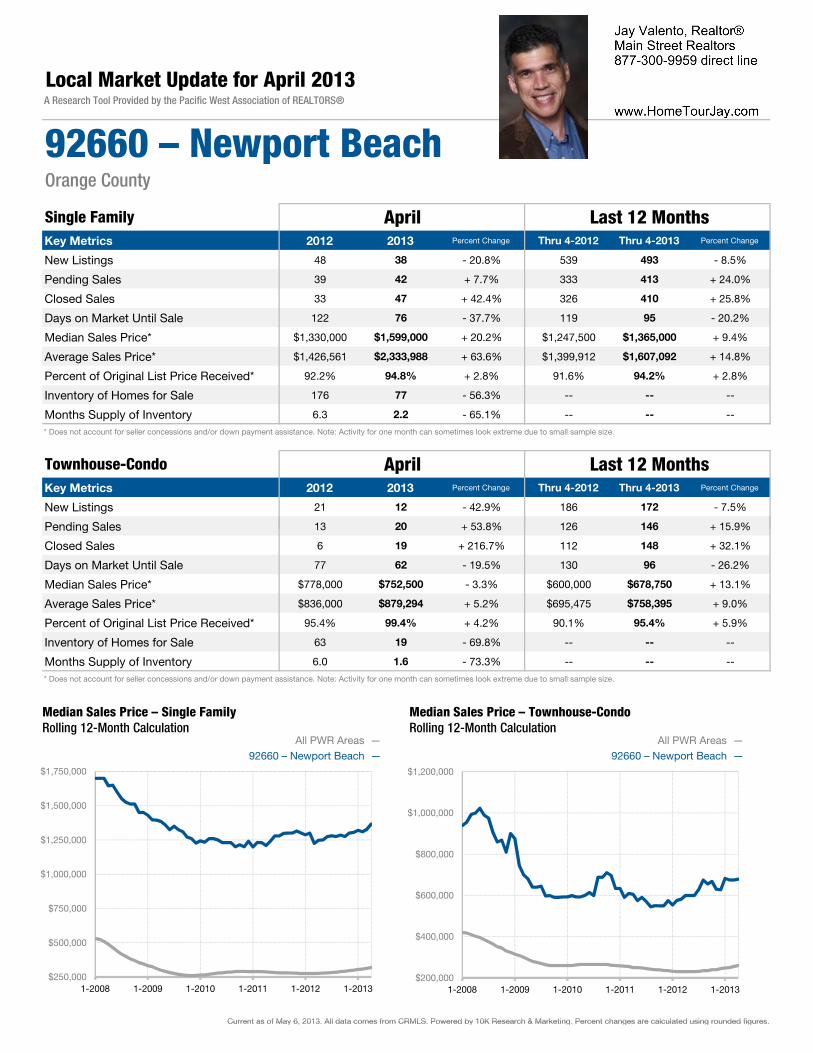
Key Metrics 2012 2013 Percent Change Thru 4-2012 Thru 4-2013 Percent Change
New Listings 48 38 - 20.8% 539 493 - 8.5%
Pending Sales 39 42 + 7.7% 333 413 + 24.0%
Closed Sales 33 47 + 42.4% 326 410 + 25.8%
Days on Market Until Sale 122 76 - 37.7% 119 95 - 20.2%
Median Sales Price* $1,330,000 $1,599,000 + 20.2% $1,247,500 $1,365,000 + 9.4%
Average Sales Price* $1,426,561 $2,333,988 + 63.6% $1,399,912 $1,607,092 + 14.8%
Percent of Original List Price Received* 92.2% 94.8% + 2.8% 91.6% 94.2% + 2.8%
Inventory of Homes for Sale 176 77 - 56.3% -- -- --
Months Supply of Inventory 6.3 2.2 - 65.1% -- -- --
* Does not account for seller concessions and/or down payment assistance. Note: Activity for one month can sometimes look extreme due to small sample size.
Key Metrics 2012 2013 Percent Change Thru 4-2012 Thru 4-2013 Percent Change
New Listings 21 12 - 42.9% 186 172 - 7.5%
Pending Sales 13 20 + 53.8% 126 146 + 15.9%
Local Market Update for April 2013A Research Tool Provided by the Pacific West Association of REALTORS®
92660 – Newport BeachOrange County
April Last 12 Months
April Last 12 MonthsSingle Family
Townhouse-Condo
Pending Sales 13 20 + 53.8% 126 146 + 15.9%
Closed Sales 6 19 + 216.7% 112 148 + 32.1%
Days on Market Until Sale 77 62 - 19.5% 130 96 - 26.2%
Median Sales Price* $778,000 $752,500 - 3.3% $600,000 $678,750 + 13.1%
Average Sales Price* $836,000 $879,294 + 5.2% $695,475 $758,395 + 9.0%
Percent of Original List Price Received* 95.4% 99.4% + 4.2% 90.1% 95.4% + 5.9%
Inventory of Homes for Sale 63 19 - 69.8% -- -- --
Months Supply of Inventory 6.0 1.6 - 73.3% -- -- --
* Does not account for seller concessions and/or down payment assistance. Note: Activity for one month can sometimes look extreme due to small sample size.
Current as of May 6, 2013. All data comes from CRMLS. Powered by 10K Research & Marketing. Percent changes are calculated using rounded figures.
92660 – Newport Beach — All PWR Areas — All PWR Areas —
92660 – Newport Beach —
$250,000
$500,000
$750,000
$1,000,000
$1,250,000
$1,500,000
$1,750,000
1-2008 1-2009 1-2010 1-2011 1-2012 1-2013
Median Sales Price – Single FamilyRolling 12-Month Calculation
$200,000
$400,000
$600,000
$800,000
$1,000,000
$1,200,000
1-2008 1-2009 1-2010 1-2011 1-2012 1-2013
Median Sales Price – Townhouse-Condo Rolling 12-Month Calculation
Current as of May 6, 2013. All data comes from CRMLS. Powered by 10K Research & Marketing. Percent changes are calculated using rounded figures.
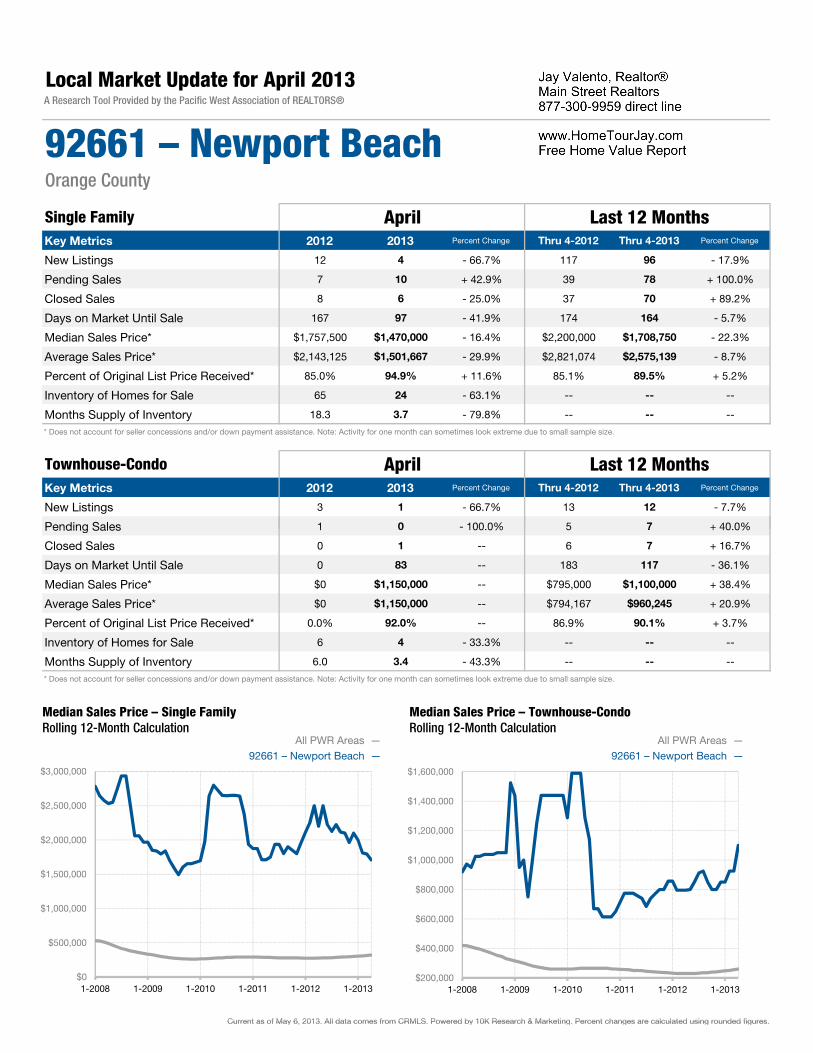
Key Metrics 2012 2013 Percent Change Thru 4-2012 Thru 4-2013 Percent Change
New Listings 12 4 - 66.7% 117 96 - 17.9%
Pending Sales 7 10 + 42.9% 39 78 + 100.0%
Closed Sales 8 6 - 25.0% 37 70 + 89.2%
Days on Market Until Sale 167 97 - 41.9% 174 164 - 5.7%
Median Sales Price* $1,757,500 $1,470,000 - 16.4% $2,200,000 $1,708,750 - 22.3%
Average Sales Price* $2,143,125 $1,501,667 - 29.9% $2,821,074 $2,575,139 - 8.7%
Percent of Original List Price Received* 85.0% 94.9% + 11.6% 85.1% 89.5% + 5.2%
Inventory of Homes for Sale 65 24 - 63.1% -- -- --
Months Supply of Inventory 18.3 3.7 - 79.8% -- -- --
* Does not account for seller concessions and/or down payment assistance. Note: Activity for one month can sometimes look extreme due to small sample size.
Key Metrics 2012 2013 Percent Change Thru 4-2012 Thru 4-2013 Percent Change
New Listings 3 1 - 66.7% 13 12 - 7.7%
Pending Sales 1 0 - 100.0% 5 7 + 40.0%
Local Market Update for April 2013A Research Tool Provided by the Pacific West Association of REALTORS®
92661 – Newport BeachOrange County
April Last 12 Months
April Last 12 MonthsSingle Family
Townhouse-Condo
Pending Sales 1 0 100.0% 5 7 + 40.0%
Closed Sales 0 1 -- 6 7 + 16.7%
Days on Market Until Sale 0 83 -- 183 117 - 36.1%
Median Sales Price* $0 $1,150,000 -- $795,000 $1,100,000 + 38.4%
Average Sales Price* $0 $1,150,000 -- $794,167 $960,245 + 20.9%
Percent of Original List Price Received* 0.0% 92.0% -- 86.9% 90.1% + 3.7%
Inventory of Homes for Sale 6 4 - 33.3% -- -- --
Months Supply of Inventory 6.0 3.4 - 43.3% -- -- --
* Does not account for seller concessions and/or down payment assistance. Note: Activity for one month can sometimes look extreme due to small sample size.
Current as of May 6, 2013. All data comes from CRMLS. Powered by 10K Research & Marketing. Percent changes are calculated using rounded figures.
92661 – Newport Beach — All PWR Areas — All PWR Areas —
92661 – Newport Beach —
$0
$500,000
$1,000,000
$1,500,000
$2,000,000
$2,500,000
$3,000,000
1-2008 1-2009 1-2010 1-2011 1-2012 1-2013
Median Sales Price – Single FamilyRolling 12-Month Calculation
$200,000
$400,000
$600,000
$800,000
$1,000,000
$1,200,000
$1,400,000
$1,600,000
1-2008 1-2009 1-2010 1-2011 1-2012 1-2013
Median Sales Price – Townhouse-Condo Rolling 12-Month Calculation
Current as of May 6, 2013. All data comes from CRMLS. Powered by 10K Research & Marketing. Percent changes are calculated using rounded figures.
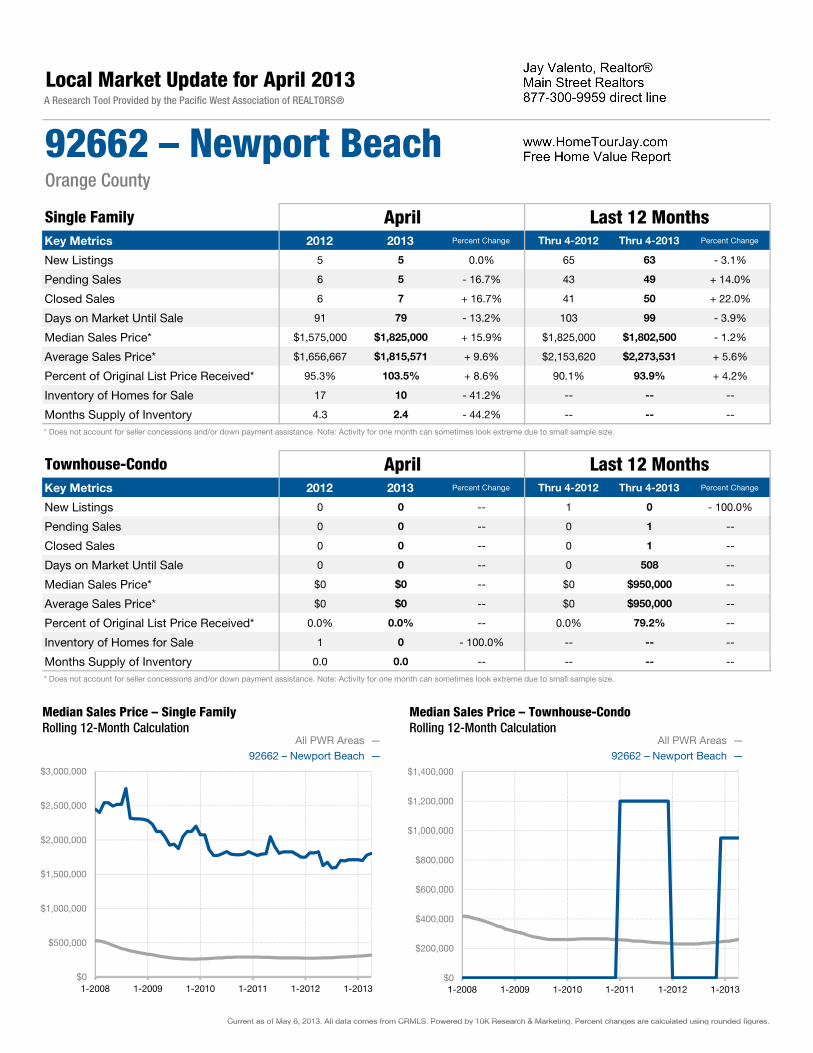
Key Metrics 2012 2013 Percent Change Thru 4-2012 Thru 4-2013 Percent Change
New Listings 5 5 0.0% 65 63 - 3.1%
Pending Sales 6 5 - 16.7% 43 49 + 14.0%
Closed Sales 6 7 + 16.7% 41 50 + 22.0%
Days on Market Until Sale 91 79 - 13.2% 103 99 - 3.9%
Median Sales Price* $1,575,000 $1,825,000 + 15.9% $1,825,000 $1,802,500 - 1.2%
Average Sales Price* $1,656,667 $1,815,571 + 9.6% $2,153,620 $2,273,531 + 5.6%
Percent of Original List Price Received* 95.3% 103.5% + 8.6% 90.1% 93.9% + 4.2%
Inventory of Homes for Sale 17 10 - 41.2% -- -- --
Months Supply of Inventory 4.3 2.4 - 44.2% -- -- --
* Does not account for seller concessions and/or down payment assistance. Note: Activity for one month can sometimes look extreme due to small sample size.
Key Metrics 2012 2013 Percent Change Thru 4-2012 Thru 4-2013 Percent Change
New Listings 0 0 -- 1 0 - 100.0%
Pending Sales 0 0 -- 0 1 --
Local Market Update for April 2013A Research Tool Provided by the Pacific West Association of REALTORS®
92662 – Newport BeachOrange County
April Last 12 Months
April Last 12 MonthsSingle Family
Townhouse-Condo
Pending Sales 0 0 0 1
Closed Sales 0 0 -- 0 1 --
Days on Market Until Sale 0 0 -- 0 508 --
Median Sales Price* $0 $0 -- $0 $950,000 --
Average Sales Price* $0 $0 -- $0 $950,000 --
Percent of Original List Price Received* 0.0% 0.0% -- 0.0% 79.2% --
Inventory of Homes for Sale 1 0 - 100.0% -- -- --
Months Supply of Inventory 0.0 0.0 -- -- -- --
* Does not account for seller concessions and/or down payment assistance. Note: Activity for one month can sometimes look extreme due to small sample size.
Current as of May 6, 2013. All data comes from CRMLS. Powered by 10K Research & Marketing. Percent changes are calculated using rounded figures.
92662 – Newport Beach — All PWR Areas — All PWR Areas —
92662 – Newport Beach —
$0
$500,000
$1,000,000
$1,500,000
$2,000,000
$2,500,000
$3,000,000
1-2008 1-2009 1-2010 1-2011 1-2012 1-2013
Median Sales Price – Single FamilyRolling 12-Month Calculation
$0
$200,000
$400,000
$600,000
$800,000
$1,000,000
$1,200,000
$1,400,000
1-2008 1-2009 1-2010 1-2011 1-2012 1-2013
Median Sales Price – Townhouse-Condo Rolling 12-Month Calculation
Current as of May 6, 2013. All data comes from CRMLS. Powered by 10K Research & Marketing. Percent changes are calculated using rounded figures.
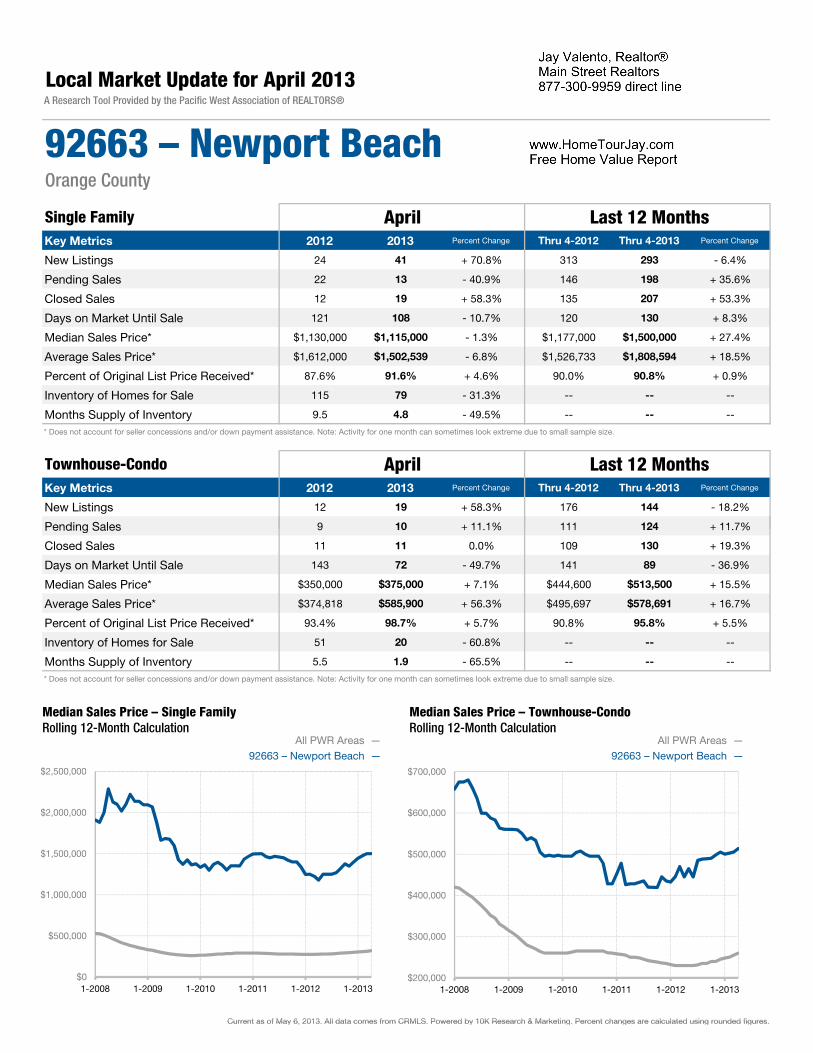
Key Metrics 2012 2013 Percent Change Thru 4-2012 Thru 4-2013 Percent Change
New Listings 24 41 + 70.8% 313 293 - 6.4%
Pending Sales 22 13 - 40.9% 146 198 + 35.6%
Closed Sales 12 19 + 58.3% 135 207 + 53.3%
Days on Market Until Sale 121 108 - 10.7% 120 130 + 8.3%
Median Sales Price* $1,130,000 $1,115,000 - 1.3% $1,177,000 $1,500,000 + 27.4%
Average Sales Price* $1,612,000 $1,502,539 - 6.8% $1,526,733 $1,808,594 + 18.5%
Percent of Original List Price Received* 87.6% 91.6% + 4.6% 90.0% 90.8% + 0.9%
Inventory of Homes for Sale 115 79 - 31.3% -- -- --
Months Supply of Inventory 9.5 4.8 - 49.5% -- -- --
* Does not account for seller concessions and/or down payment assistance. Note: Activity for one month can sometimes look extreme due to small sample size.
Key Metrics 2012 2013 Percent Change Thru 4-2012 Thru 4-2013 Percent Change
New Listings 12 19 + 58.3% 176 144 - 18.2%
Pending Sales 9 10 + 11.1% 111 124 + 11.7%
Local Market Update for April 2013A Research Tool Provided by the Pacific West Association of REALTORS®
92663 – Newport BeachOrange County
April Last 12 Months
April Last 12 MonthsSingle Family
Townhouse-Condo
Pending Sales 9 10 + 11.1% 111 124 + 11.7%
Closed Sales 11 11 0.0% 109 130 + 19.3%
Days on Market Until Sale 143 72 - 49.7% 141 89 - 36.9%
Median Sales Price* $350,000 $375,000 + 7.1% $444,600 $513,500 + 15.5%
Average Sales Price* $374,818 $585,900 + 56.3% $495,697 $578,691 + 16.7%
Percent of Original List Price Received* 93.4% 98.7% + 5.7% 90.8% 95.8% + 5.5%
Inventory of Homes for Sale 51 20 - 60.8% -- -- --
Months Supply of Inventory 5.5 1.9 - 65.5% -- -- --
* Does not account for seller concessions and/or down payment assistance. Note: Activity for one month can sometimes look extreme due to small sample size.
Current as of May 6, 2013. All data comes from CRMLS. Powered by 10K Research & Marketing. Percent changes are calculated using rounded figures.
92663 – Newport Beach — All PWR Areas — All PWR Areas —
92663 – Newport Beach —
$0
$500,000
$1,000,000
$1,500,000
$2,000,000
$2,500,000
1-2008 1-2009 1-2010 1-2011 1-2012 1-2013
Median Sales Price – Single FamilyRolling 12-Month Calculation
$200,000
$300,000
$400,000
$500,000
$600,000
$700,000
1-2008 1-2009 1-2010 1-2011 1-2012 1-2013
Median Sales Price – Townhouse-Condo Rolling 12-Month Calculation
Current as of May 6, 2013. All data comes from CRMLS. Powered by 10K Research & Marketing. Percent changes are calculated using rounded figures.