


Languages
Pages
Legal

2011Fiscal Year
Statutory Report
HFA
New York State Housing Finance Agency

New York State Housing Finance Agency
Financial Statements
Fiscal Years Ended October 31, 2011 and 2010
Contents Introductory Section
Fiscal 2011 Highlights…….….…...……………………...…...………………………1 Project Statistics……………...…………………………………………….………….2 Summary of Financing and Repayment…...…………………………….……...……..9 Responsibility for Financial Reporting …...…………………………….……...……10
Financial Section Report of Independent Auditors……...................................………………...…....….11 Management’s Discussion and Analysis……...…………………………………......13 Statements of Net Position….....…………………………………………………......28 Statements of Revenues, Expenses and Changes in Net Position……….……….…29 Statements of Cash Flows………...………………………………………………….30 Notes to Financial Statements……...…………………………………………...……31
Required Supplementary Information Schedule of Funding Progress …………………………………………...….….....…53
Supplementary Section Supplemental Schedule I……………………………………………...…………...…55 Supplemental Schedule II..…………………………………………...…………...…57 Supplemental Schedule III……………….…………………………...…………...…59 Supplemental Schedule IV…………………………………………...…………....…61
.

New York State Housing Finance Agency (“HFA”) Fiscal 2011 Highlights
• HFA issued or released from NIBP escrow, bonds totaling approximately $807.3 million to finance 27 new projects that contain 4,169 housing units, of which 54% are set aside for low‐income households.
• During FYE 2011, HFA drew $22.3 million of the State’s total $54.5 million NSP Round 1 (“NSP1”) grant from HUD, to fund sub‐grantee program activities and eligible program administration expenses. With $5 million more of NSP funds awarded to the State in the third round of NSP (“NSP3”), last March, HFA selected three applicants through a competitive RFP process and will execute NSP Assistance Agreements in the first quarter of FYE 2012. Awardees will redevelop foreclosed or vacant properties in Rochester, Brooklyn, and Suffolk County, Long Island, generating 67 new affordable rental or owner‐occupied units.
• Office of Fair Housing and Equal Opportunity (“OFHEO”) participated on numerous panels, attends conferences, workshops and other industry related events, as well as conducted open forums to provide information and assistance to MWBEs on how to do business with New York State Homes and Community Renewal (“HCR”).
- OFHEO currently provides ongoing technical training to HCRs contracting units on MWBE
compliance. To streamline the process and to become user friendly, OFHEO updated all compliance forms and organized them on the Agencies’ website by program. OFHEO added a message on the Agency’s website to assist MWBEs in identifying opportunities with the Agencies and a link was added to direct MWBEs to Empire State Development Corporation’s website for assistance in becoming a certified MWBE with the State of NY.
- OFHEO, working with Legal affairs, issued an MWBE Outreach to nine firms as potential candidates
for the performance of Co‐Bond Services for Agency financings. The Agencies received seven responses from MBEs and one response from a WBE. All eight firms were deemed qualified and added to the Agencies’ pre‐qualified list of co‐bond counsel. Three firms were assigned to HFA financings.
- OFHEO conducted an open forum for Financial Advisors and HFA and its Affiliated Agencies issued
an MWBE Outreach to ten firms. Three WBE firms were deemed qualified and added to the Agencies’ prequalified list of Financial Advisors.
New York State Homes and Community Renewal
• Under the leadership of Governor Andrew Cuomo, HCR was a central agency working with the Regional Economic Development Councils, a historic approach to job creation and economic development to revitalize New York. As part of an historic announcement in December, the Governor announced that the Regional Councils had awarded over $785 million, including $160 million in HCR funding. Those awards, coordinated for the first time, will support regional growth strategies that take into account each areaʹs unique challenges and opportunities.
• Helped create a new Consolidated Funding Application (“CFA”) that streamlined the new process, allowing the Regional Councils to identify and expedite priority projects.
• Established a single identity for all the New York State housing agencies including creating unified points of access to all the programs of all the housing agencies.
• Worked to coordinate the use of all the resources of all the New York State housing agencies to advance a uniform set of policies, priorities and goals to best create and preserve affordable housing opportunities as well as encourage community development throughout New York State.
1
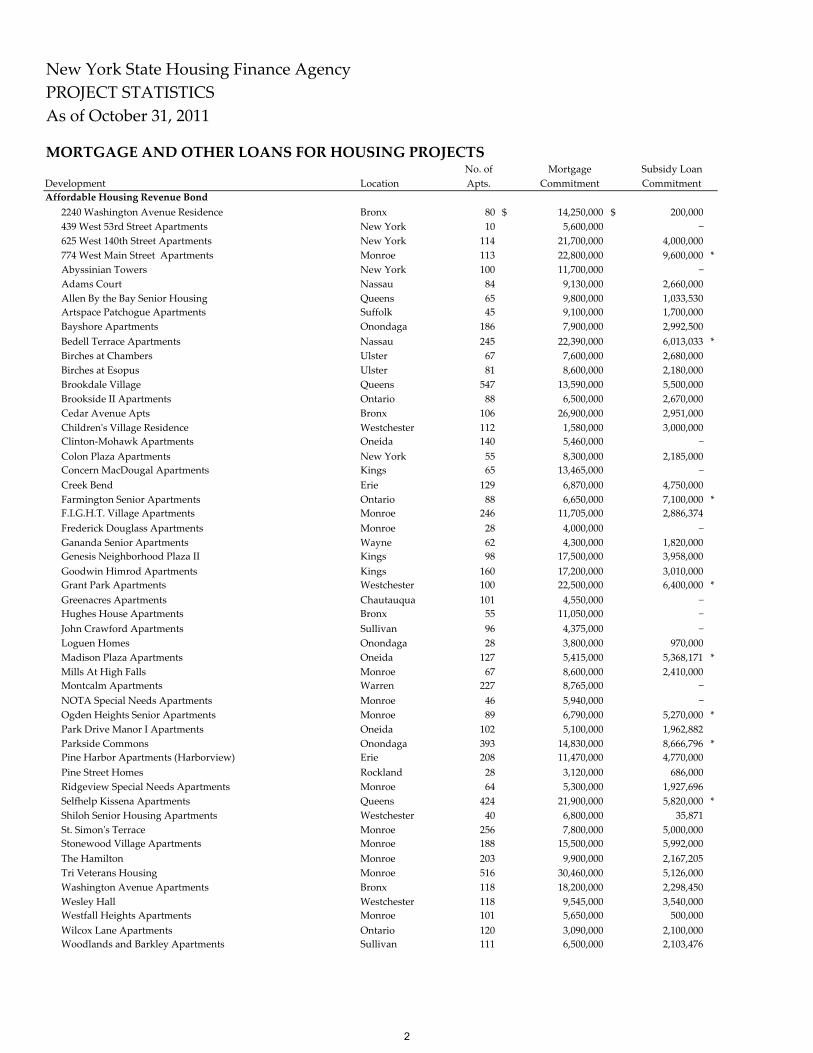
New York State Housing Finance AgencyPROJECT STATISTICSAs of October 31, 2011
MORTGAGE AND OTHER LOANS FOR HOUSING PROJECTS No. of Mortgage Subsidy Loan
Development Location Apts. Commitment CommitmentAffordable Housing Revenue Bond
2240 Washington Avenue Residence Bronx 80 $ 14,250,000 $ 200,000439 West 53rd Street Apartments New York 10 5,600,000 −625 West 140th Street Apartments New York 114 21,700,000 4,000,000774 West Main Street Apartments Monroe 113 22,800,000 9,600,000 *Abyssinian Towers New York 100 11,700,000 −Adams Court Nassau 84 9,130,000 2,660,000Allen By the Bay Senior Housing Queens 65 9,800,000 1,033,530Artspace Patchogue Apartments Suffolk 45 9,100,000 1,700,000 Bayshore Apartments Onondaga 186 7,900,000 2,992,500 Bedell Terrace Apartments Nassau 245 22,390,000 6,013,033 *Birches at Chambers Ulster 67 7,600,000 2,680,000Birches at Esopus Ulster 81 8,600,000 2,180,000Brookdale Village Queens 547 13,590,000 5,500,000Brookside II Apartments Ontario 88 6,500,000 2,670,000Cedar Avenue Apts Bronx 106 26,900,000 2,951,000Childrenʹs Village Residence Westchester 112 1,580,000 3,000,000Clinton‐Mohawk Apartments Oneida 140 5,460,000 −Colon Plaza Apartments New York 55 8,300,000 2,185,000Concern MacDougal Apartments Kings 65 13,465,000 −Creek Bend Erie 129 6,870,000 4,750,000Farmington Senior Apartments Ontario 88 6,650,000 7,100,000 *F.I.G.H.T. Village Apartments Monroe 246 11,705,000 2,886,374 Frederick Douglass Apartments Monroe 28 4,000,000 −Gananda Senior Apartments Wayne 62 4,300,000 1,820,000p yGenesis Neighborhood Plaza II Kings 98 17,500,000 3,958,000 Goodwin Himrod Apartments Kings 160 17,200,000 3,010,000Grant Park Apartments Westchester 100 22,500,000 6,400,000 *Greenacres Apartments Chautauqua 101 4,550,000 −Hughes House Apartments Bronx 55 11,050,000 −John Crawford Apartments Sullivan 96 4,375,000 −Loguen Homes Onondaga 28 3,800,000 970,000Madison Plaza Apartments Oneida 127 5,415,000 5,368,171 *Mills At High Falls Monroe 67 8,600,000 2,410,000Montcalm Apartments Warren 227 8,765,000 −NOTA Special Needs Apartments Monroe 46 5,940,000 −Ogden Heights Senior Apartments Monroe 89 6,790,000 5,270,000 *Park Drive Manor I Apartments Oneida 102 5,100,000 1,962,882Parkside Commons Onondaga 393 14,830,000 8,666,796 *Pine Harbor Apartments (Harborview) Erie 208 11,470,000 4,770,000 Pine Street Homes Rockland 28 3,120,000 686,000Ridgeview Special Needs Apartments Monroe 64 5,300,000 1,927,696Selfhelp Kissena Apartments Queens 424 21,900,000 5,820,000 *Shiloh Senior Housing Apartments Westchester 40 6,800,000 35,871St. Simonʹs Terrace Monroe 256 7,800,000 5,000,000Stonewood Village Apartments Monroe 188 15,500,000 5,992,000 The Hamilton Monroe 203 9,900,000 2,167,205Tri Veterans Housing Monroe 516 30,460,000 5,126,000Washington Avenue Apartments Bronx 118 18,200,000 2,298,450Wesley Hall Westchester 118 9,545,000 3,540,000Westfall Heights Apartments Monroe 101 5,650,000 500,000 Wilcox Lane Apartments Ontario 120 3,090,000 2,100,000Woodlands and Barkley Apartments Sullivan 111 6,500,000 2,103,476
2

No. of Mortgage Subsidy LoanDevelopment Location Apts. Commitment Commitment
Woodstock Manor Apartments Westchester 60 $ 6,550,000 $ 550,000 Total 7,100 $ 558,090,000 $ 146,553,984
Affordable Housing Revenue Bond ‐ NIBP25 State Street Apartments Westchester 50 $ 8,760,000 $ 2,500,000 Burt Farms II Apartments Orange 50 3,350,000 −CAMBA Gardens Apartments Kings 209 34,060,000 −Erie Harbor Apartments Monroe 131 18,390,000 2,560,587Geneseo Highlands Apartments Livingston 89 4,950,000 −Grote Street Apartments Bronx 249 22,270,000 750,000Heritage Homes Apartments Westchester 130 18,390,000 2,800,000Kennedy Plaza Tower Apartments Oneida 204 10,780,000 −Liberty Green III Apartments Orange 83 7,870,000 3,462,280Machackemach Village Apartments Orange 50 2,310,000 −North Country Rural Preservation Apartments St. Lawrence,
Franklin and Jefferson 254 14,390,000 −Pine Town Apartments Nassau 130 19,650,000 −Roundtop Commons Apartments Westchester 92 15,500,000 4,000,000Spring Valley Apartments Rockland 55 8,400,000 1,335,000Twin Oaks Apartments Nassau 94 15,610,000 3,400,000Twin Parks Apartments Bronx 274 25,550,000 −Warburton Riverview Apartments Westchester 92 16,200,000 2,500,000
2,236 $ 246,430,000 $ 23,307,867
Multi‐Family Housing Revenue(Secured Mortgage Program)
244 North Main Street Spring Valley 95 $ 4,400,000 $ −Abraham Lincoln Apartments Irondequoit 69 2,300,000 −Airmont Gardens Apartments Airmont 140 12,000,000 1,201,183Bedford Lake Bedford 64 4,400,000 −B k l S A t t W i F ll 150 9 500 000
* The subsidy loan commitment for these loans was funded through a onetime federal program ‐ the Tax Credit Assistance Program (ʺTCAPʺ) ‐authorized by the American Recovery and Reinvestment Act of 2009, through which funds were made available to assist affordable housing developments.
Berkeley Square Apartments Wappingers Falls 150 9,500,000 −Bloomfield Meadows Apartments Bloomfield 24 1,080,000 400,000Bristow‐Stebbins Apartments Bronx 80 7,480,000 994,236Brookview Gardens Deer Park 208 14,400,000 1,638,560Chevy Place at 200 East Avenue Apartment Project Rochester 77 5,395,000 400,000Community Re‐Entry Project Middletown 26 1,000,000 189,500Dominican Village Apartments Amityville 116 7,500,000 −Dominican Village Apartments, Phase II Amityville 150 17,933,000 500,000Eagle View Court Middle Island 150 6,955,000 −Evergreen Hills Apartment Macedon 72 1,700,000 −Grant Street Senior Rental Housing Rye Brook 26 2,100,000 −Hopkins Court Apartments Amherst 105 2,740,000 −Island View Apartments I Selden 64 4,400,000 −Island View Apartments II Selden 160 6,285,000 −Meadow Ridge Apartments Beacon 54 4,600,000 769,796Patchogue Senior Apartments I East Patchogue 87 6,415,000 700,000Seneca Gardens Apartments Syracuse 60 1,320,000 165,000 Senior Horizons at Silver Lake Wallkill 85 4,500,000 830,000 Stuyvesant Hotel Conversion Project Kingston 40 1,245,000 −Sycamore Crest Apartments Spring Valley 96 7,000,000 2,200,000 Webster Place Apartments Bronx 69 6,500,000 1,538,575 Woodland Place Apartments Lancaster 86 3,500,000 800,000
Total 2,353 $ 146,648,000 $ 12,326,850
Secured Loan Program8 East 102nd Street Apartments Manhattan 232 $ 143,700,000 $ −10 Barclay Street Housing Manhattan 396 135,000,000 −10 Liberty Street Housing Manhattan 287 95,000,000 −100 Maiden Lane Housing Manhattan 336 98,000,000 −101 West End Avenue Housing Manhattan 507 126,000,000 −
* The subsidy loan commitment for these loans was funded through a onetime federal program ‐ the Tax Credit Assistance Program (ʺTCAPʺ) ‐authorized by the American Recovery and Reinvestment Act of 2009, through which funds were made available to assist affordable housing developments.
3

No. of Mortgage Subsidy LoanDevelopment Location Apts. Commitment Commitment
125 West 31st Street Housing Manhattan 459 $ 176,800,000 $ −150 East 44th Street Housing Manhattan 361 110,000,000 −1500 Lexington Avenue Housing Manhattan 211 50,000,000 −1501 Lexington Avenue Housing Manhattan 160 35,600,000 −188 Ludlow Street Housing Manhattan 243 83,000,000 −2180 Broadway Housing Manhattan 181 123,620,000 −20 River Terrace Housing Manhattan 293 116,500,000 −240 East 39th Street Housing Manhattan 466 119,000,000 −25 Washington Street Housing Brooklyn 106 19,700,000 −250 West 50th Street Housing Manhattan 550 118,900,000 −250 West 93rd Street Housing Manhattan 143 66,800,000 −29 Flatbush Avenue Housing Brooklyn 327 90,000,000 −316 Eleventh Avenue Housing Manhattan 369 224,100,000 −320 West 38th Street Manhattan 569 396,000,000 −330 Riverdale Avenue Apartments Yonkers 153 28,700,000 5,700,000330 West 39th Street Housing Manhattan 199 65,000,000 −345 East 94th Street Housing Manhattan 208 49,300,000 −350 West 43rd Street Housing Manhattan 321 113,000,000 −360 West 43rd Street Housing Manhattan 256 82,000,000 −363 West 30th Street Housing Manhattan 77 17,700,000 −455 West 37th Street Housing Manhattan 394 168,000,000 −505 West 37th Street Housing Manhattan 835 4,540,000 −55 West 25th Street Housing Manhattan 407 173,300,000 −600 West 42nd Street Housing Manhattan 1,169 609,000,000 −66 West 38th Street Housing Manhattan 374 119,700,000 −70 Battery Place Housing Manhattan 209 37,000,000 −750 Sixth Avenue Housing Manhattan 301 76,600,000 −80 Dekalb Avenue Brooklyn 365 159,260,000 −88 Leonard Street Housing Manhattan 352 132,000,000 −900 Eighth Avenue Apartments Housing Manhattan 393 135,000,000 −Admiral Halsey Senior Apartments Housing Rental Poughkeepsie 119 6,650,000 3,920,000Archstone Westbury Apartments Housing Westbury 396 78,000,000 −Avalon Bowery Place I Housing Manhanttan 206 93,800,000 −Avalon Bowery Place II Housing Manhanttan 90 48,500,000 −Avalon Chrystie Place I Housing Manhattan 361 117,000,000 −Baisley Park Housing Queens 212 18,800,000 −Bennington Hills Housing Henrietta 192 10,300,000 −Biltmore Tower Housing Manhattan 464 145,000,000 −Brook Avenue Bronx 190 22,300,000 −Cannon Street Senior Apartments Poughkeepsie 40 3,350,000 295,000 Chelsea Apartments Housing Manhattan 269 104,000,000 −Chelsea Arms Housing Manhattan 98 18,000,000 −Clinton Green North Housing Manhattan 339 147,000,000 −Clinton Green South Housing Manhattan 288 121,500,000 −Clinton Park Housing Manhattan 222 70,000,000 −College Arms Apartments Mount Pleasant 164 11,390,000 −Crotona Estates Apartments Bronx 56 3,845,000 93,021 Division Street Multi‐Family Housing Hastings‐on‐Hudson 14 2,600,000 350,000 East 84th Street Housing Manhattan 180 60,000,000 −Extra Place Apartments Manhattan 42 6,225,000 −Framark Place Apartments Victor 50 2,750,000 1,275,000 Friendship House Apartments Cortland 101 2,840,000 −Gateway at New Cassel Housing North Hempstead 57 9,500,000 1,994,850 Gethsemane Apartments Housing Manhattan 79 15,400,000 −Golden Age Apartments Norwich 100 2,800,000 −Gotham West Housing Manhattan 1,237 520,000,000 −Grace Towers Housing Westchester 133 19,900,000 4,056,500 Hegeman Residence Apartments Brooklyn 161 22,800,000 910,209 Highland Avenue Senior Apartments Yonkers 88 10,370,000 2,200,000 Historic Front Street Housing Manhattan 96 46,300,000 −Horizons at Fishkill Apartments Fishkill 90 6,975,000 2,250,000
4

No. of Mortgage Subsidy LoanDevelopment Location Apts. Commitment Commitment
Horizons at Wawayanda Housing Orange 107 $ 12,100,000 $ 3,710,000 Keeler Park Apartments Housing Rochester 525 17,900,000 −Kensico Terrace Apartments White Plains 42 7,080,000 945,000 Kew Gardens Hills Housing Queens 388 87,000,000 −Nathan Hale Senior Village Housing Lynbrook 126 5,745,000 −Normandie Court I Manhattan 1,094 99,567,349 −North End Avenue Housing Manhattan 253 102,200,000 −North Street Y Senior Apartments Buffalo 64 3,900,000 1,415,000 Park Drive Manor II Apartments Rome 168 6,640,000 −Parkledge Apartments Housing Yonkers 311 39,000,000 −Phillips Village Project Housing Webster 500 15,305,000 −Prospect Plaza Apartments Housing Brooklyn 151 23,300,000 4,140,000 Related ‐ 42th Street & 10th Avenue Manhattan 590 350,000,000 −Related ‐ Capitol Green Apartments Housing Albany 308 16,500,000 −Related ‐ Caroline Apartments Manhattan 126 16,900,000 −Related ‐ Clarkston Maplewood Gardens Rockland 51 4,085,000 −Related ‐ East 39th Street Housing Manhattan 254 75,500,000 −Related ‐ McCarthy Manor Apartments Housing Syracuse 176 6,800,000 −Related ‐ Ocean Park Apartments Housing Queens 602 39,000,000 −Related ‐ Overlook Apartments Middletown 100 5,400,000 −Related ‐ Taconic West 17th Street Housing Manhattan 288 126,000,000 −Related ‐ Tribeca Green Housing Manhattan 274 110,000,000 −Related ‐ Warren Knolls Apartments Housing Haverstraw 97 6,700,000 −
Related ‐ West 20th Street Housing Manhattan 254 88,000,000 −Related ‐ West 23rd Street Housing Manhattan 313 110,000,000 −Related ‐ West Haverstraw Senior Citizen Apartments Housing West Haverstraw 100 6,700,000 −Related ‐ Weyant Green Apartments Housing Highfalls 51 3,800,000 785,000Remeeder Houses Brooklyn 260 18,900,000 −Reverend Polite Avenue Apartments Housing Bronx 161 16,000,000 −Rip Van Winkle House Housing Poughkeepsie 179 11,500,000 −Saville Housing Manhattan 229 55,000,000 −Sea Park East Housing Brooklyn 332 18,700,000 −Sea Park West Housing Brooklyn 362 22,900,000 −Shore Hill Brooklyn 559 39,000,000 −South Cove Plaza Housing Manhattan 208 34,900,000 −St. Philips Housing Manhattan 260 16,250,000 740,000Tall Oaks Apartments Middletown 150 5,930,000 −Talleyrand Crescent Housing Tarrytown 300 36,500,000 −
The Helena Housing Manhattan 597 143,000,000 −The Northfield Apartments Housing Perinton 69 4,990,000 2,120,000 The Victory Housing Manhattan 417 120,000,000 −Theatre Row Tower Housing Manhattan 264 74,800,000 −Tiffany Gardens Apartments Bronx 105 9,880,000 800,000Tower 31 Housing Manhattan 283 93,800,000 −Tribeca Landing Housing Manhattan 340 64,400,000 −Tribeca Park Housing Manhattan 396 84,000,000 −Tri‐Senior Housing Brooklyn 203 15,200,000 −Union Square South Housing Manhattan 240 49,000,000 −Walnut Hill Apartments Haverstraw 180 10,030,000 −Washington Apartments Housing Buffalo 82 4,165,000 2,325,000 Watergate II Apartments Housing Buffalo 195 7,800,000 −West 33rd Street Housing Manhattan 168 50,700,000 −West 37th Street Housing Manhattan 207 106,500,000 −West Village Apartments Tompkins 235 9,700,000 4,900,000Worth Street Housing Manhattan 330 113,900,000 −
Total 32,967 $ 8,668,282,349 $ 44,924,580
Non‐Profit Housing ProgramBernardine Apartments Syracuse 216 $ 5,250,000 $ −Brighton Towers Apartments Syracuse 607 12,390,000 −Brothers of Mercy Apartments Clarence 100 2,600,000 −
5

No. of Mortgage Subsidy LoanDevelopment Location Apts. Commitment Commitment
Cambray Gouverneur 101 $ 2,340,000 $ −DeChantal Apartments Saranac Lake 131 3,185,000 −Denton Green N. Hempstead 113 2,300,000 −Eckelberger Tower Johnson City 65 1,780,000 −Embury Apartments Saratoga Springs 209 6,030,000 −George Washington Goler House Rochester 312 7,905,000 −McGraw House Ithaca 106 2,720,000 −Schwartz Towers Auburn 141 3,925,000 −Springbrook Apartments Pulaski 120 3,300,000 −St. Philipʹs Church Housing Manhattan 200 6,200,000 100,000St. Simeon Apartments Poughkeepsie 100 2,585,000 −The Meadows at Middle Settlement New Hartford 149 3,300,000 −Trinity Towers Buffalo 88 2,125,000 1,412,000
Total 2,758 $ 67,935,000 $ 1,512,000
Housing Project BondsMeadow Manor Queens 132 $ 4,210,000 $ −Simeon DeWitt Apartments Oswego 130 4,180,000 −Towpath Towers Fulton 121 3,490,000 −
Total 383 $ 11,880,000 $ −
Housing Project Mortgage RevenueBaptist Manor Buffalo 128 $ 3,785,000 $ 1,079,700 Clinton Plaza Syracuse 305 8,495,000 −Fort Schuyler House Bronx 143 4,005,000 1,655,000Maple Center New Rochelle 109 3,320,000 −Mayfield Apartments Potsdam 153 3,705,000 925,000Promenade Apartments Manhattan 318 11,435,000 365,000Regina Pacis Brooklyn 167 5,615,000 −South‐East Towers Middletown 107 3,740,000 −Stuypark House Brooklyn 103 3,605,000 875,000
Total 1,533 $ 47,705,000 $ 4,899,700
Multi‐Family FHA‐Insured HousingDiamond Rock Troy 81 $ 2,397,500 $ −
FHA‐Insured Multi‐Family HousingCedarwood Towers Rochester 206 $ 8,010,000 $ −Fairway Manor Apartments Islip 174 8,700,000 −Jonas Bronck Apartments Bronx 215 4,470,000 −Senior Horizons at Newburgh Newburgh 70 3,290,000 400,000Terrace Pines Apartments Ballston 192 4,800,000 −The Mill at Saugerties Saugerties 90 1,000,000 595,433
Total 947 $ 30,270,000 $ 995,433
Secured Loan Rental Normandie Court II Manhattan 383 $ 56,100,000 $ −
Multi‐Family Housing Revenue (Fannie Mae‐Backed)Jefferson Woods Apartments Yorktown 90 $ 3,169,097 $ −
Transitional Housing Project RevenueChildrenʹs Rescue Fund Bronx 65 $ 10,660,000 $ −Newburgh Interfaith Newburgh 16 2,450,000 −
Total 81 $ 13,110,000 $ −
Taxable Mortgage InitiativeBronx Care Bronx 52 $ − $ 1,050,000 Forrest Pointe Apartments East Greenbush 104 6,950,000 2,600,000 Old Brookside I Apartments Ontario 64 1,347,748 1,392,000
6
No. of Mortgage Subsidy LoanDevelopment Location Apts. Commitment Commitment
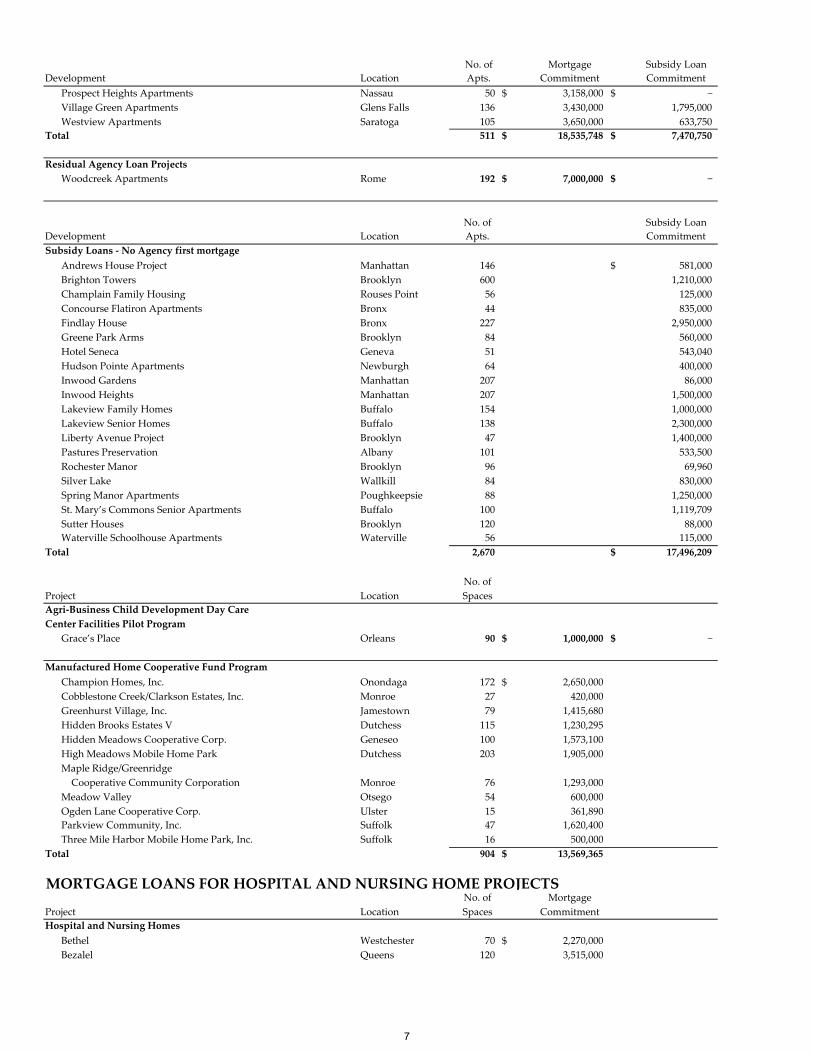
Prospect Heights Apartments Nassau 50 $ 3,158,000 $ −Village Green Apartments Glens Falls 136 3,430,000 1,795,000 Westview Apartments Saratoga 105 3,650,000 633,750
Total 511 $ 18,535,748 $ 7,470,750
Residual Agency Loan ProjectsWoodcreek Apartments Rome 192 $ 7,000,000 $ −
No. of Subsidy LoanDevelopment Location Apts. CommitmentSubsidy Loans ‐ No Agency first mortgage
Andrews House Project Manhattan 146 $ 581,000 Brighton Towers Brooklyn 600 1,210,000 Champlain Family Housing Rouses Point 56 125,000 Concourse Flatiron Apartments Bronx 44 835,000 Findlay House Bronx 227 2,950,000 Greene Park Arms Brooklyn 84 560,000 Hotel Seneca Geneva 51 543,040 Hudson Pointe Apartments Newburgh 64 400,000 Inwood Gardens Manhattan 207 86,000 Inwood Heights Manhattan 207 1,500,000 Lakeview Family Homes Buffalo 154 1,000,000 Lakeview Senior Homes Buffalo 138 2,300,000 Liberty Avenue Project Brooklyn 47 1,400,000 Pastures Preservation Albany 101 533,500 Rochester Manor Brooklyn 96 69,960 Silver Lake Wallkill 84 830,000 Spring Manor Apartments Poughkeepsie 88 1,250,000 St. Mary’s Commons Senior Apartments Buffalo 100 1,119,709 Sutter Houses Brooklyn 120 88,000 Waterville Schoolhouse Apartments Waterville 56 115,000
Total 2,670 $ 17,496,209
No. ofProject Location SpacesAgri‐Business Child Development Day CareCenter Facilities Pilot Program
Grace’s Place Orleans 90 $ 1,000,000 $ −
Manufactured Home Cooperative Fund ProgramChampion Homes, Inc. Onondaga 172 $ 2,650,000 Cobblestone Creek/Clarkson Estates, Inc. Monroe 27 420,000 Greenhurst Village, Inc. Jamestown 79 1,415,680 Hidden Brooks Estates V Dutchess 115 1,230,295 Hidden Meadows Cooperative Corp. Geneseo 100 1,573,100 High Meadows Mobile Home Park Dutchess 203 1,905,000 Maple Ridge/Greenridge Cooperative Community Corporation Monroe 76 1,293,000 Meadow Valley Otsego 54 600,000 Ogden Lane Cooperative Corp. Ulster 15 361,890 Parkview Community, Inc. Suffolk 47 1,620,400 Three Mile Harbor Mobile Home Park, Inc. Suffolk 16 500,000
Total 904 $ 13,569,365
MORTGAGE LOANS FOR HOSPITAL AND NURSING HOME PROJECTS No. of Mortgage
Project Location Spaces CommitmentHospital and Nursing Homes
Bethel Westchester 70 $ 2,270,000 Bezalel Queens 120 3,515,000
7
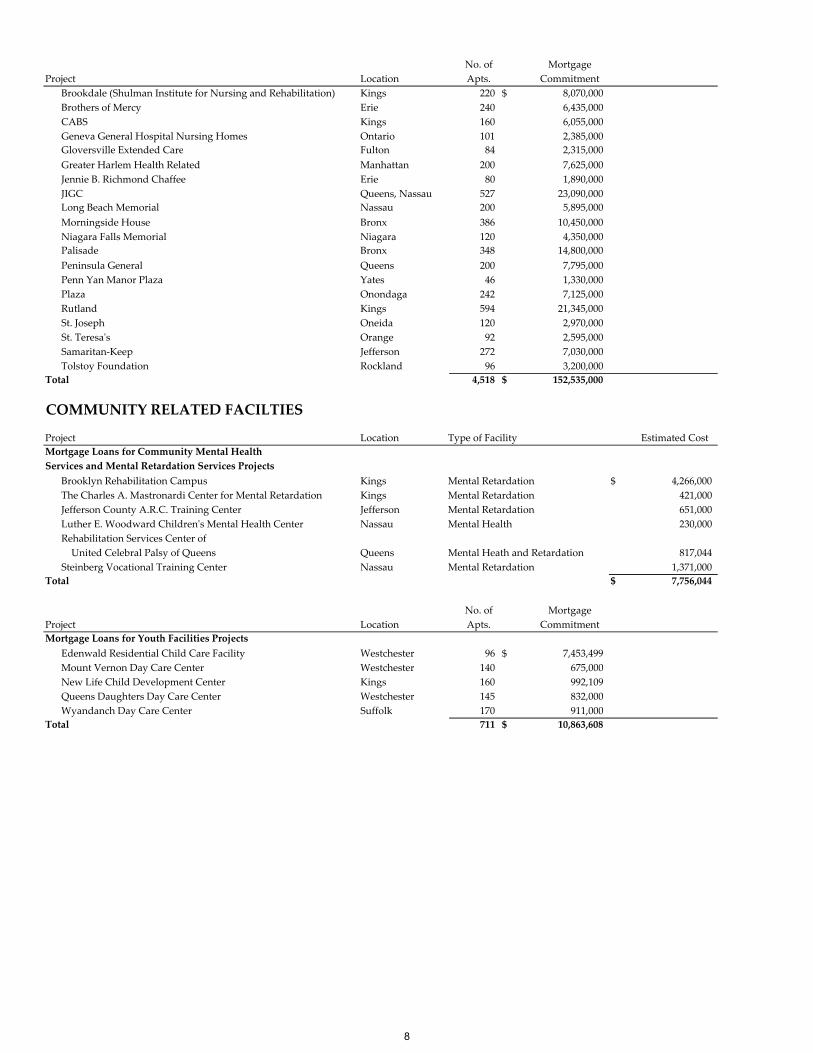
No. of MortgageProject Location Apts. Commitment
Brookdale (Shulman Institute for Nursing and Rehabilitation) Kings 220 $ 8,070,000 Brothers of Mercy Erie 240 6,435,000 CABS Kings 160 6,055,000 Geneva General Hospital Nursing Homes Ontario 101 2,385,000 Gloversville Extended Care Fulton 84 2,315,000 Greater Harlem Health Related Manhattan 200 7,625,000 Jennie B. Richmond Chaffee Erie 80 1,890,000 JIGC Queens, Nassau 527 23,090,000 Long Beach Memorial Nassau 200 5,895,000 Morningside House Bronx 386 10,450,000 Niagara Falls Memorial Niagara 120 4,350,000 Palisade Bronx 348 14,800,000 Peninsula General Queens 200 7,795,000 Penn Yan Manor Plaza Yates 46 1,330,000 Plaza Onondaga 242 7,125,000 Rutland Kings 594 21,345,000 St. Joseph Oneida 120 2,970,000 St. Teresaʹs Orange 92 2,595,000 Samaritan‐Keep Jefferson 272 7,030,000 Tolstoy Foundation Rockland 96 3,200,000
Total 4,518 $ 152,535,000
COMMUNITY RELATED FACILTIES
Project Location Type of Facility Estimated CostMortgage Loans for Community Mental HealthServices and Mental Retardation Services Projects
Brooklyn Rehabilitation Campus Kings Mental Retardation $ 4,266,000 The Charles A. Mastronardi Center for Mental Retardation Kings Mental Retardation 421,000 Jefferson County A.R.C. Training Center Jefferson Mental Retardation 651,000 Luther E. Woodward Childrenʹs Mental Health Center Nassau Mental Health 230,000 Rehabilitation Services Center of United Celebral Palsy of Queens Queens Mental Heath and Retardation 817,044 Steinberg Vocational Training Center Nassau Mental Retardation 1,371,000
Total $ 7,756,044
No. of MortgageProject Location Apts. CommitmentMortgage Loans for Youth Facilities Projects
Edenwald Residential Child Care Facility Westchester 96 $ 7,453,499 Mount Vernon Day Care Center Westchester 140 675,000 New Life Child Development Center Kings 160 992,109 Queens Daughters Day Care Center Westchester 145 832,000 Wyandanch Day Care Center Suffolk 170 911,000
Total 711 $ 10,863,608
8

SUMMARY OF FINANCING AND REPAYMENTLong‐Term Financing and Debt Service Repayments(cumulative through October 31, 2011)
Program Principal Interest($ in thousands)
BondsGeneral Housing Loan 7 $ 385,729 $ 385,729 $ 381,558Non‐Profit Housing Project 7 636,200 619,490 1,123,762Urban Rental Housing 5 514,835 514,835 653,817Revenue Bonds (Section 8 Assisted) Insured Mortgages 3 18,320 18,320 18,057Revenue Bonds (Section 8 Assisted) Non‐Insured Mortgages 6 50,360 50,360 36,266Insured Mortgage Multi‐Family Revenue Housing 4 87,235 87,235 111,496Insured Multi‐Family Mortgage Revenue Housing 2 94,600 94,600 95,359Multi‐Family Insured Mortgage Revenue Housing 6 54,325 54,325 62,737Insured Multi‐Family Mortgage Housing Revenue 5 188,970 188,970 127,944FHA‐Insured Multi‐Family Housing Revenue 10 51,015 26,175 38,867Multi‐Family FHA‐Insured Mortgage Housing Revenue 2 20,035 17,710 13,761Fulton Manor FHA‐Insured Mortgage Revenue 1 11,480 11,480 6,662Housing Project Bonds 16 122,545 116,300 187,497Secured Loan Rental Housing 315 10,411,290 2,220,905 2,300,488Housing Project Mortgage Revenue 1 484,540 471,660 501,539Affordable Housing Revenue 17 562,415 147,100 38,349Affordable Housing Revenue (Federal New Issue Bond Program) 5 384,195 775 1,403Revenue Bonds (Secured by HUD Section 236 Payments) 1 64,996 64,996 50,010Hospital and Nursing Home Project 6 822,965 822,965 943,076Hospital and Health Care Project Revenue 1 42,090 41,920 11,535Nursing Home and Health Care Project Revenue 1 190,080 163,845 69,132State University Construction 43 3 628 295 3 628 295 2 334 445
Debt Service RepaymentsNumber of Issues
TotalAmount Issued
State University Construction 43 3,628,295 3,628,295 2,334,445Special Obligation (State University) 3 179,330 179,330 — Mental Hygiene Improvement 9 705,000 705,000 541,943Health Facilities 4 508,385 508,385 492,095Health Facilities Revenue 3 556,325 556,325 274,436Special Obligation (Health Facilities) 2 228,405 228,405 — Service Contract Obligation Revenue 29 1,752,076 1,725,996 788,479Service Contract Revenue 13 713,090 517,025 149,175Consolidated Service Contract Revenue 1 71,165 — 568State Personal Income Tax Revenue 15 1,161,855 397,245 224,069Total Bonds 543 $ 24,702,146 $ 14,565,701 $ 11,578,525
Long‐Term NotesThe Mount Sinai Hospital Project 1 $ 41,490 $ 41,490 $ 32,195
State FundsCommunity Related and Other Loan Programs 5 $ 31,814 $ 31,814 $ 23,542Equity Loan 1 193 193 7
Total State Funds 6 $ 32,007 $ 32,007 $ 23,549
Grand Total 550 $ 24,775,643 $ 14,639,198 $ 11,634,269
COMPARATIVE HIGHLIGHTS 2007‐2011
Year Ended October 31, 2010 2009 2008 2007
Assets and Bond and Note Indebtedness
Loan Receivables $ 9,270 8,870 8,868 8,306 7,352
Total Assets $ 10,861 10,426 10,417 8,842 8,842
Bond and Note Indebtedness $ 10,156 9,737 9,698 8,029 8,029
(in millions)
2011
Number of Issues
TotalAmount Issued
9

10

11
Report of Independent Auditors
The Members of the Board New York State Housing Finance Agency New York, New York
We have audited the accompanying statements of net position of the New York State Housing Finance Agency (the “Agency”), a component unit of the State of New York, as of October 31, 2011 and 2010, and the related statements of revenues, expenses and changes in net position and cash flows for the years then ended. These financial statements are the responsibility of the Agency’s management. Our responsibility is to express opinions on these financial statements based on our audits.
We conducted our audits in accordance with auditing standards generally accepted in the United States. Those standards require that we plan and perform the audit to obtain reasonable assurance about whether the financial statements are free of material misstatement. We were not engaged to perform an audit of the Agency’s internal control over financial reporting. Our audits included consideration of internal control over financial reporting as a basis for designing audit procedures that are appropriate in the circumstances, but not for the purpose of expressing an opinion on the effectiveness of the Agency’s internal control over financial reporting. Accordingly, we express no such opinion. An audit also includes examining, on a test basis, evidence supporting the amounts and disclosures in the financial statements, assessing the accounting principles used and significant estimates made by management and evaluating the overall financial statement presentation. We believe that our audits provide a reasonable basis for our opinions.
In our opinion, the financial statements referred to above present fairly, in all material respects, the financial position of the Agency as of October 31, 2011 and 2010, and the changes in its financial position and its cash flows for the years then ended in conformity with US generally accepted accounting principles.
As discussed in Note 2, the Agency adopted Government Accounting Standards Board Statement No. 63, Financial Reporting of Deferred Outflows of Resources, Deferred Inflows of Resources, and Net Position as of November 1, 2010.
A member firm of Ernst & Young Global Limited
Ernst & Young LLP 5 Times Square New York, NY 10036-6530 Tel: +1 212 773 3000 Fax: +1 212 773 6350 www.ey.com

12
The Management’s Discussion and Analysis and the schedule of funding progress, as listed in the table of contents, are not a required part of the basic financial statements but are supplementary information required by the Governmental Accounting Standards Board. We have applied certain limited procedures, which consisted principally of inquiries of management regarding the methods of measurement and presentation of the required supplementary information. However, we did not audit the information and express no opinion on it.
Our audit was conducted for the purpose of forming an opinion on the Agency’s basic financial statements. The Supplementary Section, as listed in the table of contents, is presented for purposes of additional analysis and is not a required part of the basic financial statements. Such information has been subjected to the auditing procedures applied in the audit of the basic financial statements and, in our opinion, are fairly stated in all material respects in relation to the basic financial statements taken as a whole. The Introductory Section, as listed in the table of contents, has not been subjected to the auditing procedures applied in the audit of the basic financial statements and, accordingly, we express no opinion on it.
EY January 25, 2012
NEW YORK STATE HOUSING FINANCE AGENCY(A COMPONENT UNIT OF THE STATE OF NEW YORK)
MANAGEMENTʹS DISCUSSION AND ANALYSIS
Overview of the Financial Statements The following is a narrative overview of the financial performance of the New York State Housing Finance Agency(the “Agency”) for the fiscal years ended October 31, 2011 (“fiscal 2011”) and October 31, 2010 (“fiscal 2010”) withselected comparative information for the fiscal year ended October 31, 2009 (“fiscal 2009”). Please read this analysisin conjunction with the financial statements. The annual financial statements consist of five parts: (1) management’s discussion and analysis (this section); (2) thefinancial statements; (3) the notes to the financial statements; (4) required supplementary information and (5) thesupplemental schedules that report programs of the Agency individually. The Agency’s financial statements are prepared using the accrual basis of accounting in conformity with accountingprinciples generally accepted in the United States of America. Management’s Discussion and Analysis • This section of the Agency’s financial statements, Management’s Discussion and Analysis (the “MD&A”),
presents an overview of the Agency’s financial performance during fiscal 2011 and fiscal 2010. It provides adiscussion of financial highlights and an assessment of how the Agency’s financial position has changed fromthe past years. It identifies the factors that, in management’s view, significantly affected the Agency’s overallfinancial position. It may contain opinions, assumptions or conclusions by the Agency’s management thatshould not be considered a replacement for, and must be read in conjunction with, the financial statements andother information described below.
The Financial Statements • The “Statement of Net Position” provides information about the liquidity and solvency of the Agency by
indicating the nature and the amount of resources (assets), the deferred inflows and outflows, the obligations toAgency creditors (liabilities) and the Agency’s net position.
• The “Statement of Revenues, Expenses and Changes in Net Position” accounts for all of the current year’srevenues and expenses in order to measure the success of the Agency’s operations over the past year. It can beused to determine how the Agency has funded its costs. By presenting the financial performance of theAgency, the change in net position is similar to net profit or loss for a business.
• The “Statement of Cash Flows” is presented on the direct method of reporting. It provides information aboutthe Agency’s cash receipts, cash payments, and net changes in cash resulting from operations, investing, andfinancing activities. Cash collections and payments are presented in this statement to arrive at the net increasesor decreases in cash for each year.
The Notes to the Financial Statements • The notes provide information that is essential to understanding the financial statements, such as the Agency’s
accounting methods and policies, providing information about the content of the financial statements. • Details are included of contractual obligations, future commitments and contingencies of the Agency. • Information is given regarding any other events or developing situations that could materially affect the
Agency’s financial position.
13

Required Supplementary Information (“RSI”) • The RSI presents the information regarding the Agency’s progress in funding its obligation to provide
postemployment benefits other than pensions to its employees.
Supplementary Information • Presentations of the Agency’s financial information by program are listed in accordance with the requirements
of the various bond resolutions. Background The Agency was created as a public benefit corporation in 1960, under Article III of the Private Housing Finance Law, to finance low and moderate income housing, primarily through the issuance of municipal securities and the makingof mortgage loans to eligible borrowers. Since its inception, the Agency has issued over $14.8 billion in bonds to finance low and moderate income housing. The Agency administers finance programs which, combined with otherfederal, state, and local resources, benefit the families and communities of New York State (the “State”). During its 51 year history, the Agency’s mandate has been legislatively expanded to allow for the financing ofhousing which meets a variety of needs of the people of New York. As a result, the Agency is authorized to issuebonds to reimburse the State for appropriated expenditures for various housing capital programs. The Agency and its corporate existence shall continue until terminated by law; provided, however that no such lawshall take effect so long as the Agency has bonds, notes or other obligations outstanding. Since 2008, the Agency has used the Affordable Housing Resolution as the primary vehicle for financing affordablehousing developments. It is structured as a “parity resolution” so that all bonds issued under the resolution haveequal access to the pledged revenues, unless otherwise indicated. This resolution provides the Agency with flexibilityto finance smaller projects through issuances that finance pools of mortgage loans, creating efficiencies of scale forboth costs of issuance and market execution purposes. Through the end of fiscal 2011, the Agency has issued 17 series of bonds to finance 53 projects. The bonds are secured only by the assets pledged under the resolution including themortgage loan payments as in the Agency’s conduit financing. In addition, through the end of fiscal 2011, the Agency issued nine series of bonds under specially segregated series of the Affordable Housing Resolution to finance 17affordable housing developments participating in the federal government’s New Issue Bond Program. Prior to fiscal 2008, the Agency was primarily a conduit debt issuer. As a conduit issuer, bonds are issued undervarious bond resolutions adopted by the Agency to permanently finance and provide financing during theconstruction period for qualified individual projects. These bonds, both fixed and variable rate, are specialobligations payable solely from mortgage payments required to be made by the borrower for which the particularbonds were issued. Such mortgage payments are then pledged or assigned to the trustees for the holders of the respective bonds. The Agency has no obligation to pay its bonds other than from such mortgage payments or otheramounts that might otherwise be available under the respective bond resolution. In addition, bonds issued by the Agency are typically secured by other forms of credit enhancement. Such credit enhancement is usually in the formof a letter of credit or credit facility, which is issued by a major bank or government‐sponsored entity. A portion of these bonds are issued to finance multifamily rental developments in which at least 20% of the units are set aside forlow‐income residents. These “80/20” projects are generally located in New York City.
14

Financial Markets The Agency’s operations continued to be impacted in fiscal 2011 by the persistent weakness in the global economyand U.S. real estate market and by the continuing volatility in the capital markets. While lenders and tax credit investors have returned to the market, they seem to have done so cautiously; the Agency continues to seeconservative terms and conditions affecting its transactions. Furthermore, the downgrading of many U.S. and international lenders has affected new and existing transactions. Nevertheless, the strength of the New York City real estate market was evidenced in the increased demand by “80/20” developers. In fiscal 2011 the Agency continued to take advantage of the Federal New Issue Bond Program (“NIBP”), launched during fiscal 2010 to address certain challenges facing state and local housing finance agencies. Through NIBP, the Agency was able to lock its borrowing costs at a rate tied to 10 year U.S. Treasuries through the sale of $276.13 million of bonds that can be released from escrow through the end of the 2012 calendar year. The result was a significant reduction in the Agency’s borrowing costs and consequently, the Agency was able to offer mortgage rates lower thancurrent municipal rates. During fiscal year 2011, the Agency used $92.1 million of its NIBP allocation which was leveraged with $75.93 million of short term bonds sold to the public. The Agency has cultivated a cadre of Community Reinvestment Act (“CRA”) motivated buyers who actively participate in the Agency’s bond sales. This interest has complemented retail investor demand and has helped the Agency continue to achieve positive reception for its bond offerings. The Agency experienced an easing of construction credit enhancement availability for affordable housing developments and “80/20s” during fiscal 2011, although providers have maintained higher pricing and tightenedlending parameters. The Agency continued to benefit from its close affiliation with the SONYMA MortgageInsurance Fund, which provides permanent credit enhancement at competitive pricing for affordable housingdevelopments. Fannie Mae and Freddie Mac have continued to provide enhancement for fixed rate mortgages; otherwise, long term credit enhancement continued to be difficult to obtain for all types of developments with most providers remaining on the sidelines and those that are active keeping pricing high and underwriting standards quiteconservative. This is most notable for the “80/20” developments. The amendment to the Agency’s statute enacted in fiscal 2011, broadening our bond offerings to include unrated private placements is expected to provide alternativeexecutions for these transactions. In fiscal 2011, the Agency saw a continued recovery in the Federal Low Income Housing Tax Credit equity market, a key component of the capital structure of affordable housing developments. As the year progressed, we saw investors return to all geographic areas in the state though there continues to be a significant pricing advantage for transactions in downstate market areas, particularly New York City and its immediately surrounding suburban areas.Similar to credit enhancement providers, tax credit investors have maintained their tightened investment guidelines.
Financial Markets The Agency’s operations continued to be impacted in fiscal 2011 by the persistent weakness in the global economyand U.S. real estate market and by the continuing volatility in the capital markets. While lenders and tax credit investors have returned to the market, they seem to have done so cautiously; the Agency continues to seeconservative terms and conditions affecting its transactions. Furthermore, the downgrading of many U.S. and international lenders has affected new and existing transactions. Nevertheless, the strength of the New York City real estate market was evidenced in the increased demand by “80/20” developers. In fiscal 2011 the Agency continued to take advantage of the Federal New Issue Bond Program (“NIBP”), launched during fiscal 2010 to address certain challenges facing state and local housing finance agencies. Through NIBP, the Agency was able to lock its borrowing costs at a rate tied to 10 year U.S. Treasuries through the sale of $276.13 million of bonds that can be released from escrow through the end of the 2012 calendar year. The result was a significant reduction in the Agency’s borrowing costs and consequently, the Agency was able to offer mortgage rates lower thancurrent municipal rates. During fiscal year 2011, the Agency used $92.1 million of its NIBP allocation which was leveraged with $75.93 million of short term bonds sold to the public. The Agency has cultivated a cadre of Community Reinvestment Act (“CRA”) motivated buyers who actively participate in the Agency’s bond sales. This interest has complemented retail investor demand and has helped the Agency continue to achieve positive reception for its bond offerings. The Agency experienced an easing of construction credit enhancement availability for affordable housing developments and “80/20s” during fiscal 2011, although providers have maintained higher pricing and tightenedlending parameters. The Agency continued to benefit from its close affiliation with the SONYMA MortgageInsurance Fund, which provides permanent credit enhancement at competitive pricing for affordable housingdevelopments. Fannie Mae and Freddie Mac have continued to provide enhancement for fixed rate mortgages; otherwise, long term credit enhancement continued to be difficult to obtain for all types of developments with most providers remaining on the sidelines and those that are active keeping pricing high and underwriting standards quiteconservative. This is most notable for the “80/20” developments. The amendment to the Agency’s statute enacted in fiscal 2011, broadening our bond offerings to include unrated private placements is expected to provide alternativeexecutions for these transactions. In fiscal 2011, the Agency saw a continued recovery in the Federal Low Income Housing Tax Credit equity market, a key component of the capital structure of affordable housing developments. As the year progressed, we saw investors return to all geographic areas in the state though there continues to be a significant pricing advantage for transactions in downstate market areas, particularly New York City and its immediately surrounding suburban areas.Similar to credit enhancement providers, tax credit investors have maintained their tightened investment guidelines.
15

BondsMortgage Issued/Released
Project Name Amount from Escrow***PROJECTS FINANCED UNDER INDIVIDUAL REVENUE BOND RESOLUTIONS25 Washington Street 106 21 $ 19,700,000 $ 19,700,00029 Flatbush Avenue 327 66 90,000,000 90,000,0002180 Broadway 181 37 123,620,000 123,620,000330 West 39th Street 199 42 65,000,000 65,000,000Clinton Park 222 44 70,000,000 70,000,000Gotham West 1,238 251 520,000,000 * 220,000,000 SUBTOTAL 2,273 461 888,320,000 588,320,000
PROJECTS FINANCED UNDER THE AFFORDABLE HOUSING REVENUE BOND RESOLUTION**439 West 53rd Street Apartments 10 10 5,600,000 5,600,000Allen By the Bay Senior Housing 66 66 9,800,000 9,800,000Frederick Douglass Apartments 28 28 4,000,000 4,000,000John Crawford Apartments 96 96 4,375,000 4,425,000Greenacres Apartments 101 101 4,550,000 4,605,000
Total Affordable Units Units
Bond Issuances and Mortgage Financings ‐ Fiscal 2011 During fiscal 2011, the Agency issued or released from NIBP escrow, bonds totaling $807.3 million to finance 27 new projects that contain 4,169 housing units, of which 54% or 2,253 are set aside for low income households. Details are as follows:
* In connection with the making of the mortgage loan for this project, the amount shown includes the funds to be available from additionalbonds anticipated to be issued in fiscal years 2012 and 2013 by the Agency.
** The amount shown as “Bonds Issued” under this resolution includes the allocable portion of a debt service reserve fund. *** During fiscal 2011, $92,100,000 of such NIBP bonds were released from escrow and together with $75,930,000 of additional NIBP bonds, were
used to finance the 12 projects listed above. As of the end of fiscal 2011, $136,370,000 remains in escrow.
p , , , ,NOTA Special Needs Apartments 46 46 5,940,000 5,940,000Shiloh Senior Apartments 40 40 6,800,000 6,800,000Wilcox Lane Apartments 120 120 3,090,000 3,140,000Woodstock Manor Apartments 61 61 6,550,000 6,605,000 SUBTOTAL 568 568 50,705,000 50,915,000
PROJECTS FINANCED UNDER THE AFFORDABLE HOUSING REVENUE BOND RESOLUTION (NIBP)***25 State Street Apartments 50 50 8,760,000 8,800,000Burt Farms II Apartments 50 50 3,350,000 3,380,000CAMBA Gardens Apartments 209 209 34,060,000 34,110,000Erie Harbor Apartments 131 27 18,390,000 18,520,000Heritage Homes Apartments 131 131 18,390,000 18,560,000Liberty Green III Apartments 83 83 7,870,000 7,910,000Machackemach Village Apartments 51 51 2,310,000 2,330,000North Country Rural Preservation Apartments 254 254 14,390,000 14,460,000Pine Town Apartments 130 130 19,650,000 19,650,000Roundtop Commons Apartments 92 92 15,500,000 15,570,000Spring Valley Apartments 55 55 8,400,000 8,450,000Warburton Riverview Apartments 92 92 16,200,000 16,290,000 SUBTOTAL 1,328 1,224 167,270,000 168,030,000GRAND TOTAL 4,169 2,253 $ 1,106,295,000 $ 807,265,000
Bond Issuances and Mortgage Financings ‐ Fiscal 2011 During fiscal 2011, the Agency issued or released from NIBP escrow, bonds totaling $807.3 million to finance 27 new projects that contain 4,169 housing units, of which 54% or 2,253 are set aside for low income households. Details are as follows:
* In connection with the making of the mortgage loan for this project, the amount shown includes the funds to be available from additionalbonds anticipated to be issued in fiscal years 2012 and 2013 by the Agency.
** The amount shown as “Bonds Issued” under this resolution includes the allocable portion of a debt service reserve fund. *** During fiscal 2011, $92,100,000 of such NIBP bonds were released from escrow and together with $75,930,000 of additional NIBP bonds, were
used to finance the 12 projects listed above. As of the end of fiscal 2011, $136,370,000 remains in escrow.
16

BondsMortgage Issued/Released
Project Name Amount from Escrow***PROJECTS FINANCED UNDER INDIVIDUAL REVENUE BOND RESOLUTIONSHegeman Residence Apartments 161 161 $ 22,800,000 $ 22,800,0008 East 102nd Street 185 47 143,700,000 * 103,640,000 SUBTOTAL 346 208 166,500,000 126,440,000
PROJECTS FINANCED UNDER THE AFFORDABLE HOUSING REVENUE BOND RESOLUTION**Artspace Patchogue Lofts Apartments 45 45 9,100,000 9,135,000Bayshore Apartments 186 186 7,900,000 7,900,000Clinton‐Mohawk Apartments 140 140 5,460,000 5,525,000Concern MacDougal Apartments 65 65 13,465,000 13,615,000F.I.G.H.T. Village Apartments 246 246 11,705,000 11,850,000Genesis Neighborhood Plaza II 98 98 17,500,000 17,580,000Grant Park Apartments 100 100 22,500,000 22,590,000Hughes House Apartments 55 55 11,050,000 11,175,000M l A 227 227 8 765 000 8 895 000
Total Affordable Units Units
Bond Issuances and Mortgage Financings ‐ Fiscal 2010 During fiscal 2010, the Agency issued or released from NIBP escrow, bonds totaling $575.9 million to finance 19 new projects that contain 2,915 housing units, of which 95.3% or 2,777 are set aside for low income households. Details are as follows:
* In connection with the making of the mortgage loan for this project, the amount shown includes the funds that were made from additional bonds issued in fiscal year 2011 by the Agency.
** The amount shown as “Bonds Issued” under this resolution includes the allocable portion of a debt service reserve fund. *** The Agency issued an additional $276.1 million to be held in escrow until used to finance projects under the New Issue Bond Program (NIBP).
During fiscal 2010, $47.7 million of such bonds were released from escrow and together with $32.1 million of additional NIBP bonds, wereused to finance the five projects listed above.
Montcalm Apartments 227 227 8,765,000 8,895,000Pine Harbor Apartments 208 208 11,470,000 11,625,000Stonewood Village Apartments 188 188 15,500,000 15,595,000Westfall Heights Apartments 101 101 5,650,000 5,710,000 SUBTOTAL 1,659 1,659 140,065,000 141,195,000
PROJECTS FINANCED UNDER THE AFFORDABLE HOUSING REVENUE BOND RESOLUTION (NIBP)***Geneseo Highlands Apartments 89 89 4,950,000 4,950,000Grote Street Apartments 249 249 22,270,000 22,480,000Kennedy Plaza Tower Apartments 204 204 10,780,000 10,895,000Twin Oaks Apartments 94 94 15,610,000 15,670,000Twin Parks Apartments 274 274 25,550,000 25,800,000 SUBTOTAL 910 910 79,160,000 79,795,000Remaining in escrow 228,470,000GRAND TOTAL 2,915 2,777 $ 385,725,000 $ 575,900,000
Bond Issuances and Mortgage Financings ‐ Fiscal 2010 During fiscal 2010, the Agency issued or released from NIBP escrow, bonds totaling $575.9 million to finance 19 new projects that contain 2,915 housing units, of which 95.3% or 2,777 are set aside for low income households. Details are as follows:
* In connection with the making of the mortgage loan for this project, the amount shown includes the funds that were made from additional bonds issued in fiscal year 2011 by the Agency.
** The amount shown as “Bonds Issued” under this resolution includes the allocable portion of a debt service reserve fund. *** The Agency issued an additional $276.1 million to be held in escrow until used to finance projects under the New Issue Bond Program (NIBP).
During fiscal 2010, $47.7 million of such bonds were released from escrow and together with $32.1 million of additional NIBP bonds, wereused to finance the five projects listed above.
17

Bonds IssuedUnder Multi‐ Initial Bond
Project Name Year Programs Issuance505 West 37th Street $ 119,600,000 2008320 West 38th Street 106,000,000 2008West 37th Street 30,900,000 2008Related‐42nd and 10th 102,900,000 2007
$ 359,400,000
Project Name AmountAvalon Bowery Place I $ 93,800,000316 Eleventh Avenue 32,600,000600 West 42nd Street 26,100,000
$ 152,500,000
The Agency issued $152.5 million in bonds to refund three Series of bonds previously issued:
During fiscal 2010, the Agency issued an additional $359.4 million in bonds to finance 4 projects pursuant to multi‐year agreements entered into upon closing of their initial bonds, under which 20% of the units are set aside for lowincome households.
Bond Issuances and Mortgage Advances Total bonds issued by the Agency and total mortgage loan advances, for a five year period were:
On an annual basis, mortgage advances vary from bonds issued because mortgage advances are made usingfunds available from both current and prior fiscal year bond issuances and additional funds made available byparticipating lenders.
, ,
Fiscal Total Total MortgageYear Bonds Issued Loan Advances
2007 $ 1,040,530 $ 1,161,6222008 1,380,695 1,292,1832009 1,132,310 1,248,2952010 1,087,800 1,334,9742011 924,266 860,012
($ in thousands)
During fiscal 2010, the Agency issued an additional $359.4 million in bonds to finance 4 projects pursuant to multi‐year agreements entered into upon closing of their initial bonds, under which 20% of the units are set aside for lowincome households.
Bond Issuances and Mortgage Advances Total bonds issued by the Agency and total mortgage loan advances, for a five year period were:
On an annual basis, mortgage advances vary from bonds issued because mortgage advances are made usingfunds available from both current and prior fiscal year bond issuances and additional funds made available byparticipating lenders.
18

October 31,2011 2010 2009
Assets: Cash $ 101,205 $ 62,289 $ 69,591 62% (10%) Mortgage loans receivable ‐ net 9,269,513 8,869,571 8,867,986 5% — Investments including accrued interest receivable 1,460,403 1,463,783 1,417,525 — 3% Other assets 29,775 30,197 33,796 (1%) (11%) Total assets 10,860,896 10,425,840 10,388,898 4% —
Deferred outflows of resources: Accumulated decrease in fair value of hedging derivatives 43,933 40,201 28,019 9% 43%
Liabilities: Bonds payable 10,155,884 9,737,499 9,697,509 4% —
2011‐2010 2010‐2009% Change
Condensed Financial Information NEW YORK STATE HOUSING FINANCE AGENCY Statements of Net Position Summary Schedule (In thousands)
p y Derivative instrument ‐ interest rate swaps 43,933 40,201 28,019 9% 43% Interest payable 23,091 22,388 27,797 3% (19%) Accounts payable 6,961 7,460 5,328 (7%) 40% Unearned revenues, amounts received in advance and other payables 177,955 151,922 125,239 17% 21% Postemployment retirement benefits 32,779 31,141 29,639 5% 5% Other liabilities 60,963 50,370 58,769 21% (14%) Total liabilities 10,501,566 10,040,981 9,972,300 5% 1%
Net position $ 403,263 $ 425,060 $ 444,617 (5%) (4%)
ʺ—ʺ indicates a percentage of less than 1%
Condensed Financial Information NEW YORK STATE HOUSING FINANCE AGENCY Statements of Net Position Summary Schedule (In thousands)
19
Assets Mortgage Loans Receivable Mortgage loans receivable are the Agency’s primary assets, comprising approximately 85% of the total assets forfiscal 2011, fiscal 2010 and fiscal 2009. Mortgage loans receivable are primarily first mortgage liens on the real property of the project and are financed by long‐term indebtedness. As a result of continued lending activity, mortgage loans receivable increased by $400 million, or approximately 5%from approximately $8.9 billion at October 31, 2010 to $9.3 billion at October 31, 2011. Mortgage loans receivableremained unchanged in the amount of $8.9 billion in fiscal 2010 and 2009. Mortgage loans receivable are presented net of loan participation agreements in the amounts of $21.3 million, $144.2million and $232.4 million, as well as subsidy loans in the amounts of $171.0 million, $151.1 million and $119.8 million at October 31, 2011, 2010 and 2009, respectively. Cash and Investments Restricted assets are held principally by a bond trustee or a depository in the form of cash and investments. These funds are held for the following purposes: • To fund construction loans for projects with mortgage commitments remaining to be funded. • As reserves for debt held under the specific requirements of bond resolutions. • To fund debt service on bonds when such payments are due. • Funds received from governmental entities to be disbursed to projects on whose behalf such funds were
received. • Escrow and reserve funds held for the benefit of the projects on whose behalf such funds were remitted. • Funds available to be advanced for subsidy loans.
Unrestricted assets held principally by a bond trustee or a depository in the form of cash and investments are held in order to fund the operating costs of the Agency. When unrestricted funds are committed to be advanced assubsidy loans, the funds are transferred to restricted assets. Investments Primarily as a result of bond proceeds received during fiscal 2011, investments (including accrued interestreceivable thereon) held by the Agency remained largely unchanged at approximately $1.5 billion at October 31, 2011 and 2010. This compares with the increase of $46 million or approximately 3% from $1.4 billion at October 31,2009 to $1.5 billion at October 31, 2010. The increase at October 31, 2010 compared to October 31, 2009 was primarily a result of the increase in funds advanced during fiscal 2009 and the decrease in bond proceeds received and invested during the same fiscal year. Deferred Outflows of Resources In June 2008, the Governmental Accounting Standards Board (“GASB”) issued Statement No. 53, Accounting and Financial Reporting for Derivative Instruments (“GASB No. 53”). The Statement establishes guidance on therecognition, measurement and disclosures related to derivative instruments (“interest rate swaps”) entered into by
20

governmental entities. GASB No. 53 requires that most derivative instruments be reported at fair value, andrequires governmental entities to determine if derivatives are effective hedges of risks associated with relatedhedgeable items. Generally, for derivatives that are effective hedges, changes in fair values are deferred whereasfor ineffective hedges, the changes in fair value are recognized in the current period. The Agency implementedGASB No. 53 retroactively as of October 31, 2010. For fiscal 2011, 2010 and 2009, all of the Agency’s interest rateswaps were determined to be effective hedges. Therefore, the Agency recorded the amount of the fair values ofthese interest rate swaps along with a corresponding deferred outflow of resources. Due to a drop in interest rates on interest rate swaps, the market values of the interest rate swaps declined fromapproximately ($40.2) million in fiscal 2010 to ($43.9) million in fiscal 2011, a decrease of $3.7 million, or 9%. During fiscal 2010, there was a decrease in market value from approximately ($28.0) million in fiscal 2009 to ($40.2) millionin fiscal 2010, a decrease of $12.2 million, or 43%. Liabilities Bonds Payable At approximately 97% of total liabilities in fiscal 2011 (94% in fiscal 2010 and 95% in fiscal 2009), bonds payable comprises the largest component of liabilities as of October 31, 2011, 2010 and 2009. Funds generated by the sale of bonds are used to fund mortgages. The payments due on mortgage loans receivable, together with interest earnings, are used to fund the debt service payments due on bonds payable. Bonds payable increased from approximately $9.7 billion at October 31, 2010 to $10.1 billion at October 31, 2011, anincrease of $400 million, or 4%. This was a result of the activity during fiscal 2011 in which the bonds were issued in the amount of approximately $900 million and retired in the amount of approximately $500 million. The balance remained unchanged at approximately $9.7 billion at October 31, 2010 and 2009, since bonds were both issued and retired in the approximate amount of $1 billion, during fiscal 2010. Interest Payable Primarily as a result of the increase to bonds payable, interest payable increased from approximately $22.4 million at October 31, 2010 to $23.1 million at October 31, 2011, an increase of $700 thousand, or approximately 3%. This compares with the decrease from $27.8 million at October 31, 2009 to $22.4 million at October 31, 2010, a decrease of$5.4 million, or approximately 19%, which was a result of the drop in interest rates on short term tax exemptsecurities. Accounts Payable Accounts payable vary from year to year based on the timing of invoices received and the timing of payment onsuch invoices. Accounts payable decreased from approximately $7.5 million in fiscal 2010 to $7 million in fiscal 2011 a decrease of $500 thousand, or approximately 7%. This compares with the increase from $5.3 million in fiscal 2009 to $7.5 million in fiscal 2010 an increase of $2.2 million, or approximately 40%.
governmental entities. GASB No. 53 requires that most derivative instruments be reported at fair value, andrequires governmental entities to determine if derivatives are effective hedges of risks associated with relatedhedgeable items. Generally, for derivatives that are effective hedges, changes in fair values are deferred whereasfor ineffective hedges, the changes in fair value are recognized in the current period. The Agency implementedGASB No. 53 retroactively as of October 31, 2010. For fiscal 2011, 2010 and 2009, all of the Agency’s interest rateswaps were determined to be effective hedges. Therefore, the Agency recorded the amount of the fair values ofthese interest rate swaps along with a corresponding deferred outflow of resources. Due to a drop in interest rates on interest rate swaps, the market values of the interest rate swaps declined fromapproximately ($40.2) million in fiscal 2010 to ($43.9) million in fiscal 2011, a decrease of $3.7 million, or 9%. During fiscal 2010, there was a decrease in market value from approximately ($28.0) million in fiscal 2009 to ($40.2) millionin fiscal 2010, a decrease of $12.2 million, or 43%. Liabilities Bonds Payable At approximately 97% of total liabilities in fiscal 2011 (94% in fiscal 2010 and 95% in fiscal 2009), bonds payable comprises the largest component of liabilities as of October 31, 2011, 2010 and 2009. Funds generated by the sale of bonds are used to fund mortgages. The payments due on mortgage loans receivable, together with interest earnings, are used to fund the debt service payments due on bonds payable. Bonds payable increased from approximately $9.7 billion at October 31, 2010 to $10.1 billion at October 31, 2011, anincrease of $400 million, or 4%. This was a result of the activity during fiscal 2011 in which the bonds were issued in the amount of approximately $900 million and retired in the amount of approximately $500 million. The balance remained unchanged at approximately $9.7 billion at October 31, 2010 and 2009, since bonds were both issued and retired in the approximate amount of $1 billion, during fiscal 2010. Interest Payable Primarily as a result of the increase to bonds payable, interest payable increased from approximately $22.4 million at October 31, 2010 to $23.1 million at October 31, 2011, an increase of $700 thousand, or approximately 3%. This compares with the decrease from $27.8 million at October 31, 2009 to $22.4 million at October 31, 2010, a decrease of$5.4 million, or approximately 19%, which was a result of the drop in interest rates on short term tax exemptsecurities. Accounts Payable Accounts payable vary from year to year based on the timing of invoices received and the timing of payment onsuch invoices. Accounts payable decreased from approximately $7.5 million in fiscal 2010 to $7 million in fiscal 2011 a decrease of $500 thousand, or approximately 7%. This compares with the increase from $5.3 million in fiscal 2009 to $7.5 million in fiscal 2010 an increase of $2.2 million, or approximately 40%.
21

Unearned Revenues, Amounts Received in Advance and Other Payables The amount of $151.9 million in fiscal 2010 compares to $178 million in fiscal 2011, an increase of $26.1 million, or approximately 17%, as compared with an increase from $125.2 million in fiscal 2009 to $151.9 million in fiscal 2010, an increase of $26.7 million, or approximately 21%. The increase in fiscal years 2011 and 2010 are primarily a result of amounts received from projects to fund bond redemptions, principal reserve fund payments and advance mortgage payments.
Unearned Revenues, Amounts Received in Advance and Other Payables The amount of $151.9 million in fiscal 2010 compares to $178 million in fiscal 2011, an increase of $26.1 million, or approximately 17%, as compared with an increase from $125.2 million in fiscal 2009 to $151.9 million in fiscal 2010, an increase of $26.7 million, or approximately 21%. The increase in fiscal years 2011 and 2010 are primarily a result of amounts received from projects to fund bond redemptions, principal reserve fund payments and advance mortgage payments.
22

2011 2010 2009Operating revenues: Interest on mortgage loans $ 101,844 $ 107,197 $ 143,065 (5%) (25%) Investment income 4,784 7,100 15,002 (33%) (53%) Fees, charges and other 28,157 38,676 24,892 (27%) 55% Recoveries 180 9,880 — (98%) 100% Total operating revenues 134,965 162,853 182,959 (17%) (11%)
Operating expenses: Interest expense 93,717 104,411 134,552 (10%) (22%) Earnings on investments credited to mortgagors 1,675 6,204 9,821 (73%) (37%) Postemployment retirement benefits 1,638 1,502 1,539 9% (2%) Reserve for subsidy loans disbursed 19,223 41,296 39,418 (53%) 5% General expenses 16,977 17,503 15,072 (3%) 16%
Fiscal Year Ended October 31,2011‐2010 2010‐2009
% Change
NEW YORK STATE HOUSING FINANCE AGENCY Summary of Revenues, Expenses and Changes in Net Position (In thousands)
Other financial expenses 10,046 4,467 6,410 125% (30%) Supervising agency fee 12,141 11,293 7,911 8% 43% Expenditures related to federal and state grants 44,175 72,729 24,626 (39%) 195% Total operating expenses 199,592 259,405 239,349 (23%) 8% Non‐operating revenues (expenses): Mortgage insurance proceeds — — 12,680 — (100%) Payments from agencies of the State of New York — — 1,566 — (100%) Payments from (to) the State of New York — 4,089 (4,089) (100%) 200% Federal and state grants 44,175 72,729 24,626 (39%) 195% Reserve funds received from (disbursed to) mortgagors (1,326) 136 (4,502) (1,075%) 103% (Loss) gain on loan (19) 41 (5,859) (146%) 101% Net non‐operating revenue 42,830 76,995 24,422 (44%) 215%
Net position: Decrease in net position (21,797) (19,557) (31,968) 11% (39%) Total net position ‐ beginning of fiscal year 425,060 444,617 476,585 (4%) (7%) Total net position ‐ end of fiscal year $ 403,263 $ 425,060 $ 444,617 (5%) (4%)
ʺ—ʺ indicates a percentage of less than 1%
NEW YORK STATE HOUSING FINANCE AGENCY Summary of Revenues, Expenses and Changes in Net Position (In thousands)
23

Operating revenues Interest on Mortgage Loans Interest on mortgage loans decreased from $107.2 million in fiscal 2010 to $101.8 million in fiscal 2011, a decrease of $5.4 million, or approximately 5%. This compares with a decrease from $143.1 million in fiscal 2009 to $107.2 million in fiscal 2010, a decrease of $35.9 million, or approximately 25%. Interest on mortgage loans represents the Agency’s primary source of funds available to pay interest expense. Although mortgage loans outstanding increased throughout fiscal 2011, fiscal 2010 and fiscal 2009, as a continued consequence of reduced interest rates on variable rate mortgages, interest paid on mortgage loans has declined. The related interest expense on bonds declined as well. Investment Income Primarily as a result of continued historic low yields on U.S. Treasury securities, investment income (including market value adjustment) decreased from $7.1 million in fiscal 2010 to $4.8 million in fiscal 2011, a decrease of $2.3 million, or approximately 33%. This compares with a decrease from $15.0 million in fiscal 2009 to $7.1 million in fiscal 2010, a decrease of $7.9 million, or approximately 53%. Fees, Charges and Other Fees, charges and other represent monthly fees and charges payments due on mortgage loans, recognition of income over the life of mortgage loans relating to fees received at the time of mortgage closings and other servicing fees. It also includes various one time payments due to the Agency, including public purpose fees due under certain conditions, in accordance with the terms of various Regulatory Agreements. Fees, charges and other decreased from $38.7 million in fiscal 2010 to $28.2 million in fiscal 2011, a decrease of $10.5 million, or approximately 27%. This compares with an increase from $24.9 million in fiscal 2009 to $38.7 million in fiscal 2010, an increase of $13.8 million, or approximately 55%. The increase in fiscal 2010 was primarily a result of a onetime fee in the amount of $12.5 million paid by Starrett City when it paid off its mortgage in full. Recoveries Recoveries declined from $9.9 million in 2010 to $180,000 in fiscal 2011, a reduction of $9.7 million or 98%. Recoveries represent payments received relating to mortgages for which an allowance had previously been established. Recoveries are also used to account for adjustments to Allowances for Losses on Loans. During fiscal 2010, the largest component of Recoveries was a result of the allowance for losses on loans being reduced from $12.7 million as of October 31, 2009 to $3.4 million as of October 31, 2010, a reduction of $9.3 million in the Nursing Home and Health Care program. The allowance was adjusted due to the payment in full of certainmortgages over recent fiscal years for which an allowance had previously been established (see Note 3). Operating expenses Interest Expense As a continued consequence of reduced interest rates on variable rate bonds, along with bond redemptions andbond amortizations, interest expense has continued to decline. Interest expense decreased from $104.4 million
Operating revenues Interest on Mortgage Loans Interest on mortgage loans decreased from $107.2 million in fiscal 2010 to $101.8 million in fiscal 2011, a decrease of $5.4 million, or approximately 5%. This compares with a decrease from $143.1 million in fiscal 2009 to $107.2 million in fiscal 2010, a decrease of $35.9 million, or approximately 25%. Interest on mortgage loans represents the Agency’s primary source of funds available to pay interest expense. Although mortgage loans outstanding increased throughout fiscal 2011, fiscal 2010 and fiscal 2009, as a continued consequence of reduced interest rates on variable rate mortgages, interest paid on mortgage loans has declined. The related interest expense on bonds declined as well. Investment Income Primarily as a result of continued historic low yields on U.S. Treasury securities, investment income (including market value adjustment) decreased from $7.1 million in fiscal 2010 to $4.8 million in fiscal 2011, a decrease of $2.3 million, or approximately 33%. This compares with a decrease from $15.0 million in fiscal 2009 to $7.1 million in fiscal 2010, a decrease of $7.9 million, or approximately 53%. Fees, Charges and Other Fees, charges and other represent monthly fees and charges payments due on mortgage loans, recognition of income over the life of mortgage loans relating to fees received at the time of mortgage closings and other servicing fees. It also includes various one time payments due to the Agency, including public purpose fees due under certain conditions, in accordance with the terms of various Regulatory Agreements. Fees, charges and other decreased from $38.7 million in fiscal 2010 to $28.2 million in fiscal 2011, a decrease of $10.5 million, or approximately 27%. This compares with an increase from $24.9 million in fiscal 2009 to $38.7 million in fiscal 2010, an increase of $13.8 million, or approximately 55%. The increase in fiscal 2010 was primarily a result of a onetime fee in the amount of $12.5 million paid by Starrett City when it paid off its mortgage in full. Recoveries Recoveries declined from $9.9 million in 2010 to $180,000 in fiscal 2011, a reduction of $9.7 million or 98%. Recoveries represent payments received relating to mortgages for which an allowance had previously been established. Recoveries are also used to account for adjustments to Allowances for Losses on Loans. During fiscal 2010, the largest component of Recoveries was a result of the allowance for losses on loans being reduced from $12.7 million as of October 31, 2009 to $3.4 million as of October 31, 2010, a reduction of $9.3 million in the Nursing Home and Health Care program. The allowance was adjusted due to the payment in full of certainmortgages over recent fiscal years for which an allowance had previously been established (see Note 3). Operating expenses Interest Expense As a continued consequence of reduced interest rates on variable rate bonds, along with bond redemptions andbond amortizations, interest expense has continued to decline. Interest expense decreased from $104.4 million
24

in fiscal 2010 to $93.7 million in fiscal 2011, a decrease of $10.7 million, or approximately 10%. This compares with a decrease from $134.6 million in fiscal 2009 to $104.4 million in fiscal 2010, a decrease of $30.2 million, orapproximately 22%. Earnings on Investments Credited to Mortgagors During the construction period, certain mortgages are credited with the earnings on unadvanced bond proceedsheld in the construction financing account and the capitalized interest account on a monthly basis. Fluctuations result from the timing of the granting of credits to mortgagors and interest earned on investments during theperiod. As a result of the continued decline in interest rates, Earnings on Investments Credited to Mortgagorsdeclined from $6.2 million in fiscal 2010 to $1.7 million in fiscal 2011, representing a decline of $4.5 million or approximately 73%. This compares with a decrease from $9.8 million in fiscal 2009 to $6.2 million in fiscal 2010, a decrease of $3.6 million, or approximately 37%. Reserve for Subsidy Loans Disbursed Certain Agency funds have been made available for making subsidy loans. Subsidy loans are made in the form of subordinate mortgage loans and are recorded as mortgage loans receivable. The amount of the reserve forsubsidy loan funds disbursed represents the expense recorded during the fiscal year as an allowance recordedagainst the mortgage loans receivable. These are not secured by credit enhancement and their terms requirescheduled payments which are deferred until other obligations are satisfied. Therefore, an allowance isestablished for the full amount of each of these loans. The expense incurred through the reserve for subsidy loans disbursed decreased by $22.1 million, or approximately 53% from $41.3 million in fiscal 2010 to $19.2 million in fiscal 2011. The decrease is due to thelower interest rates provided by NIBP, therefore resulting in less of a need for subsidy funds. This compares with an increase of $1.9 million, or approximately 5% from $39.4 million in fiscal 2009 to $41.3 million in fiscal 2010. The increases in both fiscal 2010 and fiscal 2009 were primarily a result of an increased number of affordable housing projects which required the assistance of subsidy loan funds at a time when federal resources were reduced. General Expenses General Expenses include certain administrative expenses in addition to other financial expenses. General Expenses decreased from approximately $17.5 million in fiscal 2010 to $17.0 million in fiscal 2011, a decrease of $500 thousand, or 3%, primarily as a result of reduced salary expenses. This compares with an increase from approximately $15.1 million in fiscal 2009 to $17.5 in fiscal 2010, an increase of $2.4 million, or 16%. The increasefrom 2009 to 2010 was primarily attributable to salary expenses which increased by approximately $500 thousand (primarily as a result of collective bargaining salary increases) and attendant employee benefits, (including health care and pension) which increased by approximately $700 thousand. Other Financial Expenses Other financial expenses represent the following: arbitrage rebate payments due to the federal government, bond premium funds advanced, letter of credit fees and remarketing fees. Other financial expenses increased from $4.5 million in fiscal 2010 to $10.0 million in fiscal 2011, an increase of $5.5 million, or approximately 125%,
in fiscal 2010 to $93.7 million in fiscal 2011, a decrease of $10.7 million, or approximately 10%. This compares with a decrease from $134.6 million in fiscal 2009 to $104.4 million in fiscal 2010, a decrease of $30.2 million, orapproximately 22%. Earnings on Investments Credited to Mortgagors During the construction period, certain mortgages are credited with the earnings on unadvanced bond proceedsheld in the construction financing account and the capitalized interest account on a monthly basis. Fluctuations result from the timing of the granting of credits to mortgagors and interest earned on investments during theperiod. As a result of the continued decline in interest rates, Earnings on Investments Credited to Mortgagorsdeclined from $6.2 million in fiscal 2010 to $1.7 million in fiscal 2011, representing a decline of $4.5 million or approximately 73%. This compares with a decrease from $9.8 million in fiscal 2009 to $6.2 million in fiscal 2010, a decrease of $3.6 million, or approximately 37%. Reserve for Subsidy Loans Disbursed Certain Agency funds have been made available for making subsidy loans. Subsidy loans are made in the form of subordinate mortgage loans and are recorded as mortgage loans receivable. The amount of the reserve forsubsidy loan funds disbursed represents the expense recorded during the fiscal year as an allowance recordedagainst the mortgage loans receivable. These are not secured by credit enhancement and their terms requirescheduled payments which are deferred until other obligations are satisfied. Therefore, an allowance isestablished for the full amount of each of these loans. The expense incurred through the reserve for subsidy loans disbursed decreased by $22.1 million, or approximately 53% from $41.3 million in fiscal 2010 to $19.2 million in fiscal 2011. The decrease is due to thelower interest rates provided by NIBP, therefore resulting in less of a need for subsidy funds. This compares with an increase of $1.9 million, or approximately 5% from $39.4 million in fiscal 2009 to $41.3 million in fiscal 2010. The increases in both fiscal 2010 and fiscal 2009 were primarily a result of an increased number of affordable housing projects which required the assistance of subsidy loan funds at a time when federal resources were reduced. General Expenses General Expenses include certain administrative expenses in addition to other financial expenses. General Expenses decreased from approximately $17.5 million in fiscal 2010 to $17.0 million in fiscal 2011, a decrease of $500 thousand, or 3%, primarily as a result of reduced salary expenses. This compares with an increase from approximately $15.1 million in fiscal 2009 to $17.5 in fiscal 2010, an increase of $2.4 million, or 16%. The increasefrom 2009 to 2010 was primarily attributable to salary expenses which increased by approximately $500 thousand (primarily as a result of collective bargaining salary increases) and attendant employee benefits, (including health care and pension) which increased by approximately $700 thousand. Other Financial Expenses Other financial expenses represent the following: arbitrage rebate payments due to the federal government, bond premium funds advanced, letter of credit fees and remarketing fees. Other financial expenses increased from $4.5 million in fiscal 2010 to $10.0 million in fiscal 2011, an increase of $5.5 million, or approximately 125%,
25

as compared with a decrease from $6.4 million in fiscal 2009 to $4.5 million in fiscal 2010, a decrease of $1.9 million,or 30%. The increase from fiscal 2010 to fiscal 2011 was primarily a result of the Agency expending approximately $5.7 million in premium funds as compared to the $66 thousand for fiscal 2010, an increase of approximately $5.6 million. Proceeds from the issuance of bonds on State supported debt in excess of par value are capitalized andrecorded as bond premium. Transfer of such funds to the State is recorded as an expense. Supervising Agency Fee and Other Payments to the State Supervising Agency Fees and other payments to the State are paid by the Agency to the State and certain stateagencies, including the New York State Division of Housing and Community Renewal (“DHCR”). Primarily a result of increased cost recovery fees and a one‐time payment to the State in the amount of $3.5 million paid during fiscal 2011, the Supervising Agency Fee and other payments to the State increased by $800 thousand, or 8% from $11.3 million in fiscal 2010 to $12.1 million in fiscal 2011. This compares with an increase from $7.9 million in fiscal 2009 to $11.3 million in fiscal 2010, an increase of $3.4 million, or 43%. Non‐operating revenues (expenses) Mortgage Insurance Proceeds and Loss on Loans During fiscal years 2011 and 2010, the Agency has not received funds representing mortgage insurance proceeds. Infiscal 2009, the State of New York Mortgage Agency’s (“SONYMA”) Mortgage Insurance Fund (the “MIF”) requested and the Agency submitted, Lump Sum Claims for Losses to the MIF for the Pleasant Creek and the Woodcreek projects. The Agency received the net amount of $12.6 million, representing the outstanding principaland interest due under these two mortgage loans insured by the MIF. The MIF paid each Lump Sum Claim for Loss and the Agency applied the proceeds thereof to the retirement of the related bonds. Upon making the Lump SumClaim payments, the MIF had the right to, but declined to take assignment of either mortgage loan. During fiscal 2010, the Agency received an amount of $1.5 million, representing the purchase price for the sale of the Pleasant Creek project. In fiscal 2009, before the sale process was completed, an Asset was recorded as Owned Real Estate (and included in the Balance Sheet category “Interest and Other Receivables”) in the amount of $1.5million. In fiscal 2009, a loss on loans was recorded in the amount of $5.9 million, representing the difference between the $1.5 million sale price and the outstanding mortgage balance at the time in the amount of $7.4 million. Payments from (to) the State of New York The funds related to the March 2009 payment of $4.1 million directed by the State, represented the uncommittedportion of certain subsidy funds as of January 1, 2009. The State then included an appropriation for the MitchellLama and All Affordable Programs as part of the housing bonded capital budget. As intended, in fiscal 2010, thefunds were returned to the Agency in order to provide subsidies under this program. Federal and State Grants Federal and State Grants represent funds received from the federal government and the State which are then remitted to various housing developments. In accordance with GASB Statement No. 33, Accounting and Financial Reporting for Non‐Exchange Transactions, revenue is recorded as non‐operating and the related expense is recorded as an operating expense.
as compared with a decrease from $6.4 million in fiscal 2009 to $4.5 million in fiscal 2010, a decrease of $1.9 million,or 30%. The increase from fiscal 2010 to fiscal 2011 was primarily a result of the Agency expending approximately $5.7 million in premium funds as compared to the $66 thousand for fiscal 2010, an increase of approximately $5.6 million. Proceeds from the issuance of bonds on State supported debt in excess of par value are capitalized andrecorded as bond premium. Transfer of such funds to the State is recorded as an expense. Supervising Agency Fee and Other Payments to the State Supervising Agency Fees and other payments to the State are paid by the Agency to the State and certain stateagencies, including the New York State Division of Housing and Community Renewal (“DHCR”). Primarily a result of increased cost recovery fees and a one‐time payment to the State in the amount of $3.5 million paid during fiscal 2011, the Supervising Agency Fee and other payments to the State increased by $800 thousand, or 8% from $11.3 million in fiscal 2010 to $12.1 million in fiscal 2011. This compares with an increase from $7.9 million in fiscal 2009 to $11.3 million in fiscal 2010, an increase of $3.4 million, or 43%. Non‐operating revenues (expenses) Mortgage Insurance Proceeds and Loss on Loans During fiscal years 2011 and 2010, the Agency has not received funds representing mortgage insurance proceeds. Infiscal 2009, the State of New York Mortgage Agency’s (“SONYMA”) Mortgage Insurance Fund (the “MIF”) requested and the Agency submitted, Lump Sum Claims for Losses to the MIF for the Pleasant Creek and the Woodcreek projects. The Agency received the net amount of $12.6 million, representing the outstanding principaland interest due under these two mortgage loans insured by the MIF. The MIF paid each Lump Sum Claim for Loss and the Agency applied the proceeds thereof to the retirement of the related bonds. Upon making the Lump SumClaim payments, the MIF had the right to, but declined to take assignment of either mortgage loan. During fiscal 2010, the Agency received an amount of $1.5 million, representing the purchase price for the sale of the Pleasant Creek project. In fiscal 2009, before the sale process was completed, an Asset was recorded as Owned Real Estate (and included in the Balance Sheet category “Interest and Other Receivables”) in the amount of $1.5million. In fiscal 2009, a loss on loans was recorded in the amount of $5.9 million, representing the difference between the $1.5 million sale price and the outstanding mortgage balance at the time in the amount of $7.4 million. Payments from (to) the State of New York The funds related to the March 2009 payment of $4.1 million directed by the State, represented the uncommittedportion of certain subsidy funds as of January 1, 2009. The State then included an appropriation for the MitchellLama and All Affordable Programs as part of the housing bonded capital budget. As intended, in fiscal 2010, thefunds were returned to the Agency in order to provide subsidies under this program. Federal and State Grants Federal and State Grants represent funds received from the federal government and the State which are then remitted to various housing developments. In accordance with GASB Statement No. 33, Accounting and Financial Reporting for Non‐Exchange Transactions, revenue is recorded as non‐operating and the related expense is recorded as an operating expense.
26

****
Federal and State Grants decreased from $72.7 million in fiscal 2010 to $44.2 million in fiscal 2011, a decrease of $28.5 million or approximately 39%. This compares with an increase from $24.6 million in fiscal 2009 to $72.7million in fiscal 2010, an increase of $48.1 million or approximately 195%. During fiscal 2010, the Agency began to participate in the onetime federal program – the Tax Credit Assistance Program (“TCAP”) authorized by the American Recovery and Reinvestment Act of 2009, through which funds weremade available to assist affordable housing developments. The decrease from fiscal 2010 to fiscal 2011 was primarily a consequence of decreased funds transferred by the federal government under the TCAP program. In fiscal 2011, the Agency received approximately $16.7 million in TCAP funds which were disbursed to housing developments, as compared with $48 million in fiscal 2010, a decrease of $31.3 million, or 65%. Additionally, in fiscal 2010, the Agency began to distribute funds under the federal Neighborhood Stabilization Program to thirtylocal recipients, who are predominantly redeveloping foreclosed, abandoned, and vacant residential properties incommunities heavily affected by foreclosures for resale or lease to low, moderate, and middle income households. Total funds disbursed were approximately $21.2 million in fiscal 2011 as compared with $9 million in fiscal 2010, anincrease of $12.2 million, or 136%.
27

New York State Housing Finance Agency(A Component Unit of the State of New York)
STATEMENTS OF NET POSITION(in thousands)
2011 2010AssetsCurrent Assets: Cash held principally by Trustee and Depository ‐ Restricted $ 82,426 $ 46,123 Cash held by Paying Agent for November 1 bond payments ‐ Restricted 4,573 4,563 Cash held principally by Trustee and Depository ‐ Unrestricted 14,206 11,603 Investments ‐ Restricted 1,270,359 1,273,295 Investments ‐ Unrestricted 93,184 89,220 Accrued interest receivable on investments 2,018 1,853 Mortgage loans and other loans ‐ net 197,655 192,381 Interest receivable and other 18,495 18,574Total current assets 1,682,916 1,637,612Non‐current Assets: Investments ‐ Restricted 52,068 56,202 Investments ‐ Unrestricted 42,774 43,213 Mortgage loans and other loans ‐ net 9,071,858 8,677,190 Interest receivable and other 11,280 11,623Total non‐current assets 9,177,980 8,788,228Total assets 10,860,896 10,425,840
Deferred outflows of resources Accumulated decrease in fair value of hedging derivatives 43,933 40,201
LiabilitiesCurrent Liabilities: Accounts payable 6,961 7,460 Interest payable 23,091 22,388 Funds received from governmental entities 21,331 23,446 Earnings restricted to project development 5,055 6,437 Unearned revenues, amounts received in advance and other payables 160,541 139,394 Bonds payable 151,365 128,850 Funds received from mortgagors 34,577 20,487Total current liabilities 402,921 348,462Non‐current Liabilities: Bonds payable including unamortized bond premium and discount 10,004,519 9,608,649 Derivative instrument ‐ interest rate swaps 43,933 40,201 Deferred revenues, amounts received in advance and other 17,414 12,528 Postemployment retirement benefits 32,779 31,141Total non‐current liabilities 10,098,645 9,692,519Total liabilities 10,501,566 10,040,981
Net position Restricted 350,102 366,325 Unrestricted 53,161 58,735Total net position $ 403,263 $ 425,060 See notes to financial statements.
October 31,
28
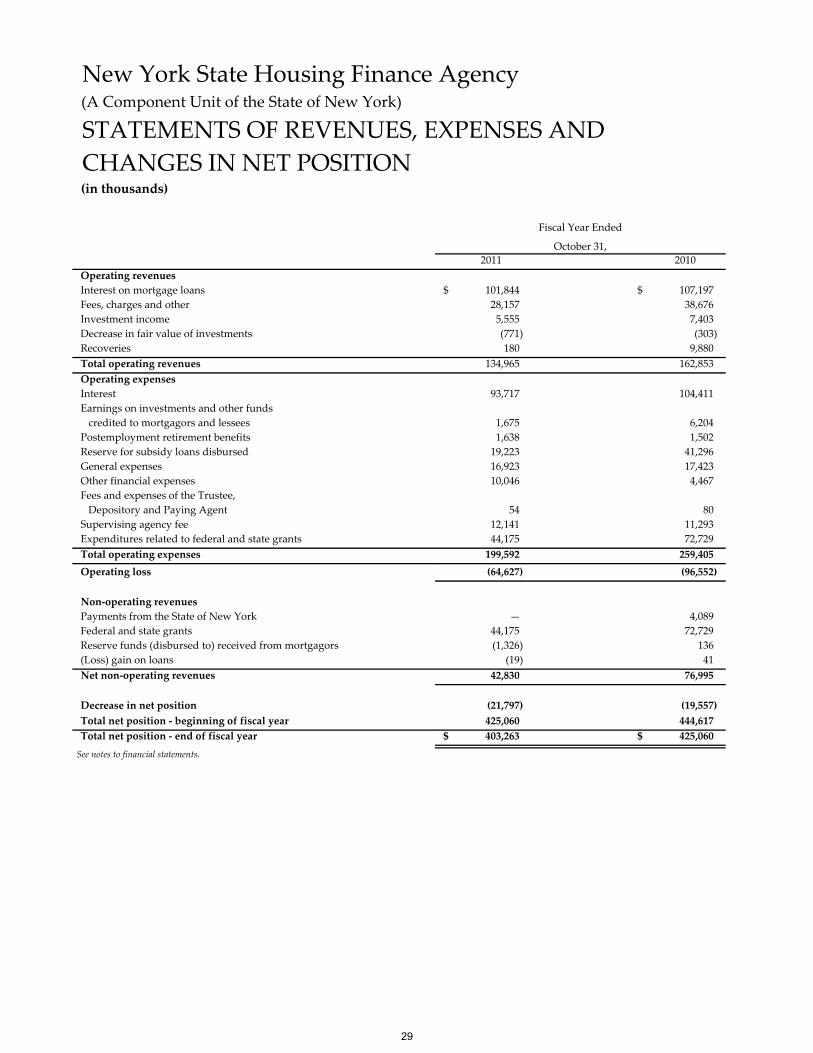
New York State Housing Finance Agency(A Component Unit of the State of New York)
STATEMENTS OF REVENUES, EXPENSES ANDCHANGES IN NET POSITION(in thousands)
Fiscal Year Ended
October 31,2011 2010
Operating revenuesInterest on mortgage loans $ 101,844 $ 107,197Fees, charges and other 28,157 38,676Investment income 5,555 7,403Decrease in fair value of investments (771) (303)Recoveries 180 9,880Total operating revenues 134,965 162,853Operating expensesInterest 93,717 104,411Earnings on investments and other funds credited to mortgagors and lessees 1,675 6,204Postemployment retirement benefits 1,638 1,502Reserve for subsidy loans disbursed 19,223 41,296General expenses 16,923 17,423Other financial expenses 10,046 4,467Fees and expenses of the Trustee, Depository and Paying Agent 54 80Supervising agency fee 12,141 11,293Expenditures related to federal and state grants 44,175 72,729Total operating expenses 199,592 259,405Operating loss (64,627) (96,552)
Non‐operating revenuesPayments from the State of New York — 4,089Federal and state grants 44,175 72,729Reserve funds (disbursed to) received from mortgagors (1,326) 136(Loss) gain on loans (19) 41Net non‐operating revenues 42,830 76,995
Decrease in net position (21,797) (19,557)Total net position ‐ beginning of fiscal year 425,060 444,617Total net position ‐ end of fiscal year $ 403,263 $ 425,060
See notes to financial statements.
29
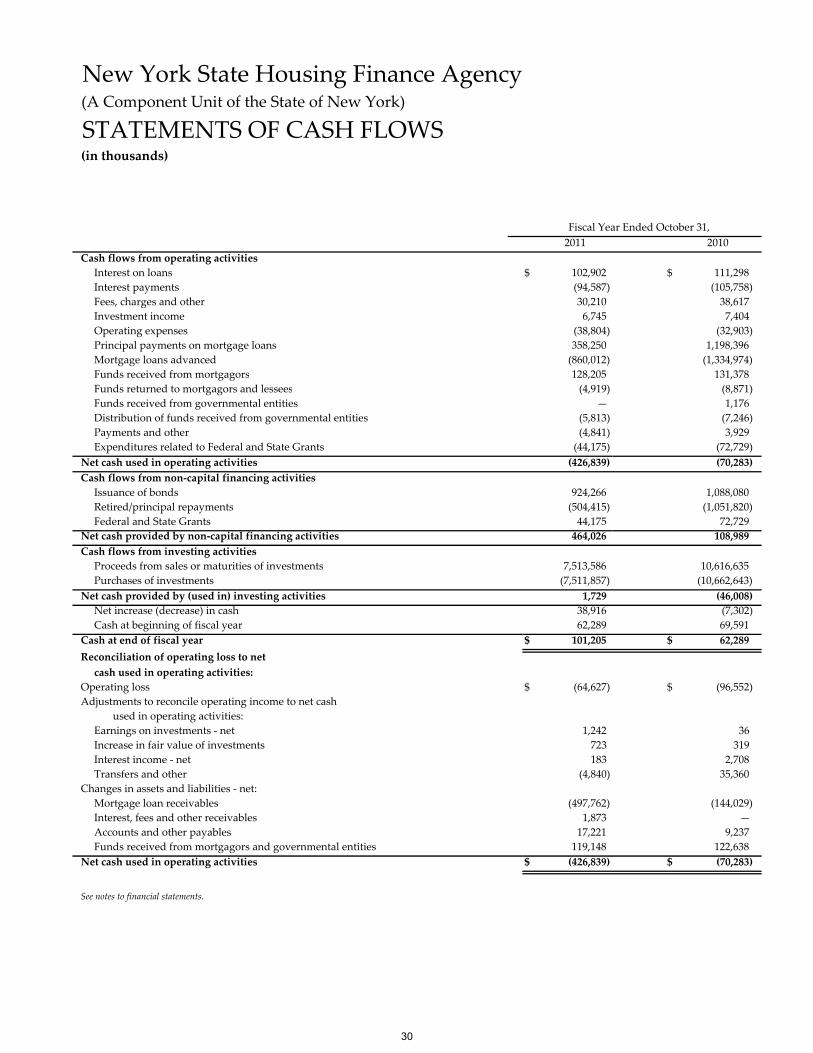
New York State Housing Finance Agency(A Component Unit of the State of New York)
STATEMENTS OF CASH FLOWS(in thousands)
Fiscal Year Ended October 31,2011 2010
Cash flows from operating activities Interest on loans $ 102,902 $ 111,298 Interest payments (94,587) (105,758) Fees, charges and other 30,210 38,617 Investment income 6,745 7,404 Operating expenses (38,804) (32,903) Principal payments on mortgage loans 358,250 1,198,396 Mortgage loans advanced (860,012) (1,334,974) Funds received from mortgagors 128,205 131,378 Funds returned to mortgagors and lessees (4,919) (8,871) Funds received from governmental entities — 1,176 Distribution of funds received from governmental entities (5,813) (7,246) Payments and other (4,841) 3,929 Expenditures related to Federal and State Grants (44,175) (72,729)Net cash used in operating activities (426,839) (70,283)Cash flows from non‐capital financing activities Issuance of bonds 924,266 1,088,080 Retired/principal repayments (504,415) (1,051,820) Federal and State Grants 44,175 72,729Net cash provided by non‐capital financing activities 464,026 108,989Cash flows from investing activities Proceeds from sales or maturities of investments 7,513,586 10,616,635 Purchases of investments (7,511,857) (10,662,643)Net cash provided by (used in) investing activities 1,729 (46,008) Net increase (decrease) in cash 38,916 (7,302) Cash at beginning of fiscal year 62,289 69,591Cash at end of fiscal year $ 101,205 $ 62,289Reconciliation of operating loss to net cash used in operating activities:Operating loss $ (64,627) $ (96,552)Adjustments to reconcile operating income to net cash used in operating activities: Earnings on investments ‐ net 1,242 36 Increase in fair value of investments 723 319 Interest income ‐ net 183 2,708 Transfers and other (4,840) 35,360Changes in assets and liabilities ‐ net: Mortgage loan receivables (497,762) (144,029) Interest, fees and other receivables 1,873 — Accounts and other payables 17,221 9,237 Funds received from mortgagors and governmental entities 119,148 122,638Net cash used in operating activities $ (426,839) $ (70,283)
See notes to financial statements.
30

NEW YORK STATE HOUSING FINANCE AGENCY(A COMPONENT UNIT OF THE STATE OF NEW YORK)
NOTES TO FINANCIAL STATEMENTSOCTOBER 31, 2011 AND 2010
NOTE 1 – THE AGENCY The New York State Housing Finance Agency (“Agency”), a component unit of the State of New York (“State”), is a corporate governmental agency constituted as a public benefit corporation under the provisions of the State Private Housing Finance Law. The Agency is empowered to finance or contract for the financing of the construction, acquisition or refinancing of loans for: (a) housing units for sale or rent to low and moderate income persons, families, and senior citizens, (b) municipal health facilities, (c) non‐profit health care facilities, (d) community related facilities and (e) to provide funds to repay the State for amounts advanced to finance the cost of various housing assistance programs. The Agency is also empowered, through its Capital Grant Low Rent Assistance Program, to provide rental housing to low and middle income persons or families. Additionally, the Agency participates in the federal government’s housing assistance programs, principally those established by Section 236 of the National Housing Act and Section 8 of the U.S. Housing Act of 1937. These federal programs provide interest reduction and rental assistance subsidies, respectively, to eligible projects and tenants. The Agency administers the State’s Housing Project Repair and Infrastructure Trust Fund Programs. The Housing Project Repair Program is to be used to correct construction‐related and energy, health and safety problems or deficiencies at Mitchell‐Lama housing projects that are at current economic rent or that enter into mortgage modification agreements with the Agency. The Infrastructure Trust Fund Programs provide grants for the development of affordable housing throughout New York State. The Agency finances most of its activities through the issuance of bonds. As of October 31, 2011, the Agency is authorized to issue bonds up to the amount of approximately $16.28 billion (approximately $15.28 billion as of October 31, 2010) to finance housing projects. Additionally, as of October 31, 2011, the Agency is authorized to issue Service Contract Obligation Revenue Bonds, Service Contract Revenue Bonds and Personal Income Tax Revenue Bonds in the amount of approximately $2.64 billion (approximately $2.53 billion as of October 31, 2010). In accordance with section 2100 of the Codification of Governmental Accounting and Financial Reporting Standards, the Agency’s financial statements are included in the State of New York’s annual financial statements as a component unit of the State. The Private Housing Finance Law, as amended in 1985, established the New York State Housing Trust Fund Corporation (“HTFC”) and the New York State Affordable Housing Corporation (“AHC”), both public benefit corporations, as subsidiary corporations of the Agency. In addition, as amended through 1990, such law established the New York State Homeless Housing and Assistance Corporation (“HHAC”). The Agency does not have financial accountability for these corporations; accordingly, they are not component units of the Agency in accordance with the requirements of the Governmental Accounting Standards Board (GASB) Statement No. 61 (GASB Statement No. 61), Financial Reporting Entity: Omnibus. GASB Statement No. 61 is designed to improve financial reporting for governmental entities by amending the requirements of GASB Statement No. 14, The Financial Reporting Entity, and GASB Statement No. 34, Basic Financial Statements—and Management’s Discussion and Analysis—for State and Local Governments, to better meet user needs and address reporting entity issues that have come to light since those Statements were issued in 1991 and 1999, respectively. Therefore, the financial activities of HTFC, AHC and HHAC are not included in the accompanying financial statements.
NOTE 1 – THE AGENCY The New York State Housing Finance Agency (“Agency”), a component unit of the State of New York (“State”), is a corporate governmental agency constituted as a public benefit corporation under the provisions of the State Private Housing Finance Law. The Agency is empowered to finance or contract for the financing of the construction, acquisition or refinancing of loans for: (a) housing units for sale or rent to low and moderate income persons, families, and senior citizens, (b) municipal health facilities, (c) non‐profit health care facilities, (d) community related facilities and (e) to provide funds to repay the State for amounts advanced to finance the cost of various housing assistance programs. The Agency is also empowered, through its Capital Grant Low Rent Assistance Program, to provide rental housing to low and middle income persons or families. Additionally, the Agency participates in the federal government’s housing assistance programs, principally those established by Section 236 of the National Housing Act and Section 8 of the U.S. Housing Act of 1937. These federal programs provide interest reduction and rental assistance subsidies, respectively, to eligible projects and tenants. The Agency administers the State’s Housing Project Repair and Infrastructure Trust Fund Programs. The Housing Project Repair Program is to be used to correct construction‐related and energy, health and safety problems or deficiencies at Mitchell‐Lama housing projects that are at current economic rent or that enter into mortgage modification agreements with the Agency. The Infrastructure Trust Fund Programs provide grants for the development of affordable housing throughout New York State. The Agency finances most of its activities through the issuance of bonds. As of October 31, 2011, the Agency is authorized to issue bonds up to the amount of approximately $16.28 billion (approximately $15.28 billion as of October 31, 2010) to finance housing projects. Additionally, as of October 31, 2011, the Agency is authorized to issue Service Contract Obligation Revenue Bonds, Service Contract Revenue Bonds and Personal Income Tax Revenue Bonds in the amount of approximately $2.64 billion (approximately $2.53 billion as of October 31, 2010). In accordance with section 2100 of the Codification of Governmental Accounting and Financial Reporting Standards, the Agency’s financial statements are included in the State of New York’s annual financial statements as a component unit of the State. The Private Housing Finance Law, as amended in 1985, established the New York State Housing Trust Fund Corporation (“HTFC”) and the New York State Affordable Housing Corporation (“AHC”), both public benefit corporations, as subsidiary corporations of the Agency. In addition, as amended through 1990, such law established the New York State Homeless Housing and Assistance Corporation (“HHAC”). The Agency does not have financial accountability for these corporations; accordingly, they are not component units of the Agency in accordance with the requirements of the Governmental Accounting Standards Board (GASB) Statement No. 61 (GASB Statement No. 61), Financial Reporting Entity: Omnibus. GASB Statement No. 61 is designed to improve financial reporting for governmental entities by amending the requirements of GASB Statement No. 14, The Financial Reporting Entity, and GASB Statement No. 34, Basic Financial Statements—and Management’s Discussion and Analysis—for State and Local Governments, to better meet user needs and address reporting entity issues that have come to light since those Statements were issued in 1991 and 1999, respectively. Therefore, the financial activities of HTFC, AHC and HHAC are not included in the accompanying financial statements.
31

NOTE 2 – SUMMARY OF SIGNIFICANT ACCOUNTING POLICIES A. BASIS OF ACCOUNTING: The Agency utilizes the accrual basis of accounting wherein revenues are recognized
when earned and expenses when incurred. B. INVESTMENTS: Investments, other than collateralized investment agreements, are recorded at their fair value,
which are based on quoted market prices or matrix pricing for securities that are not traded actively, in accordance with GASB Statement No. 31, Accounting and Financial Reporting for Certain Investments and External Investment Pools. Collateralized investment agreements are reported at cost plus accrued interest. For the purpose of financial statement presentation, the Agency does not consider any of its investments to be cash equivalents.
C. INTEREST AND INVESTMENT REVENUE: Interest and investment revenue is accrued and recognized as
revenue when earned. Interest on delinquent mortgage loans is recognized as revenue when earned where debt service on the mortgage loans is covered by the State’s moral obligation or other forms of recourse.
D. FEES, CHARGES AND OTHER: Mortgage origination fees, net of related costs, are recognized as income over
the life of the related mortgages using a method that approximates the effective interest method. Service and other fees and charges are recorded as income when earned and the associated administrative
expenses are recorded as incurred. Operating expenses identifiable to a particular program are charged directly to the program. All other operating expenses are allocated by the Agency to the individual programs. Fees and charges on certain delinquent mortgages (see Note 3) are recorded as income to the extent cash is received during the year.
The Agency has agreements with related public benefit corporations to provide managerial, administrative and financial functions for these organizations. Pursuant to these agreements, the Agency’s general expenses are allocated to reflect the services utilized by each of the respective related public benefit corporations.
E. GRANTS: Grants received from Federal, State and local governments are recognized as non‐operating revenue in accordance with GASB Statement No. 33, Accounting and Financial Reporting for Non‐Exchange Transactions.
F. ACCRUED VACATION BENEFITS: Vacation benefits are recorded in the period earned. G. BOND DISCOUNT, COSTS OF ISSUANCE EXPENSE AND BOND PREMIUM: Bond discount, premium and,
where applicable, the cost of issuing bonds and notes, are amortized over the life of the related lease or mortgage using the effective interest method.
H. USE OF RESTRICTED NET POSITION: When both restricted and unrestricted resources are available for a
particular restricted use, it is the Agency’s policy to use restricted resources first, and then unrestricted as needed.
I. ALLOWANCE FOR POTENTIAL LOSSES ON LOANS: An allowance has been established for possible uncollectible mortgage loans and accrued interest (see Note 3). Annually, the allowance is reviewed for reasonableness. Provisions for uncollectible receivables are recorded when it has been determined that a probable loss has occurred.
32

J. RESTRICTED ASSETS: The assets governed by bond or note resolutions are restricted. Cash and investments included in restricted fund accounts are held by trustee banks. Additionally, restricted assets include subsidy loans funds which were committed but not yet disbursed.
K. NET POSITION: The Agency’s Net Position represents the excess of assets and deferred outflow of resources
over liabilities and consists largely of mortgage loans and investments. The Agency’s net position is categorized as follows:
Restricted Net Position: Represents assets that have been restricted in use in accordance with the terms of bond indentures, grant awards, agreements or by State law, reduced by the outstanding balance of any debt that is attributable to those assets. This includes mortgage loan assets, bond proceeds and reserve funds that are pledged to bondholders and funds held pursuant to contractual obligations with New York State. Unrestricted Net Position: Represent assets that do not meet the definition of restricted.
L. USE OF ESTIMATES: The preparation of the financial statements in accordance with accounting principles generally accepted in the United States of America required management to make estimates and assumptions that affect the amounts and disclosures included in the Agency’s financial statements during the reporting periods. Actual amounts could differ from these estimates. The most significant estimates pertain to the allowance for potential losses on loans, the valuation of investments and the calculation for other postemployment benefits.
M. DEFERRED LOSSES AND GAINS ON REFUNDING: In accordance with GASB Statement No. 23, Accounting and Financial Reporting for Refundings of Debt Reported by Proprietary Activities, gains or losses in connection with advanced refundings are deferred and amortized as an adjustment to interest expense over the original life of the refunded bonds or the life of the refunding bonds, whichever is shorter.
N. DERIVATIVE INSTRUMENTS: The Agency enters into various interest rate swaps in order to manage risks associated with interest on its bond portfolio. In accordance with GASB Statement No. 53, Accounting and Financial Reporting for Derivative Instruments (“GASB No. 53”), the Agency recognizes the fair value of all derivative instruments as either an asset or liability on its statements of net position with the offsetting gains or losses recognized in earnings or as either deferred inflows or outflows if deemed an effective hedge.
O. NEW ACCOUNTING STANDARDS: In 2011, the Agency adopted GASB Statement No. 62, Codification of Accounting and Financial Reporting Guidance Contained in Pre‐November 30, 1989 Financial Accounting Standards Board (“FASB”) and AICPA Pronouncements (“GASB No. 62”). This Standard improves financial reporting by incorporating into the GASB’s authoritative literature certain accounting and financial reporting guidance that is included in FASB and the American Institute of Certified Public Accountants (“AICPA”) pronouncements issued on or before November 30, 1989, which does not conflict or contradict GASB pronouncements. GASB No. 62 superseded Statement No. 20, Accounting and Financial Reporting for Proprietary Funds and Other Governmental Entities that Use Proprietary Fund Accounting. The adoption of this new standard did not have a significant impact on the Agency. In June 2011, GASB issued Statement No. 63, Financial Reporting of Deferred Outflows of Resources, Deferred Inflows of Resources and Net Position (“GASB No. 63”). The objective of this Statement is to provide guidance for reporting deferred outflows of resources, deferred inflows of resources, and net position in a statement of financial position. Amounts that are required to be reported as deferred outflows should be reported in a
33
statement of financial position in a separate section following assets. Similarly, amounts required to be reported as deferred inflows of resources should be reported in a separate section following liabilities. The statement of net position should report the residual amount as net position, rather than net assets. The provisions of this Statement are effective for financial statements for periods beginning after December 15, 2011; however the Agency elected to early‐adopt this Statement in the 2011 fiscal year. GASB No. 63 was implemented retroactively.
The adoption of this statement resulted in a change in the presentation of the Balance Sheets to what is now referred to as the Statements of Net Position and the term “net assets” is changed to “net position” throughout the financial statements.
In June 2011, GASB issued Statement No. 64, Derivative Instruments; Application of Hedge Accounting Termination Provisions. The objective of this Statement is to clarify the termination provisions in GASB No. 53, when a counterparty of an interest rate or commodity swap is replaced. The provisions of this Statement are effective for financial statements for periods beginning after June 15, 2011. The Agency does not anticipate the implementation of this standard will have an impact on its financial statements.
P. RECLASSIFICATION: Amounts previously reported as deferred revenue in the 2010 financial statements relating to loan participation agreements, have been reclassified in order to conform to the current year presentation.
NOTE 3 – RECEIVABLES
Mortgage loans are primarily financed by long‐term indebtedness and are collectible through monthly payments. The Agency’s bond resolutions, with respect to mortgages, generally require among other provisions that:
A. The Agency’s mortgage is a first mortgage lien on the real property of the project;
B. The mortgage loan shall not exceed the then established project cost or, for certain programs, a certain
percentage thereof; and
C. Mortgage repayments, together with other available monies, shall be sufficient to pay debt service on the bonds issued to finance the mortgage.
The Agency had outstanding, under various loan programs, mortgage loans receivable in the amounts of $9.27 billion and $8.87 billion, net of loan participation agreements in the amounts of $21.29 million and $144.24 million as of October 31, 2011 and 2010, respectively. While the New York State Division of Housing and Community Renewal (“DHCR”) is required to set rental schedules for certain of the housing projects financed by the Agency at rates sufficient to meet current operating costs, including debt service and required reserves, mortgagors of certain projects (as described below) have experienced difficulty in collecting increased rents. The failure of a project to generate sufficient revenues may result in the inability of the mortgagor to meet its mortgage repayments, required reserves and, in certain cases, real estate taxes. The failure of a mortgagor to pay its real estate taxes could result in the Agency’s mortgage lien being extinguished in foreclosure unless the Agency is able to apply its own funds or State appropriations to cure the default.
34
The collection of mortgage loans made to hospitals and nursing homes is dependent on the ability of each hospital and nursing home to generate sufficient funds to service its debt, which in turn, is predicated on its ability to obtain Medicare, Medicaid, Blue Cross or managed care reimbursement rate increases to offset increasing operating costs. Federal and State agencies have certain limitations on such reimbursement rates. SUBSIDY LOANS Subsidy loans are made in the form of subordinate mortgage loans and are recorded as mortgage loans receivable. These are not secured by credit enhancement and their terms require scheduled payments which are deferred until other obligations are satisfied. Therefore, an allowance is established for the full amount of each of these loans. Subsidy loans are outstanding in the amount of $171.00 million as of October 31, 2011 and $151.07 million as of October 31, 2010. ALLOWANCES FOR POTENTIAL LOAN LOSSES The allowances for potential loan losses at October 31, 2011 and October 31, 2010 are as follows:
NOTE 4 – DEPOSITS AND INVESTMENTS
At October 31, 2011, the Agency’s cash held by institutions, either with the New York State Department of Taxation and Finance or in depository institutions, was fully collateralized by securities held with a trustee in the Agency’s name and amounted to $96,632,000 ($57,726,000 at October 31, 2010). Uncollateralized and uninsured cash held by paying agents and depositories amounted to $4,573,000 ($4,563,000 at October 31, 2010). CREDIT RISK Investment guidelines and policies are designed to protect principal by limiting credit risk. Therefore, the Agency has a formal investment policy which governs the investment of all Agency monies. A summary of investment policies and procedures is as follows: Investments All bond proceeds and revenues can only be invested in Securities [defined as (i) obligations the principal of and interest on which are guaranteed by the United States of America; (ii) obligations of the United States of America; (iii) obligations the principal of and interest on which are guaranteed by the state; (iv) obligations of the State; (v) obligations of any agency of the United States of America; (vi) obligations of any agency of the State; and (vii) obligations the principal of and interest on which are guaranteed by an agency of instrumentality of the United States of America; provided, however, that notwithstanding anything to the contrary herein, the Agency shall not be authorized to invest in Securities set forth in clauses (v) and (vi) hereof, unless specifically authorized under authority of Section 98 of the State Finance Law]; Collateralized Investment Agreements; Repurchase Agreements; and obligations which the Comptroller is authorized to invest in under Section 98 of the State Finance Law. Securities are only purchased from Primary Dealers, and Securities are delivered to the applicable Custodian/Trustee who records the interest of the Agency. Collateralized Investment Agreements may only be entered into with
2011 2010 Housing Project Mortgage Revenue Program $ 2,506,000 $ 2,506,000 Nursing Home and Health Care Program 3,307,000 3,363,000 Mortgage Not Pledged to Bond Resolution 5,680,000 5,760,000 Community Related and Other 6,604,000 6,604,000
35

institutions rated at least within the second highest rating category without regard to gradations within such category by Moody’s Investors Service or Standard & Poor’s. Collateralized Investment Agreements are collateralized at a minimum of 103% of the principal amount of the agreement and marked to market weekly. Short‐term repurchase agreements may only be entered into with primary dealers with whom the Agency has executed a Security Industry Financial Market Association (SIFMA) repurchase agreement, and are collateralized at a minimum of 100% of principal. The collateral consists of United States government obligations, other securities the principal of and interest on which are guaranteed by the United States, Government National Mortgage Association obligations and obligations of agencies and instrumentalities of the Congress of the United States. The collateral shall be delivered to the Trustee/Custodian and held for the benefit of the Agency. Agency funds are invested in accordance with the investment guidelines approved annually by the Agency’s board, which are in compliance with the New York State Comptroller’s Investment Guidelines. All of the above investments that are securities are in registered form, and are held by agents of the Agency or by the trustee under the applicable bond resolution, in the Agency’s name. The agents or their custodians take possession of the securities. As of October 31, 2011, 6.8% of the Agency’s investments were in short‐term Repurchase Agreements with Cantor Fitzgerald & Co. The Repurchase Agreements matured on November 1, 2011, and were used to pay debt service and project construction requisitions. As of October 31, 2010, 12% of the Agency’s investments were in short‐term Repurchase Agreements with Citigroup Global Markets Inc. The Repurchase Agreements matured on November 1, 2010, and were used to pay debt service and project construction requisitions. Diversification Standards The Agency’s investments, other than Securities, shall be diversified among Banks but not more than 35% of the Agency’s total invested funds may be invested with any single such institution, and investments with any single institution shall not exceed 20% of that institution’s capital. These standards may be waived by the Agency’s Chairman or the President and Chief Executive Officer. During the fiscal years ended October 31, 2011 and October 31, 2010, such standards have not been waived.
institutions rated at least within the second highest rating category without regard to gradations within such category by Moody’s Investors Service or Standard & Poor’s. Collateralized Investment Agreements are collateralized at a minimum of 103% of the principal amount of the agreement and marked to market weekly. Short‐term repurchase agreements may only be entered into with primary dealers with whom the Agency has executed a Security Industry Financial Market Association (SIFMA) repurchase agreement, and are collateralized at a minimum of 100% of principal. The collateral consists of United States government obligations, other securities the principal of and interest on which are guaranteed by the United States, Government National Mortgage Association obligations and obligations of agencies and instrumentalities of the Congress of the United States. The collateral shall be delivered to the Trustee/Custodian and held for the benefit of the Agency. Agency funds are invested in accordance with the investment guidelines approved annually by the Agency’s board, which are in compliance with the New York State Comptroller’s Investment Guidelines. All of the above investments that are securities are in registered form, and are held by agents of the Agency or by the trustee under the applicable bond resolution, in the Agency’s name. The agents or their custodians take possession of the securities. As of October 31, 2011, 6.8% of the Agency’s investments were in short‐term Repurchase Agreements with Cantor Fitzgerald & Co. The Repurchase Agreements matured on November 1, 2011, and were used to pay debt service and project construction requisitions. As of October 31, 2010, 12% of the Agency’s investments were in short‐term Repurchase Agreements with Citigroup Global Markets Inc. The Repurchase Agreements matured on November 1, 2010, and were used to pay debt service and project construction requisitions. Diversification Standards The Agency’s investments, other than Securities, shall be diversified among Banks but not more than 35% of the Agency’s total invested funds may be invested with any single such institution, and investments with any single institution shall not exceed 20% of that institution’s capital. These standards may be waived by the Agency’s Chairman or the President and Chief Executive Officer. During the fiscal years ended October 31, 2011 and October 31, 2010, such standards have not been waived.
36

2011 2010
Investment TypeCollateralized Investment Agreements $ 44,116 $ 44,043Repurchase Agreements 99,851 172,933U.S. Treasury Obligations 1,307,410 1,236,109Other 7,008 8,845Total $ 1,458,385 $ 1,461,930(See Note 5 for investment detail by maturity)
(in thousands)
Interest Rate Risk Interest rate risk is minimal due to the short term duration of the Agency’s investments in the other than collateralized investment agreements category. Rates on collateralized investments are linked to interest rates on applicable bonds so that interest rate risk is minimal. Securities purchased from revenues are invested in U.S. Treasury Obligations with maturities as close as practicable to the next debt service payment date or date of usage, typically six months and under. The fair value of investments excluding accrued interest of October 31, 2011 and October 31, 2010 is as follows:
37

NOTE 5MATURITY OF INVESTMENTS
Investment Maturities (In Years)
Fair Less MoreValue than 1 1 to 5 6 to 10 than 10
Restricted Funds:
Investment TypeCollateralized Investment Agreements $ 44,116 $ — $ 6,166 $ 37,950 $ — Repurchase Agreements 99,851 99,851 — — — U.S. Treasury Bills 859,492 859,492 — — — U.S. Treasury Bonds 6,617 1,962 633 1,479 2,543 U.S. Treasury Notes 107,958 107,958 — — — U.S. Treasury Strips 43,359 43,198 59 79 23 Government Agencies 6,993 3,857 2,101 — 1,035
1,168,386 1,116,318 8,959 39,508 3,601
Unrestricted:
Investment Type
(in thousands)
As of October 31, 2011, the Agency had the following investments and maturities in three categories: Restricted Funds, Unrestricted Funds and Escrow Funds. Values below are at Fair Value excluding accrued interest as of October 31, 2011:
Investment TypeU.S. Treasury Bills 38,137 38,137 — — — U.S. Treasury Bonds 357 95 — 262 — U.S. Treasury Notes 44,113 1,603 42,510 — — U.S. Treasury Strips 53,351 53,349 — — 2
135,958 93,184 42,510 262 2
Escrow Funds:
Investment TypeU.S. Treasury Bills 154,026 154,026 — — — Government Agencies 15 15 — — —
154,041 154,041 — — —
Grand Total:
Investment TypeCollateralized Investment Agreements 44,116 — 6,166 37,950 — Repurchase Agreements 99,851 99,851 — — — U.S. Treasury Bills 1,051,655 1,051,655 — — — U.S. Treasury Bonds 6,974 2,057 633 1,741 2,543 U.S. Treasury Notes 152,071 109,561 42,510 — — U.S. Treasury Strips 96,710 96,547 59 79 25 Government Agencies 7,008 3,872 2,101 — 1,035
$ 1,458,385 $ 1,363,543 $ 51,469 $ 39,770 $ 3,603
As of October 31, 2011, the Agency had the following investments and maturities in three categories: Restricted Funds, Unrestricted Funds and Escrow Funds. Values below are at Fair Value excluding accrued interest as of October 31, 2011:
38

NOTE 6 – BOND INDEBTEDNESS
The Agency has obtained construction and/or long‐term financing for all applicable projects within all programs. The issuance of debt for the financing of projects by the Agency is subject to the approval of the New York State Public Authorities Control Board. Bonds are issued under various bond resolutions adopted by the Agency to permanently finance and/or provide financing during the construction period for qualified projects. Substantially all of the assets of each bond program of the Agency are pledged as collateral for the payment of principal and interest on bond indebtedness only of that program. The obligations of the Agency are not obligations of the State, and the State is not liable for such obligations. The ability of the Agency to meet the debt service requirements on the bonds issued to finance mortgage loans is dependent upon the ability of the mortgagors in such programs to generate sufficient funds to meet their respective mortgage payments as well as to meet the operating and maintenance costs of the applicable projects. Included in the bond indebtedness of the Secured Loan Rental Housing Bond Program, the Service Contract Revenue Bonds Program, and the State Personal Income Tax Revenue Bond Program are variable debt as of October 31, 2011 and 2010. The balance of the variable rate bonds outstanding are as follows: Secured Loan Rental Housing ‐ $7.9 billion and $7.5 billion at October 31, 2011 and 2010, respectively; Service Contract Revenue ‐ $248.7 million and $261.2 million at October 31, 2011 and 2010, respectively; State Personal Income Tax Revenue ‐ $80 million at October 31, 2011 and 2010. The variable rate demand bonds are subject to purchase on the demand of the holder, at a price equal to par plus accrued interest, on seven days notice and delivery of the bonds to the respective tender agents. For each variable rate financing, there is a remarketing agent which is authorized to use its best effort to sell the repurchased bonds at par and a liquidity provider in the form of an irrevocable letter of credit or credit instrument, issued by a major bank, or government sponsored entity, on behalf of the project being financed. The tender agent/trustee is entitled to draw on the liquidity facility in an amount sufficient to pay the par value of and accrued interest on bonds delivered to it in the event bonds are not remarketed to, or monies are not received from, a new bondholder in a timely manner. The Agency classifies such bonds with a maturity in excess of one year as long term debt in accordance with GASB Interpretation No. 1, Demand Bonds Issued by State and Local Governments. For certain variable rate bonds, Fannie Mae and Freddie Mac credit enhancements have been substituted for letters of credit. Defeasances were accomplished by placing in irrevocable trustee escrow accounts, cash and amounts invested in U.S. Treasury obligations that will generate funds sufficient to meet future payments of all interest, principal and call premiums, if applicable, on the defeased bonds. Accordingly, the defeased bonds and related assets placed in the irrevocable escrow accounts are not included in the Agency’s financial statements since the Agency has legally satisfied its obligations with respect thereto, in accordance with GASB Statement No. 23.
39

Fiscal Year
Projects or Bond Issues Defeased Defeased
2011 2010
St. Camillus Nursing Home ‐ 1970 Series A and 1974 Series A 1982 $80 $255 North Shore University Hospital ‐ 1970 Series A, 1974 Series A 1977 Series A 1983 9,639 10,949Wesley Nursing Home ‐ 1971 Series A and 1977 Series A 1984 977 1,267Crouse Irving Memorial Hospital ‐ 1972 Series A and 1977 Series A 1985 6,065 6,930Community Memorial Hospital ‐ 1971 Series A and 1977 Series A 1985 245 300St. Josephʹs Hospital Health Center ‐ 1972 Series A and 1977 Series A 1986 5,558 6,358Tioga Nursing Home ‐ 1971 Series A and 1977 Series A 1989 270 380Eger Nursing Home ‐ 1972 Series A and 1977 Series A 1989 1,645 2,145State University Construction ‐ various series 1990 31,085 46,735Saint Lukeʹs Nursing Home ‐ 1974 Series A and 1977 Series A 1992 748 888
Principal Amount Remaining of
Obligations Defeased
October 31,
($ in thousands)
Bonded debt previously issued by the Agency for the Non‐Profit Housing, the Housing Project Bonds Programs, and the Hospital and Health Care Project Revenue Bond Program together totaling $23.1 million and $27.4 million in outstanding bonds as of October 31, 2011 and 2010, respectively is classified as “moral obligation” debt. Moral obligation debt is not a debt or a liability of the State. Rather, in the event of a deficiency in the debt service and capital reserve funds established by bond resolutions, the State is obliged to consider, annually, providing funds to restore such reserve funds to the required level. The State is not legally required to provide such funding.
The principal amount outstanding for bond obligations defeased with respect to the Hospital and Nursing Home Program, State University Construction Program, State Personal Income Tax Revenue Bonds (Economic Development and Housing) Program and the Secured Loan Rental Housing Programs were as follows:
Saint Luke s Nursing Home ‐ 1974 Series A and 1977 Series A 1992 748 888Charles T. Sitrin Nursing Home ‐ 1974 Series A 1992 577 707Downtown Nursing Home ‐ 1974 Series A and 1977 Series A 1992 611 726Millard‐Fillmore Hospital ‐ 1972 Series A 1993 5,244 6,459Isabella Nursing Home ‐ 1971 Series A 1994 1,775 2,600St. Johnland Nursing Home ‐ 1974 Series A and 1977 Series A 1994 1,455 1,760Adirondack Tri‐County Nursing Home ‐ 1974 Series A 1994 280 345Brookdale Hospital ‐ 1974 Series A and 1977 Series A 1995 4,825 5,755Consolation Nursing Home ‐ 1974 Series A 1996 1,270 1,565Goodman Gardens Nursing Home ‐ 1974 Series A 1996 805 990St. Johnʹs Nursing Home ‐ 1971 Series A 1996 770 1,140The Martin Luther King Jr. Nursing Home ‐ 1974 Series A 1996 645 805Teresian Nursing Home ‐ 1972 Series A 1997 860 1,090Loretto Rest Nursing Home ‐ 1974 Series A 1997 2,570 3,195State Personal Income Tax Revenue Bonds ‐ 2003 Series A 2005 71,210 71,210State Personal Income Tax Revenue Bonds ‐ 2003 Series A 2006 31,365 31,365State Personal Income Tax Revenue Bonds ‐ various series 2007 19,180 19,180TOTAL $199,754 $225,099
Bonded debt previously issued by the Agency for the Non‐Profit Housing, the Housing Project Bonds Programs, and the Hospital and Health Care Project Revenue Bond Program together totaling $23.1 million and $27.4 million in outstanding bonds as of October 31, 2011 and 2010, respectively is classified as “moral obligation” debt. Moral obligation debt is not a debt or a liability of the State. Rather, in the event of a deficiency in the debt service and capital reserve funds established by bond resolutions, the State is obliged to consider, annually, providing funds to restore such reserve funds to the required level. The State is not legally required to provide such funding.
The principal amount outstanding for bond obligations defeased with respect to the Hospital and Nursing Home Program, State University Construction Program, State Personal Income Tax Revenue Bonds (Economic Development and Housing) Program and the Secured Loan Rental Housing Programs were as follows:
40

NOTE 7SUMMARY OF BOND INDEBTEDNESSFiscal Year Ended October 31, 2011(in thousands)
Mortgage Programs:Non‐Profit Housing Project Bonds‐5.80% to 8.40% $ 186,085 20,305 — 3,595 16,710 2019
Housing Project Bonds‐7.75% to 8% 12,965 6,790 — 545 6,245 2019
Hospital and Health Care Project Revenue Bonds‐ 3.60% to 5.15% 42,090 315 — 145 170 2016
Nursing Home and Health Care Project Revenue Bonds‐3.60% to 5.15% 190,080 41,855 — 15,620 26,235 2016
FHA‐Insured Multi‐Family Mortgage HousingRevenue Bonds‐1% to 8.45% 42,020 29,635 — 4,795 24,840 2043
Multi‐Family FHA‐Insured Mortgage HousingRevenue Bonds‐ 6.79% 2,540 2,355 — 30 2,325 2039
Secured Loan Rental Housing Bonds‐1.10% to 9% 8,835,765 7,740,590 628,380 178,585 8,190,385 2049
OriginalFace
Amount
BalanceOctober 31,
2010 Issued
BalanceOctober 31,
2011
FinalMaturity
Date
Retired/ Principal Payments
Housing Project Mortgage Revenue Bonds‐5.875% to 6.125% 484,540 14,220 — 1,340 12,880 2020
Affordable Housing Revenue Bonds‐0.40% to 6.80% 562,415 433,235 50,915 68,835 415,315 2045
Affordable Housing Revenue Bonds‐(Federal New Issue Bond Program) ‐ (ʺNIBPʺ)2009 Series 12.47% to 3.68% 276,130 276,130 — 465 275,665 2051New Issues:0.50% to 3.80% 108,065 32,135 75,930 310 107,755 2022
Total Mortgage Programs 10,742,695 8,597,565 755,225 274,265 9,078,525
Other Programs:State Revenue Bond Programs ‐ 1.35% to 5.35% 1,586,010 1,124,805 71,165 138,050 1,057,920 2039
Total Other Programs 1,586,010 1,124,805 71,165 138,050 1,057,920
Total Bond Indebtedness 12,328,705 9,722,370 826,390 412,315 10,136,445
Bond Premium — 14,945 5,776 1,674 19,047Bond Discount — (324) — (64) (260)Deferred gain (loss) on bonds defeased — 508 — (144) 652
Total Net Bond Indebtedness $ 12,328,705 9,737,499 832,166 413,781 10,155,884
OriginalFace
Amount
BalanceOctober 31,
2010 Issued
BalanceOctober 31,
2011
FinalMaturity
Date
Retired/ Principal Payments
41

NOTE 7 (continued)SUMMARY OF BOND INDEBTEDNESSFiscal Year Ended October 31, 2010(in thousands)
Mortgage Programs:Non‐Profit Housing Project Bonds‐5.80% to 8.40% $ 186,085 23,960 — 3,655 20,305 2019
Housing Project Bonds‐7.75% to 8% 12,965 7,295 — 505 6,790 2019
Hospital and Health Care Project Revenue Bonds‐ 3.60% to 5.15% 42,090 445 — 130 315 2016
Nursing Home and Health Care Project Revenue Bonds‐3.60% to 5.15% 190,080 52,445 — 10,590 41,855 2016
Insured Multi‐Family Mortgage Housing Revenue Bonds 91,845 3,645 — 3,645 — —
FHA‐Insured Multi‐Family Mortgage HousingRevenue Bonds‐1% to 8.45% 42,020 30,500 — 865 29,635 2043
Multi‐Family FHA‐Insured Mortgage HousingRevenue Bonds‐ 6.79% 2,540 2,375 — 20 2,355 2039
OriginalFace
Amount
Balance October 31,
2009
Issued
Balance October 31,
2010
FinalMaturity
Date
Retired/ Principal Payments
Secured Loan Rental Housing Bonds‐1.10% to 9% 8,484,600 7,502,875 638,340 400,625 7,740,590 2049
Housing Project Mortgage Revenue Bonds‐5.875% to 6.125% 484,540 227,895 — 213,675 14,220 2020
Affordable Housing Revenue Bonds‐0.40% to 6.80% 511,500 360,430 141,195 68,390 433,235 2045
Affordable Housing Revenue Bonds‐(Federal New Issue Bond Program) ‐ (ʺNIBPʺ)0.50% to 3.16% 308,265 — 308,265 — 308,265 2051
Total Mortgage Programs 10,356,530 8,211,865 1,087,800 702,100 8,597,565
Other Programs:State Revenue Bond Programs ‐ 1.35% to 5.35% 1,827,245 1,474,245 — 349,440 1,124,805 2039
Total Other Programs 1,827,245 1,474,245 — 349,440 1,124,805
Total Bond Indebtedness 12,183,775 9,686,110 1,087,800 1,051,540 9,722,370
Bond Premium — 16,623 — 1,678 14,945Bond Discount — (1,087) — (763) (324)Deferred gain (loss) on bonds defeased — (4,137) — (4,645) 508
Total Net Bond Indebtedness $ 12,183,775 9,697,509 1,087,800 1,047,810 9,737,499
OriginalFace
Amount
Balance October 31,
2009
Issued
Balance October 31,
2010
FinalMaturity
Date
Retired/ Principal Payments
42

NOTE 8DEBT SERVICE REQUIREMENTS(in thousands)
Principal:Fiscal Year ending October 31,
2012 $ 3,815 585 150 50,480 1,5952013 4,060 635 10 27,595 25,3252014 4,270 685 10 33,750 47,0702015 2,120 745 — 13,765 34,0502016 540 800 — 7,700 3,215
Five years ending October 31,2021 1,905 2,795 — 33,230 18,0102026 — — — 38,490 19,5752031 — — — 49,220 22,6802036 — — — 64,270 27,0402041 — — — 79,190 32,6302046 — — — 17,625 15,8602051 — — — — — 2056* — — — — 136,370
$ 16,710 6,245 170 415,315 383,420
Interest expense:Fiscal Year ending October 31,
2012 $ 1,005 483 5 16,043 5,4602013 752 435 1 15 476 6 257
Non-Profit Housing Project Bonds
HousingProject Bonds
Hospital and Health Care Project Revenue Bonds
Affordable Housing Revenue Bonds
Affordable Housing Revenue Bonds (NIBP)
2013 752 435 1 15,476 6,2572014 485 384 — 14,829 5,7942015 277 329 — 14,310 5,1472016 183 269 — 13,994 4,503
Five years ending October 31,2021 249 404 — 66,100 20,9192026 — — — 58,538 17,8492031 — — — 48,272 14,6312036 — — — 34,289 10,8262041 — — — 15,746 6,2652046 — — — 1,934 1,6302051 — — — — 8302056* — — — — 83
$ 2,951 2,304 6 299,531 100,194
Total debt service requirements:Fiscal Year ending October 31,
2012 $ 4,820 1,068 155 66,523 7,0552013 4,812 1,070 11 43,071 31,5822014 4,755 1,069 10 48,579 52,8642015 2,397 1,074 — 28,075 39,1972016 723 1,069 — 21,694 7,718
Five years ending October 31,2021 2,154 3,199 — 99,330 38,9292026 — — — 97,028 37,4242031 — — — 97,492 37,3112036 — — — 98,559 37,8662041 — — — 94,936 38,8952046 — — — 19,559 17,4902051 — — — — 8302056* — — — — 136,453
$ 19,661 8,549 176 714,846 483,614
*Final maturity date
Non-Profit Housing Project Bonds
HousingProject Bonds
Hospital and Health Care Project Revenue Bonds
Affordable Housing Revenue Bonds
Affordable Housing Revenue Bonds (NIBP)
43

Total
7,565 925 10,810 1,445 74,000 151,3706,645 970 11,310 1,560 80,560 158,6704,915 985 11,695 1,590 83,055 188,0253,375 870 97,850 1,785 62,650 217,2101,990 920 12,955 1,435 57,665 87,220
1,745 3,735 46,915 5,065 254,340 367,740— 4,855 97,525 — 123,990 284,435— 5,200 809,450 — 157,525 1,044,075— 5,345 1,934,170 — 134,890 2,165,715— 2,680 2,442,550 — 29,245 2,586,295— 680 2,699,880 — — 2,734,045— — 15,275 — — 15,275— — — — — 136,370
26,235 27,165 8,190,385 12,880 1,057,920 10,136,445
1,147 1,585 968,739 760 67,580 1,062,807789 1 539 978 783 669 64 142 1 068 843
Nursing Home And Health Care Project Revenue Bonds
Federally Insured Mortgage Revenue Bonds
Secured Loan Rental Housing Bonds*
Housing Project Mortgage Revenue Bonds
SCOR/ State Revenue/ Personal Income/Bond Programs**
789 1,539 978,783 669 64,142 1,068,843493 1,491 978,196 572 59,164 1,061,408279 1,440 977,574 473 54,761 1,054,590141 1,390 965,784 377 50,415 1,037,056
45 6,217 4,820,181 577 185,155 5,099,847— 4,924 4,796,029 — 122,554 4,999,894— 3,309 4,656,625 — 76,833 4,799,670— 1,781 3,787,488 — 24,624 3,859,008— 506 2,198,727 — 1,773 2,223,017— 40 499,451 — — 503,055— — 4,524 — — 5,354— — — — — 83
2,894 24,222 25,632,101 3,428 707,001 26,774,632
8,712 2,510 979,549 2,205 141,580 1,214,1777,434 2,509 990,093 2,229 144,702 1,227,5135,408 2,476 989,891 2,162 142,219 1,249,4333,654 2,310 1,075,424 2,258 117,411 1,271,8002,131 2,310 978,739 1,812 108,080 1,124,276
1,790 9,952 4,867,096 5,642 439,495 5,467,587— 9,779 4,893,554 — 246,544 5,284,329— 8,509 5,466,075 — 234,358 5,843,745— 7,126 5,721,658 — 159,514 6,024,723— 3,186 4,641,277 — 31,018 4,809,312— 720 3,199,331 — — 3,237,100— — 19,799 — — 20,629— — — — — 136,453
29,129 51,387 33,822,486 16,308 1,764,921 36,911,077
**Interest rate on variable rate demand bonds in these programs are set by the Remarking Agent and the Broker Dealer. The maximum interest rate as defined in respective bond resolutions cannot exceed 15%.
Nursing Home And Health Care Project Revenue Bonds
Federally Insured Mortgage Revenue Bonds
Secured Loan Rental Housing Bonds*
Housing Project Mortgage Revenue Bonds
SCOR/ State Revenue/ Personal Income/Bond Programs**
44

Reserve FundsRequirement On Deposit Excess
Mortgage ProgramsCapital Reserve Fund ‐ Hospital and Health Care Project Revenue Bonds $ 26 $ 4,592 $ 4,566Debt Service Reserve Fund ‐ Non‐Profit Housing Program 4,820 19,398 14,578 Housing Project Mortgage Revenue Bond Program 14,650 15,157 507 Housing Project Bond Program 1,085 1,087 2 Multi ‐ Family FHA ‐ Insured Mortgage Revenue Bond Program 190 192 2 FHA‐Insured Multi‐Family Housing Revenue Bond Program 1,205 1,223 18 Secured Loan Rental Housing Program 14,172 14,303 131 Nursing Home and Health Care Project Revenue Bonds 3,935 29,054 25,119 Affordable Housing Revenue Bond Program 4,335 4,338 3 Affordable Housing Revenue Bond Program ‐ NIBP 1,395 1,396 1TOTALS 2011 $ 45,813 $ 90,740 $ 44,927TOTALS 2010 $ 47 810 $ 91 561 $ 43 751
(in thousands)
NOTE 9 – RESERVE FUND REQUIREMENTS At October 31, 2011 and 2010, cash and investments include capital and debt service reserve funds. Reserve requirements, are valued in accordance with the respective bond resolutions, are as follows:
In addition, as of both October 31, 2011 and 2010, included in the FHA‐Insured Multi‐Family Housing Revenue Bond Program, the Agency has funded the amount of approximately $1.1 million in a dedicated Risk Sharing account. This deposit is required by agreement with HUD.
TOTALS 2010 $ 47,810 $ 91,561 $ 43,751
NOTE 9 – RESERVE FUND REQUIREMENTS At October 31, 2011 and 2010, cash and investments include capital and debt service reserve funds. Reserve requirements, are valued in accordance with the respective bond resolutions, are as follows:
In addition, as of both October 31, 2011 and 2010, included in the FHA‐Insured Multi‐Family Housing Revenue Bond Program, the Agency has funded the amount of approximately $1.1 million in a dedicated Risk Sharing account. This deposit is required by agreement with HUD.
45

NOTE 10 ‐ INTEREST RATE EXCHANGE AGREEMENTS (SWAPS)
October 31, 2011
The Agency has entered into three negotiated swaps as part of its risk management program, serving to increase financial flexibility and reduce interest costs. These swaps were entered into with two financial institutions, J.P. Morgan Chase and Bear Stearns, now one entity – J.P. Morgan Chase (the Counterparty) for a total notional principal of $257,500,000. Together the maturity and amortization of these swaps correspond to the maturity and amortization of the underlying Service Contract Revenue Refunding Bonds (SCR) 2003 Series L and M and the State Personal Income Tax Revenue Bonds (Economic Development and Housing) (PIT) 2005 Series C. The fair value balances and notional amounts of derivative instruments outstanding at October 31, 2011, classified by type, and the changes in fair value of such derivative instruments are as follows:
Changes in fair value Fair value at October 31, 2011 Classification Amount Classification Amount Notional Cash flow hedge Deferred outflow ($3,732,095) Debt ($43,932,905) $257,500,000
The fair values of the interest rate swaps were estimated using the zero‐coupon method. This method calculates the future net settlement payments required by the swap, assuming that the current forward rates implied by the LIBOR swap curve correctly anticipate future spot LIBOR interest rates. These payments are then discounted using the spot rates implied by the current LIBOR swap curve for hypothetical zero‐coupon bonds due on the date of each future net settlement on the swaps. OBJECTIVE AND TERMS OF HEDGING DERIVATIVE INSTRUMENTS The following table displays the objective and terms of the Agency’s hedging derivative instruments outstanding at October 31, 2010, along with the credit rating of the associated counterparty:
Terms
Type Objective Notional Amount
Effective Date
Maturity Date
Fixed rate paid Fair value
Counterparty:J.P.Morgan Credit Rating
Synthetic fixed rate swap
Hedge of changes in cash flows of SCR 2003 Series L (1) and M (2) bonds and PIT 2005 Series C (3) bonds.*
(1)$88,750,000(2)$88,750,000 (3)$80,000,000
8/13/20038/13/2003 3/20/2005
9/15/20219/15/2021 3/15/2033
3.656%3.660% 3.336%
($18,091,210) ($12,931,791) ($12,909,904)
Moody’s: Aa1S&P: AA‐ Fitch: AA‐
*The variable rate payment received is 65% of one month LIBOR received on all hedges. CREDIT RISK: The Agency is exposed to credit risk on hedging derivative instruments that are in asset positions. To minimize its exposure to loss related to credit risk, it is the Agency’s policy to require counterparty collateral posting provisions in its non‐exchange‐traded hedging derivative instruments. These terms require full collateralization of the fair value of hedging derivative instruments in asset positions (net of the effect of applicable netting arrangements) should the counterparty’s credit rating not be within the two highest investment grade categories by at least one nationally recognized statistical rating agency or the rating by any nationally recognized statistical rating agency fall below the three highest investment grade rating categories. The Agency has never been required to access collateral. It is the Agency’s policy to enter into netting arrangements whenever it has entered into more than one derivative instrument transaction with a counterparty. Under the terms of these arrangements, should one party become insolvent or otherwise default on its obligations, close‐out netting provisions permit the non‐defaulting party to accelerate and terminate all outstanding transactions and net the transactions’ fair values so that a single sum will be owed by, or owed to, the non‐defaulting party. INTEREST RATE RISK: The Agency is exposed to interest rate risk on its interest rate swaps. On its pay‐fixed, receive‐variable interest rate swap, as LIBOR decreases, the Agency’s net payment on the swap increases. BASIS RISK: The Agency is exposed to basis risk on its pay‐fixed interest rate swap hedging derivative instruments because the variable‐rate payments received by the Agency on these hedging derivative instruments are based on a rate other than interest rates the Agency pays on its hedged variable‐rate debt, which is remarketed every 30 days. As of October 31, 2011, the weighted‐average interest rate on the Agency’s hedged variable‐rate debt is 0.1597 percent, while the applicable 65% percent of LIBOR rate is 0.12171 percent.
TERMINATION RISK: The Agency or its counterparty may terminate a derivative instrument if the other party fails to perform under the terms of the contract. If at the time of termination, a hedging derivative instrument is in a liability position, the Agency would be liable to the counterparty for a payment equal to the liability, subject to netting arrangements. ROLLOVER RISK: The Agency is exposed to rollover risk on hedging derivative instruments should a termination event occur prior to the maturity of the hedged debt.
46

Year Ended Fixed InterestOctober 31, Principal Interest Rate Swaps, net Total
2012 $ — $ 411 $ 8,754 $ 9,1652013 19,600 403 8,584 28,5872014 20,350 370 7,891 28,6112015 11,200 344 7,348 18,8922016 22,200 316 6,771 29,2872017‐2021 106,750 985 21,518 129,2532022‐2026 18,700 512 11,613 30,8252027‐2031 44,000 277 6,285 50,5622032‐2036 14,700 21 470 15,191TOTAL $ 257,500 $ 3,639 $ 79,234 $ 340,373
(in thousands)
NOTE 10 ‐ INTEREST RATE EXCHANGE AGREEMENTS (SWAPS) (continued) The table that follows represents debt service payments relating to the Agency’s hedged derivative instrument payments and debt. As of October 31, 2011, the debt service requirements of the Agency’s hedged variable rate debt and net receipts or payments on associated derivative instruments for the period hedged are as follows. These amountsassume that current interest rates on variable‐rate bonds and the current reference rates of hedging derivative instruments will remain the same for the term of the respective swaps. As these rates vary, interest payments onvariable‐rate bonds and net receipts or payments on the hedging derivative instruments will vary. Refer to Note 10 forinformation on derivative instruments.
NOTE 10 ‐ INTEREST RATE EXCHANGE AGREEMENTS (SWAPS) (continued) The table that follows represents debt service payments relating to the Agency’s hedged derivative instrument payments and debt. As of October 31, 2011, the debt service requirements of the Agency’s hedged variable rate debt and net receipts or payments on associated derivative instruments for the period hedged are as follows. These amountsassume that current interest rates on variable‐rate bonds and the current reference rates of hedging derivative instruments will remain the same for the term of the respective swaps. As these rates vary, interest payments onvariable‐rate bonds and net receipts or payments on the hedging derivative instruments will vary. Refer to Note 10 forinformation on derivative instruments.
47

NOTE 11 – RETIREMENT BENEFITS STATE EMPLOYEES’ RETIREMENT SYSTEM The Agency participates in the New York State and Local Employees’ Retirement System (the “System”) which is a cost sharing multiple employer public employee retirement system offering a wide range of plans and benefits which are related to years of service and final average salary, and provide for death and disability benefits and for optional methods of benefit payments. All benefits vest after five years of credited service. Obligations of participating employers and employees to contribute, and benefits payable to employees, are governed by the System and social security laws. The laws provide that all participating employers in the System are jointly and severally liable for any actuarial unfunded amounts. The Agency is billed annually for contributions. The financial report of the System can be obtained from: Office of the State Comptroller New York State and Local Retirement System 110 State Street Albany, NY 12244 Generally, all employees, except certain part‐time and temporary employees, participate in the System. The System is contributory for the first ten years for employees who joined after July, 1976 at the rate of 3% of their salary. Employee contributions are deducted from employees’ compensation for remittance to the System. The covered payroll for the fiscal years ended October 31, 2011, 2010 and 2009 was $3.4 million, $3.8 million and $3.9 million, respectively. Based upon the actuarially determined contribution requirements, the Agency contributed 100% of its required portion in the amounts of $975 thousand in fiscal 2011 and $577 thousand in fiscal 2010. Agency employees were required to contribute .024% of the current year’s covered payroll ($831 in fiscal 2011 and $4,325 in fiscal 2010). Changes in benefit provisions and actuarial assumptions did not have a material effect on contributions during fiscal 2011 and 2010. DEFERRED COMPENSATION Some employees of the Agency have elected to participate in the State’s deferred compensation plan in accordance with Internal Revenue Code Section 457. Agency employees contributed $308,133 during fiscal 2011 ($363,308 in fiscal 2010). OTHER POSTEMPLOYMENT BENEFITS The Agency is a participating employer in the New York State Health Insurance Program (“NYSHIP”), which is administered by the State of New York as a multiple employer agent defined benefit plan. Under the plan as participated in by the Agency, eligible retired employees receive heath care benefits with employees paying 25% of dependent coverage costs and 10% of individual employee costs. The Agency’s plan complies with the NYSHIP benefit provisions. In addition, as provided for in Civil Service Law Section 167, the Agency applies the value of accrued sick leave of employees who retire out of service to the retireeʹs share of costs for health benefits. In June, 2004 GASB issued Statement No. 45, Accounting and Financial Reporting by Employers for Postemployment Benefits Other Than Pensions (“GASB No. 45”), which established accounting standards for recording Other
NOTE 11 – RETIREMENT BENEFITS STATE EMPLOYEES’ RETIREMENT SYSTEM The Agency participates in the New York State and Local Employees’ Retirement System (the “System”) which is a cost sharing multiple employer public employee retirement system offering a wide range of plans and benefits which are related to years of service and final average salary, and provide for death and disability benefits and for optional methods of benefit payments. All benefits vest after five years of credited service. Obligations of participating employers and employees to contribute, and benefits payable to employees, are governed by the System and social security laws. The laws provide that all participating employers in the System are jointly and severally liable for any actuarial unfunded amounts. The Agency is billed annually for contributions. The financial report of the System can be obtained from: Office of the State Comptroller New York State and Local Retirement System 110 State Street Albany, NY 12244 Generally, all employees, except certain part‐time and temporary employees, participate in the System. The System is contributory for the first ten years for employees who joined after July, 1976 at the rate of 3% of their salary. Employee contributions are deducted from employees’ compensation for remittance to the System. The covered payroll for the fiscal years ended October 31, 2011, 2010 and 2009 was $3.4 million, $3.8 million and $3.9 million, respectively. Based upon the actuarially determined contribution requirements, the Agency contributed 100% of its required portion in the amounts of $975 thousand in fiscal 2011 and $577 thousand in fiscal 2010. Agency employees were required to contribute .024% of the current year’s covered payroll ($831 in fiscal 2011 and $4,325 in fiscal 2010). Changes in benefit provisions and actuarial assumptions did not have a material effect on contributions during fiscal 2011 and 2010. DEFERRED COMPENSATION Some employees of the Agency have elected to participate in the State’s deferred compensation plan in accordance with Internal Revenue Code Section 457. Agency employees contributed $308,133 during fiscal 2011 ($363,308 in fiscal 2010). OTHER POSTEMPLOYMENT BENEFITS The Agency is a participating employer in the New York State Health Insurance Program (“NYSHIP”), which is administered by the State of New York as a multiple employer agent defined benefit plan. Under the plan as participated in by the Agency, eligible retired employees receive heath care benefits with employees paying 25% of dependent coverage costs and 10% of individual employee costs. The Agency’s plan complies with the NYSHIP benefit provisions. In addition, as provided for in Civil Service Law Section 167, the Agency applies the value of accrued sick leave of employees who retire out of service to the retireeʹs share of costs for health benefits. In June, 2004 GASB issued Statement No. 45, Accounting and Financial Reporting by Employers for Postemployment Benefits Other Than Pensions (“GASB No. 45”), which established accounting standards for recording Other
48

Postemployment Benefits (“OPEB”). The requirement applies to any state or local government employer that provides OPEB. The primary type of OPEB provided by the Agency is health benefits. The Agency provides certain group health care, death benefits and reimbursement of Medicare Part B premium for retirees (and for eligible dependents and survivors of retirees). Contributions towards part of the costs of these benefits are required of the retirees. Retiree contributions towards the cost of the benefit are calculated depending on a number of factors, including hire date, years of service, and/or retirement date. An actuarially determined valuation of these benefits was performed by a consultant to calculate the impact of GASB accounting rules applicable to the retiree medical benefits for retired employees and their eligible dependents. GASB Statement No. 45 requires the valuation must be performed at least biennially. The most recent biennial valuation was performed with a valuation date of November 1, 2009 and was used as the basis for the determination of costs for the years ended October 31, 2011 and 2010. This valuation did not take into consideration the new Affordable Care Act that was signed into law March 23, 2010, the impact of which was not determinable. The total number of plan participants receiving OPEB from the Agency as of October 31, 2010 was 83. The Agency elected to record the entire amount of the Unfunded Actuarial Accrued Liability (“UAAL”) in the fiscal year ended October 31, 2006. The Agency also elected not to fund the UAAL more rapidly than on a pay‐as‐you‐go basis. The UAAL relating to postemployment benefits is in the approximate amounts of $32.779 million and $31.141 million as of October 31, 2011 and 2010, respectively. The Agency is not required by law or contractual agreement to provide funding for other postemployment benefits other than the pay‐as‐you‐go amount necessary to provide current benefits to retirees and eligible beneficiaries/dependents. During the fiscal year ended October 31, 2011, the Agency paid $717,000 ($575,000 in fiscal 2010). Annual OPEB Cost and Net OPEB Obligation: The Agency’s annual OPEB cost (expense) is calculated based on the annual required contribution of the employer (“ARC”), an amount that was actuarially determined by using the Projected Unit Credit Method (one of the actuarial cost methods in accordance with the parameters of GASB Statement No. 45). The Agency is billed by NYSHIP for health care costs and also the health care costs relating to AHC. As a result, the Agencyʹs actuarial valuation includes AHCʹs obligation for these benefits. Also the Agencyʹs annual OPEB cost and Net OPEB obligation includes the portion relating to AHC. The service agreement between the Agency and AHC provides for an allocation of these costs to AHC, representing its share of the billed amount. Since the Agency is a participating employer in NYSHIP, the Agency does not issue a separate stand‐alone financial report regarding postemployment retirement benefits. The NYSHIP financial report can be obtained from: NYS Department of Civil Service Employee Benefits Division Alfred E. Smith Office Building Albany, NY 12239 The portion of the Actuarial Present Value allocated to a valuation year is called the Normal Cost. Calculations are based on the types of benefits provided under the terms of the substantive plan at the time of each valuation and on
Postemployment Benefits (“OPEB”). The requirement applies to any state or local government employer that provides OPEB. The primary type of OPEB provided by the Agency is health benefits. The Agency provides certain group health care, death benefits and reimbursement of Medicare Part B premium for retirees (and for eligible dependents and survivors of retirees). Contributions towards part of the costs of these benefits are required of the retirees. Retiree contributions towards the cost of the benefit are calculated depending on a number of factors, including hire date, years of service, and/or retirement date. An actuarially determined valuation of these benefits was performed by a consultant to calculate the impact of GASB accounting rules applicable to the retiree medical benefits for retired employees and their eligible dependents. GASB Statement No. 45 requires the valuation must be performed at least biennially. The most recent biennial valuation was performed with a valuation date of November 1, 2009 and was used as the basis for the determination of costs for the years ended October 31, 2011 and 2010. This valuation did not take into consideration the new Affordable Care Act that was signed into law March 23, 2010, the impact of which was not determinable. The total number of plan participants receiving OPEB from the Agency as of October 31, 2010 was 83. The Agency elected to record the entire amount of the Unfunded Actuarial Accrued Liability (“UAAL”) in the fiscal year ended October 31, 2006. The Agency also elected not to fund the UAAL more rapidly than on a pay‐as‐you‐go basis. The UAAL relating to postemployment benefits is in the approximate amounts of $32.779 million and $31.141 million as of October 31, 2011 and 2010, respectively. The Agency is not required by law or contractual agreement to provide funding for other postemployment benefits other than the pay‐as‐you‐go amount necessary to provide current benefits to retirees and eligible beneficiaries/dependents. During the fiscal year ended October 31, 2011, the Agency paid $717,000 ($575,000 in fiscal 2010). Annual OPEB Cost and Net OPEB Obligation: The Agency’s annual OPEB cost (expense) is calculated based on the annual required contribution of the employer (“ARC”), an amount that was actuarially determined by using the Projected Unit Credit Method (one of the actuarial cost methods in accordance with the parameters of GASB Statement No. 45). The Agency is billed by NYSHIP for health care costs and also the health care costs relating to AHC. As a result, the Agencyʹs actuarial valuation includes AHCʹs obligation for these benefits. Also the Agencyʹs annual OPEB cost and Net OPEB obligation includes the portion relating to AHC. The service agreement between the Agency and AHC provides for an allocation of these costs to AHC, representing its share of the billed amount. Since the Agency is a participating employer in NYSHIP, the Agency does not issue a separate stand‐alone financial report regarding postemployment retirement benefits. The NYSHIP financial report can be obtained from: NYS Department of Civil Service Employee Benefits Division Alfred E. Smith Office Building Albany, NY 12239 The portion of the Actuarial Present Value allocated to a valuation year is called the Normal Cost. Calculations are based on the types of benefits provided under the terms of the substantive plan at the time of each valuation and on
49

Fiscal Annual Percentage of NetYear OPEB Annual OPEB OPEBEnded Cost Cost Paid Obligation
Actuarial Methods and Assumptions: Actuarial valuations involve estimates of the value of reported amounts and assumptions about the probability of events far into the future and the actuarially determined amounts are subject to continual revision as actual results are compared to past expectations and new estimates are made about the future. The OPEB‐specific actuarial assumptions used in the Agency’s November 1, 2009 OPEB actuarial valuations were the projected unit credit method as its actuarial cost method, a 4.00% per annum discount rate and that retiree contributions are assumed to increase at the same rates as incurred claims. The valuation dated as of November 1, 2007 used a per annum discount rate of 4.25%. The premium rate is used for all non‐Medicare eligible retirees and dependents with basic medical coverage.
the pattern of sharing of costs between the employer and plan members to that point. Calculations reflect a long‐term perspective. The Agency uses a level dollar amount and an amortization period of ten years on an open basis. The following table shows the elements of the Agency’s annual OPEB cost for the year, the amount actually paid, and changes in the Agency’s net OPEB obligation to the plan for the years ended October 31, 2011 and 2010:
2011 2010 (in thousands)
Annual required contribution (ARC) $ 4,948 $ 4,517 Interest on net OPEB obligation 1,246 1,260 Adjustment to ARC (3,839) (3,700) Annual OPEB cost 2,355 2,077 Payments made (717) (575) Increase in net OPEB obligation 1,638 1,502 Net OPEB obligation—beginning of year 31,141 29,639 Net OPEB obligation—end of year $ 32,779 $ 31,141
The Agency’s annual OPEB cost, the percentage of annual OPEB cost contributed to the plan, and the net OPEB obligation for the fiscal years ended October 31, 2011, October 31, 2010 and October 31, 2009 are as follow:
Ended Cost Cost Paid Obligation ($ in thousands)
10/31/2011 $2,355 30.50% $32,77910/31/2010 $2,077 27.70% $31,14110/31/2009 $1,539 36.70% $29,639
Actuarial Methods and Assumptions: Actuarial valuations involve estimates of the value of reported amounts and assumptions about the probability of events far into the future and the actuarially determined amounts are subject to continual revision as actual results are compared to past expectations and new estimates are made about the future. The OPEB‐specific actuarial assumptions used in the Agency’s November 1, 2009 OPEB actuarial valuations were the projected unit credit method as its actuarial cost method, a 4.00% per annum discount rate and that retiree contributions are assumed to increase at the same rates as incurred claims. The valuation dated as of November 1, 2007 used a per annum discount rate of 4.25%. The premium rate is used for all non‐Medicare eligible retirees and dependents with basic medical coverage.
the pattern of sharing of costs between the employer and plan members to that point. Calculations reflect a long‐term perspective. The Agency uses a level dollar amount and an amortization period of ten years on an open basis. The following table shows the elements of the Agency’s annual OPEB cost for the year, the amount actually paid, and changes in the Agency’s net OPEB obligation to the plan for the years ended October 31, 2011 and 2010:
2011 2010 (in thousands)
Annual required contribution (ARC) $ 4,948 $ 4,517 Interest on net OPEB obligation 1,246 1,260 Adjustment to ARC (3,839) (3,700) Annual OPEB cost 2,355 2,077 Payments made (717) (575) Increase in net OPEB obligation 1,638 1,502 Net OPEB obligation—beginning of year 31,141 29,639 Net OPEB obligation—end of year $ 32,779 $ 31,141
The Agency’s annual OPEB cost, the percentage of annual OPEB cost contributed to the plan, and the net OPEB obligation for the fiscal years ended October 31, 2011, October 31, 2010 and October 31, 2009 are as follow:
50

Initial monthly premium rates are shown in the following table:
Monthly Rate for Fiscal Year 2011
Eligible‐Medicare Basic Single $561.83 Family $1,308.84 Medicare (Part B) $96.40 Medicare Part B Premiums: Calendar Year Monthly Premium 2011 & 2010 $96.40 2009 Medicare Part B premiums are assumed to increase by Part B trend rates. No retiree is assumed to have income in excess of the threshold which would result in increasing Part B premiums above 25% of Medicare Part B costs. Health Care Cost Trend Rate (HCCTR). Covered medical expenses are assumed to increase by the following percentages:
HCCTR Assumptions
Medical Medical Medical Medical Year Ending Part B Pre 65 Post 65 Year Ending Part B Pre 65 Post 65
2010 6.86% 8.24% 8.80% 2020 5.59 6.04 6.21 2011 6.72 7.99 8.50 2021 5.48 5.85 5.99 2012 6.58 7.75 8.22 2022 5.37 5.67 5.79 2013 6.45 7.51 7.94 2023 5.26 5.50 5.59 2014 6.32 7.29 7.67 2024 5.16 5.33 5.39 2015 6.19 7.06 7.40 2025 5.05 5.16 5.20 2016 6.07 6.85 7.15 2026 4.95 5.00 5.02 2017 5.95 6.63 6.90 2027 4.85 4.85 4.85 2018 5.83 6.43 6.66 2028 4.53 4.53 4.52 2019 5.71 6.23 6.43 2029 4.50 4.50 4.50
Mortality rates listed below are those recommended by the actuary:
Age Male Female 20 .0486% .0486% 30 .0534% .0534% 40 .0962% .0962% 50 .2441% .2177% 60 .7365% .5332% 70 1.8246% 1.2686% 80 4.6846% 3.4091% 90 14.5417% 11.0872% The required schedule of funding progress immediately following the notes to the financial statements presents multi‐year trend information about whether the actuarial value of plan assets is increasing or decreasing over time relative to the actuarial accrued liability for benefits.
51

NOTE 12 – COMMITMENTS AND CONTINGENCIES The Agency is obligated under leases for office locations in the City of New York (the “City”), Albany and Buffalo. The Agency and the State of New York Mortgage Agency (“SONYMA”) entered into an operating lease for office space in the City which commenced in fiscal year 1994 for a term of fifteen years. The lease was renewed during the fiscal year ended October 31, 2007, effective January 1, 2009 for a term of ten years. The lease for the office location in the City obligates the Agency to pay for escalations in excess of the minimum annual rental (ranging from $2,434,266 to $4,731,836) based on operating expenses and real estate taxes. The Agency bears approximately 50% of the minimum annual lease payments under this lease with the balance to be assumed by SONYMA with whom the Agency shares the leased space. Rental expense for all office locations for the fiscal years ended October 31, 2011 and October 31, 2010 was $2,440,780 and $2,115,936, respectively, net of allocations to certain State‐related agencies. As of October 31, 2011, the future minimum lease payments, which includes the Agency’s pro rata share of the annual payments for the office space leases, under the non‐cancelable operating leases are as follows:
(in thousands) 2012 $2,472 2013 2,501 2014 2,658 2015 2,732 2016 2,774 Thereafter 8,775
Future minimum lease commitments $21,912 In the ordinary course of business, the Agency is party to various administrative and legal proceedings. While the ultimate outcome of these matters cannot presently be determined, it is the Agency’s opinion that the resolution of these matters will not have a material effect on its financial condition.
****
52

New York State Housing Finance Agency(A Component Unit of the State of New York)
REQUIRED SUPPLEMENTARY INFORMATIONSCHEDULE OF FUNDING PROGRESS ‐ POSTRETIREMENT HEALTHCARE PLANOCTOBER 31, 2011 AND 2010(in thousands)
UnfundedActuarial Actuarial Actuarial Ratio of UAAL
Valuation Value of Accrued Accrued Funded Covered to CoveredDate Assets Liability (AAL) Liability (UAAL) Ratio Payroll Payroll
(A) (B) (C=B‐A) (A/C) (D) (C/D)
November 1, 2009 — $28,069 $28,069 — $8,630 325%
November 1, 2007 — $22,615 $22,615 — $7,400 306%
53

Supplementary Section
54

New York State Housing Finance Agency(A Component Unit of the State of New York)
SCHEDULES OF NET POSITIONOctober 31, 2011(in thousands)
AssetsCurrent Assets: Cash held principally by Trustee and Depository ‐ Restricted $ 40,284 5,276 19,713 1,473 7 Cash held by Paying Agent for Nov. 1 bond payments ‐ Restricted — — — 4,573 — Cash held principally by Trustee and Depository ‐ Unrestricted — — — 3 — Investments ‐ Restricted 140,890 266,854 680,670 21,952 13,083 Investments ‐ Unrestricted — — — — — Accrued interest receivable on investments 14 3 649 — 120 Mortgage loans and other loans ‐ net 62,147 24,779 22,309 4,205 10 Interest receivable and other 624 564 1,059 5 — Total current assets 243,959 297,476 724,400 32,211 13,220Non‐current Assets: Investments ‐ Restricted — — 11,448 — 4,200 Investments ‐ Unrestricted — — — — — Mortgage loans and other loans ‐ net 292 914 90 550 7 651 708 13 460 10
Mortgage Programs
Programs with Bond Financing
Affordable Housing Program
Affordable Housing Program (NIBP)
Secured Loan Rental Housing Program (and Other)
Moral Obligation Housing Programs
Hospitaland Health Care (Moral Obligation) Program
Mortgage loans and other loans ‐ net 292,914 90,550 7,651,708 13,460 10 Interest receivable and other — 329 — 326 — Total non‐current assets 292,914 90,879 7,663,156 13,786 4,210Total assets 536,873 388,355 8,387,556 45,997 17,430
Deferred outflows of resources Accumulated decrease in fair value of hedging derivatives — — — — —
LiabilitiesCurrent Liabilities: Accounts payable — — — — — Interest payable 7,906 2,333 5,146 810 4 Advances from (to) other programs — — — 507 79 Funds received from governmental entities — — — — — Earnings restricted to project development 202 272 688 — 15 Unearned revenues, amounts received in advance and other payables 4,621 174 104,694 — — Bonds payable 43,375 9,285 11,145 4,400 150 Funds received from mortgagors 14,178 — 5,957 15 18Total current liabilities 70,282 12,064 127,630 5,732 266Non‐current Liabilities: Bonds and notes 371,953 374,135 8,206,405 18,555 20 Derivative instrument ‐ interest rate swaps — — — — — Deferred revenues, amounts received in advance and other — — 14,371 — — Postemployment retirement benefits — — — — — Total non‐current liabilities 371,953 374,135 8,220,776 18,555 20Total liabilities 442,235 386,199 8,348,406 24,287 286
Net position Restricted 94,638 2,156 39,150 22,028 17,144 Unrestricted — — — (318) — Total net position (deficit) $ 94,638 2,156 39,150 21,710 17,144
Affordable Housing Program
Affordable Housing Program (NIBP)
Secured Loan Rental Housing Program (and Other)
Moral Obligation Housing Programs
Hospitaland Health Care (Moral Obligation) Program
55

Other Agency Programs Operating Funds Total
1,362 746 637 105 12,823 — 82,426
— — — — — — 4,573
— — — 39 — 14,164 14,20637,925 42,048 2,898 13,856 50,183 — 1,270,359
— 1,798 — 7,074 — 84,312 93,184548 510 — 6 62 106 2,018
6,650 2,343 74,000 745 467 — 197,655— 3 5,831 15 27 10,367 18,495
46,485 47,448 83,366 21,840 63,562 108,949 1,682,916
21,347 14,650 — — 423 — 52,068— — — — — 42,774 42,774
8 734 14 340 980 913 8 190 11 039 — 9 071 858
Mortgage Programs
Supplemental Schedule I
Mortgage and Other Programs
Programs with Bond Financing Programs without Bond Financing
Housing Project Mortgage Revenue Program
State Revenue Bond Programs
CommunityRelated and Other Loan Programs
ProjectImprovement and Other Programs
Nursing Home and Health Care Project Program
8,734 14,340 980,913 8,190 11,039 — 9,071,858435 2,489 4,511 2,272 — 918 11,280
30,516 31,479 985,424 10,462 11,462 43,692 9,177,98077,001 78,927 1,068,790 32,302 75,024 152,641 10,860,896
— — 43,933 — — — 43,933
— — — 47 47 6,867 6,961668 393 5,831 — — — 23,091214 158 — 93 354 (1,405) — — — — — 19,222 2,109 21,33110 332 987 — 2,549 — 5,055
— 738 3,188 — 743 46,383 160,5417,565 1,445 74,000 — — — 151,365
— 651 — — 100 13,658 34,5778,457 3,717 84,006 140 23,015 67,612 402,921
18,033 10,902 1,004,516 — — — 10,004,519— — 43,933 — — — 43,933
1,032 — — 1,290 22 699 17,414— — — — — 32,779 32,779
19,065 10,902 1,048,449 1,290 22 33,478 10,098,64527,522 14,619 1,132,455 1,430 23,037 101,090 10,501,566
49,479 62,433 (19,732) 30,819 51,987 — 350,102— 1,875 — 53 — 51,551 53,161
49,479 64,308 (19,732) 30,872 51,987 51,551 403,263
Housing Project Mortgage Revenue Program
State Revenue Bond Programs
CommunityRelated and Other Loan Programs
ProjectImprovement and Other Programs
Nursing Home and Health Care Project Program
56

New York State Housing Finance Agency(A Component Unit of the State of New York)
SCHEDULES OF PROGRAM REVENUES, EXPENSESAND CHANGES IN NET POSITIONFiscal Year Ended October 31, 2011(in thousands)
Operating revenuesInterest on mortgage loans $ 20,167 5,218 32,945 1,501 9Fees, charges and other — — 4 176 9Investment income 125 — 1,408 34 251(Decrease) increase in fair value of investments (15) 3 178 1 — Recoveries — — — — — Total operating revenues 20,277 5,221 34,535 1,712 269Operating expensesInterest 16,299 3,724 32,780 1,632 85Earnings on investments and other funds credited to mortgagors and lessees 1 — 1,298 338 — Postemployment retirement benefits — — — — — Reserve for subsidy loans disbursed — — — — — General expenses 507 546
Mortgage Programs
Programs with Bond Financing
Affordable Housing Program
Affordable Housing Program (NIBP)
Secured Loan Rental Housing Program (and Other)
Moral Obligation Housing Programs
Hospitaland Health Care (Moral Obligation) Program
General expenses — — — 507 546Other financial expenses — — 40 — 5Fees and expenses of the Trustee, Depository and Paying Agent — — — 2 — Supervising agency fee — — — 355 392Expenditures related to federal and state grants — — — — — Total operating expenses 16,300 3,724 34,118 2,834 1,028Operating income (loss) 3,977 1,497 417 (1,122) (759)
Non‐operating (expenses) revenuesFederal and state grants — — — — — Reserve funds (disbursed to) received from mortgagors (28) 71 (1,369) — — Transfers between programs (101) 101 (172) 2 — Loss on loans — — — — — Net non‐operating (expenses) revenues (129) 172 (1,541) 2 —
Increase (Decrease) in net position 3,848 1,669 (1,124) (1,120) (759)Total net position (deficit) ‐ beginning of fiscal year 90,790 487 40,274 22,830 17,903Total net position (deficit) ‐ end of fiscal year $ 94,638 2,156 39,150 21,710 17,144
Affordable Housing Program
Affordable Housing Program (NIBP)
Secured Loan Rental Housing Program (and Other)
Moral Obligation Housing Programs
Hospitaland Health Care (Moral Obligation) Program
57

Other AgencyProgram Operating Funds Total
1,540 1,526 37,982 347 303 306 101,844468 202 4,013 42 3,810 19,433 28,157
1,163 1,055 12 30 210 1,267 5,555
(36) 2 — 4 (72) (836) (771)56 — — — 124 — 180
3,191 2,785 42,007 423 4,375 20,170 134,965
1,701 981 36,515 — — — 93,717
— — — — 38 — 1,675— — — — — 1,638 1,638— 3,726 — — 15,497 — 19,223
1 421 1 093 220 11 13 125 16 923
Mortgage Programs
Supplemental Schedule II
Programs with Bond Financing
Mortgage and Other Programs
Programs without Bond Financing
Nursing Home and Health Care Project Program
Housing Project Mortgage Revenue Program
State Revenue Bond Programs
CommunityRelated and Other Loan Programs
ProjectImprovement and Other Programs
1,421 1,093 — 220 11 13,125 16,92332 — 9,256 — 251 462 10,046
— 3 — — — 49 54996 764 — 154 — 9,480 12,141
— — — — 44,175 — 44,1754,150 6,567 45,771 374 59,972 24,754 199,592(959) (3,782) (3,764) 49 (55,597) (4,584) (64,627)
— — — — 44,175 — 44,175— — — — — — (1,326)— (12) (1,493) — (57) 1,732 — (19) — — — — — (19)(19) (12) (1,493) — 44,118 1,732 42,830
(978) (3,794) (5,257) 49 (11,479) (2,852) (21,797)50,457 68,102 (14,475) 30,823 63,466 54,403 425,06049,479 64,308 (19,732) 30,872 51,987 51,551 403,263
Nursing Home and Health Care Project Program
Housing Project Mortgage Revenue Program
State Revenue Bond Programs
CommunityRelated and Other Loan Programs
ProjectImprovement and Other Programs
58

New York State Housing Finance Agency(A Component Unit of the State of New York)
SCHEDULES OF PROGRAM CASH FLOWSFiscal Year Ended October 31, 2011(in thousands)
Cash flows from operating activities Interest on loans $ 20,888 4,722 33,488 1,495 9 Interest payments (16,436) (1,403) (33,702) (1,768) (12) Fees, charges and other — — 5 176 8 Investment income 206 72 2,140 34 198 Operating expenses — — (40) (761) (943) Principal payments on mortgage loans 86,045 1,956 107,877 4,370 150 Mortgage loans advanced (143,513) (90,969) (518,185) (189) — Funds received from mortgagors 15,180 — 109,191 15 — Funds returned to mortgagors (170) (82) (2,662) (338) (37) Distribution of funds received from governmental entities — — — — — Payments and other (129) 172 (4,496) 2 — Expenditures related to Federal and State Grants — — — — — Net cash (used in) provided by operating activities (37,929) (85,532) (306,384) 3,036 (627)Cash flows from non‐capital financing activities Issuance of bonds 50,915 168,030 628,380 — —
Principal repayments (68 835) (92 875) (183 410) (4 140) (145)
Mortgage Programs
Programs with Bond Financing
Affordable Housing Program
Affordable Housing Program (NIBP)
Secured Loan Rental Housing Program (and Other)
Moral Obligation Housing Programs
Hospitaland Health Care (Moral Obligation) Program
Principal repayments (68,835) (92,875) (183,410) (4,140) (145) Federal and State Grants — — — — — Net cash (used in) provided by non‐capital financing activities (17,920) 75,155 444,970 (4,140) (145)Cash flows from investing activities Proceeds from sales or maturities of investments 1,004,789 3,173,265 2,463,019 47,906 43,206 Purchases of investments (919,396) (3,158,602) (2,600,164) (46,533) (42,692)Net cash provided by (used in) non‐captial financing activities 85,393 14,663 (137,145) 1,373 514 Net increase (decrease) in cash 29,544 4,286 1,441 269 (258) Cash at beginning of fiscal year 10,740 990 18,272 5,780 265Cash at end of fiscal year $ 40,284 5,276 19,713 6,049 7Reconciliation of operating income (loss) to net cash (used in) provided by operating activities:Operating income (loss) $ 3,977 1,497 417 (1,122) (759)Adjustments to reconcile operating income (loss) to net cash (used in) provided by operating activities: Earnings on investments ‐ net 81 72 781 1 (54) Increase (decrease) in fair value of investments 16 (3) (227) (1) — Interest expense ‐ net 583 1,825 (379) (142) 73 Transfers and other (129) 172 (4,496) 2 — Changes in assets and liabilities ‐ net: Mortgage loan receivables (57,468) (89,013) (410,308) 4,181 150 Interest, fees and other receivables — — — — — Accounts and other payables — — — 102 — Funds received from mortgagors and governmental entities 15,011 (82) 107,828 15 (37)Net cash (used in) provided by operating activities $ (37,929) (85,532) (306,384) 3,036 (627)
Affordable Housing Program
Affordable Housing Program (NIBP)
Secured Loan Rental Housing Program (and Other)
Moral Obligation Housing Programs
Hospitaland Health Care (Moral Obligation) Program
59
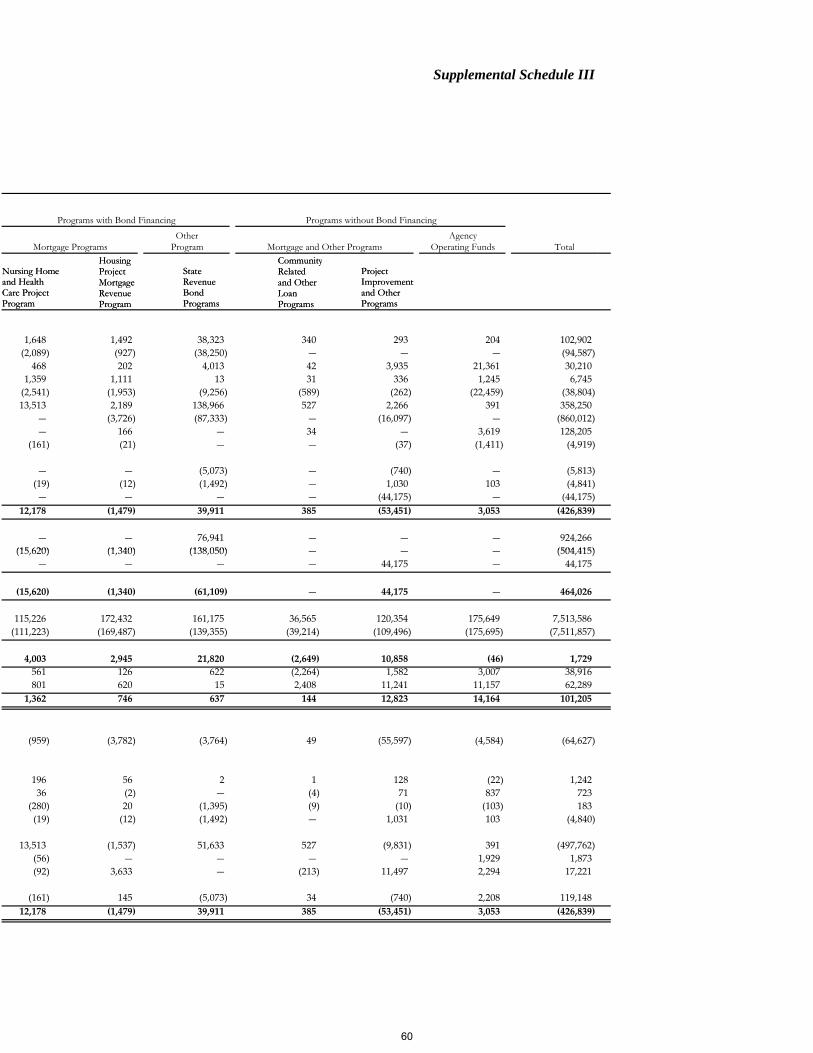
Other AgencyProgram Operating Funds Total
1,648 1,492 38,323 340 293 204 102,902(2,089) (927) (38,250) — — — (94,587)
468 202 4,013 42 3,935 21,361 30,2101,359 1,111 13 31 336 1,245 6,745(2,541) (1,953) (9,256) (589) (262) (22,459) (38,804)13,513 2,189 138,966 527 2,266 391 358,250
— (3,726) (87,333) — (16,097) — (860,012)— 166 — 34 — 3,619 128,205
(161) (21) — — (37) (1,411) (4,919)
— — (5,073) — (740) — (5,813)(19) (12) (1,492) — 1,030 103 (4,841)— — — — (44,175) — (44,175)
12,178 (1,479) 39,911 385 (53,451) 3,053 (426,839)
— — 76,941 — — — 924,266(15 620) (1 340) (138 050) (504 415)
Programs with Bond Financing
Supplemental Schedule III
Programs without Bond Financing
Mortgage Programs Mortgage and Other Programs
Nursing Home and Health Care Project Program
Housing Project Mortgage Revenue Program
State Revenue Bond Programs
Community Related and Other Loan Programs
Project Improvement and Other Programs
(15,620) (1,340) (138,050) — — — (504,415)— — — — 44,175 — 44,175
(15,620) (1,340) (61,109) — 44,175 — 464,026
115,226 172,432 161,175 36,565 120,354 175,649 7,513,586(111,223) (169,487) (139,355) (39,214) (109,496) (175,695) (7,511,857)
4,003 2,945 21,820 (2,649) 10,858 (46) 1,729561 126 622 (2,264) 1,582 3,007 38,916801 620 15 2,408 11,241 11,157 62,289
1,362 746 637 144 12,823 14,164 101,205
(959) (3,782) (3,764) 49 (55,597) (4,584) (64,627)
196 56 2 1 128 (22) 1,24236 (2) — (4) 71 837 723
(280) 20 (1,395) (9) (10) (103) 183(19) (12) (1,492) — 1,031 103 (4,840)
13,513 (1,537) 51,633 527 (9,831) 391 (497,762)(56) — — — — 1,929 1,873(92) 3,633 — (213) 11,497 2,294 17,221
(161) 145 (5,073) 34 (740) 2,208 119,14812,178 (1,479) 39,911 385 (53,451) 3,053 (426,839)
Nursing Home and Health Care Project Program
Housing Project Mortgage Revenue Program
State Revenue Bond Programs
Community Related and Other Loan Programs
Project Improvement and Other Programs
60

BOND INDEBTEDNESS(in thousands)
Non‐Profit Housing Project Bonds:5.80% to 7.50% — 1973 Series A, maturing in varying annual installments to 2014 $ 136,500 15,825 — 3,255 12,5708.40% — 1979 Series A, maturing in varying annual installments to 2019 49,585 4,480 — 340 4,140
186,085 20,305 — 3,595 16,710Housing Project Bonds:Meadow Manor, 7.75% — 1979, maturing in varying semi‐annual installments to 2019 4,585 2,460 — 185 2,275Simeon DeWitt Apartments, 8% — 1978, maturing in varying semi‐annual installments to 2018 4,565 2,320 — 200 2,120Towpath Towers, 8% — 1978, maturing in varying semi‐annual installments to 2019 3,815 2,010 — 160 1,850
12,965 6,790 — 545 6,245Secured Loan Rental Housing Bonds and Other:FHA‐Insured Multi‐Family Housing Revenue Bonds6.75% — 1995 Series A, maturing in varying semi‐annual installments to 2036 12,300 7,965 — 120 7,8458.10% to 8.25% — 1995 Series B, (Federally Taxable) maturing in varying semi‐annual installments to 2035 7,270 3,940 — 3,940 — 6.40% — 1996 Series A, maturing in varying semi‐annual installments to 2027 2,515 2,515 — — 2,5157.65% to 8.45% — 1996 Series B (Federally Taxable), maturing in varying semi‐annual installments to 2020 2,500 1,685 — 110 1,5756.57% — 1998 Series A (Federally Taxable), maturing in varying semi‐annual installments to 2030 1,045 905 — 20 885
Supplemental Schedule IV
OriginalFace
Amount
Balance October 31,
2010
Issued
Balance October 31,
2011
Retired/Principal Payments
5.15% to 5.30% — 1998 Series B, maturing in varying semi‐annual installments to 2039 3,400 3,055 — 45 3,0101% to 4.70% — 2003 Series A, maturing in varying semi‐annual installments to 2043 8,290 6,710 — 255 6,4551.25% to 4.95% — 2003 Series B, maturing in varying semi‐annual installments to 2033 4,700 2,860 — 305 2,555
42,020 29,635 — 4,795 24,840Multi‐Family FHA Insured Mortgage Housing Revenue Bonds6.79% — 1998 Series A (Federally Taxable), maturing in varying semi‐annual installments to 2039 2,540 2,355 — 30 2,325
2,540 2,355 — 30 2,325Multi‐Family Housing Revenue Bonds(Fannie Mae‐Backed Program)4.60% to 6.85% — 1994 Series A, maturing in varying semi‐annual installments to 2019 11,405 1,835 — 130 1,705Normandie Court I Housing Revenue Bondsvariable rate demand — 1991 Series A, maturing in varying annual installments to 2015 104,600 87,500 — 1,900 85,600Normandie Court II Multi‐Family Housing Revenue Bondsvariable rate demand — 1999 Series A, maturing in 2029 40,500 35,000 — 1,000 34,000Childrenʹs Rescue Fund Housing Revenue Bonds6.25% to 7.625% — 1991 Series A, maturing in varying semi‐annual installments to 2018 11,020 5,490 — 555 4,935Newburgh Interfaith Housing Revenue Bonds7.05% — 1991 Series A, maturing in varying semi‐annual installments to 2012 2,450 530 — 200 330Phillips Village Project Housing Revenue Bonds5% to 7.75% — 1994 Series A, maturing in varying semi‐annual installments to 2017 16,880 8,315 — 940 7,375
61

Multi‐Family Housing Revenue Bonds (Secured Mortgage Program)5.40% to 6.25% — 1994 Series A, maturing in varying annual installments to 2025 3,560 955 — 45 9107.95% to 9% — 1994 Series B (Federally Taxable), maturing in varying annual installments to 2026 12,220 1,420 — 45 1,3755.35% to 6.10% — 1996 Series C in varying annual installments to 2028 4,260 3,285 — 3,285 — 4% to 5.50% — 1998 Series B, maturing in varying annual statements to 2030 3,685 2,940 — 90 2,8506.72% to 6.82% — 1998 Series C (Federally Taxable), maturing in varying annual installments to 2030 3,545 2,950 — 80 2,8703.65% to 5.35% — 1999 Series A, maturing in varying annual installments to 2031 7,565 6,260 — 170 6,0905.15% to 5.65% — 1999 Series C, maturing in varying annual installments to 2031 4,560 3,760 — 105 3,6557.31% to 7.70% — 1999 Series D (Federally Taxable), maturing in varying annual installments to 2031 6,570 5,675 — 125 5,5505.65% — 1999 Series E, maturing in varying annual installments to 2030 1,255 1,050 — 30 1,0204.25% to 5.65% — 1999 Series G, maturing in varying annual installments to 2030 5,595 4,630 — 125 4,5054.65% to 6.25% — 1999 Series H, maturing in varying annual installments to 2032 5,755 5,005 — 115 4,8904.65% to 6.30% — 1999 Series J, maturing in varying annual installments to 2032 3,960 3,445 — 80 3,3656 25% 2000 Series A maturing in
Original Face
Amount
Balance October 31,
2010
Issued
Balance October 31,
2011
Retired/Principal Payments
6.25% — 2000 Series A, maturing in varying annual installments to 2031 930 665 — 15 6507.95% — 2000 Series D (Federally Taxable), maturing in varying annual installments to 2032 2,870 2,590 — 45 2,5454.05% to 5.60% — 2001 Series A, maturing in varying annual installments to 2033 2,150 1,870 — 45 1,8253.75% to 5.45% — 2001 Series C, maturing in varying annual installments to 2033 12,400 10,775 — 250 10,5254% to 5.70% — 2001 Series E, maturing in varying annual installments to 2033 3,620 3,170 — 70 3,1003% to 5.40% — 2001 Series G, maturing in varying annual installments to 2034 10,465 9,215 — 210 9,0056.64% — 2001 Series I, (Federally Taxable) maturing in varying annual installments to 2034 3,310 3,025 — 3,025 — 5% to 5.65% — 2001 Series K, maturing in varying annual installments to 2034 3,795 3,430 — 70 3,3604.90% to 5.375% — 2002 Series A, maturing in varying annual installments to 2035 6,640 5,985 — 130 5,8556.37% — 2002 Series B (Federally Taxable), maturing in varying annual installments to 2034 3,310 3,010 — 60 2,9504.50% to 5.375% — 2002 Series C, maturing in varying annual installments to 2034 3,170 2,830 — 60 2,7705.375% — 2002 Series D, maturing in varying annual installments to 2034 1,600 375 — 10 3652% to 5.30% — 2004 Series A, maturing in varying semi‐annual installments to 2028 4,090 3,440 — 120 3,3201.75% to 5.10% — 2004 Series B, maturing in varying semi‐annual installments to 2027 32,245 25,750 — 1,220 24,5304.46% to 5.96% — 2004 Series C (Federally Taxable), maturing in varying semi‐annual statements to 2022 2,350 1,645 — 110 1,535
Original Face
Amount
Balance October 31,
2010
Issued
Balance October 31,
2011
Retired/Principal Payments
62

Walnut Hill Apartments Multi‐Family Housing Revenue Bonds1.10% to 5% — 2003 Series A, maturing in varying semi‐annual installments to 2040 10,030 8,090 — 325 7,765Watergate II Apartments Multi‐Family Housing Revenue Bonds1.10% to 4.90% — 2004 Series A, maturing in varying semi‐annual installments to 2045 7,800 6,170 — 285 5,885Framark Place Apartments Multi‐Family Housing Revenue Bonds5.20% to 5.35% — 2004 Series A, maturing in varying semi‐annual installments to 2036 1,800 1,665 — 30 1,635The Northfield Apartments Multi‐Family Housing Revenue Bonds4.30% to 5.20% — 2004 Series A, maturing in varying semi‐annual installments to 2036 4,990 4,635 — 95 4,540Washington Apartments Multi‐Family Housing Revenue Bonds4.50% to 5.15% — 2004 Series A, maturing in varying semi‐annual installments to 2036 2,695 2,475 — 50 2,425Keeler Park Apartments Housing Revenue Bonds1.20% to 5.05% — 2003 Series A, maturing in varying semi‐annual installments to 2033 17,900 13,905 — 625 13,280Nathan Hale Senior Village Multi‐Family Housing Revenue Bonds1.15% to 4.60% — 2004 Series A, maturing in varying semi‐annual installments to 2039 5,745 4,595 — 200 4,395Horizons at Fishkill Apartments Multi‐Family Housing Revenue Bonds4.10% to 5% — 2004 Series A, maturing in varying semi‐annual installments to 2036 5,975 5,570 — 115 5,455Extra Place Apartments Multi‐Family Housing Revenue Bonds4 25% to 5% 2004 Series A maturing in varying
Original Face
Amount
Balance October 31,
2010
Issued
Balance October 31,
2011
Retired/Principal Payments
4.25% to 5% — 2004 Series A, maturing in varying semi‐annual installments to 2037 3,310 2,895 — 120 2,775Tall Oaks Apartments Multi‐Family Housing Revenue Bonds4.15% to 4.95% — 2004 Series A, maturing in varying semi‐annual installments to 2036 5,930 4,590 — 285 4,305East 84th Street Housing Revenue Bondsvariable rate demand — 1995 Series A , maturing in 2028 61,200 60,000 — — 60,000Union Square South Housing Revenue Bondsvariable rate demand — 1996 Series A , maturing in 2024 50,000 49,000 — — 49,000250 West 50th Street Housing Revenue Bondsvariable rate demand — 1997 Series A, maturing in 2029 103,500 100,500 — — 100,500variable rate demand — 1997 Series B (FederallyTaxable), maturing in 2029 15,400 3,700 — 2,200 1,500Tribeca Landing Housing Revenue Bondsvariable rate demand — 1997 Series A, maturing in 2029 59,000 54,800 — — 54,800240 East 39th Street Housing Revenue Bondsvariable rate demand — 1997 Series A, maturing in 2030 119,000 119,000 — — 119,000345 East 94th Street Housing Revenue Bondsvariable rate demand — 1998 Series A, maturing in 2030 29,000 28,700 — — 28,700variable rate demand — 1999 Series A, maturing in 2030 17,100 14,900 — — 14,900Tribeca Park Housing Revenue Bondsvariable rate demand — 1997 Series A, maturing in 2029 82,000 77,500 — — 77,500
Original Face
Amount
Balance October 31,
2010
Issued
Balance October 31,
2011
Retired/Principal Payments
63
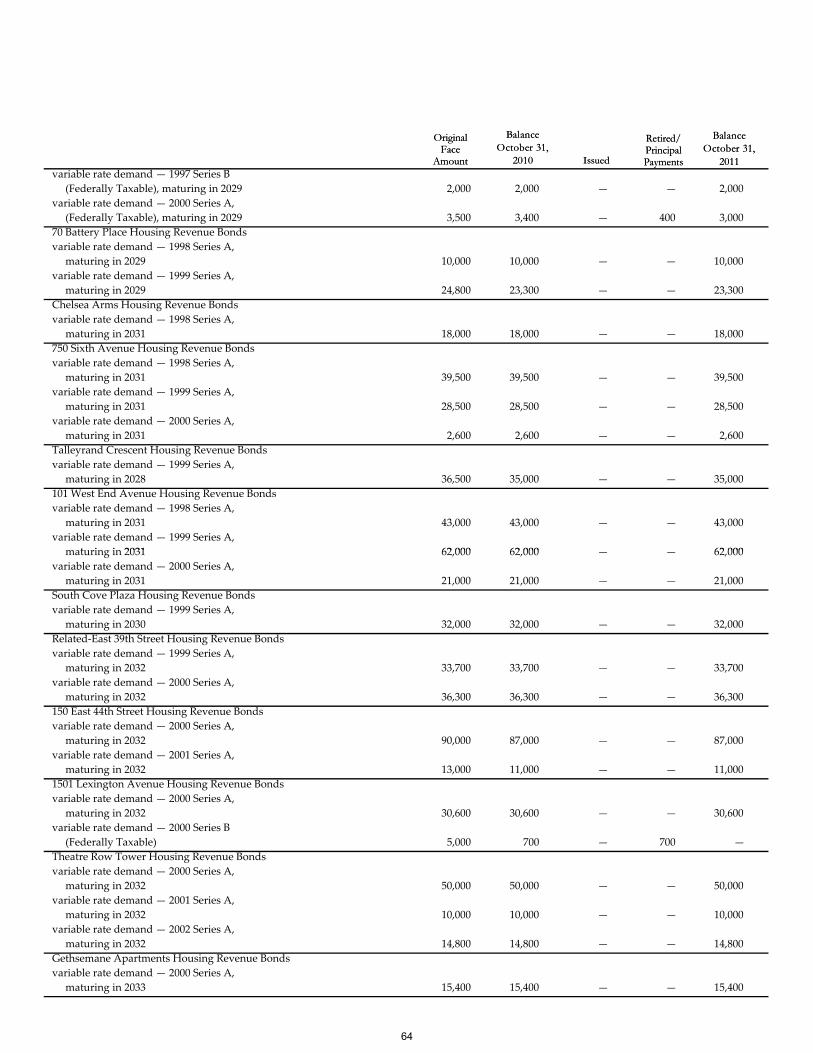
variable rate demand — 1997 Series B (Federally Taxable), maturing in 2029 2,000 2,000 — — 2,000variable rate demand — 2000 Series A, (Federally Taxable), maturing in 2029 3,500 3,400 — 400 3,00070 Battery Place Housing Revenue Bondsvariable rate demand — 1998 Series A, maturing in 2029 10,000 10,000 — — 10,000variable rate demand — 1999 Series A, maturing in 2029 24,800 23,300 — — 23,300Chelsea Arms Housing Revenue Bondsvariable rate demand — 1998 Series A, maturing in 2031 18,000 18,000 — — 18,000750 Sixth Avenue Housing Revenue Bondsvariable rate demand — 1998 Series A, maturing in 2031 39,500 39,500 — — 39,500variable rate demand — 1999 Series A, maturing in 2031 28,500 28,500 — — 28,500variable rate demand — 2000 Series A, maturing in 2031 2,600 2,600 — — 2,600Talleyrand Crescent Housing Revenue Bondsvariable rate demand — 1999 Series A, maturing in 2028 36,500 35,000 — — 35,000101 West End Avenue Housing Revenue Bondsvariable rate demand — 1998 Series A, maturing in 2031 43,000 43,000 — — 43,000variable rate demand — 1999 Series A,
maturing in 2031 62 000 62 000 62 000
Original Face
Amount
Balance October 31,
2010
Issued
Balance October 31,
2011
Retired/Principal Payments
maturing in 2031 62,000 62,000 — — 62,000variable rate demand — 2000 Series A, maturing in 2031 21,000 21,000 — — 21,000South Cove Plaza Housing Revenue Bondsvariable rate demand — 1999 Series A, maturing in 2030 32,000 32,000 — — 32,000Related‐East 39th Street Housing Revenue Bondsvariable rate demand — 1999 Series A, maturing in 2032 33,700 33,700 — — 33,700variable rate demand — 2000 Series A, maturing in 2032 36,300 36,300 — — 36,300150 East 44th Street Housing Revenue Bondsvariable rate demand — 2000 Series A, maturing in 2032 90,000 87,000 — — 87,000variable rate demand — 2001 Series A, maturing in 2032 13,000 11,000 — — 11,0001501 Lexington Avenue Housing Revenue Bondsvariable rate demand — 2000 Series A, maturing in 2032 30,600 30,600 — — 30,600variable rate demand — 2000 Series B (Federally Taxable) 5,000 700 — 700 — Theatre Row Tower Housing Revenue Bondsvariable rate demand — 2000 Series A, maturing in 2032 50,000 50,000 — — 50,000variable rate demand — 2001 Series A, maturing in 2032 10,000 10,000 — — 10,000variable rate demand — 2002 Series A, maturing in 2032 14,800 14,800 — — 14,800Gethsemane Apartments Housing Revenue Bondsvariable rate demand — 2000 Series A, maturing in 2033 15,400 15,400 — — 15,400
Original Face
Amount
Balance October 31,
2010
Issued
Balance October 31,
2011
Retired/Principal Payments
64

363 West 30th Street Housing Revenue Bondsvariable rate demand — 2000 Series A, maturing in 2032 17,000 17,000 — — 17,00066 West 38th Street Housing Revenue Bondsvariable rate demand — 2000 Series A, maturing in 2033 7,000 7,000 — — 7,000variable rate demand — 2000 Series B (Federally Taxable), maturing in 2033 31,000 19,500 — 1,400 18,100variable rate demand — 2001 Series A, maturing in 2033 36,000 36,000 — — 36,000variable rate demand — 2002 Series A, maturing in 2033 46,800 46,800 — — 46,800350 West 43rd Street Housing Revenue Bondsvariable rate demand — 2001 Series A, maturing in 2034 26,000 26,000 — — 26,000variable rate demand — 2002 Series A, maturing in 2034 60,000 60,000 — — 60,000variable rate demand — 2004 Series A, maturing in 2034 23,000 20,100 — 1,100 19,000Related‐West 20th Street Housing Revenue Bondsvariable rate demand — 2000 Series A, maturing in 2033 29,000 29,000 — — 29,000variable rate demand — 2000 Series B (Federally Taxable), maturing in 2033 8,000 3,000 — — 3,000variable rate demand — 2001 Series A, maturing in 2033 51,000 51,000 — — 51,000Saville Housing Revenue Bonds
Original Face
Amount
Balance October 31,
2010
Issued
Balance October 31,
2011
Retired/Principal Payments
Saville Housing Revenue Bondsvariable rate demand — 2002 Series A, maturing in 2035 55,000 55,000 — — 55,000Related‐West 23rd Street Housing Revenue Bondsvariable rate demand — 2001 Series A, maturing in 2033 26,000 26,000 — — 26,000variable rate demand — 2001 Series B (Federally Taxable), maturing in 2033 27,500 8,000 — — 8,000variable rate demand — 2002 Series A, maturing in 2033 73,000 73,000 — — 73,000The Victory Housing Revenue Bondsvariable rate demand — 2000 Series A, maturing in 2033 16,000 16,000 — — 16,000variable rate demand — 2000 Series B (Federally Taxable) 29,500 800 — 800 — variable rate demand — 2001 Series A, maturing in 2033 44,000 44,000 — — 44,000variable rate demand — 2002 Series A, maturing in 2033 29,000 29,000 — — 29,000variable rate demand — 2004 Series A, maturing in 2033 25,500 25,500 — — 25,500Worth Street Housing Revenue Bondsvariable rate demand — 2001 Series A, maturing in 2033 51,000 51,000 — — 51,000variable rate demand — 2001 Series B (Federally Taxable), maturing in 2033 27,900 19,100 — 1,500 17,600variable rate demand — 2002 Series A, maturing in 2033 39,200 37,000 — — 37,000360 West 43rd Street Housing Revenue Bondsvariable rate demand — 2002 Series A, maturing in 2033 33,700 33,700 — — 33,700
Original Face
Amount
Balance October 31,
2010
Issued
Balance October 31,
2011
Retired/Principal Payments
65
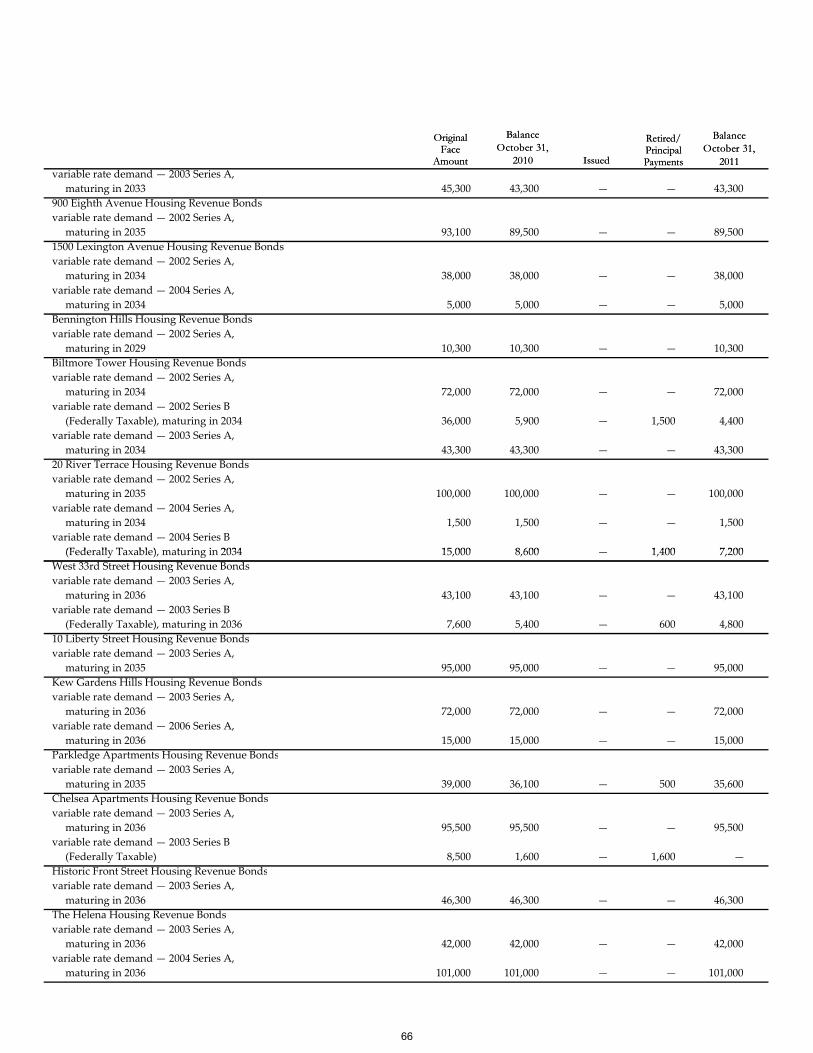
variable rate demand — 2003 Series A, maturing in 2033 45,300 43,300 — — 43,300900 Eighth Avenue Housing Revenue Bondsvariable rate demand — 2002 Series A, maturing in 2035 93,100 89,500 — — 89,5001500 Lexington Avenue Housing Revenue Bondsvariable rate demand — 2002 Series A, maturing in 2034 38,000 38,000 — — 38,000variable rate demand — 2004 Series A, maturing in 2034 5,000 5,000 — — 5,000Bennington Hills Housing Revenue Bondsvariable rate demand — 2002 Series A, maturing in 2029 10,300 10,300 — — 10,300Biltmore Tower Housing Revenue Bondsvariable rate demand — 2002 Series A, maturing in 2034 72,000 72,000 — — 72,000variable rate demand — 2002 Series B (Federally Taxable), maturing in 2034 36,000 5,900 — 1,500 4,400variable rate demand — 2003 Series A, maturing in 2034 43,300 43,300 — — 43,30020 River Terrace Housing Revenue Bondsvariable rate demand — 2002 Series A, maturing in 2035 100,000 100,000 — — 100,000variable rate demand — 2004 Series A, maturing in 2034 1,500 1,500 — — 1,500variable rate demand — 2004 Series B
(Federally Taxable) maturing in 2034 15 000 8 600 1 400 7 200
Original Face
Amount
Balance October 31,
2010
Issued
Balance October 31,
2011
Retired/Principal Payments
(Federally Taxable), maturing in 2034 15,000 8,600 — 1,400 7,200West 33rd Street Housing Revenue Bondsvariable rate demand — 2003 Series A, maturing in 2036 43,100 43,100 — — 43,100variable rate demand — 2003 Series B (Federally Taxable), maturing in 2036 7,600 5,400 — 600 4,80010 Liberty Street Housing Revenue Bondsvariable rate demand — 2003 Series A, maturing in 2035 95,000 95,000 — — 95,000Kew Gardens Hills Housing Revenue Bondsvariable rate demand — 2003 Series A, maturing in 2036 72,000 72,000 — — 72,000variable rate demand — 2006 Series A, maturing in 2036 15,000 15,000 — — 15,000Parkledge Apartments Housing Revenue Bondsvariable rate demand — 2003 Series A, maturing in 2035 39,000 36,100 — 500 35,600Chelsea Apartments Housing Revenue Bondsvariable rate demand — 2003 Series A, maturing in 2036 95,500 95,500 — — 95,500variable rate demand — 2003 Series B (Federally Taxable) 8,500 1,600 — 1,600 — Historic Front Street Housing Revenue Bondsvariable rate demand — 2003 Series A, maturing in 2036 46,300 46,300 — — 46,300The Helena Housing Revenue Bondsvariable rate demand — 2003 Series A, maturing in 2036 42,000 42,000 — — 42,000variable rate demand — 2004 Series A, maturing in 2036 101,000 101,000 — — 101,000
Original Face
Amount
Balance October 31,
2010
Issued
Balance October 31,
2011
Retired/Principal Payments
66

Avalon Chrystie Place I Housing Revenue Bondsvariable rate demand — 2004 Series A, maturing in 2036 58,500 58,500 — — 58,500variable rate demand — 2004 Series B, maturing in 2036 58,500 58,500 — — 58,500Related‐Tribeca Green Housing Revenue Bondsvariable rate demand — 2003 Series A, maturing in 2036 109,200 103,800 — — 103,800variable rate demand — 2003 Series B (Federally Taxable), maturing in 2036 800 800 — — 800100 Maiden Lane Housing Revenue Bondsvariable rate demand — 2004 Series A, maturing in 2037 95,000 95,000 — — 95,000variable rate demand — 2004 Series B (Federally Taxable), maturing in 2037 3,000 3,000 — — 3,000North End Avenue Housing Revenue Bondsvariable rate demand — 2004 Series A, maturing in 2036 98,800 98,800 — — 98,800variable rate demand — 2004 Series B (Federally Taxable), maturing in 2036 3,400 3,400 — — 3,400Sea Park East Housing Revenue Bondsvariable rate demand — 2004 Series A, maturing in 2036 18,700 15,700 — 600 15,100Sea Park West Housing Revenue Bondsvariable rate demand — 2004 Series A, maturing in 2036 22,900 18,400 — 900 17,500Archstone Westbury Housing Revenue Bonds
Original Face
Amount
Balance October 31,
2010
Issued
Balance October 31,
2011
Retired/Principal Payments
Archstone Westbury Housing Revenue Bondsvariable rate demand — 2004 Series A, maturing in 2036 62,200 62,200 — — 62,200variable rate demand — 2004 Series B (Federally Taxable), maturing in 2036 15,800 15,800 — — 15,800Rip Van Winkle House Housing Revenue Bondsvariable rate demand — 2004 Series A, maturing in 2034 11,500 10,700 — — 10,70010 Barclay Street Housing Revenue Bondsvariable rate demand — 2004 Series A, maturing in 2037 135,000 135,000 — — 135,000Reverend Polite Avenue Apartments Housing Revenue Bondsvariable rate demand — 2005 Series A, maturing in 2036 16,000 7,435 — — 7,435125 West 31st Street Housing Revenue Bondsvariable rate demand — 2005 Series A, maturing in 2038 176,800 176,800 — — 176,800Clinton Green North Housing Revenue Bondsvariable rate demand — 2005 Series A, maturing in 2038 100,000 100,000 — — 100,000variable rate demand — 2006 Series A, maturing in 2038 47,000 47,000 — — 47,000Clinton Green South Housing Revenue Bondsvariable rate demand — 2005 Series A, maturing in 2038 75,000 75,000 — — 75,000variable rate demand — 2006 Series A, maturing in 2038 46,500 46,500 — — 46,500Related‐Ocean Park Apartments Housing Revenue Bondsvariable rate demand — 2005 Series A, maturing in 2035 28,400 28,400 — — 28,400
Original Face
Amount
Balance October 31,
2010
Issued
Balance October 31,
2011
Retired/Principal Payments
67

2.20% to 4.25% — 2005 Series B, maturing in varying semi‐annual installments to 2016 10,600 6,785 — 935 5,850250 West 93rd Street Housing Revenue Bondsvariable rate demand — 2005 Series A, maturing in 2038 61,500 60,400 — — 60,400variable rate demand — 2005 Series B (Federally Taxable), maturing in 2038 5,300 5,300 — — 5,300variable rate demand — 2007 Series A (Federally Taxable), maturing in 2038 1,100 1,100 — — 1,100Tower 31 Housing Revenue Bondsvariable rate demand — 2005 Series A, maturing in 2036 83,800 83,800 — — 83,800variable rate demand — 2005 Series B (Federally Taxable), maturing in 2036 2,000 2,000 — — 2,000variable rate demand — 2006 Series A (Federally Taxable), maturing in 2036 8,000 5,200 — 900 4,30088 Leonard Street Housing Revenue Bondsvariable rate demand — 2005 Series A, maturing in 2037 112,500 112,500 — — 112,500variable rate demand — 2005 Series B (Federally Taxable), maturing in 2037 7,500 7,500 — — 7,500variable rate demand — 2007 Series A (Federally Taxable), maturing in 2037 12,000 12,000 — — 12,000Tiffany Gardens Multi‐Family Housing Revenue Bonds4.50% to 5.125% — 2005 Series A, maturing in varying semi‐annual installments to 2037 5,550 5,290 — 100 5,190Friendship House Apartments Multi Family
Original Face
Amount
Balance October 31,
2010
Issued
Balance October 31,
2011
Retired/Principal Payments
Friendship House Apartments Multi‐Family Housing Revenue Bonds5.10% — 2005 Series A, maturing in varying semi‐annual installments to 2041 2,840 2,720 — 40 2,68055 West 25th Street Housing Revenue Bondsvariable rate demand — 2005 Series A, maturing in 2038 164,500 164,500 — — 164,500variable rate demand — 2005 Series B (Federally Taxable), maturing in 2038 8,800 5,600 — 1,500 4,100188 Ludlow Street Housing Revenue Bondsvariable rate demand — 2006 Series A, maturing in 2038 83,000 83,000 — — 83,000Division Street Multi‐Family Housing Revenue Bonds5% to 5.10% — 2006 Series A, maturing in varying semi‐annual installments to 2038 1,525 1,470 — 30 1,440Gateway to New Cassel Housing Revenue Bondsvariable rate demand — 2006 Series A, maturing in 2039 9,500 6,000 — — 6,000Golden Age Apartments Multi‐Family Housing Revenue Bonds5% — 2006 Series A, maturing in varying semi‐annual installments to 2037 2,800 2,470 — 100 2,370Related ‐ Taconic West 17th Street Housing Revenue Bondsvariable rate demand — 2009 Series A, maturing in 2039 126,000 126,000 — — 126,000Crotona Estates Apartments Multi‐Family Housing Revenue Bonds4.95% — 2006 Series A, maturing in varying semi‐annual installments to 2038 2,760 2,550 — 90 2,460Related ‐ Capitol Green Apartments Housing Revenue Bondsvariable rate demand — 2006 Series A, maturing in 2036 10,900 10,900 — — 10,900
Original Face
Amount
Balance October 31,
2010
Issued
Balance October 31,
2011
Retired/Principal Payments
68
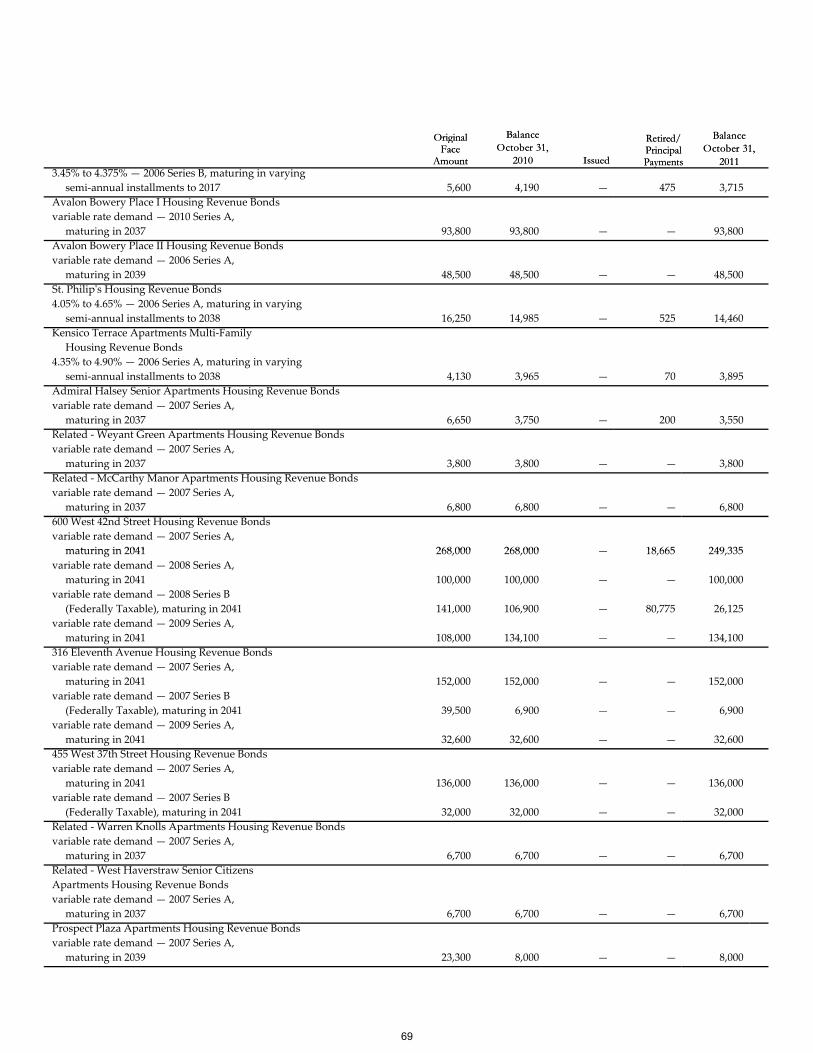
3.45% to 4.375% — 2006 Series B, maturing in varying semi‐annual installments to 2017 5,600 4,190 — 475 3,715Avalon Bowery Place I Housing Revenue Bondsvariable rate demand — 2010 Series A, maturing in 2037 93,800 93,800 — — 93,800Avalon Bowery Place II Housing Revenue Bondsvariable rate demand — 2006 Series A, maturing in 2039 48,500 48,500 — — 48,500St. Philipʹs Housing Revenue Bonds4.05% to 4.65% — 2006 Series A, maturing in varying semi‐annual installments to 2038 16,250 14,985 — 525 14,460Kensico Terrace Apartments Multi‐Family Housing Revenue Bonds4.35% to 4.90% — 2006 Series A, maturing in varying semi‐annual installments to 2038 4,130 3,965 — 70 3,895Admiral Halsey Senior Apartments Housing Revenue Bondsvariable rate demand — 2007 Series A, maturing in 2037 6,650 3,750 — 200 3,550Related ‐ Weyant Green Apartments Housing Revenue Bondsvariable rate demand — 2007 Series A, maturing in 2037 3,800 3,800 — — 3,800Related ‐ McCarthy Manor Apartments Housing Revenue Bondsvariable rate demand — 2007 Series A, maturing in 2037 6,800 6,800 — — 6,800600 West 42nd Street Housing Revenue Bondsvariable rate demand — 2007 Series A,
maturing in 2041 268 000 268 000 18 665 249 335
OriginalFace
Amount
Balance October 31,
2010
Issued
Balance October 31,
2011
Retired/Principal Payments
maturing in 2041 268,000 268,000 — 18,665 249,335variable rate demand — 2008 Series A, maturing in 2041 100,000 100,000 — — 100,000variable rate demand — 2008 Series B (Federally Taxable), maturing in 2041 141,000 106,900 — 80,775 26,125variable rate demand — 2009 Series A, maturing in 2041 108,000 134,100 — — 134,100316 Eleventh Avenue Housing Revenue Bondsvariable rate demand — 2007 Series A, maturing in 2041 152,000 152,000 — — 152,000variable rate demand — 2007 Series B (Federally Taxable), maturing in 2041 39,500 6,900 — — 6,900variable rate demand — 2009 Series A, maturing in 2041 32,600 32,600 — — 32,600455 West 37th Street Housing Revenue Bondsvariable rate demand — 2007 Series A, maturing in 2041 136,000 136,000 — — 136,000variable rate demand — 2007 Series B (Federally Taxable), maturing in 2041 32,000 32,000 — — 32,000Related ‐ Warren Knolls Apartments Housing Revenue Bondsvariable rate demand — 2007 Series A, maturing in 2037 6,700 6,700 — — 6,700Related ‐ West Haverstraw Senior CitizensApartments Housing Revenue Bondsvariable rate demand — 2007 Series A, maturing in 2037 6,700 6,700 — — 6,700Prospect Plaza Apartments Housing Revenue Bondsvariable rate demand — 2007 Series A, maturing in 2039 23,300 8,000 — — 8,000
OriginalFace
Amount
Balance October 31,
2010
Issued
Balance October 31,
2011
Retired/Principal Payments
69

Horizons at Wawayanda Housing Revenue Bonds5.15% — 2007 Series A, maturing in varying semi‐annual installments to 2040 8,600 8,520 — 105 8,415Park Drive Manor II Apartments Multi‐Family Housing Revenue Bonds 4.85% — 2007 Series A, maturing in varying semi‐annual installments to 2038 3,980 3,835 — 70 3,765Highland Avenue Senior Apartments Multi‐Family Housing Revenue Bonds 4.70% to 5% — 2007 Series A, maturing in varying semi‐annual installments to 2039 6,920 6,795 — 110 6,685North Street Y Senior Apartments Multi‐Family Housing Revenue Bonds 5.05% — 2007 Series A, maturing in varying semi‐annual installments to 2039 2,100 2,070 — 30 2,040Cannon Street Senior Apartments Multi‐Family Housing Revenue Bonds 5.30% — 2007 Series A, maturing in varying semi‐annual installments to 2039 1,860 1,820 — 30 1,790Related ‐ 42nd and 10th Housing Revenue Bondsvariable rate demand — 2007 Series A, maturing in 2041 166,100 166,100 — — 166,100variable rate demand — 2008 Series A, maturing in 2041 81,000 81,000 — — 81,000variable rate demand — 2010 Series A, maturing in 2041 102,900 102,900 — — 102,900Tri Senior Development Housing Revenue Bonds
OriginalFace
Amount
Balance October 31,
2010
Issued
Balance October 31,
2011
Retired/Principal Payments
Tri‐Senior Development Housing Revenue Bonds5.10% to 5.40% — 2007 Series A, maturing in varying semi‐annual installments to 2042 14,700 14,315 — 175 14,140Related ‐ Overlook Apartments Housing Revenue Bondsvariable rate demand — 2007 Series A, maturing in 2037 5,400 4,500 — — 4,500Remeeder Houses Apartments Housing Revenue Bondsvariable rate demand — 2007 Series A, maturing in 2039 18,900 18,400 — 400 18,000Grace Towers Housing Revenue Bondsvariable rate demand — 2007 Series A, maturing in 2040 19,900 15,800 — 4,270 11,530Baisley Park Gardens Housing Revenue Bondsvariable rate demand — 2008 Series A, maturing in 2039 18,800 18,800 — 200 18,600Related ‐ Caroline Apartments Housing Revenue Bondsvariable rate demand — 2008 Series A, maturing in 2043 16,900 16,900 — — 16,900West 37th Street Housing Revenue Bondsvariable rate demand — 2008 Series A, maturing in 2042 18,900 18,900 — — 18,900variable rate demand — 2008 Series B (Federally Taxable), maturing in 2042 31,500 19,500 — — 19,500variable rate demand — 2009 Series A, maturing in 2042 25,200 25,200 — — 25,200variable rate demand — 2009 Series B, maturing in 2042 30,900 30,900 — — 30,900West Village Apartments Housing Revenue Bondsvariable rate demand — 2008 Series A, maturing in 2039 9,700 7,600 — 300 7,300
OriginalFace
Amount
Balance October 31,
2010
Issued
Balance October 31,
2011
Retired/Principal Payments
70

330 Riverdale Avenue Apartments Housing Revenue Bondsvariable rate demand — 2008 Series A, maturing in 2041 28,700 28,700 — — 28,700320 West 38th Street Housing Revenue Bondsvariable rate demand — 2008 Series A, maturing in 2042 74,500 74,500 — — 74,500variable rate demand — 2009 Series A, maturing in 2042 119,500 119,500 — — 119,500variable rate demand — 2009 Series B, maturing in 2042 106,000 106,000 — — 106,000Shore Hill Housing Revenue Bondsvariable rate demand — 2008 Series A, maturing in 2045 39,000 19,500 — — 19,500505 West 37th Street Housing Revenue Bondsvariable rate demand — 2008 Series A, maturing in 2042 95,600 95,600 — — 95,600variable rate demand — 2008 Series B (Federally Taxable), maturing in 2042 138,000 62,000 — 3,600 58,400variable rate demand — 2009 Series A, maturing in 2042 100,800 100,800 — — 100,800variable rate demand — 2009 Series B, maturing in 2042 119,600 119,600 — — 119,600College Arms Apartments Housing Revenue Bondsvariable rate demand — 2008 Series A, maturing in 2048 11,390 11,290 — 100 11,19080 DeKalb Avenue Housing Revenue Bondsvariable rate demand 2008 Series A
OriginalFace
Amount
Balance October 31,
2010
Issued
Balance October 31,
2011
Retired/Principal Payments
variable rate demand — 2008 Series A, maturing in 2042 32,850 32,850 — 27,760 5,090variable rate demand — 2008 Series B (Federally Taxable) 27,500 5,240 — 5,240 — variable rate demand — 2009 Series A, maturing in 2042 43,800 43,800 — — 43,800variable rate demand — 2009 Series B, maturing in 2042 55,110 55,110 — — 55,110Related ‐ Clarkstown Maplewood Gardens Housing Revenue Bondsvariable rate demand — 2009 Series A, maturing in 2049 4,085 4,085 — — 4,0858 East 102nd Street Housing Revenue Bondsvariable rate demand — 2010 Series A, maturing in 2044 95,630 95,630 40,060 — 135,690variable rate demand — 2010 Series B (Federally Taxable), maturing in 2044 8,010 8,010 — — 8,010Hegeman Residence Apartments Housing Revenue Bondsvariable rate demand — 2010 Series A, maturing in 2040 22,800 22,800 — — 22,800330 West 39th Street Housing Revenue Bondsvariable rate demand — 2010 Series A, maturing in 2044 65,000 — 65,000 — 65,000Clinton Park Housing Revenue Bondsvariable rate demand — 2010 Series A, maturing in 2044 70,000 — 70,000 — 70,00025 Washington Street Housing Revenue Bondsvariable rate demand — 2010 Series A, maturing in 2044 19,700 — 19,700 — 19,700
OriginalFace
Amount
Balance October 31,
2010
Issued
Balance October 31,
2011
Retired/Principal Payments
71

29 Flatbush Avenue Housing Revenue Bondsvariable rate demand — 2010 Series A, maturing in 2044 90,000 — 90,000 — 90,0002180 Broadway Housing Revenue Bondsvariable rate demand — 2011 Series A, maturing in 2044 96,300 — 96,300 — 96,300variable rate demand — 2011 Series B (Federally Taxable), maturing in 2044 27,320 — 27,320 — 27,320Gotham West Housing Revenue Bondsvariable rate demand — 2011 Series A‐1, maturing in 2045 133,000 — 133,000 — 133,000variable rate demand — 2011 Series A‐2, maturing in 2045 67,000 — 67,000 — 67,000variable rate demand — 2011 Series B (Federally Taxable), maturing in 2045 20,000 — 20,000 — 20,000Total Secured Loan Rental Housing Bonds and Other 8,880,325 7,772,580 628,380 183,410 8,217,550Housing Project Mortgage Revenue Bonds:3.60% to 6.125% — 1996 Series A Refunding, maturing in varying semi‐annual installments to 2020 484,540 14,220 — 1,340 12,880Affordable Housing Bonds:Affordable Housing Revenue Bonds3.65% to 5.25% — 2007 Series A, maturing in varying semi‐annual installments to 2038 11,805 9,300 — 155 9,1453.60% to 5.45% — 2007 Series B, maturing in varying semi‐annual installments to 2045 81,570 36,405 — 365 36,0402.375% to 5.45% — 2008 Series A,
t i i i i l i t ll t t 2040 14 880 11 065 4 665 6 400
OriginalFace
Amount
Balance October 31,
2010
Issued
Balance October 31,
2011
Retired/Principal Payments
maturing in varying semi‐annual installments to 2040 14,880 11,065 — 4,665 6,4003.30% to 5.00% — 2008 Series B, maturing in varying semi‐annual installments to 2045 23,000 13,455 — 745 12,7105.00% — 2008 Series C, maturing in varying semi‐annual installments to 2045 15,515 14,545 — 805 13,7402.15% to 6.80% — 2008 Series D, maturing in varying semi‐annual installments to 2041 53,740 37,745 — 21,490 16,2551.80% to 5.25% — 2009 Series A, maturing in varying semi‐annual installments to 2041 53,680 53,680 — 7,755 45,9250.70% to 5.00% — 2009 Series B, maturing in varying semi‐annual installments to 2045 80,525 80,430 — 6,295 74,1351.10% to 4.95% — 2009 Series C, maturing in varying semi‐annual installments to 2041 35,590 35,590 — 17,905 17,6850.45% to 5.20% — 2009 Series D, maturing in varying semi‐annual installments to 2045 70,795 70,620 — 8,075 62,5450.50% to 5.00% — 2010 Series A, maturing in varying semi‐annual installments to 2042 45,800 45,800 — 410 45,3900.40% to 4.875% — 2010 Series B, maturing in varying semi‐annual installments to 2042 24,600 24,600 — 120 24,4802.625% to 5.25% — 2010 Series C, maturing in varying semi‐annual installments to 2042 3,140 — 3,140 50 3,0901.05% — 2011 Series A, maturing in 2013 9,800 — 9,800 — 9,8000.55% to 5.20% — 2011 Series B, maturing in varying semi‐annual installments to 2042 16,545 — 16,545 — 16,5450.95% — 2011 Series C, maturing in 2013 6,800 — 6,800 — 6,8000.55% to 4.875% — 2011 Series D, maturing in varying semi‐annual installments to 2042 14,630 — 14,630 — 14,630
562,415 433,235 50,915 68,835 415,315
OriginalFace
Amount
Balance October 31,
2010
Issued
Balance October 31,
2011
Retired/Principal Payments
72

Affordable Housing Revenue Bonds (Federal New Issue Bond Program ʺNIBPʺ)
* 2009 Series 1 (Federally Taxable) maturing in 2051 228,470 228,470 — 92,100 136,370 *Conversions:3.16% — 2009 Series 1, Subseries A, conversion: maturing in varying annual installments to 2043 47,660 47,660 — 465 47,1953.16% — 2009 Series 1, Subseries B, conversion: maturing in 2043 45,080 — 45,080 — 45,0803.68% — 2009 Series 1, Subseries C, conversion: maturing in 2044 24,760 — 24,760 — 24,7602.47% — 2009 Series 1, Subseries D, conversion: maturing in varying semi‐annual installments to 2043 22,260 — 22,260 — 22,260New Issues:0.50% to 1.375% — 2010 Series 1, maturing in varying semi‐annual installments to 2013 32,135 32,135 — 310 31,8251.25% to 1.95% — 2010 Series 2, maturing in varying annual installments to 2014 30,460 — 30,460 — 30,4601.85% — 2011 Series 1, maturing in 2015 29,000 — 29,000 — 29,0000.55% to 3.80% — 2011 Series 2, maturing in varying semi‐annual installments to 2022 16,470 — 16,470 — 16,470
*
476,295 308,265 168,030 92,875 383,420
The original face amount of the 2009 Series 1 bonds issued and placed in escrow was $276,130,000. Portions of this issuance in the amount of $139,760,000 wereconverted to bear interest at rates ranging from 2.47% to 3.68%. The amount of $136,370,000 remains outstanding as of 10/31/11.
OriginalFace
Amount
Balance October 31,
2010
Issued
Balance October 31,
2011
Retired/Principal Payments
Total Affordable Housing Bonds 1,038,710 741,500 218,945 161,710 798,735State Revenue Bond Programs:Service Contract Revenue Bondsvariable rate demand — 2003 Series I Refunding 81,100 81,100 — 81,100 — maturing in varying semi‐annual installments to 2031variable rate demand — 2003 Series J Refunding, (Federally Taxable) maturing in varying semi‐annual installments to 2011 34,100 2,600 — 2,600 — 4% to 5% — 2003 Series K Refunding, maturing in varying semi‐annual installments to 2021 60,290 13,070 — 5,925 7,145variable rate demand — 2003 Series L Refunding, maturing in varying semi‐annual installments to 2021 88,750 88,750 — — 88,750variable rate demand — 2003 Series M‐1 Refunding, maturing in varying semi‐annual installments to 2021 63,750 63,750 — — 63,750variable rate demand — 2003 Series M‐2 Refunding, maturing in varying semi‐annual installments to 2021 25,000 25,000 — — 25,000
352,990 274,270 — 89,625 184,645Consolidated Service Contract Revenue Bonds2% to 5% — 2011 Series A Refunding, maturing in varying semi‐annual installments to 2020 71,165 — 71,165 — 71,165State Personal Income Tax Revenue Bonds (Economic Development and Housing)5% to 5.25% — 2003 Series A, maturing in varying semi‐annual installments to 2033 128,330 19,625 — — 19,6251.37% to 4.46% — 2003 Series B (Federally Taxable), maturing in varying semi‐annual installments to 2013 101,690 28,855 — 11,180 17,6754.60% to 5.25% — 2004 Series A, maturing in varying semi‐annual installments to 2034 54,085 41,035 — — 41,0351.35% to 4.79% — 2004 Series B (Federally Taxable), maturing in varying semi‐annual installments to 2014 56,655 25,115 — 5,875 19,2404% to 5% — 2005 Series A, maturing in varying semi‐annual installments to 2034 57,215 57,215 — — 57,215
OriginalFace
Amount
Balance October 31,
2010
Issued
Balance October 31,
2011
Retired/Principal Payments
73

3.58% to 4.88% — 2005 Series B (Federally Taxable), maturing in varying annual installments to 2015 34,985 19,375 — 3,530 15,845variable rate demand — 2005 Series C, maturing in varying semi‐annual installments to 2033 80,000 80,000 — — 80,0003.75% to 5% — 2006 Series A, maturing in varying semi‐annual installments to 2036 47,525 47,525 — — 47,5255.04% to 5.22% — 2006 Series B (Federally Taxable), maturing in varying annual installments to 2015 83,435 47,085 — 8,460 38,6253.625% to 5% — 2006 Series C, maturing in varying semi‐annual installments to 2019 31,945 31,945 — — 31,9455% — 2007 Series A, maturing in varying semi‐annual installments to 2037 71,075 71,075 — — 71,0754.957% to 5.167% — 2007 Series B (Federally Taxable), maturing in varying annual installments to 2016 45,695 30,035 — 4,395 25,6404% to 5% — 2007 Series C (Federally Taxable), maturing in varying semi‐annual installments to 2021 19,220 19,220 — — 19,2204% to 5% — 2008 Series A, maturing in varying annual installments to 2038 109,885 109,885 — — 109,8853.05% to 5.35% — 2008 Series B (Federally Taxable), maturing in varying annual installments to 2017 40,115 29,545 — 3,635 25,9101.75% to 5% — 2009 Series A, maturing in varying annual installments to 2039 96,990 95,725 — 1,825 93,9001.943% to 4.911% — 2009 Series B (Federally Taxable), maturing in varying annual installments to 2019 103,010 97,275 — 9,525 87,750
1,161,855 850,535 — 48,425 802,110Total State Revenue Bond Programs 1,586,010 1,124,805 71,165 138,050 1,057,920H it l d H lth C P j t R B d
OriginalFace
Amount
Balance October 31,
2010
Issued
Balance October 31,
2011
Retired/Principal Payments
Hospital and Health Care Project Revenue Bonds3.60% to 5.15% — 1998 Series A, maturing in varying annual installments to 2016 42,090 315 — 145 170Nursing Home and Health Care Project Revenue Bonds3.60% to 5.15% — 1998 Series A, maturing in varying annual installments to 2016 190,080 41,855 — 15,620 26,235Total Bond Indebtedness 12,420,805 9,722,370 918,490 504,415 10,136,445Bond Premium — 14,945 5,776 1,674 19,047Bond Discount — (324) — (64) (260)Deferred gain (loss) on bonds defeased — 508 — (144) 652Total Net Bond Indebtedness $ 12,420,805 9,737,499 924,266 505,881 10,155,884
OriginalFace
Amount
Balance October 31,
2010
Issued
Balance October 31,
2011
Retired/Principal Payments
74
Top Related